Abstract
Miscanthus (giganteus) is a relatively new energy crop. Its mechanical properties are important for the design and modification of harvesting and processing machines or equipment. The cutting strength is critical to improve the field performance of mowing and other cutting mechanisms. The effects of the cutting blade type, sample supporting method, and sample locations (upper or lower) where it was taken from a single plant stem on the cutting force and energy were studied. A serrated cutting blade and a flat blade were selected to cut Miscanthus samples at the node and internode using a high-speed impact tester. The cutting force, sample diameter, and cutting speed were recorded. The specific cutting force and energy were then calculated based on the cross-sectional area of the stem sample. The average diameter of the Miscanthus samples used for this study was 9.5 mm. The blade cutting speeds for all treatments were ranged from 8.2 ms−1 to 11.3 ms−1. Overall, the maximum specific cutting force and energy of the flat blade were found at the upper portion of a plant stem, which was 441 N cm−2 and 8.3 J cm−2 at the node when one side of the stem sample was fixed, and 469 N cm−2 and 12.1 J cm−2 at the internode if both sides of the sample were fixed. The cutting strengths at the node and internode were significantly different no matter at the upper portion or lower portion of the plant. When using the serrated blade, the maximum specific cutting force was also found at the upper node section with a value of 511 N cm−2 and 437 N cm−2 for one-side fixed and two-side fixed, respectively. Meanwhile, the corresponding maximum specific cutting energies for these two cases were 10.5 J cm−2 and 10.3 J cm−2, respectively. Statistical analysis showed that the blade types and stem sample locations significantly affected the specific cutting force and energy with a 95% confidence level. The sample support methods did not make significant differences when comparing the specific cutting force and energy; but the actual cutting force and energy were significantly different.
1. Introduction
As defined by the US Department of Energy, dedicated energy crops are non-food crops that can be grown on marginal land specifically to provide biomass, and Miscanthus (giganteus) is one of them [1] Energy crops and production have been studied for years (e.g., [2]). Miscanthus can produce high yield of biomass. It can be harvested using forage harvesters or hay mowing/baling machine systems (e.g., [3]). As a new energy crop, Miscanthus needs to be well understood [4]. Energy consumption and the power requirement for harvesting and processing Miscanthus have been interesting research topics. The mechanical properties of energy crops play a very important role in the areas of harvesting and processing machine design and tests. Not only machine design or test engineers but also plant scientists are interested in the mechanical properties of plants [5], such as stem bending behaviors [6]. Field harvesting studies on Miscanthus harvesting have been conducted by many researchers (e.g., [7,8]). Gan et al. [7] investigated the power consumption of Miscanthus harvesting using a rotary mower-conditioner with straight, angled, and serrated blade types. It was concluded that the blade type had a significant effect on the power consumption of harvesting equipment. Beyond mechanical properties, crop yield was the most important factor affecting power consumption [9].
The Miscanthus plant stem has much higher rigidity compared to other traditional agricultural crops. Thus, it is facing challenges with efficient harvesting and processing operations due to its mechanical properties such as baling processes [10] and the conditioning process [11]. Examining the mechanical and physical properties of energy crops will help in the selection and modification of harvesting and processing machines for Miscanthus. Harvesting Miscanthus is challenging compared to hay and forage crops because of the stiffness and rigidity of its stem. Energy crop production for the biofuel has led researchers to review the energy efficiency of available traditional hay and forage machinery [12]. Researchers [13] indicated that current harvesting machinery requires redesign to handle the high yields of energy crops. Thus, it is important to understand the harvesting process of energy crops, especially Miscanthus, for the large-scale production of energy crops and sustainable development of the bioenergy industry. Overall, traditional hay and forage harvesting equipment needs to be modified to handle the high density and rigid structure of the Miscanthus crop [14]. There have been a few dynamic and static laboratory cutting studies on Miscanthus to investigate the effects of cutting blade types and cutting speed on cutting force and energy. Previous studies indicated that it is important to study static and dynamic cutting processes to evaluate traditional harvesting and size reduction equipment [12]. Based on the specific cutting force and cutting energy, the power and energy of cutting crops can be calculated [12,15]. Due to the difficulty of conducting dynamic cutting tests, researchers have tried several ways to test dynamic cutting properties. A rotating disc equipped with cutting blades and a torque sensor on its drive shaft was used to measure the cutting force [12,16,17].
Researchers [18] conducted a static cutting test on a single Miscanthus stem to evaluate flat and serrated flat blades and collected cutting force and energy data. All Miscanthus samples used in their static tests were taken from lower internode sections of the plant. The cutting speed of the blades was 1.67 mm s−1. They found that a flat blade required more force and energy to cut a single Miscanthus stem than a serrated blade. The average peak cutting force for the flat blade was 947 N, and the average cutting energy was 4.6 J. The average peak cutting force for the serrated blade was 615.3 N, while the average cutting energy was 3.6 J. The cross-sectional area of the plant sample was used to calculate the specific cutting force and energy. The same specific cutting force and energy calculations were also used in Kenaf stem cutting tests, where static and dynamic cutting properties were studied [16]. A rotational disc with two blades were used and a torque sensor mounted on the shaft was used to measure the cutting force. Blades with different edge angles were used and the rational speed was adjusted through changing the rotational speed. The linear velocity of the cutting blade was ranged from 5.3 to 14.2 m s−1. They concluded that the edge angle with 20–30° was the best considering both the minimal cutting force and durability of the blade.
Other researchers investigated the effect of the cutting speed, blade mounting method, and cutting blade type on the energy consumption of Miscanthus harvesting using a single disk cutter head platform [17]. The drive shaft of this rotational cutter head was equipped with a torque sensor to measure the cutting force. Three different oblique angle blades (0°, 30°, 40°) and two mounting methods of blades, fixed and flexible, were tested at three cutting speeds, 31.5, 47.3, and 63.0 m s−1. The lowest average specific energy consumption was 9.1 MJ ha−1 when using a 40° oblique angle blade. Blades with an oblique angle of 30° and 0° resulted in an average energy consumption of 16.9 MJ ha−1 and 23.1 MJ ha−1.
Johnson [12] conducted a study where they measured the dynamic cutting energy of a single Miscanthus stem with three different blades (0°, 30°, and 60° oblique angles) at a cutting speed ranging from 10 (low) to 20 (high) m s−1. The study showed that the energy required to cut a Miscanthus stem depends on the blade type. The lowest specific cutting energy was 8.4 MJ ha−1 for the 0° oblique angle flat blade at low speed, while the highest specific cutting energy was 10 MJ ha−1 for the same blade at the speed of 16.6 m s−1. However, no statistical analysis results were found in the literature to justify the significance of their results. It was also found that the cutting energy in the node and internode sections was directly proportional to the cutting speed and stem diameter. Both Johnson [12] and Manghan [17] calculated the specific cutting energy using the maximum cutting energy divided by the cross-sectional area of the crop.
Previous studies were all conducted by using a torque senser mounted on the drive shaft of the cutting blades to collect torque data and then convert the torque into the cutting force. Research results on the dynamic cutting properties for both the lower portion and upper portion of a Miscanthus plant stem were not found. A load cell mounted on the cutting blade was used to measure the cutting force in this study. The goal of this research was to examine the dynamic interactions between a cutting blade and Miscanthus stem in the transverse direction. The specific objectives were (1) to measure the cutting force and energy at the node and internode for the lower and upper portion of a Miscanthus plant; (2) to examine the effect of the cutting blade type and plant sample support methods on the cutting force and energy at high-speed cutting.
2. Materials and Methods
Cutting tests were conducted in a laboratory using a high-speed impact tester. The Miscanthus samples used for all experiments were collected from a 0.8 ha experimental Miscanthus field on the Pennsylvania State University land located in Philipsburg, PA. Samples were collected from the field in March 2019 from five random locations in the field. At every location, all plants from one square meter area were cut from the bottom and collected. In total, 8.7 kg of 277 Miscanthus plant samples from five locations was collected. Then, the collected samples were measured and separately bundled up by each area collected. Based on all the collected samples, the average growing density of crops was 55 plants per square meter. The average height of the Miscanthus plants was 2.4 m. All the collected samples were immediately transported to the indoor laboratory on the campus and stored in a cold storage (frozen, −20 °C) facility.
2.1. Test Device and Measurements
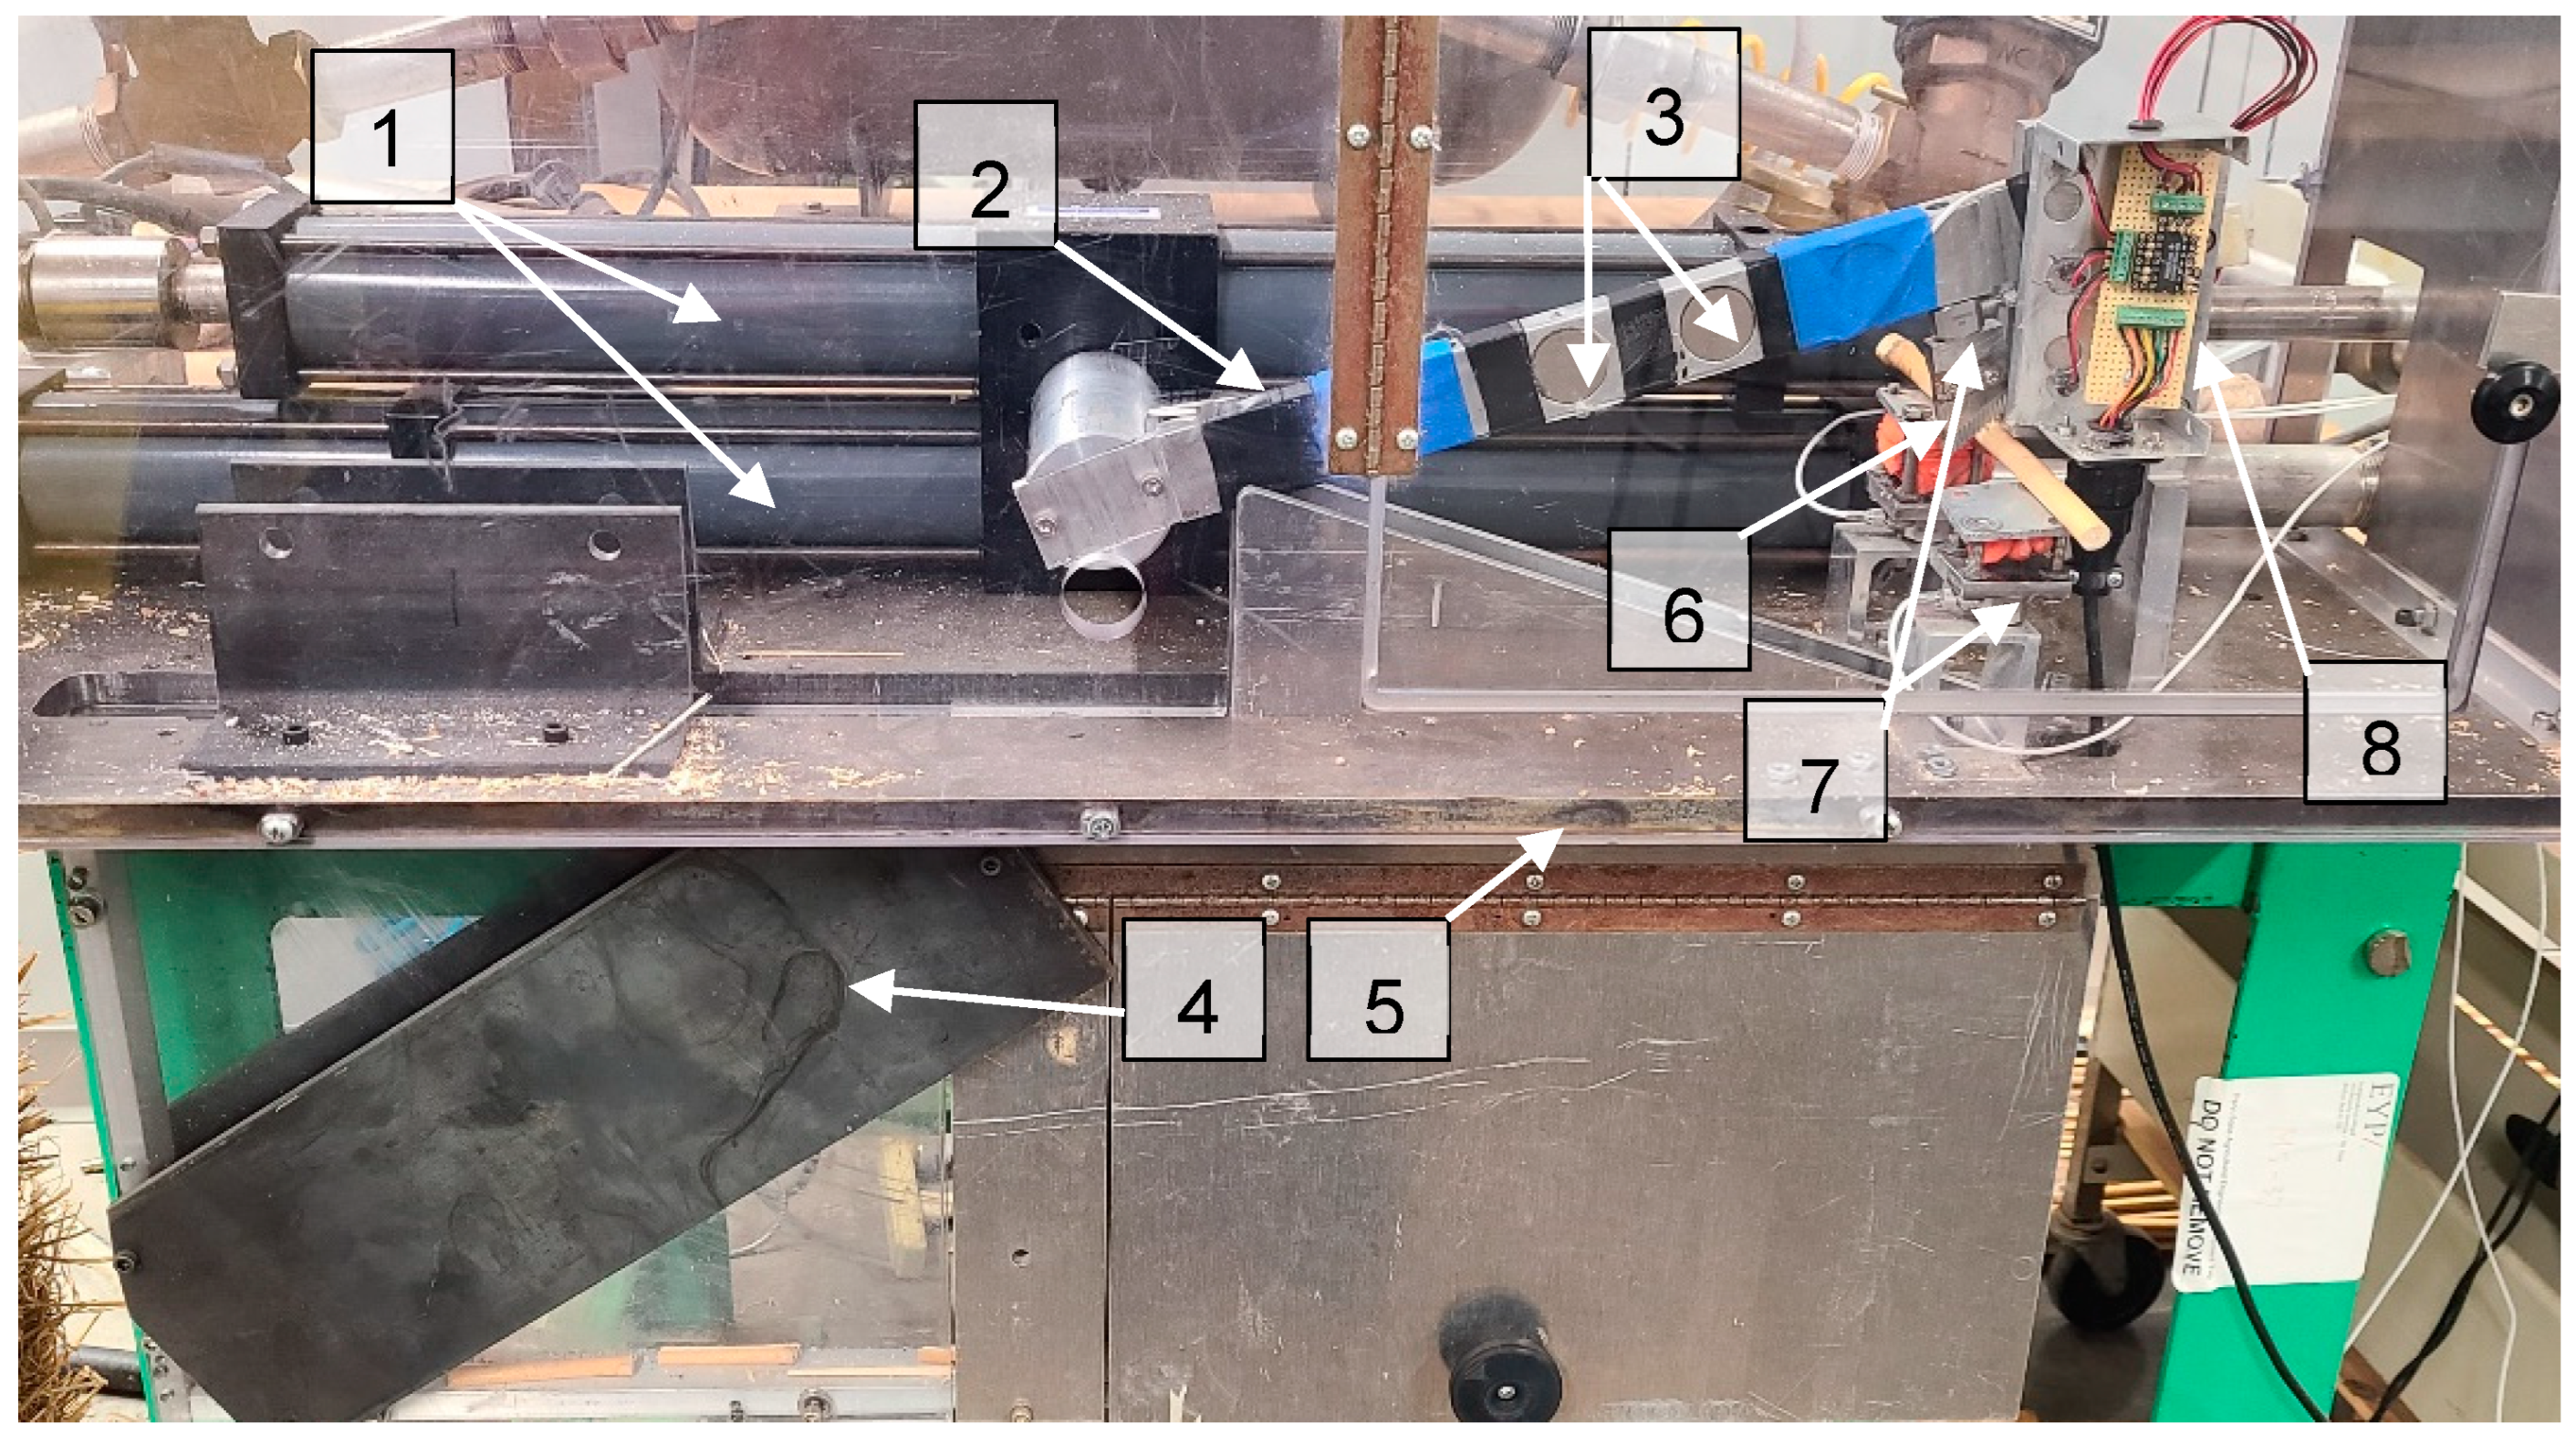
A high-speed impact tester was used in this study. It is in the department of Agricultural and Biological Engineering at the Pennsylvania State University and provided by the Idaho National Laboratory. It could be used to measure the dynamic shearing strength, power, and energy required to break a biomass sample. This device was used in this study to measure the cutting force. The front view of the high-speed impact tester is shown in Figure 1. The high-speed impact tester had a pneumatically accelerated swing arm (2) using pressurized air supply. The swing arm was made of aluminum and propelled by a rotary actuator to reduce the momentum. Its start point was a vertical position, and the structure allows it to spin near to a full 360° turn. The cutting mechanism was enclosed within a high strength acrylic glass cover for the purpose of safety. The pressurized air is accumulated in an air tank with a capacity of 40 psi, which was supplied with the compressed air pipeline system in the building. Different types of impact and cutting tools can be mounted on the swing arm for different studies. There are three magnets (3) embedded in the arm which help to slow down after a cutting trial.

Figure 1.
The high-speed impact tester used in the experiment. (1) Pneumatic cylinders to drive the swing arm; (2) swing arm; (3) magnets to decelerate and stop the swing arm when passing the metal plates (4) and (5); (6) cutting blade; (7) load cells; (8) optical speed sensors.
The cutting force was measured with a dynamic loadcell (7), which was a piezoelectric low impendence loadcell (Kistler series 9712B, Kistler Instrument Corp., Amherst, NY, USA). This loadcell and needed data logger (Kistler LabAmp Type 5165A, Kistler Instrument Corp., Amherst, NY, USA) were purchased and used to measure the cutting forces for this study. This type of loadcell was developed to measure the force where dynamic events are involved. The measuring range is from 22.2 N to 22241.1 N. The manufacturer’s calibration and sensitivities data were used in the experiments. The loadcell was mounted between the swing arm and the cutting blade (6). The loadcell was connected to the Kistler data logger to acquire data at a sampling rate of 200 k samples per second. The loadcell had a sensitivity of 0.248 mv N−1. The manufacturer also provided an online program to collect and store data directly to a personal computer in an MS Excel format, and the program can convert impact signals to force (N or lbf). Optical sensors (8) were installed to measure the linear cutting speed of the cutting blade. Details will be described later.
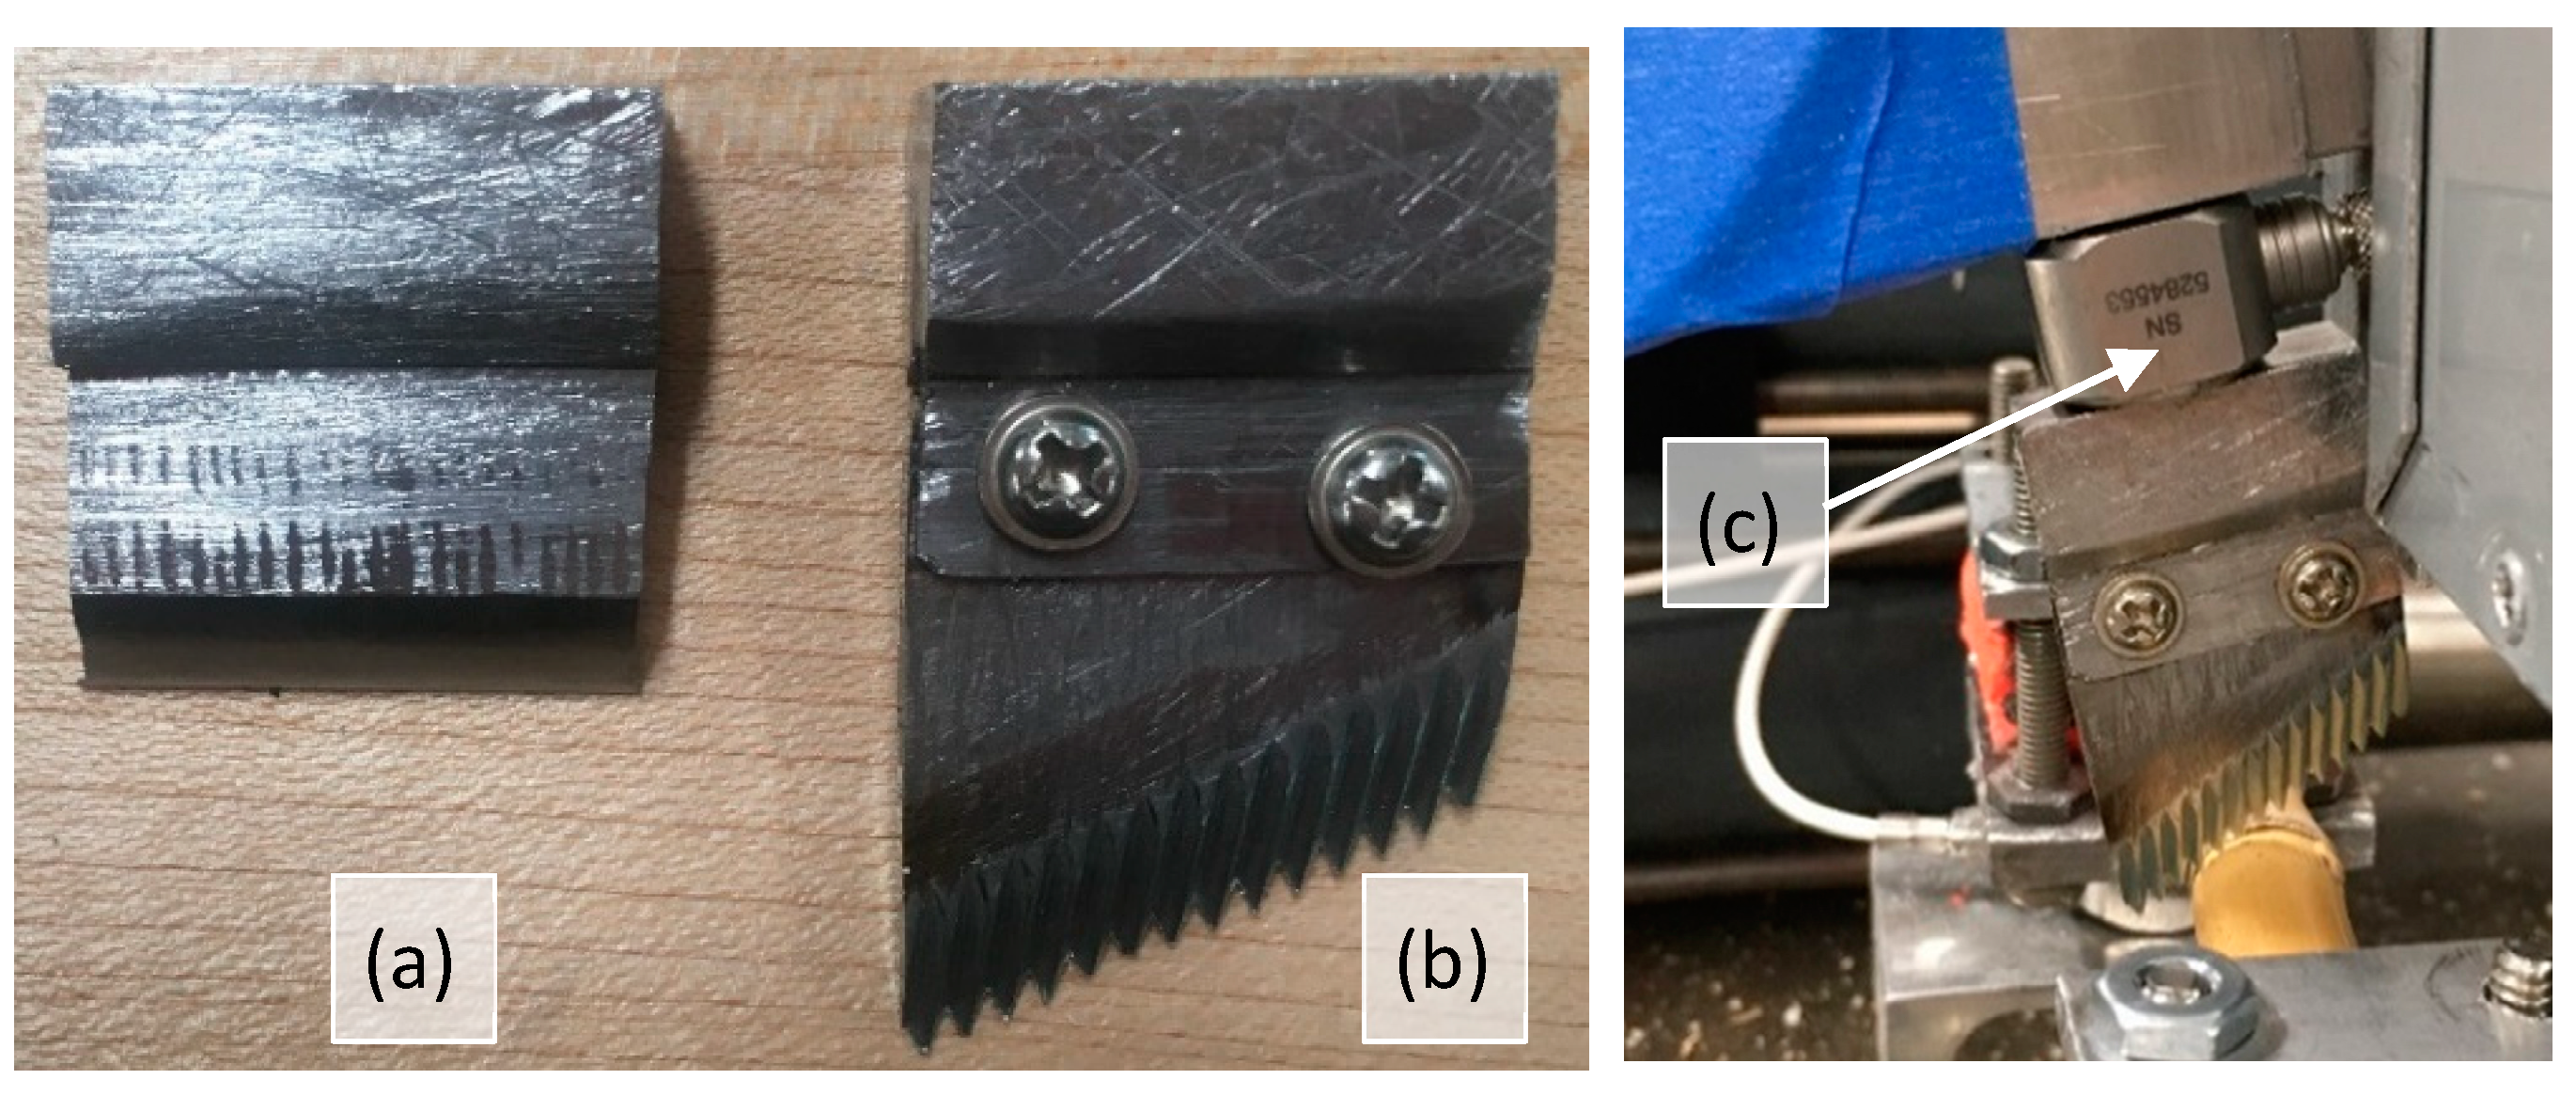
Two cutting blades, flat and serrated, were used in this study (Figure 2a,b). A loadcell was mounted between the cutting blade and the swing arm (Figure 2c). The apparatus has limited space when attaching a cutting tool. Thus, the size of the blade should be reduced. In addition, to reduce the effect of the blade momentum on the cutting force, the blade was minimized. The serrated blade was modified from a commercial blade to mount the loadcell and fit the limited space in the device.

Figure 2.
Flat (a) and serrated (b) blades and loadcell (c) mounted on the swing arm.
The cutting speed of the blade was measured using a “time of the flight” sensor, which was installed beside the plant sample and on the pass when cutting the blade (Figure 3A). The sensor has three pairs of emitter–receiver diodes that are lined up in the same distance (Figure 3B). The signal between the emitter and receiver breaks when the swing arm travels through the emitter–receiver pathway. Thus, the time passed from the first pair to the second, and the third pair was recorded at 100,000 samples per second. The cutting time was recorded by the data logger (Graphtec GL-980, DATAQ Instruments, Akron, OH, USA), which also allows to collect data in an Excel format. The cutting speed was calculated using the fixed distance and the recorded time.
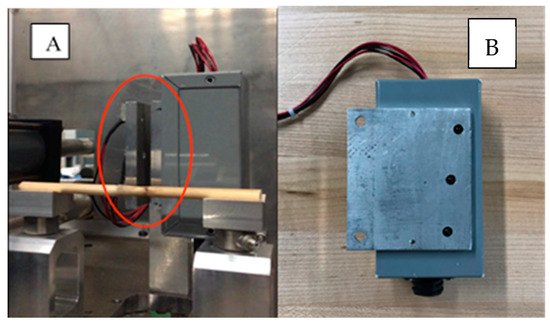
Figure 3.
The speed sensor used on the test device (A) installed front view; (B) side view.
2.2. Sample Support Methods
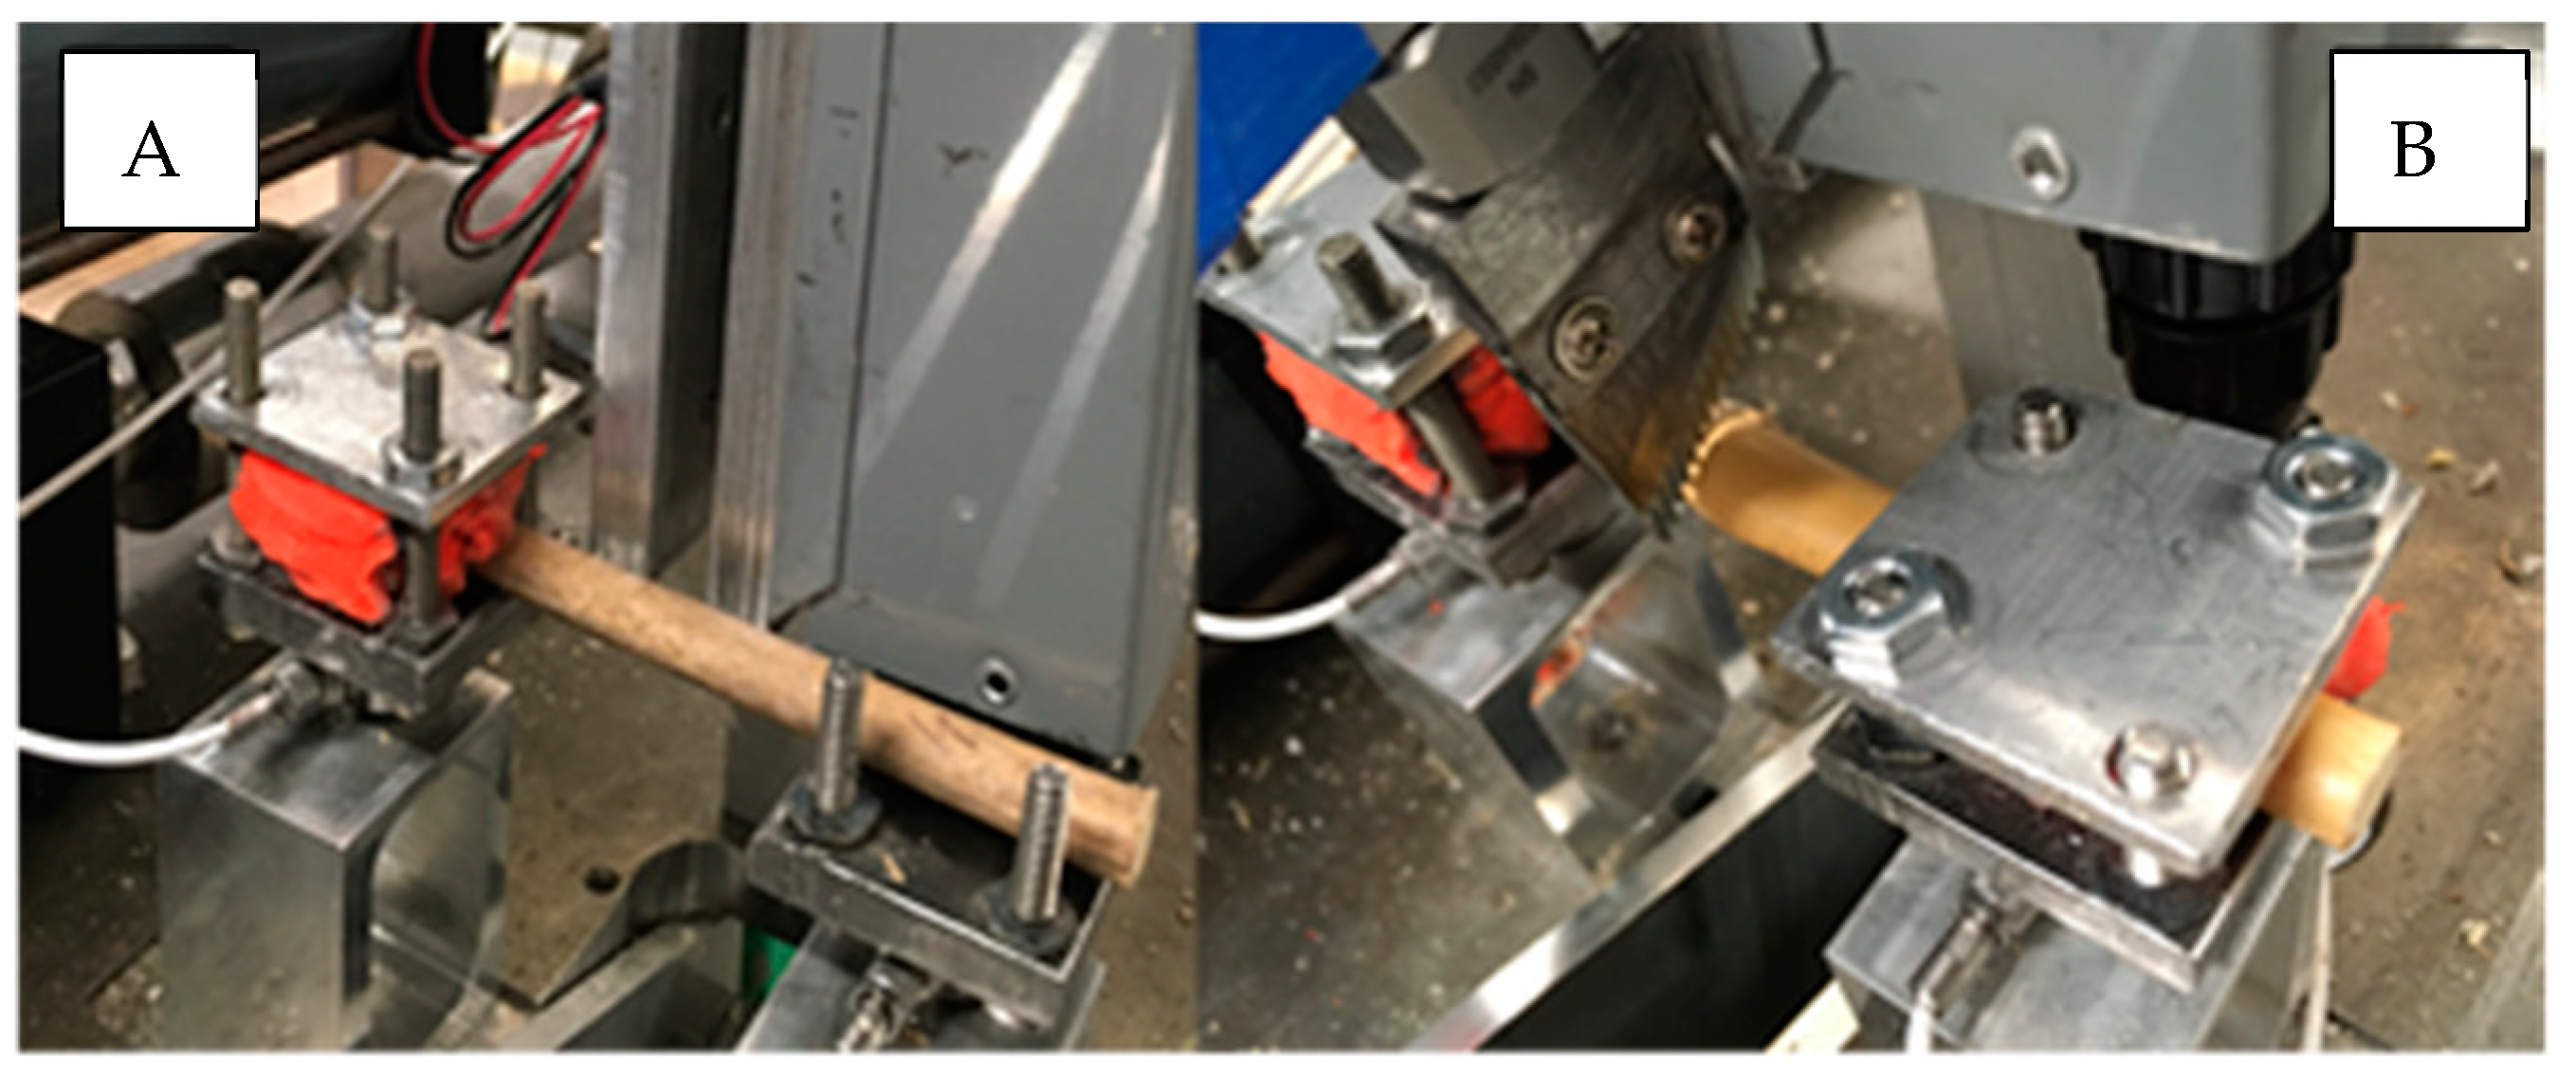
Plant such as hay and forage samples can be cut under three different supporting methods, i.e., unsupported, one-side supported, and two-side supported [12]. Srivastava et al. [19] indicated that unsupported cutting requires 60–80 m s−1 cutting speed where cutting is achieved by the inertia of the crop. This speed cannot be safely achieved with this device. In addition, the unsupported method does not reflect cutting processes in harvesting machines such as a disc mower and baling equipment. Thus, only two sample supporting methods, one-side fixed and two-side fixed supported methods, were used in this experimental study (Figure 4). The one-side fixed support was to simulate cutting conditions when using a disc cutting equipment to mow the crop, while the two-side fixed support was to simulate other cutting situations such as the cuter head of a baler.
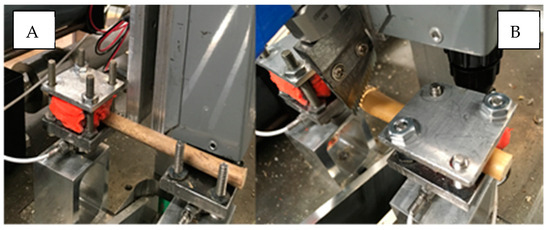
Figure 4.
(A) One-side fixed sample support; (B) two-side fixed sample support.
2.3. Sample Preparation and Experimental Treatments
All samples for each group of tests were randomly selected from field plant samples stored in the cold storage. Test samples were collected from the storage 24 h ahead of time for thawing in an air-conditioned lab space. Then, each Miscanthus plant was cut into 13–15 cm long sections. The plant samples for testing included two groups: samples collected from the lower portion of the plant (near the ground) and samples from the upper portion of the plant (around 1.5 m of the plant height). Each group of samples included internode and node samples. The node samples were those sections where the node was in the middle of the section, whereas the internode samples were the middle section between two nodes. Thus, there were four sample groups: the lower internode (LI), lower node (LN), upper internode (UI), and upper node (UN). Plus, there were two different cutting blades and two sample support methods, and there were six experimental treatments. Each treatment was repeated three times, and each replicate contained 25 samples. There were 450 tests in total in this study. Plant sample diameters were measured before each test trial. Samples were collected immediately after tests for moisture content measurement.
2.4. Data Processing and Analysis Method
Plant cutting energy was calculated using the following Equation (1), while the cutting power was calculated using Equation (2) [20]. The peak cutting force and linear cutting speed were obtained from loadcells and speed sensors.
where
- E—the energy required to cut a single stem Miscanthus, J
- Pc—power used during the cutting of a single Miscanthus stem, W
- t—cutting duration of the cutting pulse, s
- Fpeak—peak cutting force, N
- Vc—linear cutting velocity, m/s
For the purpose of comparison, the specific cutting force and energy were calculated. The specific cutting force/energy was defined as the cutting force/energy per cut area [15]. In this study, the specific cutting force and energy were calculated using the maximum cutting force and energy divided by the cut area, which is the cross-sectional area of the stem being cut. The collected data were analyzed using one-way ANOVA and t-tests provided in Minitab (Version 21.1.0, Minitab LLC, State College, PA, USA) at a 95% confidence level.
3. Results and Discussion
The average moisture content of the Miscanthus samples after cutting tests was in the range of 10–12% (w.b.). The average diameter of the used stem specimens was between 8 and 12 mm, and the average cutting speed was 10.8 m s−1 with a range of 8.2 m s−1 to 11.3 m s−1. Details are presented in the data tables below.
3.1. General Observations
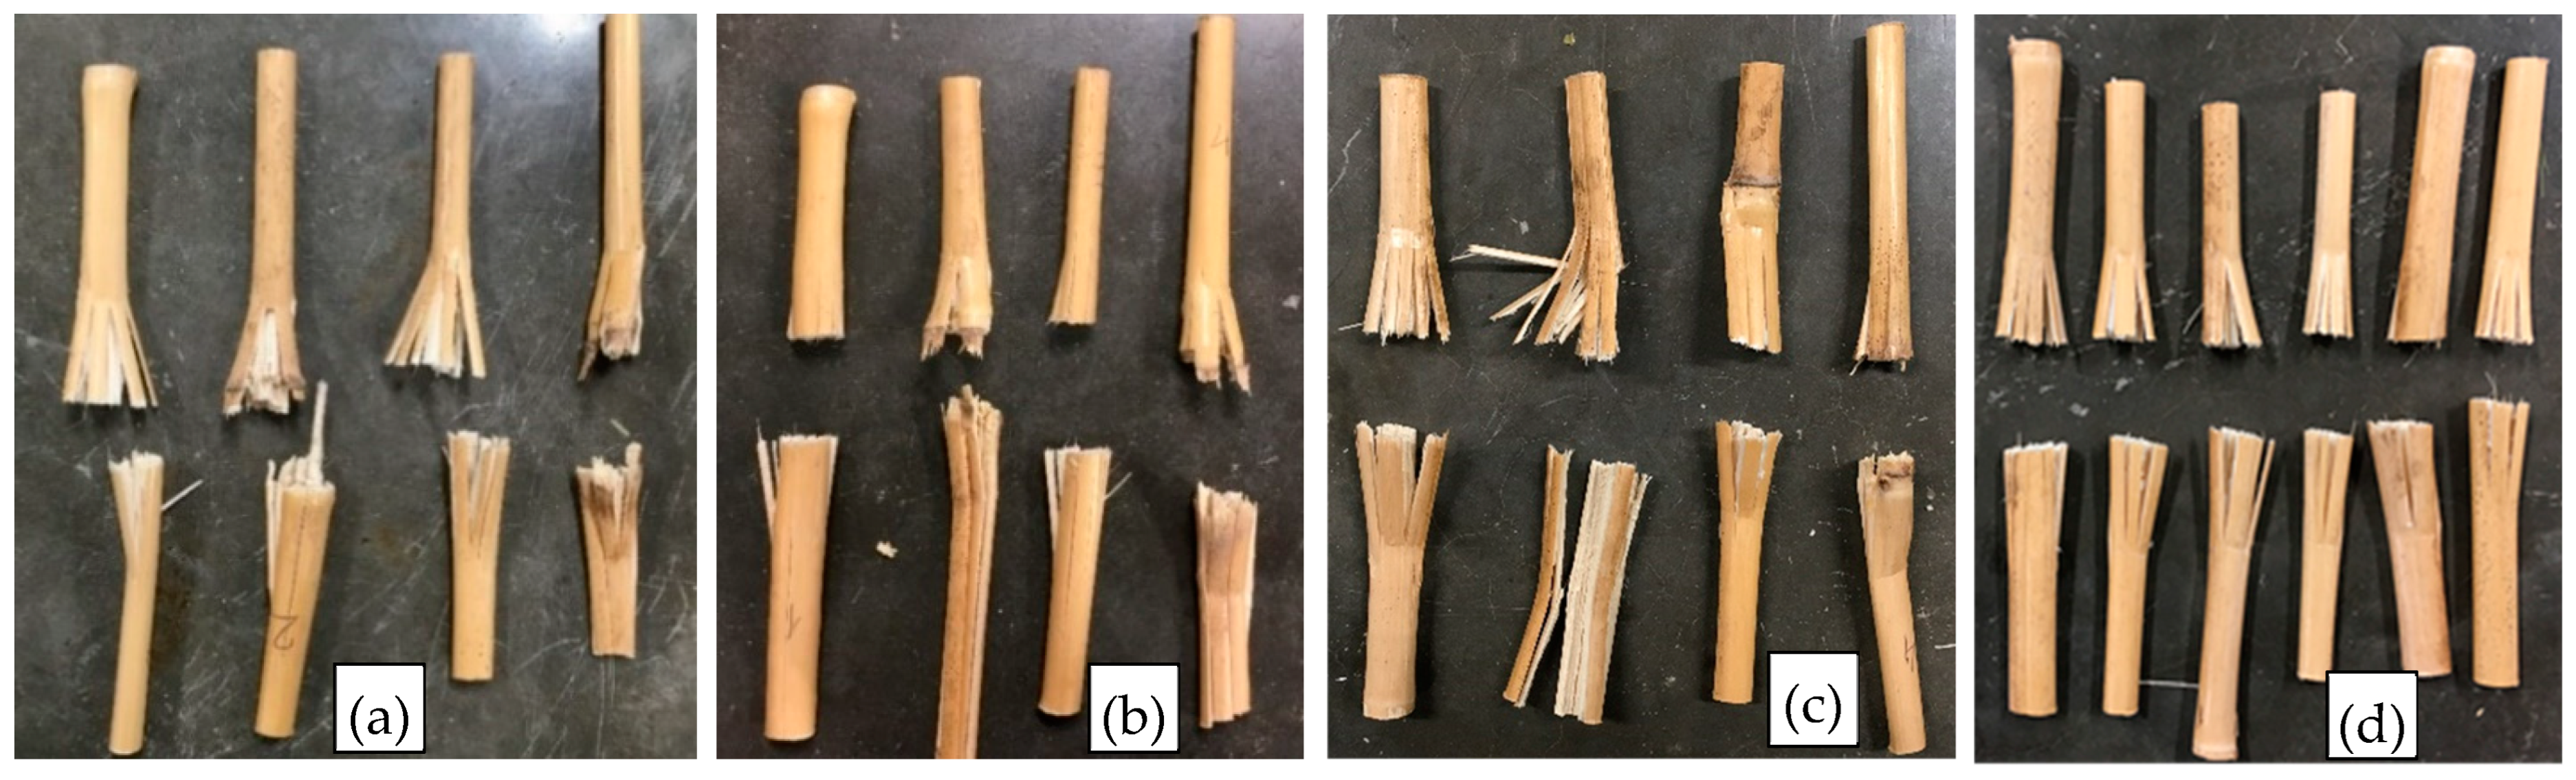
The test results showed that the cutting device was able to shear off a Miscanthus plant sample and the sample was broken into two halves at the cutting speed used. The cut end had slightly different fracture formats (Figure 5). As expected, the serrated blade created clearer cuts, and the flat blade caused more fractures on the plant at the cut ends. The cut and fracture format created by the flat blade is similar with the stubble created by the discbine in the field.

Figure 5.
Illustration of fractured samples cut with (a) the flat blade with one-side fixed support; (b) the serrated blade with one-side fixed support; (c) the flat blade with two-side fixed support; (d) the serrated blade with two-side fixed support.
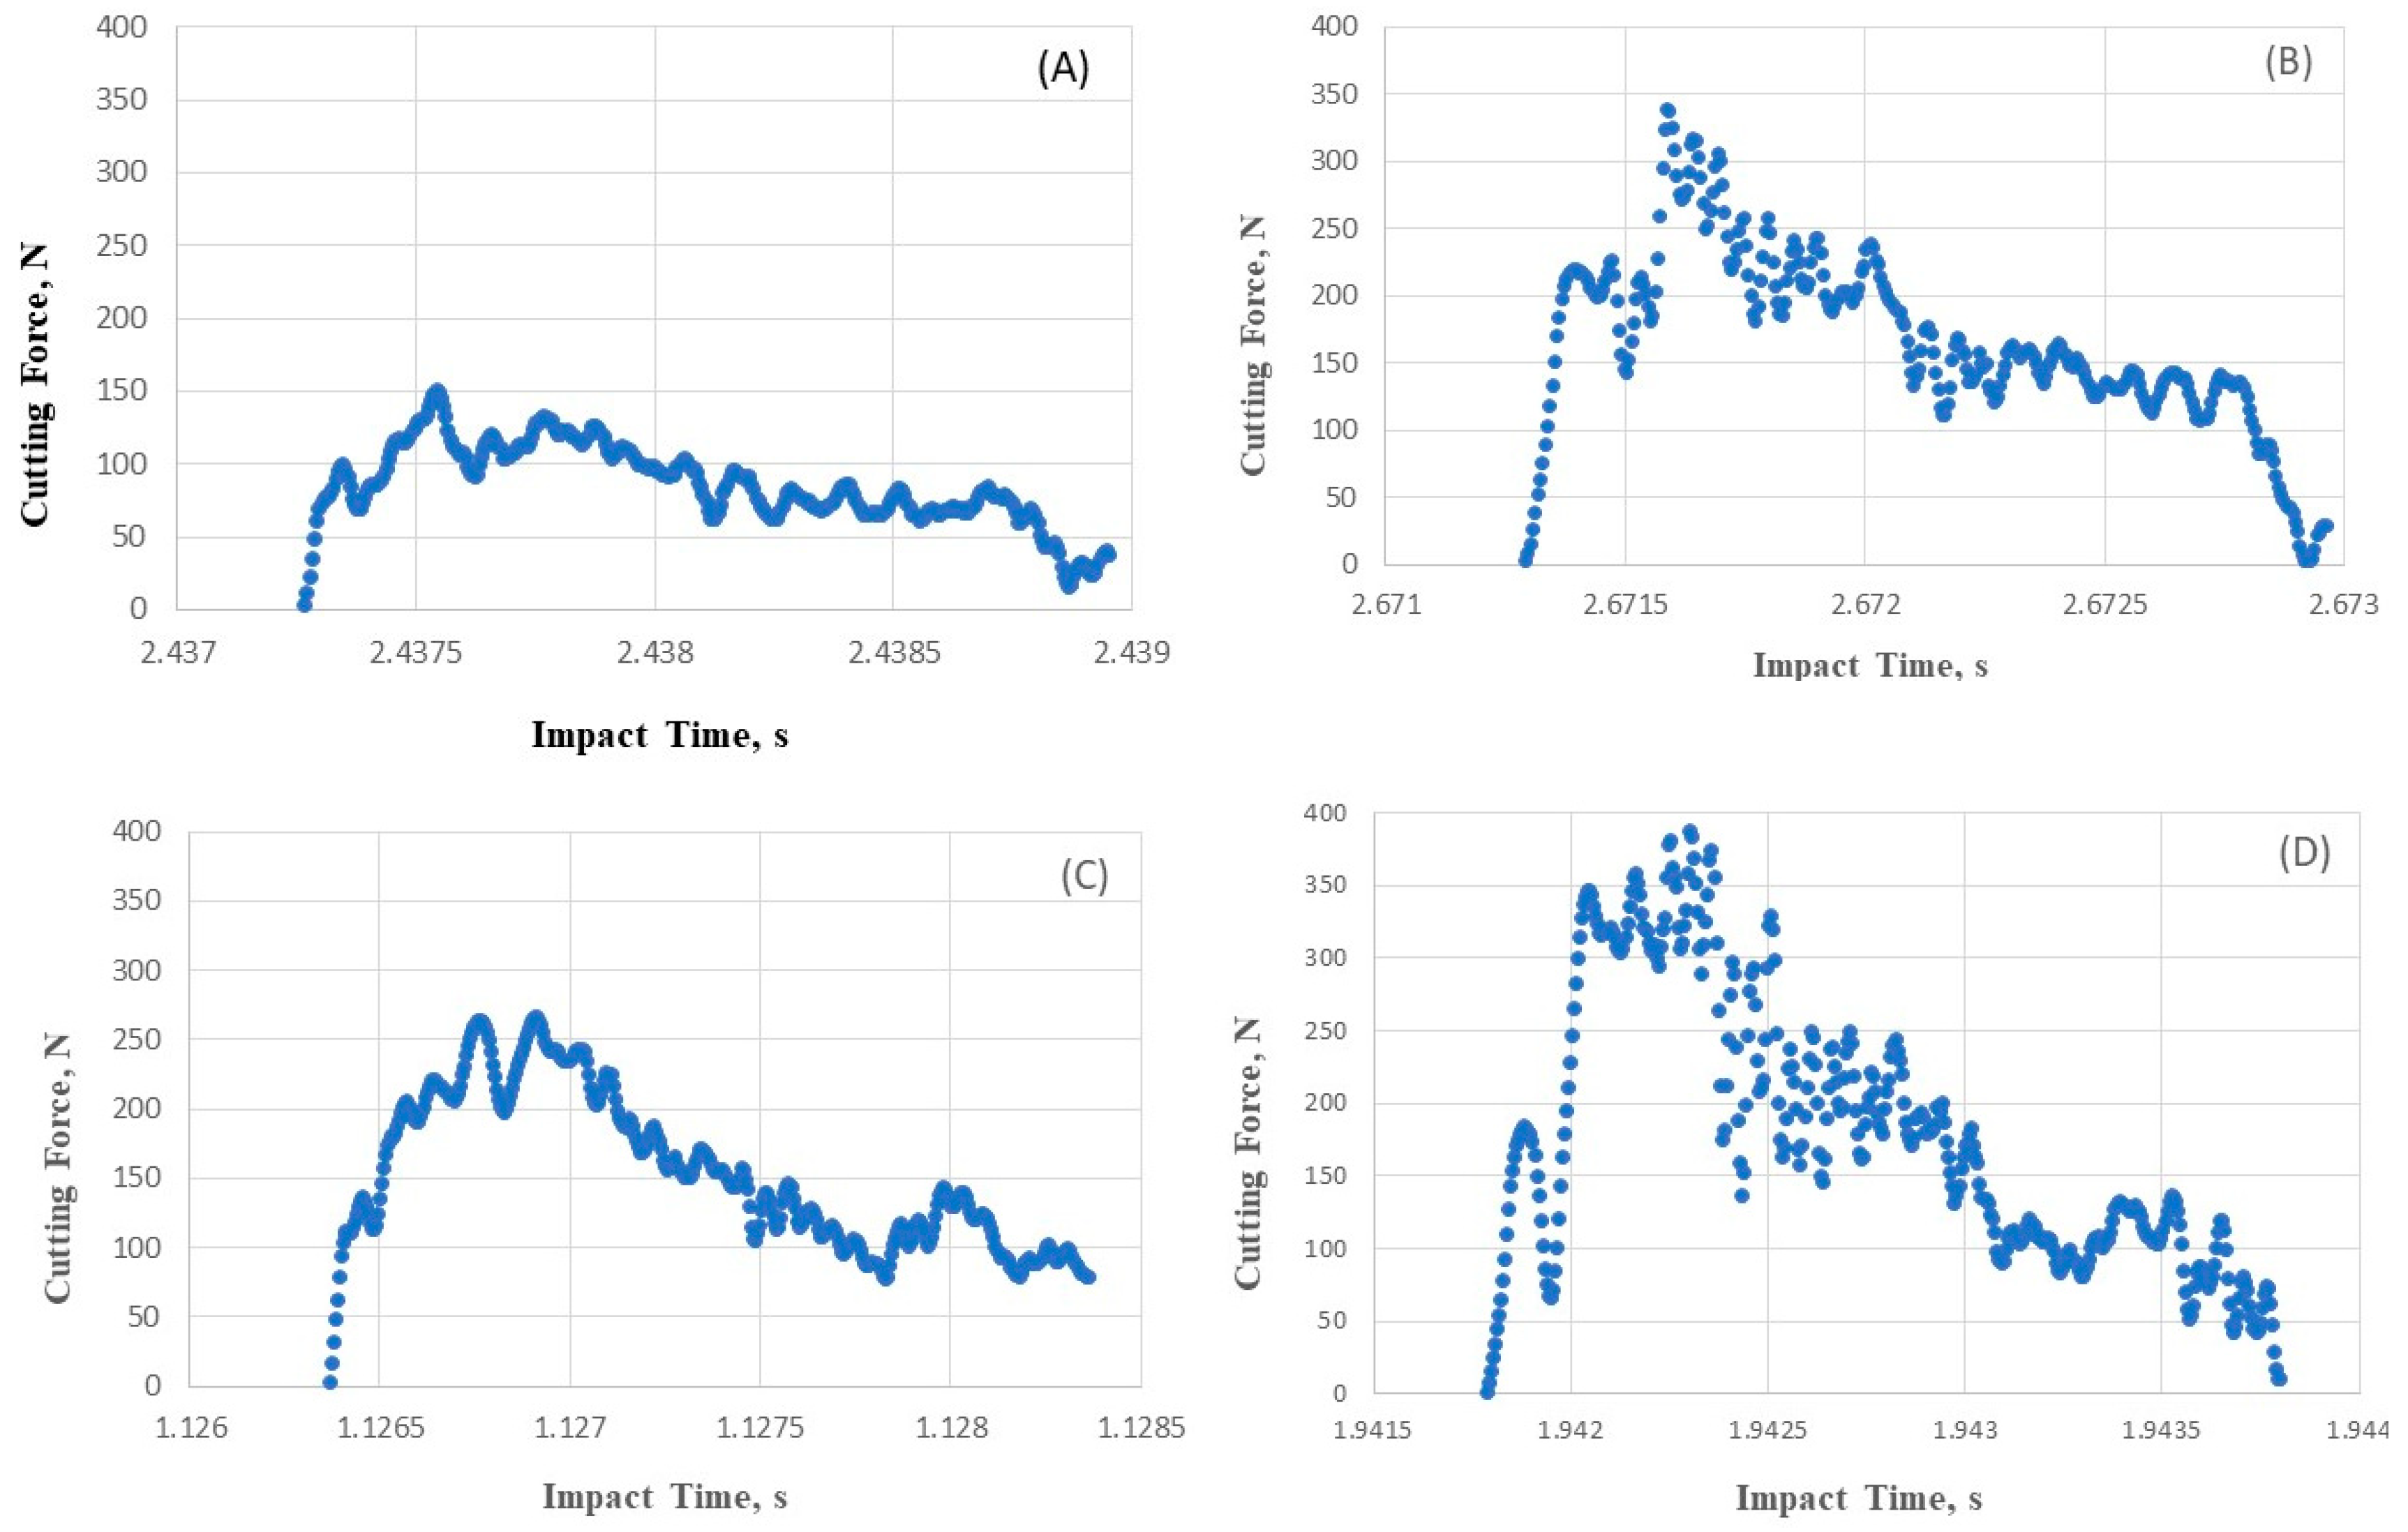
Using the flat blade as an example, four typical force–time characteristics of a complete cutting process at the internode and node for lower and higher portions of the plant using different support methods are demonstrated in Figure 6. The average time of cutting through a stem was 0.0019 s. In most cases, the cutting time for an internode sample was longer compared to the time of cutting at a node as shown in Figure 6A,D. This was most likely due to the more fragile nature of the node than internode. Thus, the impact time for a node section was less than the internode section even though the nodal section was stronger than the internode section for Miscanthus [12]. Other cutting blade and support methods had a similar pattern with the flat blade.
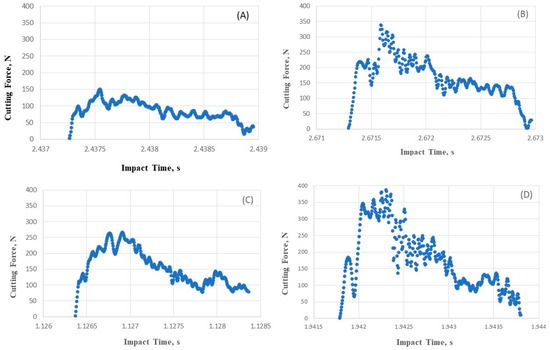
Figure 6.
Force–time curve of cutting in lower internode (A), lower node (B), upper internode (C), upper node (D) for the flat blade with one-side fixed supporting method.
3.2. Cutting Force and Energy for One-Side Fixed Support Using the Flat Blade
The measured results using the flat blade with the one-side fixed supporting method are summarized in Table 1. The measured cutting force indicated that the upper portion of the Miscanthus plant was significantly stronger that its lower portion. For both the lower and upper portions, the node was significantly harder to be cut than the internode. Both the smallest specific cutting force and energy were found at the lower internode sections, while the highest cutting force and energy happened at the upper node sections. These results lined up with the statement other researchers made that the nodal section of Miscanthus tends to be harder than the internode section [12]. The specific cutting forces at the internode and node of the higher portion of the plant increased by 21% and 22%, respectively, compared to those at the lower portion of the plant. However, if comparing the peak cutting forces at a lower portion with those at the upper portion, the peak cutting forces only increased by 5% at the internode and 1% at the node, respectively.

Table 1.
Peak force and energy for the flat blade with one-side fixed supporting method.
This unique feature of cutting forces at lower and upper portions of the plant might be explained with the special internal structure of a Miscanthus stem. It was observed that Miscanthus stems have a hollowed structure at lower portions, and they gradually become solid in their upper sections. It is worth to mention that the recommended definitions for the specific cutting force and specific cutting energy [15] might be questionable for special plant materials such as the Miscanthus in this study. Due to the hollowed structure of the Miscanthus stem at a lower portion of the plant, the stem sample might be compressed or flattened by the cutting blade and then form fractures along the length of the stem before it is sheared off. As a result, the actual cross-sectional area being cut through could be much less than a circular area. The calculated specific cut force and energy would be much higher if the compressed or flattened cross-sectional area was used. The upper portion of the plant is solid in most cases, and the calculated specific force/energy is closer to the definition. Some researchers use plant diameter to calculate the specific cutting forces (e.g., [12]. Thus, both peak cutting forces and sample diameters are provided in all data (see Table 1, Table 2, Table 3 and Table 4 for references).
Table 2.
Peak force and energy for the flat blade with two-side fixed supporting method.
Table 3.
Peak force and energy for the serrated blade with one-side fixed supporting method.
Table 4.
Peak force summary for the serrated blade with two-side fixed samples.
The results of the specific cutting energy showed a similar trend with the specific cutting force. The upper node and internode required significantly higher energy to cut a stem (Table 1). Similar with those specific cutting forces, the lowest specific cutting energy was found at the lower internode, and the highest was found at the upper node.
These results were compared with those from similar crop stem cutting strength tests in previous studies conducted by other researchers. The sample supporting methods in previous studies were all comparable or equivalent to the one-side fixed method used in this study. The specific cutting energy of the flat blade in Table 1 is approximately three times higher than the specific cutting energy of the kenaf stem [16] at a similar cutting speed. When compared to the corn stalk cutting strength [21], the highest specific cutting force for Miscanthus was approximately 1.5 times higher than that of corn stalk. However, the specific cutting energy for the Miscanthus stem reported by Johnson [12] was ten million times higher than the results measured in this study, as shown in Table 1. The unreasonably high results reported by Johnson et al. [12] were neither justified nor compared with other similar studies. It is doubtful that their specific energy unit might have been converted incorrectly. The same cutting device was used by Mathanker for energycane stem cutting tests [22], but the measured specific cutting energy per stem diameter was 0.88 J mm−1, while it was 0.47 J mm−1 for the Miscanthus stem at the node when using a serrated blade. This measured result was close to the results measured in this study, which was 0.63 J mm−1 with a variation of 0.15 J mm−1 when using the maximum cutting energy divided by the average diameter of stems.
3.3. Cutting Force and Energy for Two-Side Fixed Sample Support Using the Flat Blade
The second type of experiments was conducted under the two-side fixed sample supporting method using the same flat blade. The flat blade also created clear cuts using this supporting method (Figure 5c). In some rare cases, plant samples were fractured along its length and crushed, but this was not observed during the flat blade cutting tests with the two-side supported method. The average time of cutting through a stem cross-sectional area for this particular treatment was 2.4 ms, which was 20% longer compared to the flat blade with one-side fixed cutting (1.9 ms). This longer cutting time could explain that the stem sample might have more fractures along its length when fixing both sides of the sample.
The results for two-side fixed samples as shown in Table 2 indicated that the specific cutting forces except the upper node locations were approximately 18 to 21% greater than those measured from the one-side fixed cutting tests. The lowest specific cutting force was at the lower internode section, while the highest was at the upper node section. The specific cutting forces and energy were significantly higher at the upper locations for both the node and internode. The lowest mean specific cutting energy was also at the upper node, while the highest was at the lower node.
3.4. Cutting Force and Energy for One-Side Fixed Sample Support Using the Serrated Blade
Compared to the flat blade, the serrated blade created clearer cuts as shown in Figure 5, and the cut time was shorter. The average cut time was 1.9 ms, which was the same with that using the flat blade under one-side fixed sample cutting. This also indicated that the cut time was related to the sample supporting methods, not the blade type as expected.
As shown in Table 3, the lowest specific cutting force was at the lower internode, while the highest was at the upper node. The specific cutting forces at the upper sections were significantly higher than those at lower sections. The average specific cutting force at the upper nodes was 32% higher than that at the lower nodes. The average specific cutting force at the upper internodes was 39% higher than that at the lower internodes. If comparing peak cutting forces at higher sections with those at lower sections, the mean peak cutting force at the upper nodes was 17% higher than that at the lower nodes, and the mean peak cutting force at the upper internodes was 22% higher than that at the lower internodes. Statistical analysis showed that the mean specific cutting forces at the upper node location were significantly higher than others (Table 3). The mean specific cutting force at the node and internode was significantly different than that at the lower and upper locations.
3.5. Cutting Force and Energy for Two-Side Fixed Sample Support Using the Serrated Blade
The last group of experiments was carried out using the serrated blade and two-side fixed sample supporting method. All test cuttings were effective, and the cuts were clear (Figure 5d). The average time of cutting through a stem was 2.1 ms, which was slightly longer than other previous treatments. Table 4 presents the peak cutting force, cutting speed, and sample diameter using the serrated blade with two-side supported cutting. Similarly, the specific cutting force and energy at the upper sections were significantly higher than those at the lower sections for both the node and internode. The lowest specific cutting force was observed at the lower internode section, while the highest specific cutting force was at the upper node section. The peak cutting forces at the node and internode were significantly different for both the lower and upper sections, but no significant difference was seen between the peak cutting forces at the lower node and upper node. This is also true at the lower internode and upper internode.
3.6. Effect of Miscanthus Stem Diameters on the Cutting Forces
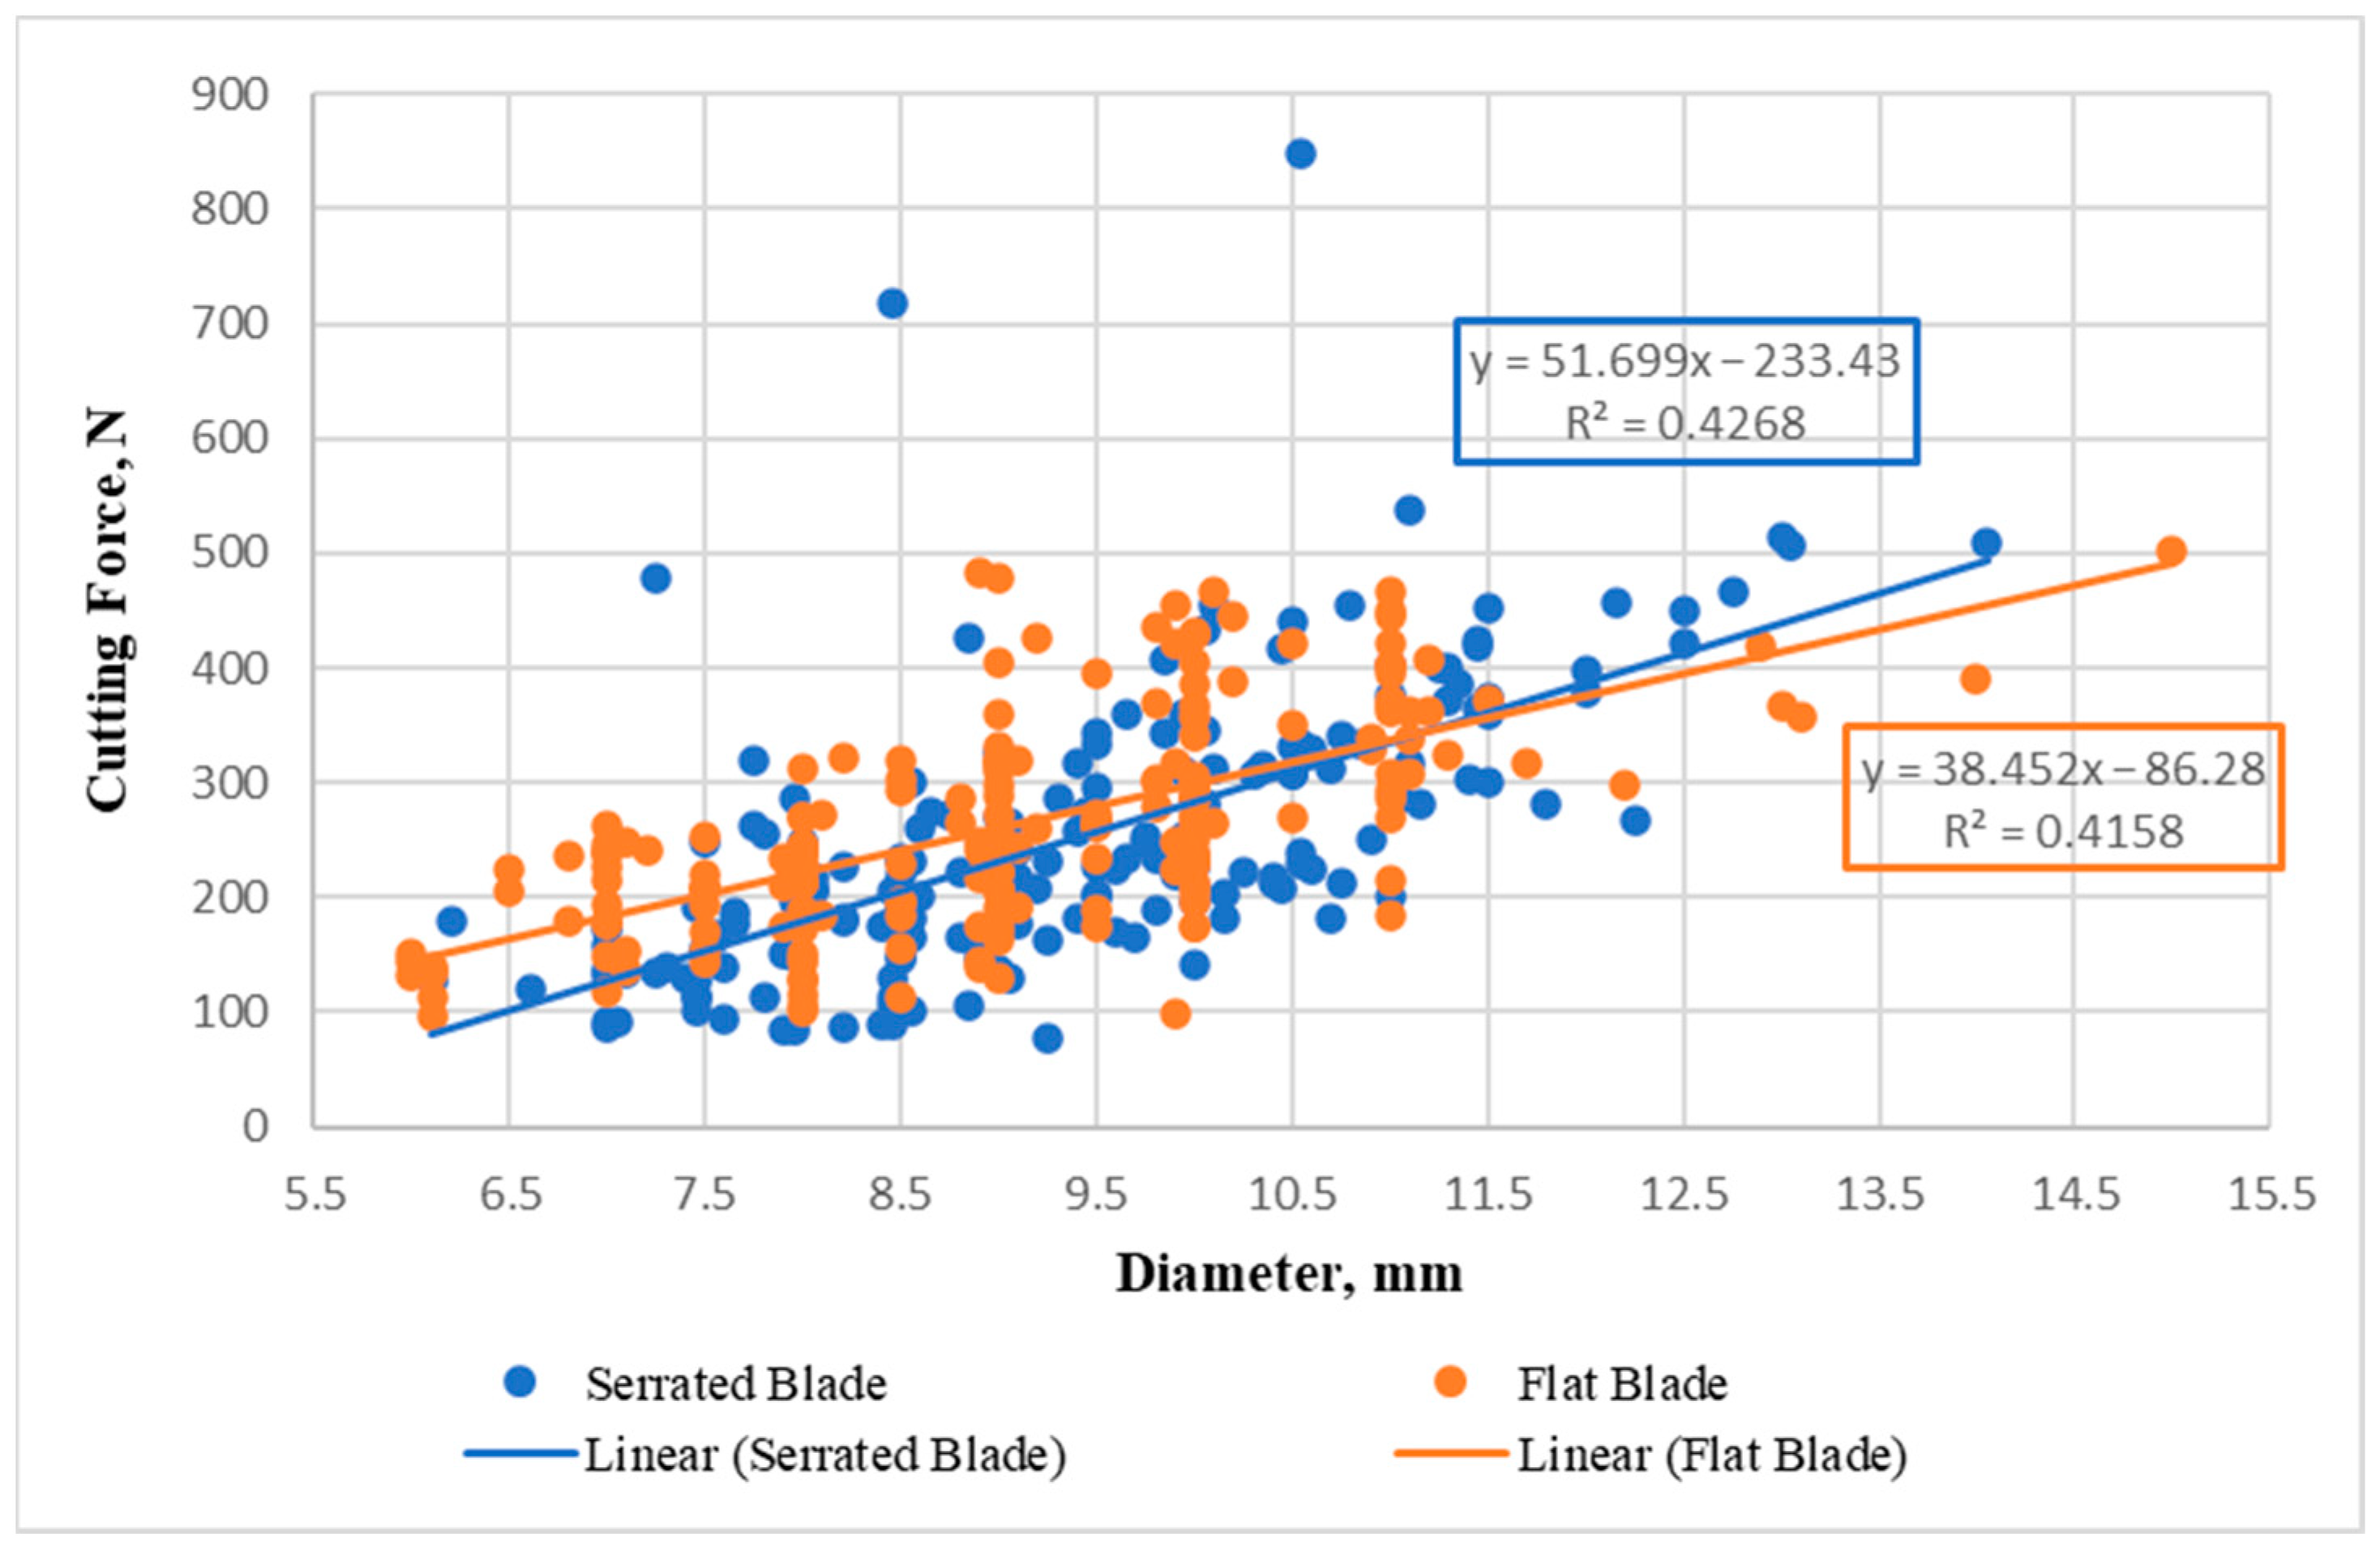
The calculated specific cutting forces in Table 1, Table 2, Table 3 and Table 4 were used to examine the relationships between the cutting forces and plant stem diameters. Thus, all cutting data used in Table 1, Table 2, Table 3 and Table 4 were separated into two cutting blade groups. Statistical analysis was conducted to test the interactions between the specific cutting forces and stem diameters for each cutting blade. A positive relationship of Miscanthus stem diameter was found on the cutting forces for both flat and serrated blades, as shown in Figure 7. The peak cutting forces presented an increased trend when the stem diameter became larger. It seems that the cutting forces of the serrated blade were more sensitive to the stem diameter than those of the flat blade because the increasing rate (51.7%) was greater than the rate of the flat blade (38.5%) even though these trends were not statistically significant.

Figure 7.
Relationships between stem diameters and peak cutting forces for two cutting blades.
3.7. Comparison of Two Cutting Blades with Different Cutting Methods.
The effect of experimental variables on the specific cutting forces was statistically analyzed using the Comparisons (Tukey Pairwise) in the General Linear Model (GLM) with three factors: the sample location (LI, LN, UI, UN), blade type (flat, serrated), and sample support method (1-side, 2-side). The specific cutting force was selected as the response of the analysis. The confidence level was 95%. The statistical analysis results are listed in Table 5.
Table 5.
Factorial comparisons for the specific cutting force (Tukey Pairwise program in GLM with 95% confidence level).
The statistical analysis results indicated that the specific cutting forces at the node and internode were significantly different between the lower and upper sections regardless of the cutting blade types and sample support methods. The flat blade used a significantly higher specific cutting force than the serrated blade to cut a Miscanthus stem. However, the sample supporting methods did not make a significant difference for the entire plant including the node, internode, and lower and upper sections.
Additional multiple factor regression analysis using the GLM model was also conducted to examine the effect of independent variables on the specific cutting force, which was selected as a response in this analysis. The correlations between the blade type, sample supporting methods, and sample locations are listed in Table 6. Any p-value which is less than 0.05 indicates a significant effect on the specific cutting forces. It clearly indicated that the sample support methods did not significantly affect the specific cutting force. Similar statistical analysis for the specific energy was also conducted (Table 7). The support methods consumed significantly different specific energy. The same GLM method was also used to test the peak cutting force, and the results indicated that all three factors, blade types, supporting methods, and sample locations significantly affected the peak cutting force.
Table 6.
Analysis of variance for the specific cutting force.
Table 7.
Analysis of variance for the specific cutting energy.
4. Conclusions
This study focused on the interactions between a cutting blade and a dedicated energy crop, Miscanthus (giganteus). The effect of the blade type, sample supporting method, and sample locations on the peak cutting force and energy was studied. The cutting speed for all treatments ranged between 8.2 m s−1 and 11.3 m s−1, and the average cutting speed was 10.8 m s−1.
The sample supporting method did not significantly affect the specific cutting forces and specific cutting energy. However, it significantly affected the peak cutting forces and energy for both blades. When using a flat blade, the maximum specific cutting force was at the upper portion of the plant stem—that is, 441 N cm−2 at the node for the one-side fixed support, and 469 N cm−2 at the internode for the two-side fixed supporting method. This is to say that the node and internode had significantly different cutting strengths. The specific cutting energy had the same pattern with the specific cutting force.
When using the serrated blade, the maximum specific cutting force was found at the upper node section, and it was 511 N cm−2 and 437 N cm−2 for the one-side fixed and two-side fixed supporting methods, respectively. Meanwhile, the corresponding maximum specific cutting energy was 10.5 J cm−2 and 10.3 J cm−2. For both the flat and serrated blades, the cutting force was directly proportional to the sample diameter, and the cutting forces increased when the stem diameter increased.
Based on the statistical analysis results, blade type significantly affected the specific cutting force and energy. The effect of the sample supporting methods on the specific cutting force and energy was not significant. Stem samples, whether it was internode or node, had a significant different specific cutting force and energy. Similarly, the stem location, whether the lower or upper section of the plant, also significantly affected both the specific cutting force and energy.
These test results could be used for machine designers when estimating power requirements and energy consumption for Miscanthus harvest and process equipment, or any equipment with a cutting mechanism, such as mowers, a pre-cutter on balers, and a hammer mill. The specific energy measured could be used to calculate energy use when mowing Miscanthus if the plant density (number of plants per unit area) is given. The power requirement could also be estimated using the same method.
Author Contributions
Conceptualization, J.L.; methodology, Z.T. and J.L.; formal analysis, Z.T. and J.L.; resources, Z.T. and J.L.; data collection, Z.T.; data curation, Z.T. and J.L.; writing—original draft preparation, Z.T.; writing—review and editing, J.L.; visualization, Z.T. and J.L.; supervision, J.L.; project administration, J.L.; funding acquisition, Z.T. and J.L. All authors have read and agreed to the published version of the manuscript.
Funding
USDA National Institute of Food and Agriculture Hatch Appropriations under Project PEN04872 and Accession number 7005726; USDA NIFA Grant No. 2012-68005-19703.
Data Availability Statement
The data are not publicly available.
Acknowledgments
The authors would thank the Kazakhstan Bolashak Program under the Ministry of Education and Science for providing Toleu’s assistantship during his study at Penn State. This research cannot be completed without the Highspeed Impact Tester provided by the Idaho National Laboratory and financial support from the College of Agricultural Sciences at Penn State University for purchasing the highspeed data acquisition system.
Conflicts of Interest
The authors declare no conflict of interest.
References
- DOE. Biomass Resources, Office of Energy Efficiency and Renewable Energy, Department of Energy, USA. 2024. Available online: https://www.energy.gov/eere/bioenergy/biomass-resources (accessed on 12 June 2024).
- Smeets, E.M.W.; Lewandowski, I.M.; Faaij, I.P.C. The economical and environmental performance of miscanthus and switchgrass production and supply chains in a European setting. Renew. Sustain. Energy Rev. 2009, 13, 1230–1245. [Google Scholar] [CrossRef]
- Lewandowski, I.; Clifton-Brown, J.; Kiesel, A.; Hastings, A.; Iqbal, Y. 2-Miscanthus. In Perennial Grasses for Bioenergy and Bioproducts; Academic Press: Cambridge, MA, USA, 2018; pp. 35–59. [Google Scholar] [CrossRef]
- Kaack, K.; Schwarz, K.-U. Morphological and mechanical properties of Miscanthus in relation to harvesting, lodging, and growth conditions. Ind. Crops Prod. 2001, 14, 145–154. [Google Scholar] [CrossRef]
- Shah, D.U.; Reynolds, T.P.S.; Ramage, M.H. The strength of plants: Theory and experimental methods to measure the mechanical properties of stems. J. Exp. Bot. 2017, 68, 4497–4516. [Google Scholar] [CrossRef] [PubMed]
- Dunn, G.H.; Dabney, S.M. Modulus of elasticity and moment of inertia of grass hedge stems. Trans. ASAE 1996, 39, 947–952. [Google Scholar] [CrossRef]
- Gan, H.; Mathanker, S.; Momin, M.A.; Kuhns, B.; Stoffel, N.; Hansen, A.; Grift, T. Effects of three cutting blade designs on energy consumption during mowing-conditioning of Miscanthus Giganteus. Biomass Bioenergy 2018, 109, 166–171. [Google Scholar] [CrossRef]
- Redcay, S.; Koirala, A.; Liu, J. Effects of roll and flail conditioning systems on mowing and baling of Miscanthus x giganteus feedstock. Biosyst. Eng. 2018, 172, 134–143. [Google Scholar] [CrossRef]
- McRandal, D.M.; McNulty, P.B. Impact cutting behavior of forage crops II: Field tests. J. Agric. Eng. Res. 1978, 23, 329–338. [Google Scholar] [CrossRef]
- Fasick, G.T.; Liu, J. Lab scale studies of miscanthus mechanical conditioning and bale compression. Biosyst. Eng. 2020, 200, 366–376. [Google Scholar] [CrossRef]
- Redcay, S.; Liu, J. The Effect of Mechanical Conditioning on Physical Conditions of Miscanthus Plants. Am. J. Plant Sci. 2023, 14, 77–88. [Google Scholar] [CrossRef]
- Johnson, P.C.; Clementson, C.L.; Mathanker, S.K.; Grift, T.E.; Hansen, A.C. Cutting energy characteristics of Miscanthus x giganteus stems with varying oblique angle and cutting speed. Biosyst. Eng. 2012, 112, 42–48. [Google Scholar] [CrossRef]
- Shinners, K.J.; Boettcher, G.C.; Muck, R.E.; Weimer, P.J.; Casler, M.D. Harvesting and Storage of Two Perennial Grasses as Biomass Feedstock. Trans. ASABE 2010, 53, 359–370. [Google Scholar] [CrossRef]
- Anderson, E.; Arundale, R.; Maughan, M.; Oladeinde, A.; Wycislo, A.; Voigt, T. Growth and agronomy of Miscanthus X giganteus for biomass production. Biofuels 2011, 2, 167–183. [Google Scholar] [CrossRef]
- Persson, S. Mechanics of Cutting Plant Materials. American Society of Agricultural Engineers: St. Joseph, MI, USA, 1987; pp. 140–149. [Google Scholar]
- Ghahraei, O.; Ahmad, D.; Khalina, A.; Suryanto, H.; Othman, J. Cutting tests of kenaf stems. Trans. ASABE 2011, 54, 51–56. [Google Scholar] [CrossRef]
- Maughan, J.D.; Mathanker, S.K.; Fehrenbacher, B.M.; Hansen, A.C. Impact of cutting speed and blade configuration on energy requirement for Miscanthus harvesting. Appl. Eng. Agric. 2014, 30, 137–142. [Google Scholar]
- Liu, Q.; Mathanker, S.K.; Zhang, Q.; Hansen, A.C. Biomechanical Properties of Miscanthus Stem. Trans. ASABE 2012, 55, 1125–1131. [Google Scholar] [CrossRef]
- Srivastava, A.K.; Goering, C.E.; Rohrbach, R.P.; Buckmaster, D.R. Hay and forage harvesting. In Engineering Principles of Agricultural Machines, 2nd ed.; American Society of Agricultural and Biological Engineers: St. Joseph, MI, USA, 2006; p. 325. [Google Scholar]
- Vu, V.D.; Ngo, Q.H.; Nguyen, T.T.; Nguyen, H.C.; Nguyen, Q.T.; Nguyen, V.D. Multi-objective optimization of cutting force and cutting power in chopping agricultural residues. Biosyst. Eng. 2020, 191, 107–115. [Google Scholar] [CrossRef]
- Igathinathane, C.; Womac, A.R.; Sokhansanj, S. Corn stalk orientation effect on mechanical cutting. Biosyst. Eng. 2010, 107, 97–106. [Google Scholar] [CrossRef]
- Mathanker, A.K.; Grift, T.E.; Hansen, A.E. Effect of blade oblique angle and cutting speed on cutting energy for energycane stems. Biosyst. Eng. 2015, 133, 64–70. [Google Scholar] [CrossRef]

Disclaimer/Publisher’s Note: The statements, opinions and data contained in all publications are solely those of the individual author(s) and contributor(s) and not of MDPI and/or the editor(s). MDPI and/or the editor(s) disclaim responsibility for any injury to people or property resulting from any ideas, methods, instructions or products referred to in the content. |
© 2024 by the authors. Licensee MDPI, Basel, Switzerland. This article is an open access article distributed under the terms and conditions of the Creative Commons Attribution (CC BY) license (https://creativecommons.org/licenses/by/4.0/).