Article

Machine Learning Methods for Predicting Argania spinosa Crop Yield and Leaf Area Index: A Combined Drought Index Approach from Multisource Remote Sensing Data

1
Botany and Valorization of Plant and Fungal Resources, Department of Biology, Faculty of Sciences, Mohammed V University, Rabat 10050, Morocco
2
National Forestry School of Engineers, Sale 11000, Morocco
*
Author to whom correspondence should be addressed.
AgriEngineering 2024, 6(3), 2283-2305; https://doi.org/10.3390/agriengineering6030134
Submission received: 4 June 2024 / Revised: 5 July 2024 / Accepted: 9 July 2024 / Published: 17 July 2024

Abstract

:
In this study, we explored the efficacy of random forest algorithms in downscaling CHIRPS (Climate Hazards Group InfraRed Precipitation with Station data) precipitation data to predict Argane stand traits. Nonparametric regression integrated original CHIRPS data with environmental variables, demonstrating enhanced accuracy aligned with ground rain gauge observations after residual correction. Furthermore, we explored the performance of range machine learning algorithms, encompassing XGBoost, GBDT, RF, DT, SVR, LR and ANN, in predicting the Leaf Area Index (LAI) and crop yield of Argane trees using condition index-based drought indices such as PCI, VCI, TCI and ETCI derived from multi-sensor satellites. The results demonstrated the superiority of XGBoost in estimating these parameters, with drought indices used as input. XGBoost-based crop yield achieved a higher R2 value of 0.94 and a lower RMSE of 6.25 kg/ha. Similarly, the XGBoost-based LAI model showed the highest level of accuracy, with an R2 of 0.62 and an RMSE of 0.67. The XGBoost model demonstrated superior performance in predicting the crop yield and LAI estimation of Argania sinosa, followed by GBDT, RF and ANN. Additionally, the study employed the Combined Drought Index (CDI) to monitor agricultural and meteorological drought over two decades, by combining four key parameters, PCI, VCI, TCI and ETCI, validating its accuracy through comparison with other drought indices. CDI exhibited positive correlations with VHI, SPI and crop yield, with a particularly strong and statistically significant correlation observed with VHI (r = 0.83). Therefore, CDI was recommended as an effective method and index for assessing and monitoring drought across Argane forest stands area. The findings demonstrated the potential of advanced machine learning models for improving precipitation data resolution and enhancing agricultural drought monitoring, contributing to better land and hydrological management.

1. Introduction

The Argane tree [Argania spinosa (L.) Skeels] is native to the southwestern region of Morocco and is the unique representative stand of the tropical family Sapotaceae. It covers a total area of 999,079 ha, placing third among Moroccan forest stands [1]. This robust tree plays a crucial role in maintaining ecosystem balance, combating desertification and contributing to the socio-economic advancement of the local population [2,3]. Known for its robustness, the Argane trees thrives in varied and challenging ecological conditions, significantly contributing to the conservation of faunal and floral biodiversity [1]. However, its biogeographical distribution has declined significantly, largely due to the adverse effects of global climate change, particularly chronic droughts, which limit natural spread and reduce productivity, including crop yield and Argane oil production. The species distribution in a restricted area in southwestern Morocco is characterized by high evapotranspiration demand and low water availability [2,4]. Assessing drought stress in this species, similar to predicting crop yield, is integral to the sustainable agricultural management of Argane forest ecosystems. Such assessments provide valuable insights for farmers, aiding productivity enhancement and informed agricultural decision-making.
In recent years, the integration of biophysical parameters and remote sensing techniques has introduced new avenues for health monitoring and crop yield prediction [1]. The Leaf Area Index (LAI) has become a crucial indicator of vegetation health, playing a significant role in environmental and agricultural studies by aiding in yield prediction, biomass monitoring, evapotranspiration estimation and ecosystem productivity assessment [1]. LAI primarily characterizes the crop canopy structure and is closely associated with photosynthetic processes in plants [5]. Therefore, the precise monitoring of LAI and crop yield in Argane stands is imperative for gaining insights into their responses to changing environmental conditions and guiding the management of Argane forests. Similarly, crop yield serves as a fundamental indicator of sustainable agricultural development [6].
The growth and development of crop yields are significantly impacted by environmental factors and soil properties; with reduced yields potentially linked to factors such as high temperatures or excessive precipitation [7]. Developing yield prediction techniques often requires long-term field experiments, as crop yield forecasting is crucial for optimizing production. Various meteorological and agricultural parameters, including temperature, precipitation, soil conditions and vegetation health, have been widely employed for crop yield forecasting [6]. To predict crop yield and LAI, a variety of multi-temporal, multi-spatial and meteorological satellites are utilized to derive spectral indices that have a direct relationship with productivity and plant growth, such as absorbed photosynthetically active radiation (FAPAR), the enhanced vegetation index (EVI), the normalized difference vegetation index (NDVI) and the vegetation health index (VHI), etc. Li et al. [8] utilized HJ-1A satellite remote sensing images for rice yield estimation; soybean yields employing MODIS [9]. Additionally, Feng et al. [10] incorporated model inputs like plant height, canopy cover and the vegetation index to predict cotton yield at various growth stages.
Drought presents a significant climate challenge, leading to hydrological and ecological imbalances, including reduced crop yields, vegetation loss and land degradation [11]. Moreover, drought is generally categorized into agricultural, meteorological, hydrological and socioeconomic types [12]. Meteorological drought involves a deficit in precipitation, agricultural drought indicates a complete deficit in soil moisture, hydrological drought indicates a deficiency in stream flow and socioeconomic drought is linked to a scarcity of certain economic goods impacted by the drought phenomenon [13]. Analyzing drought phenomena through the utilization of diverse drought indices can enhance our understanding of drought events and enable a comprehensive analysis of their relationships. Pham et al. [14] conducted a study focusing on understanding the relationship between annual crop yield and Vegetation Condition Index (VCI) and Temperature Condition Index (TCI) data. VCI, derived from NDVI, serves as a valuable indicator for assessing drought and vegetation conditions, while TCI is derived from LST. Statistical analysis revealed a notably robust correlation between reflective indices like VCI compared to thermal indices like TCI [12]. Du et al. [13] proposed the Synthesized Drought Index (SDI), primarily based on VCI, PCI and TCI, for drought monitoring and detection during vegetation growth. Similarly, the integration of VCI and TCI led to the development of the Vegetation Health Index (VHI) by [15] for agricultural drought detection. Although satellite-derived precipitation estimates are extensively utilized in drought monitoring and water management, their coarse spatial resolution and uncertainties may limit capturing detailed precipitation patterns in minor watershed areas [16]. Downscaling serves as an effective method to acquire high-resolution precipitation data, essential for advanced research in ecology and hydrology [16]. The downscaling model seeks to establish an internal connection between precipitation and environmental factors, leveraging more detailed environmental indicators to enhance remote sensing precipitation data resolution from coarse to high resolution using machine learning approaches.
In recent years, there has been a growing emphasis on crop yield and LAI prediction, with the development of experimental statistical models. The selection of model inputs is regarded as a crucial step in this modeling process. Machine-learning-based statistical models, have shown more promising results compared to traditional linear regression models [6]. Machine learning (ML) methods have seen widespread application in retrieving biophysical and physiological parameters due to their ability to accurately estimate robust relationships among target and predictor data, particularly in the estimation of vegetation parameters [1]. The use of ML algorithms holds significant promise in predicting crop yield [17]. This focus on accuracy and region-specific insights has driven progress in remote sensing methods and their application across various domains, including forestry and agriculture. Jhajharia and Mathur [18] found that DT and RF outperformed other methods in predicting crop yield. Similarly, Prasad et al. [6] noted the reliability and efficiency of the RF model in predicting cotton crop yield. Rashid et al. [19] demonstrated that ANN is the most frequently employed machine learning technique to predict crop yield and vegetation parameters with remote sensing data due to its ability to capture complex and non-linear relationships between input and output variables, followed by random forest. Wang et al. [5] identified the XGBoost algorithm as the most effective for AGB and LAI estimation in Linn, followed by GBDT, RF, RFNN and SVR, with similar findings in winter wheat [20]. Mouafik et al. [1] employed the random forest model to estimate the LAI of Argania spinosa using vegetation indices and found it to be reliable and efficient in predicting the LAI with multi-source data. In this study, various estimation models, including extreme gradient boosting (XGBoost), the gradient boosting decision tree (GBDT), random forest (RF), an artificial neural network (ANN), support vector regression (SVR), lasso regression (LR) and the decision tree (DT), were constructed.
The primary objective of this study is to develop a flexible and efficient model for predicting crop yield and LAI, as well as establish a combined index for monitoring drought stress in Argane forest stands using machine learning techniques. The specific objectives of this study include:
(I)
Downscaling monthly CHIRPS data from a 5 km to 1 km scale using topographic and vegetation variables as predictors with the random forest model.
(II)
Investigating and comparing the performance of various models to identify the optimal machine learning approach for predicting crop yield and LAI in Argane forest stands.
(III)
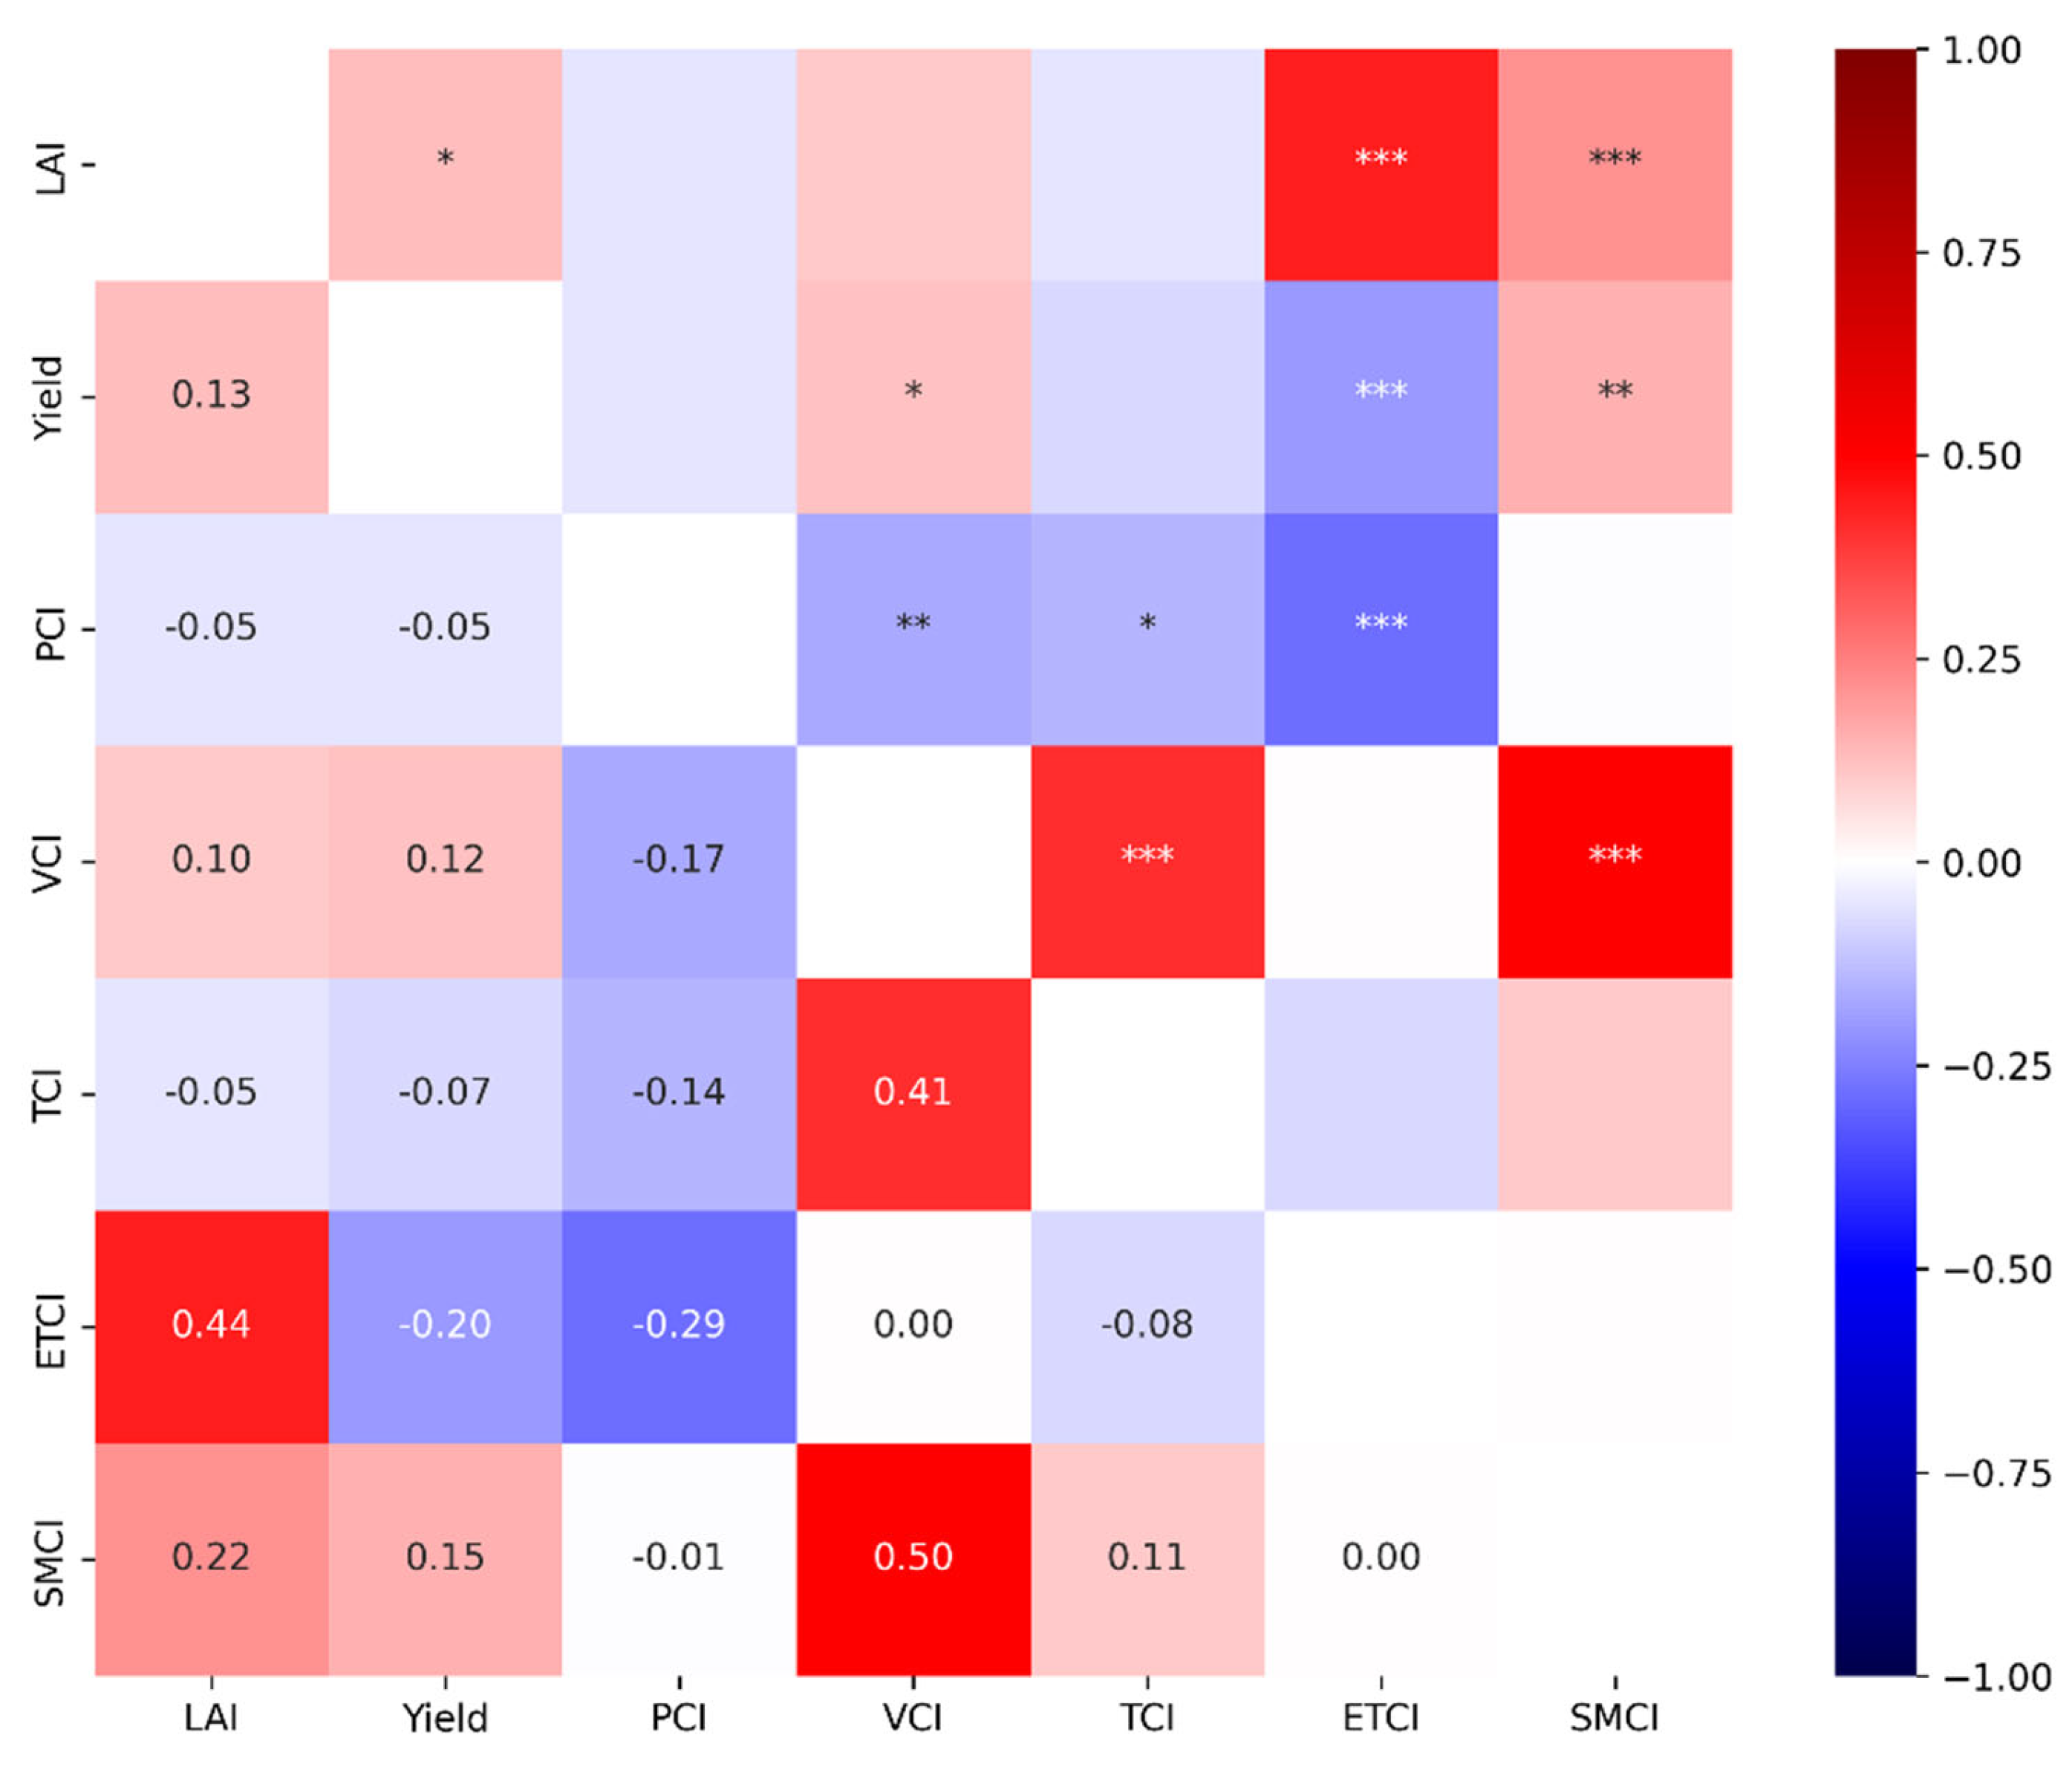
Identifying correlations between crop yield and LAI with predictor variables, particularly drought indices.
(IV)
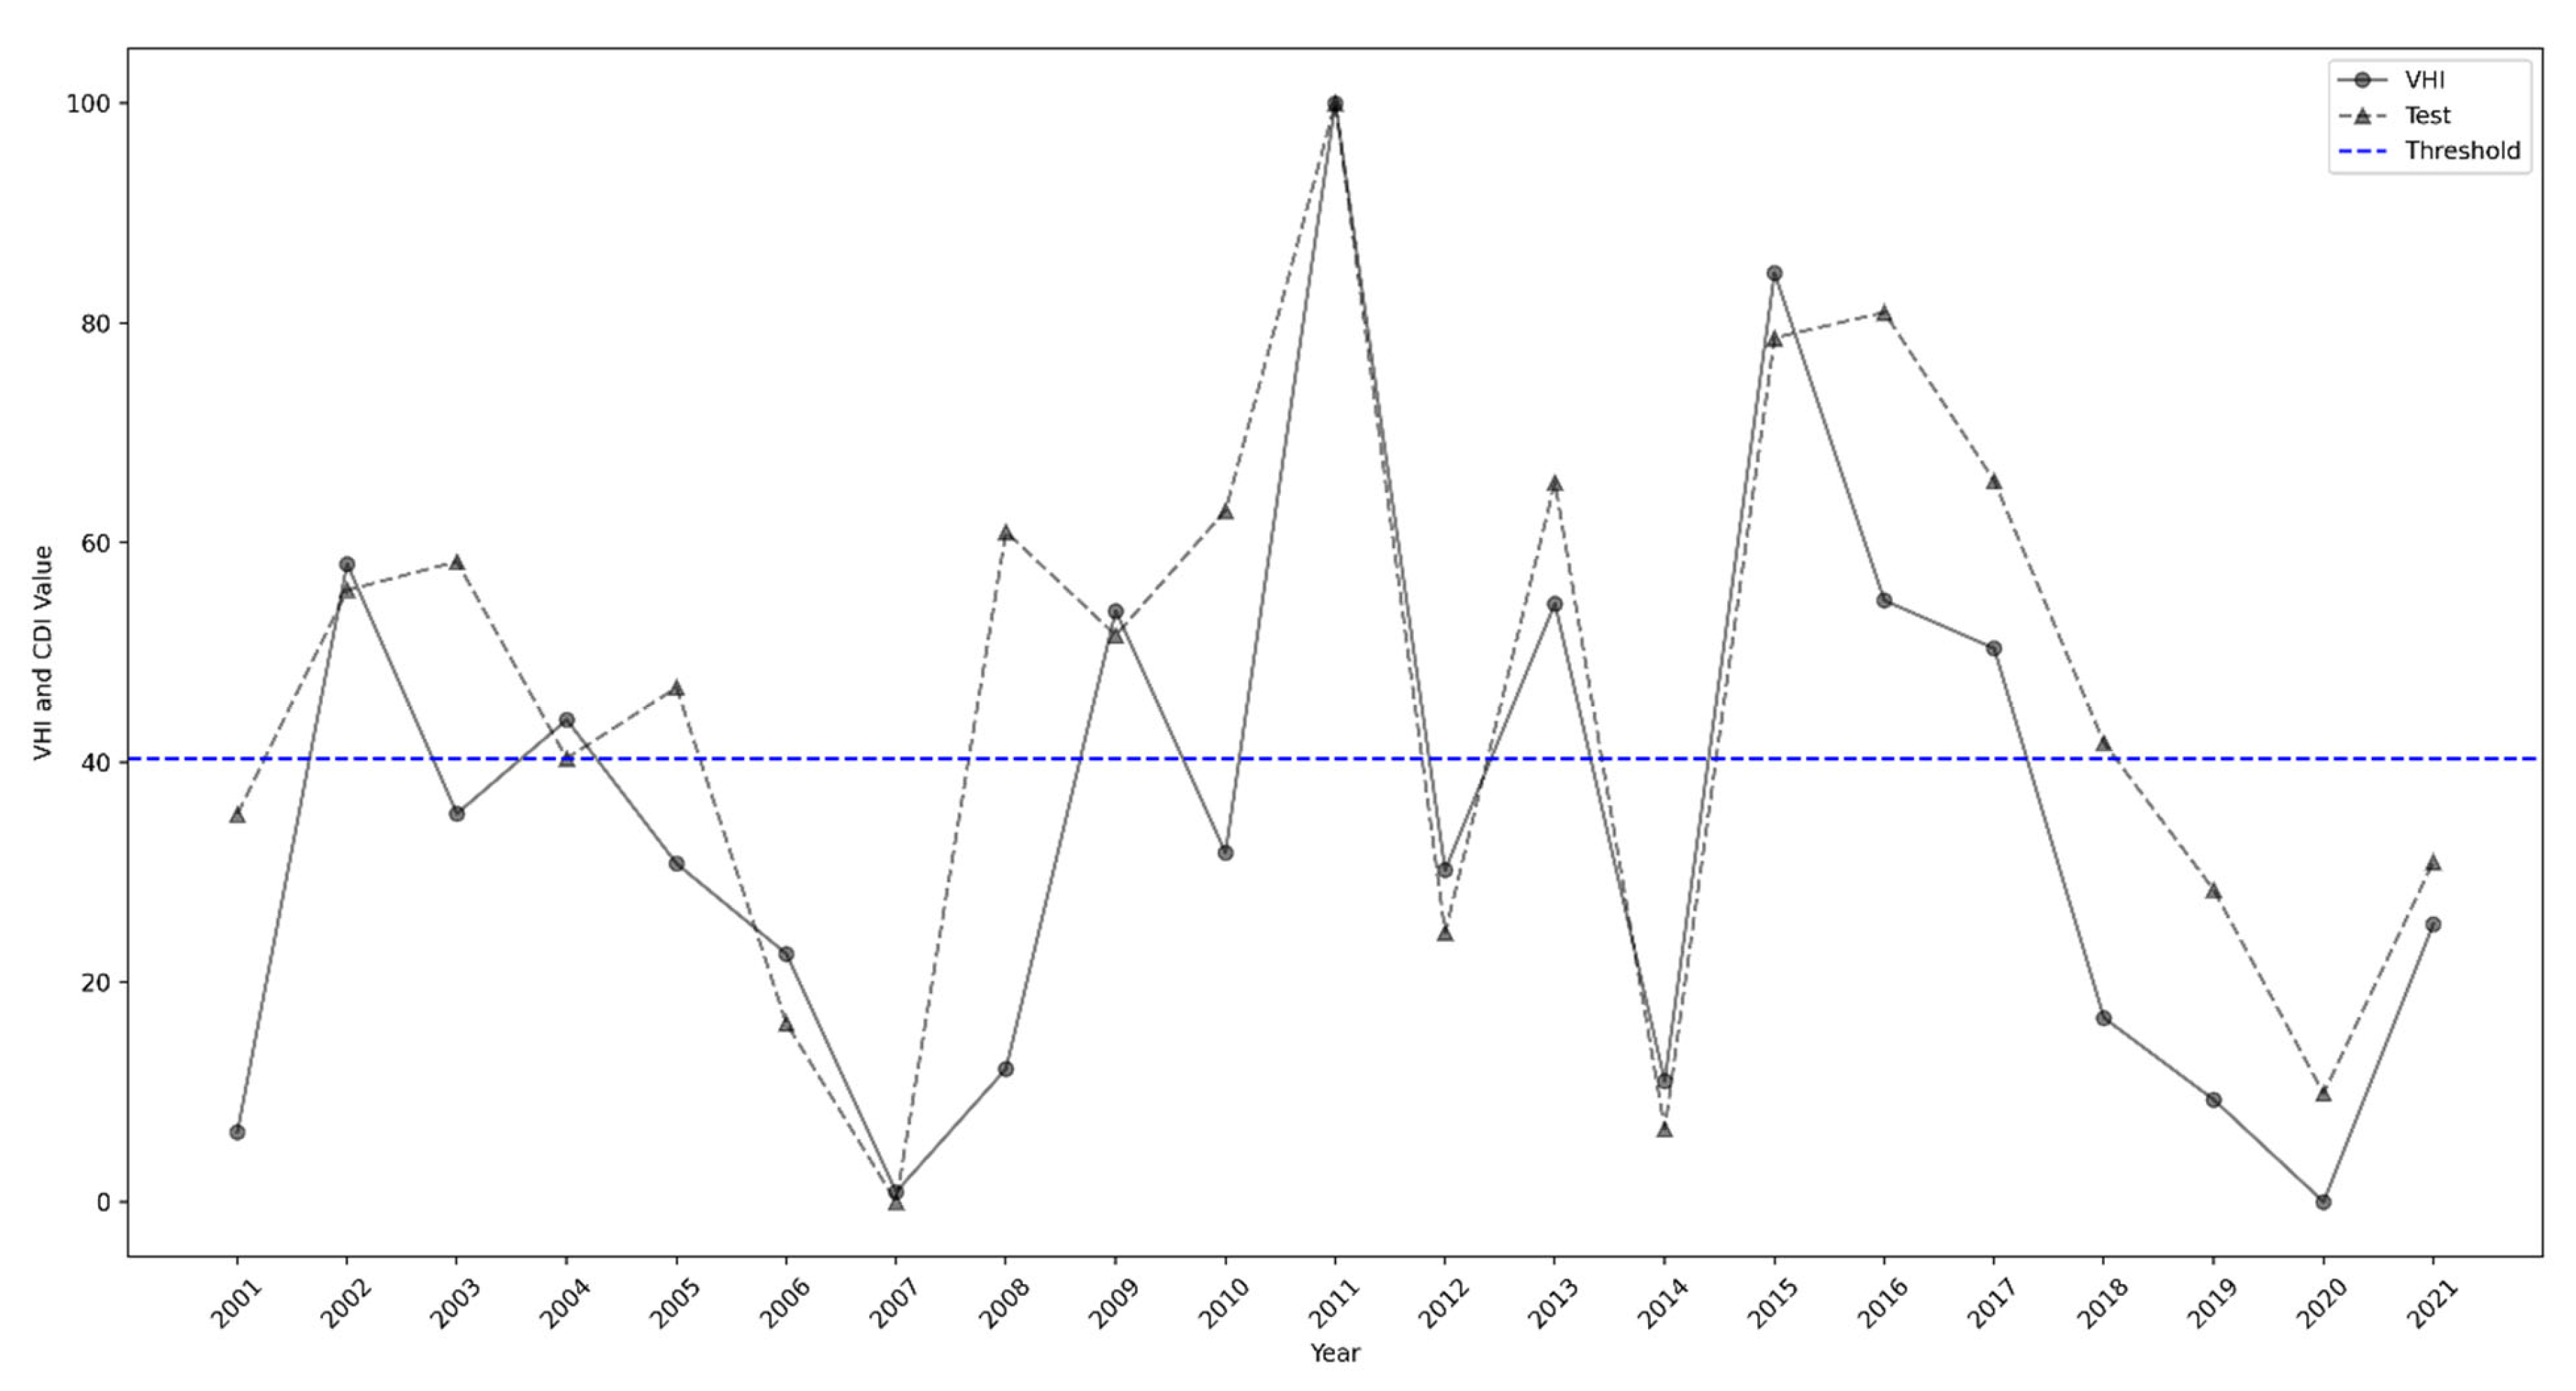
Establishing a combined drought index (CDI) from multisource remote sensing data to monitor and evaluate long-term agricultural drought in Argane forest areas from 2001 to 2021.

2. Materials and Methods
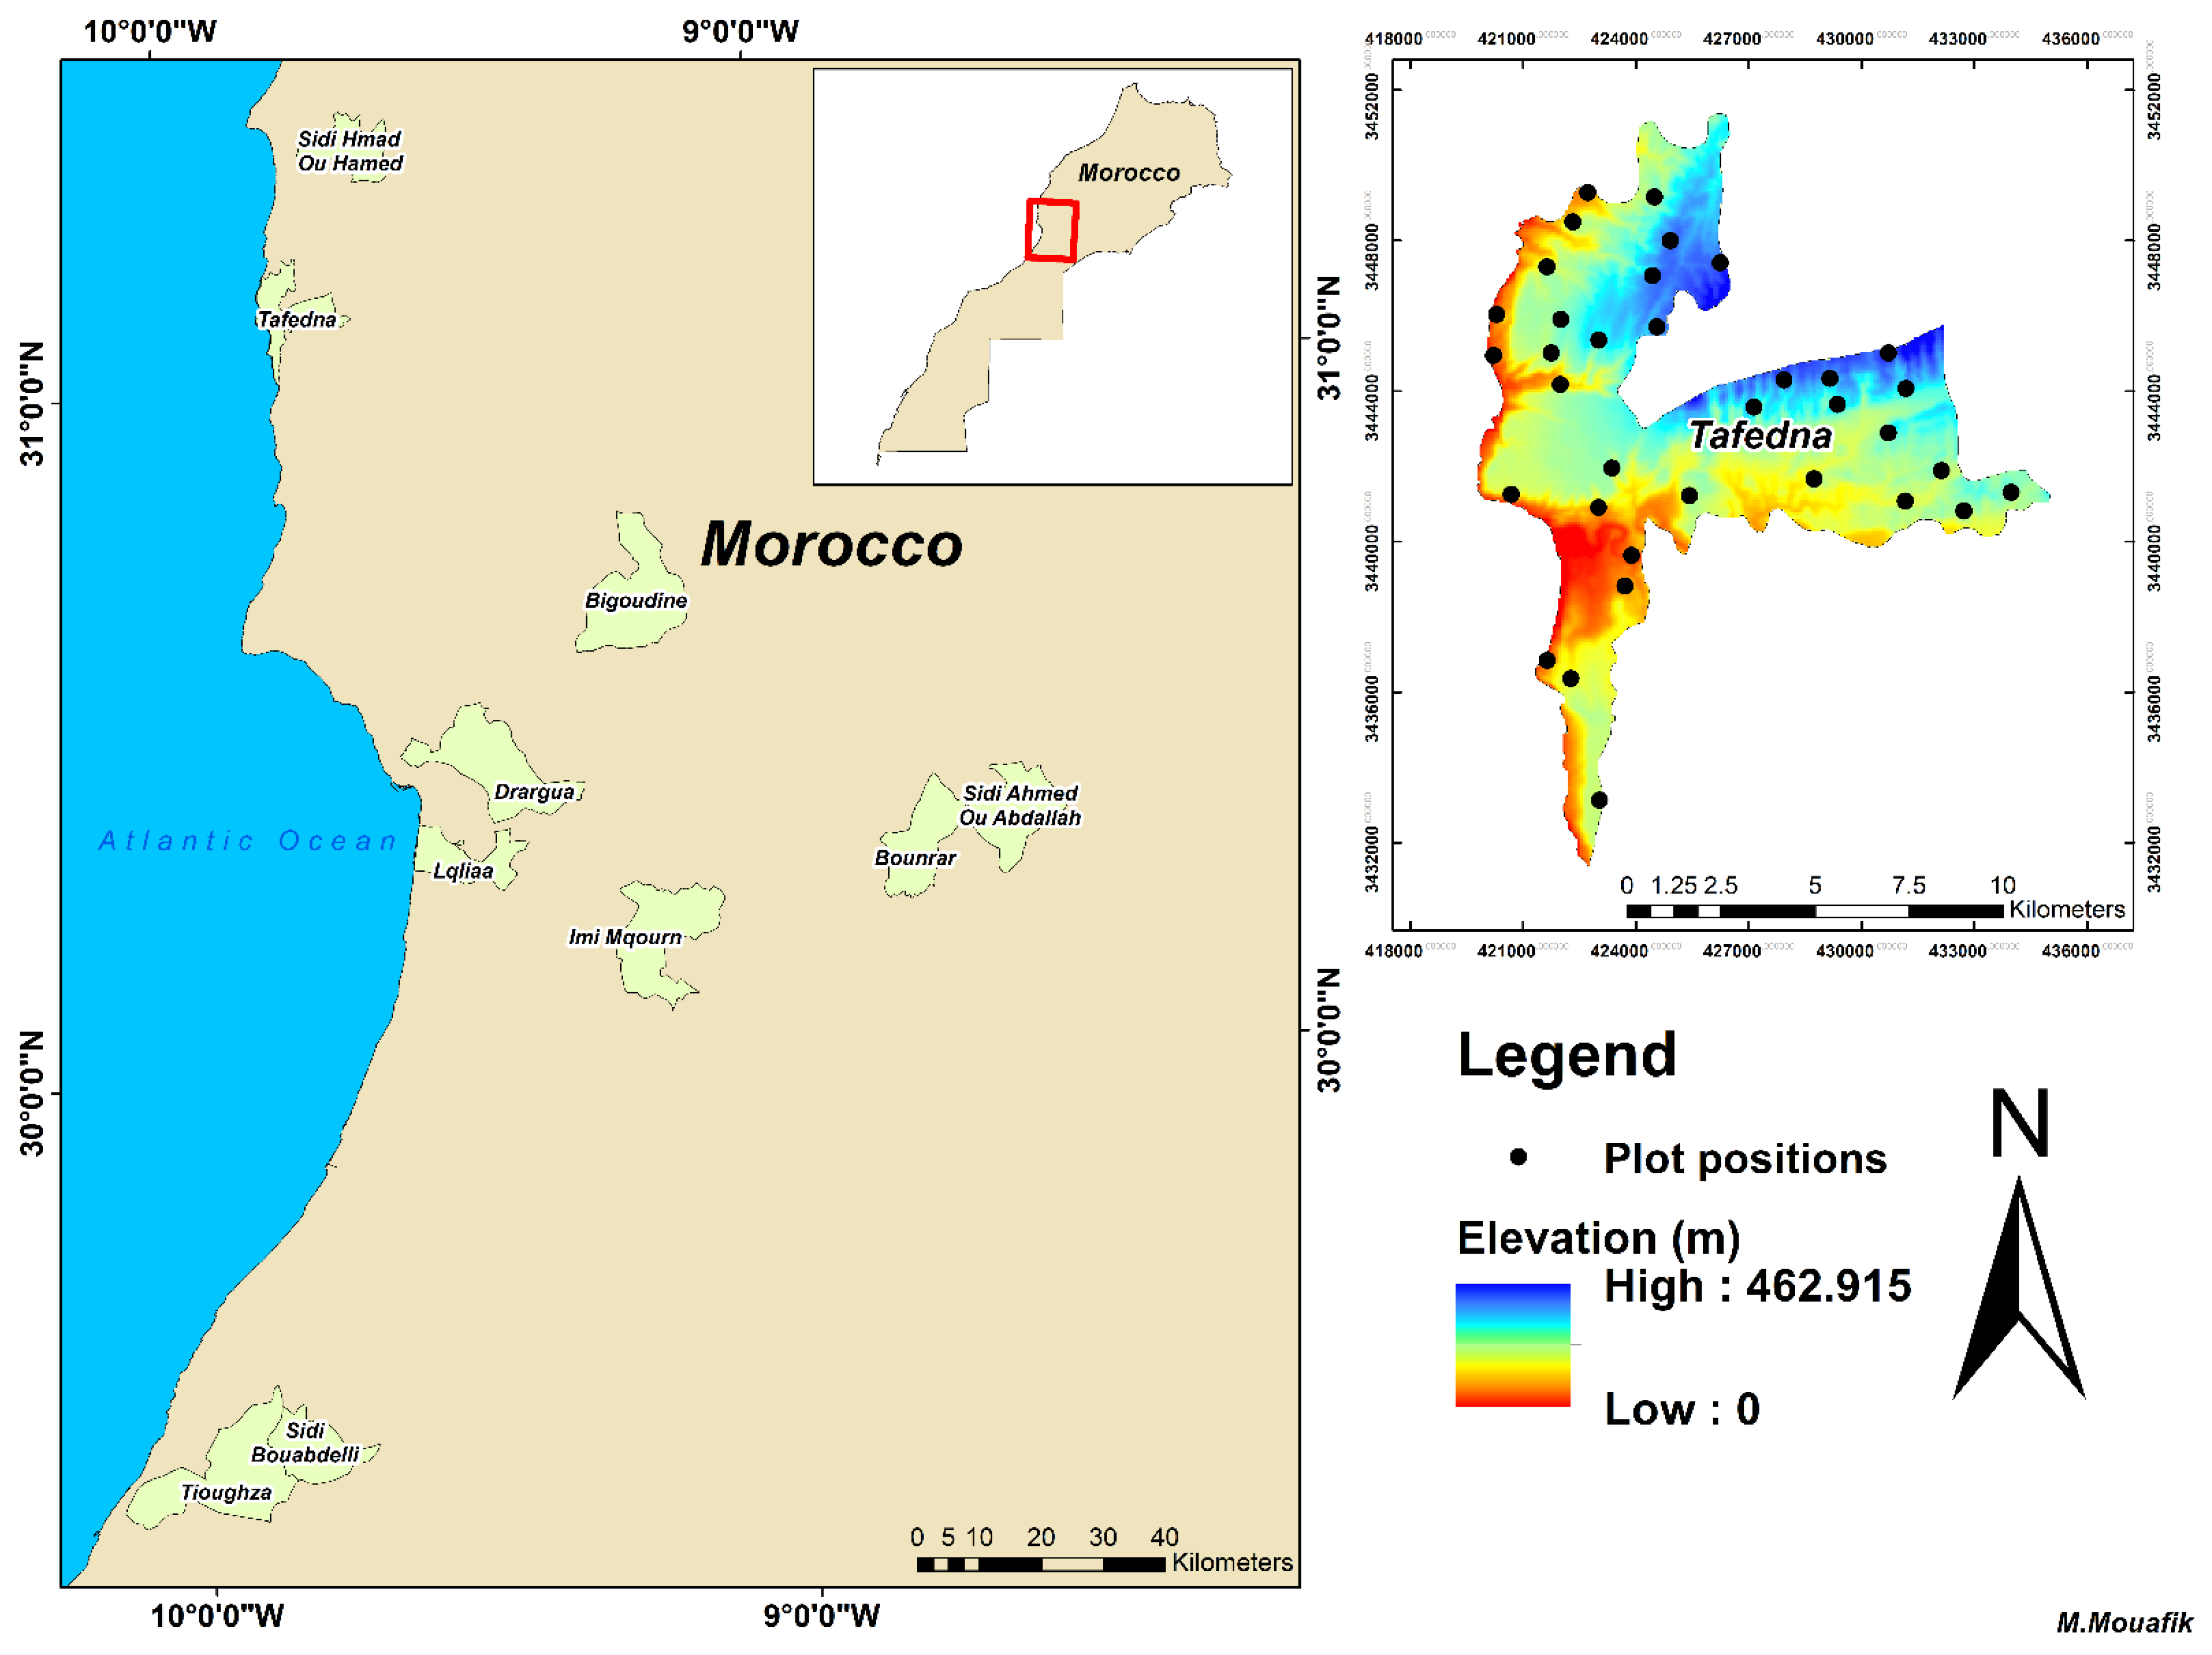
2.1. Study Areas

The study areas are distributed across ten chosen communes in southern Morocco: Tafedna, Sidi Hmad ou Hamed, Imi Mqourn, Lqliaa, Drargua, Sidi Ahmed ou Abdallah, Bigoudine, Bounrar, Tioughza and Sidi Bouabdelli (Figure 1). The municipalities of Essaouira province, including Tafedna and Sidi Hmad ou Hamed, are characterized by a semi-arid coastal environment marked by hills, valleys, agricultural cultivation and a significant density of Argane trees, along with Thuja. Drargua and Lqilaa experience coastal influences and fall within the semi-arid zone with notable Argane density. In the Taroudannt region (Bigoudine, Sidi Ahmed Ou Abdallah and Bounrar), the landscape is predominantly high-altitude mountainous terrain with an arid climate and minimal anthropogenic impact, hosting medium density Argane trees. Imi Mqourn exhibits strong agricultural activity in the flatlands, with natural Argane tree areas in elevated regions with low density. Tioughza and Sidi Bouabdelli, situated near the coast, share similar arid conditions, featuring moderate-density Argane trees surrounded by the elevated terrain of the western Anti-Atlas and limited human presence. Table 1 provides detailed locations for the study sites.

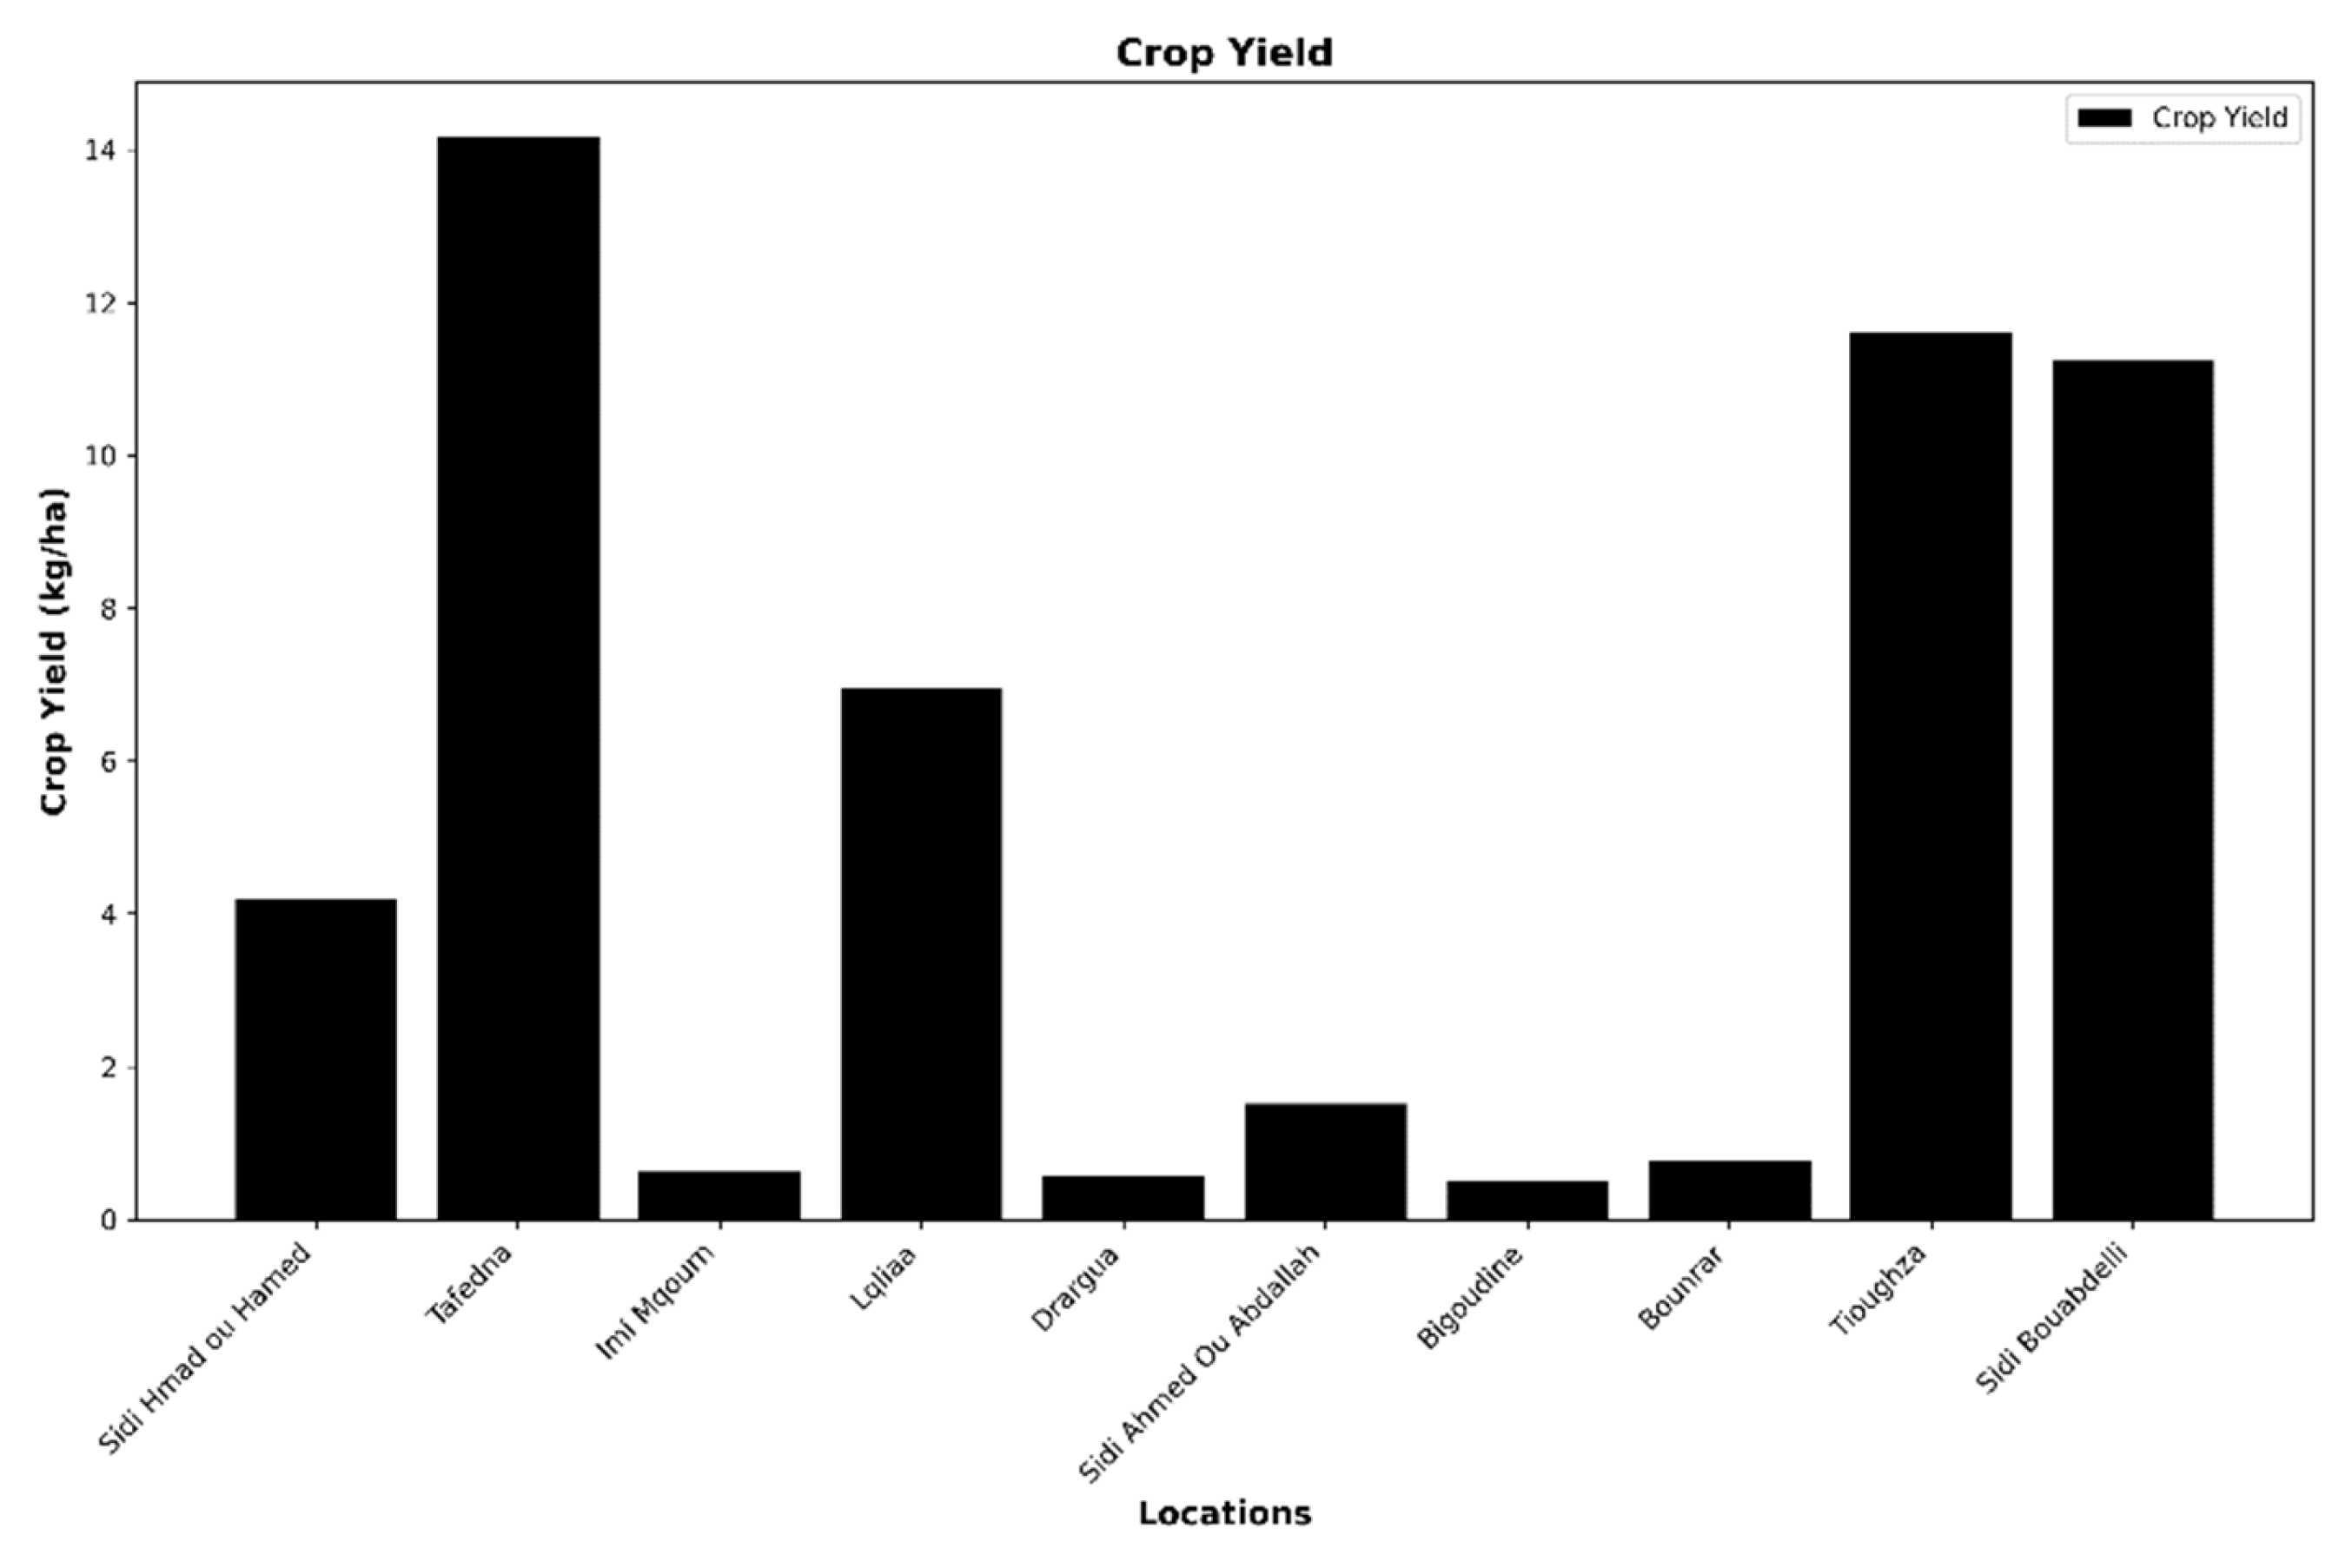
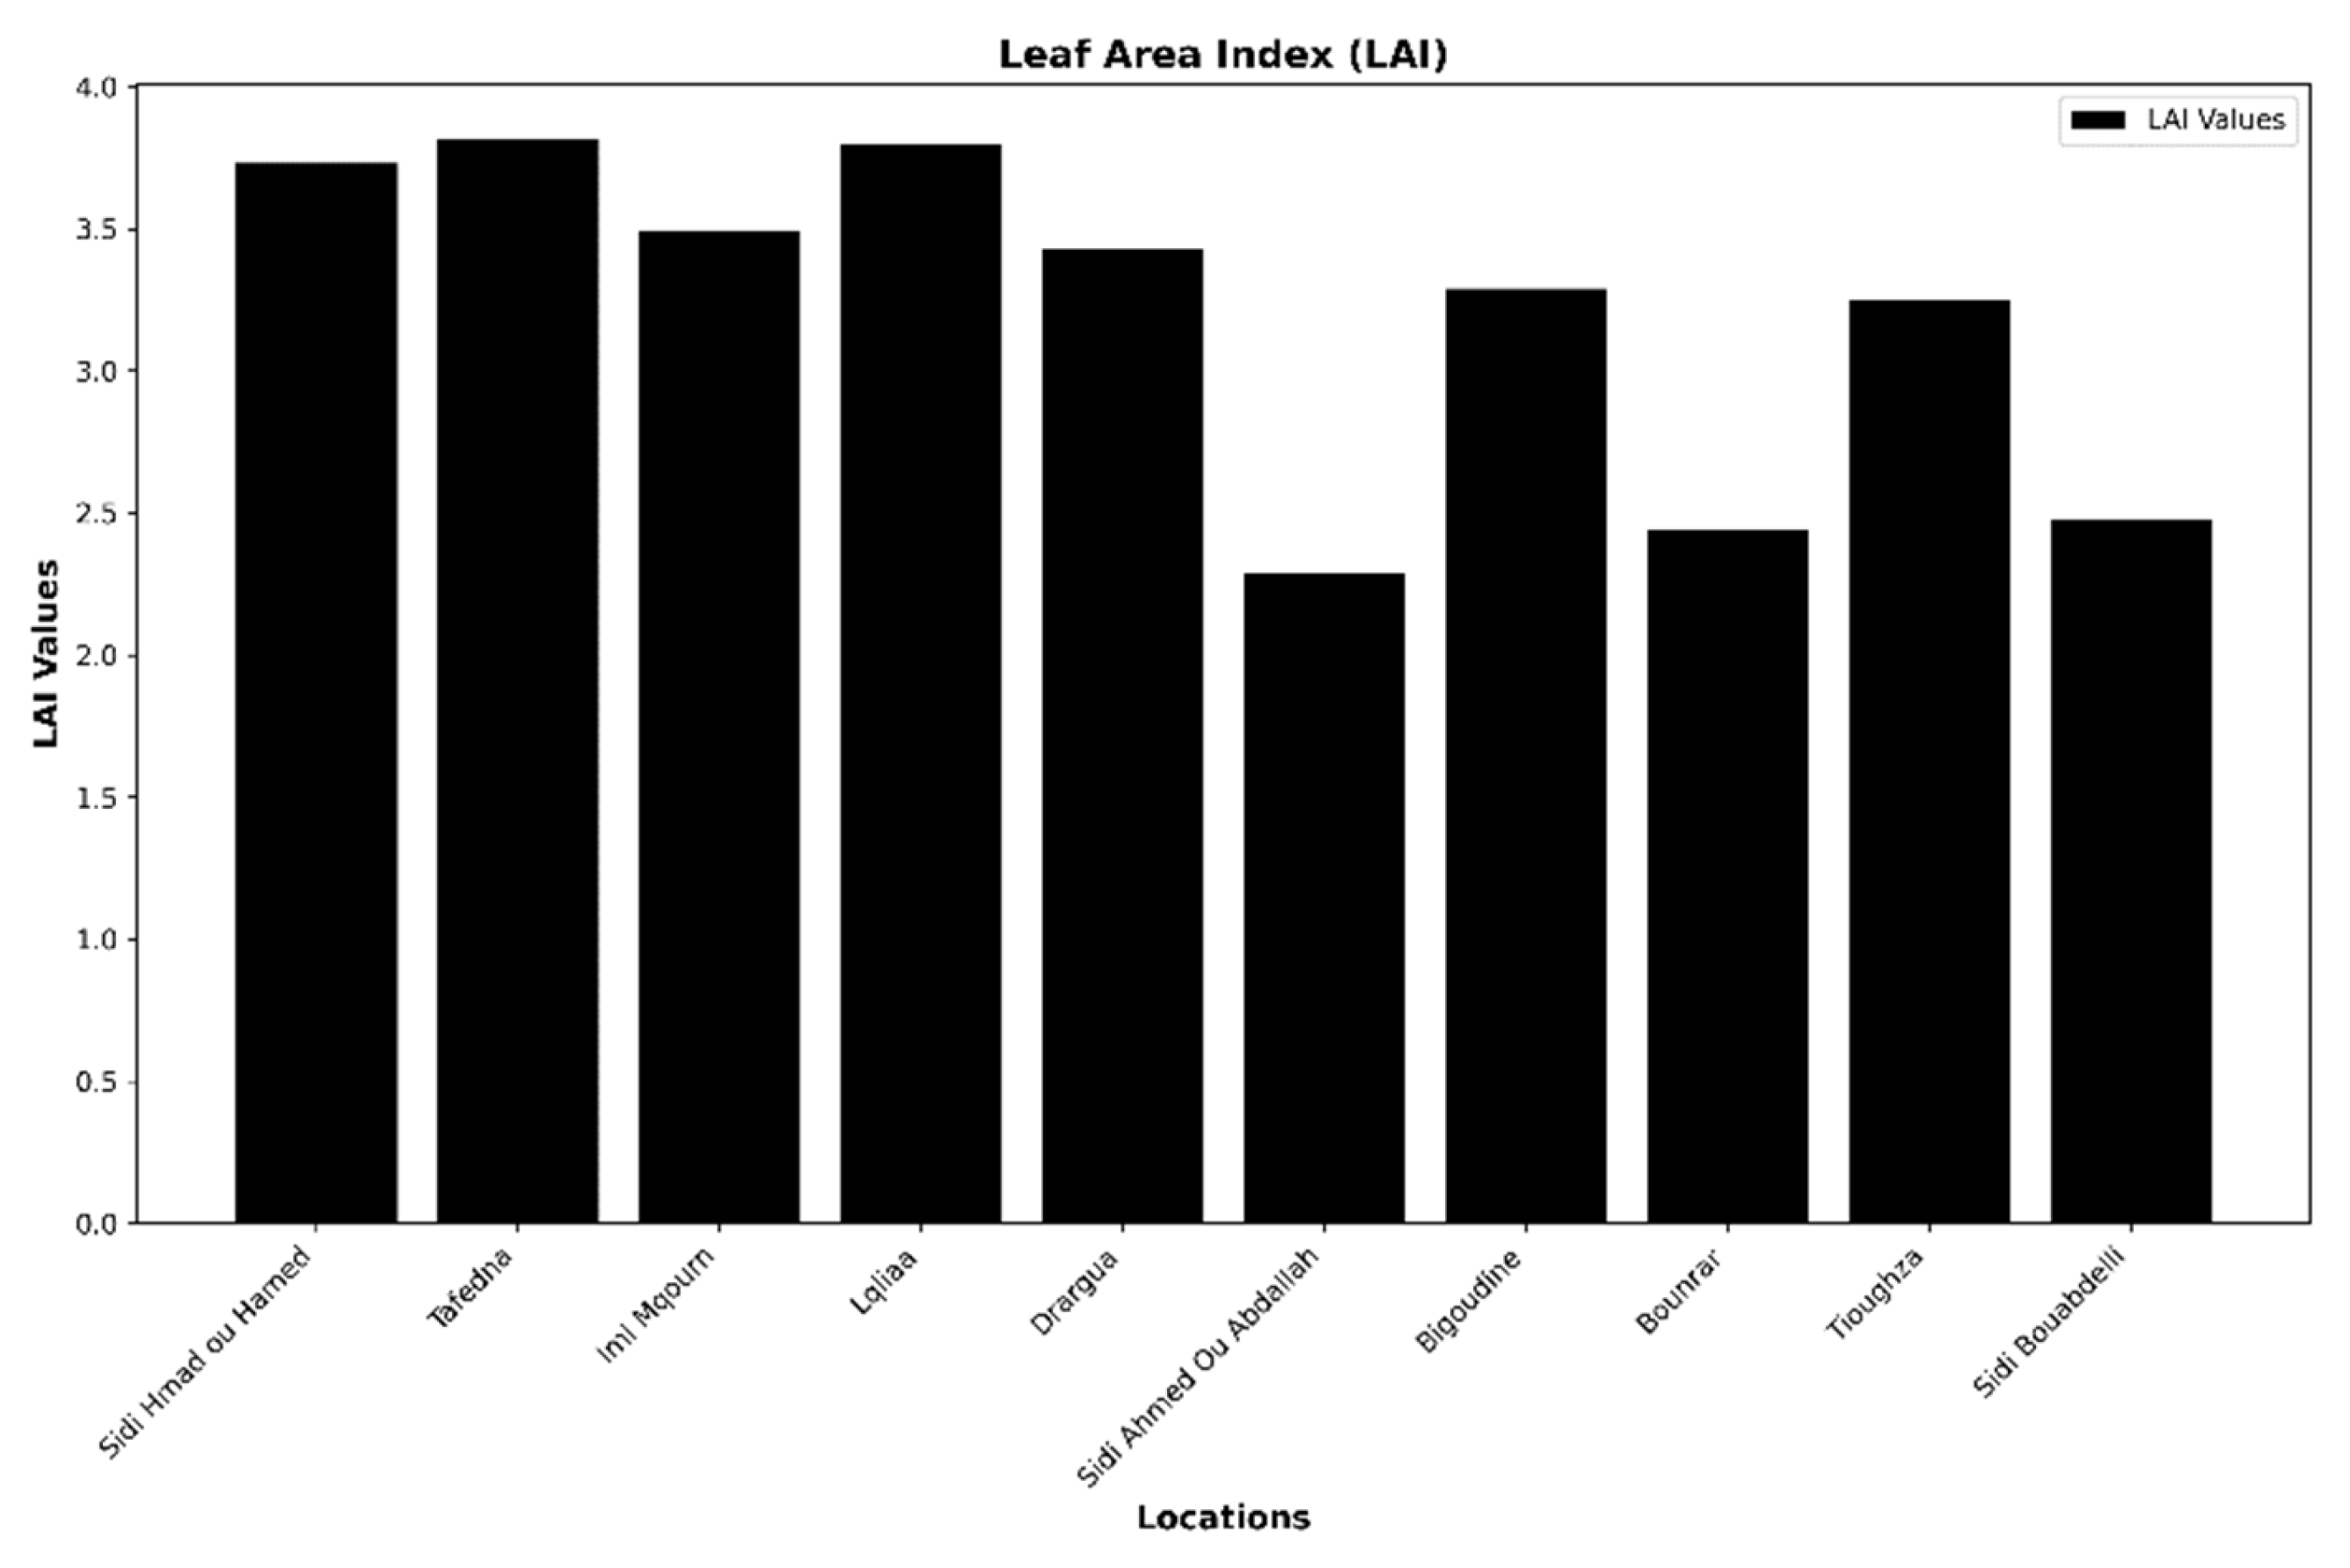
2.2. Field Measurements and Yield Data

Field measurements of crop yield and LAI assessments were carried out across n = 300 round sample plots with a radius r = 30 m, each containing three sampled trees, in July 2021. The precise locations within each plot were recorded using a handheld high-sensitivity GPS receiver (GARMIN GPSMAP 64s). Crop yield measurements for 2021 were performed during the harvest season within each plot using a digital field balance to measure the yield of each sampled fruit-bearing tree, with assistance from the rights holders and farmers in each plot across all selected study areas, to determine crop yield (kg) (Figure 2). For historical crop yield data on Argane stands, data were collected from various cooperatives of farmers and rights holders of Argane tree parcels in the Tafedna municipality. This was carried out to assess the quantity and quality of harvests from previous years (poor, mediocre, average, good or excellent) and to note apparent reasons for this quality. The collected data spanned from the agricultural year 2001 to 2021. LAI was assessed using two portable photosynthetically active radiation meters: an AccuPAR LP-80 (METER Group, Inc. USA, Pullman, WA, USA) and a LaiPen LP 110. The LAI assessments were conducted under specific weather conditions, specifically on clear, sunny days between 10 a.m. and 2 p.m. during the summer season. The process of LAI measurement comprised several steps: First, a reference sample of above-canopy radiation was obtained by measuring incoming radiation in an unshaded open field near the sampled tree canopy. Subsequently, the LP-80 device was carefully placed 1 m above the ground directly beneath the tree leaves, and four LAI values were systematically collected in various directions (north, east, west, south) and then used to calculate the mean LAI.

3. Datasets

3.1. CHIRPS Precipitation Data

CHIRPS V2.0 (Climate Hazards Group InfraRed Precipitation with Station data) is a precipitation dataset formulated by the Climate Hazards Group at UCSB, integrating satellite and ground station data to assist the United States Agency for International Development’s Famine Early Warning Systems Network, FEWS NET [21]. It provides high-resolution estimates (0.05 degrees) and covers the period from 1981 to the present, making it widely used in climate research and disaster management. In this study, the CHIRPS monthly precipitation dataset from January 2020 to June 2021 (for crop yield prediction) and Argane growth months (January–June) from 2001 to 2021 were acquired from the Climate Hazards Group website (accessible at https://www.chc.ucsb.edu/data/chirps; accessed on 8 July 2024) and downscaled to a resolution of 1 km.

3.2. NDVI Data

NDVI, known as the Normalized Difference Vegetation Index, stands out as one of the most commonly used vegetation indices for assessing crop yield and detecting drought situations. It is derived from the near-infrared (NIR) and red channels [13]. The NDVI data utilized in this study were obtained from the Terra Moderate Resolution Imaging Spectroradiometer (MODIS) operated by NASA in Washington, DC, USA. Specifically, monthly composite NDVI records with a resolution of 1 km (MOD13A3, collection v006) covering the duration from January 2020 to June 2021 (for crop yield prediction) and Argane growth months (January–June) from 2001 to 2021 were accessed using the Google Earth Engine platform, accessible at: (https://earthengine.google.com; accessed on 8 July 2024).

3.3. LST Data

MOD11A2 V6.1 is a product generated from MODIS (Moderate Resolution Imaging Spectroradiometer), providing an 8-day average of Land Surface Temperature and Emissivity (LST&E) at a spatial resolution of 1 km [22]. Every pixel value in MOD11A2 represents a straightforward mean of all the daily LST pixels acquired within that 8-day period. For this study, MOD11A2 LST (v6.1) data were collected using Google Earth Engine, covering the same studied period as the NDVI and CHIRPS data. Subsequently, the MOD11A2 8-day LST data were consolidated into monthly LST values spanning from 2001 to 2021.

3.4. Evapotranspiration Data

The MOD16A2 is a product derived from NASA’s MODIS (Moderate Resolution Imaging Spectroradiometer) sensor aboard the Terra satellite. The MOD16A2 V105 product presents 8-day worldwide terrestrial evapotranspiration at 1 km pixel resolution [23]. Evapotranspiration (ET) represents the combined processes of evaporation and plant transpiration from the Earth’s surface to the atmosphere. For our studies, MOD16A2 evapotranspiration data were acquired through the use of the Google Earth Engine, covering the same time frame as the NDVI, LST and CHIRPS datasets. Subsequently, the MOD16A2 8-day ET data were aggregated into monthly values spanning from 2001 to 2021.

3.5. Soil Moisture Data

SMAP (Soil Moisture Active Passive) is a satellite mission initiated by NASA in 2015 to evaluate the global distribution of soil moisture on Earth’s surface [24]. The SMAP data utilized in this study consist of the SMAP-derived 1 km resolution downscaled global daily surface soil moisture product version 1 from an L-band radiometer [25], obtained from the National Snow and Ice Data Center (NSIDC) at https://nsidc.org/data/nsidc-0779 (accessed on 8 July 2024). These data cover the period from January 2020 to June 2021 and were aggregated into monthly soil moisture values for this time frame.

3.6. DEM Data

The Digital Elevation Model (DEM) data were sourced from the NASA Shuttle Radar Topographic Mission (SRTM) at a resolution of 90 m, accessed through Earthdata at https://www.earthdata.nasa.gov/sensors/srtm (accessed on 8 July 2024). From the DEM data, aspect, slope and geolocation (latitude and longitude) variables were retrieved and resampled to a resolution of 1 km via the pixel averaging method to align with the NDVI data [26].

3.7. Rain Gauge Data

Monthly total precipitation data from six meteorological stations spanning the period from 2001 to 2021 were utilized in this research. The data, sourced from the Meteorological Directorate of Morocco, were employed to validate the final CHIRPS downscaled precipitation product. Annual precipitation was determined by combining the monthly precipitation measurements from every available rain gauge.

4. Methods

4.1. Drought Stress Indices

In this study, several drought stress indices were employed for predicting crop yield and the Leaf Area Index (LAI), including VCI, TCI, PCI, ETCI and SMCI. Each of these indices is detailed in Table 1. PCI serves as a meteorological drought indicator [13], while VCI, designed to account for local variations in ecosystem vigor, proves to be a more sensitive measure of vegetation drought stress compared to NDVI [13]. TCI assesses the impact of excessive humidity and temperature resulting from soil saturation on vegetation stress, as outlined by [27]. ETCI, on the other hand, reflects crop water deficits in agricultural regions [28]. For the period spanning from January 2020 to June 2021 (for crop yield prediction) and the growth months of the Argane trees (January–June) from 2001 to 2021, monthly datasets of PCI, VCI, TCI and ETCI were calculated across the study area. Additionally, SMCI is more suitable for tracking short-term drought patterns across extensive geographical areas [12]. A dataset of monthly SMCI spanning from January 2020 to June 2021 was generated. All these indices, ranging from 0 to 100, indicate variations in precipitation from highly unfavorable to ideal conditions (Table 2).

4.2. Agricultural Drought Condition Index

Assessing the significance of every variable within the combined model constitutes a pivotal stage in comprehensive drought parameter modeling. Drawing from the methodologies outlined by [29] in developing the integrated drought model, the random forest model was employed to assess the relative significance of the components comprising the CDI model (Figure 3). To ascertain the significance of each factor, four distinct combinations of explanatory variables, namely VCI, TCI, PCI and ETCI, were utilized as independent variables, with crop yield serving as the dependent variable within the random forest algorithm. Subsequently, the importance of each factor was quantified as a weight, which was then normalized to a uniform scale ranging from 0 to 100. This process facilitated the construction of a linear model representing the combined drought index, formulated as follows:
CDI = 0.11 × PCI + 0.15 × VCI + 0.47 × TCI + 0.27 × ETCI
Based on the drought classification schemes associated with drought indices, the CDI also delineates into five distinct classes (Table 3).
To validate the combined drought model developed for agricultural drought assessment, the Vegetation Health Index (VHI) and Standardized Precipitation Index (SPI-1) were employed. The VHI is derived from the Vegetation Condition Index (VCI) and Temperature Condition Index (TCI) environmental parameters, calculated as follows:
VHI = 0.50 × VCI + 0.50 × TCI
In this research, the SPI-1 was computed using meteorological station data covering the years 2001 to 2021. The calculation is as follows:
SPI = P   P m σ P
Here, P denotes precipitation value for the current month (mm), Pm represents historical average precipitation of the study timeframe (mm) and σ P signifies historical standard deviation of precipitation of the study timeframe (mm).

4.3. Machine Learning Algorithms

In this analysis, seven machine learning models using the scikit-learn library in Python [30] were employed using the Google Colab platform. These algorithms encompassed Extreme Gradient Boosting (XGBoost), Gradient Boosted Decision Trees (GBDT), Random Forest (RF), Decision Tree (DT), Support Vector Regression (SVR), Lasso Regression (LR) and an Artificial Neural Network (ANN). Their application aimed to model the intricate relationship between crop yield and the Leaf Area Index (LAI), incorporating various condition indices, for the prediction of crop yield and LAI.
Gradient Boosted Decision Trees (GBDT) is a machine learning model developed by [31]. It sequentially fits decision trees to the residuals of the previous trees, with every subsequent tree focusing on reducing the discrepancies of the earlier ones. It is highly effective for regression and classification tasks, capturing complex relationships in data with both numerical and categorical features. The GBRT model is excellent for efficiently managing complex predictions with speed and accuracy.
Random Forest (RF) is an ensemble learning approach proposed by [32], renowned for its versatility in both classification and regression tasks [33]. This method combines multiple decision trees, each created using a random sample of the training data and features. By incorporating diversity and robustness into the model, Random Forest aggregates the predictions of individual trees to produce the final output [1].
XGBoost, short for Extreme Gradient Boosting, utilizes the feedback provided by prior grown trees to construct further trees, aiming to minimize errors in subsequent iterations [34]. It is widely used for classification and regression due to its speed, scalability and high performance.
Decision Tree (DT) is a machine learning model that divides data into groups according to feature values, constructing a tree hierarchy of decisions [35]. It selects the best feature at each node to split the data, aiming to maximize information gain. Finally, it predicts outcomes at the leaf nodes through averaging.
Support Vector Regression (SVR) is a machine learning approach for regression purposes. It finds the hyperplane that best fits the data while maximizing the margin, making it effective for handling complex datasets with nonlinear relationships [36]. SVR functions on a similar principle to the Support Vector Machine (SVM) [7].
Lasso Regression (LR), known as the Least Absolute Shrinkage and Selection Operator, is a regression analysis technique used for variable regularization and screening. It imposes a penalty on the absolute size of coefficients, particularly those associated with less significant features in the dataset, effectively shrinking some coefficients towards zero to emphasize the retention of better features [37].
Artificial Neural Networks (ANNs) are a class of machine learning algorithm influenced by the human brain’s neural architecture. ANNs involve interconnected nodes structured in layers, including input, hidden and output layers [38]. An ANN can learn complex patterns and relationships from data, making them versatile for various applications such as classification, regression and pattern recognition.

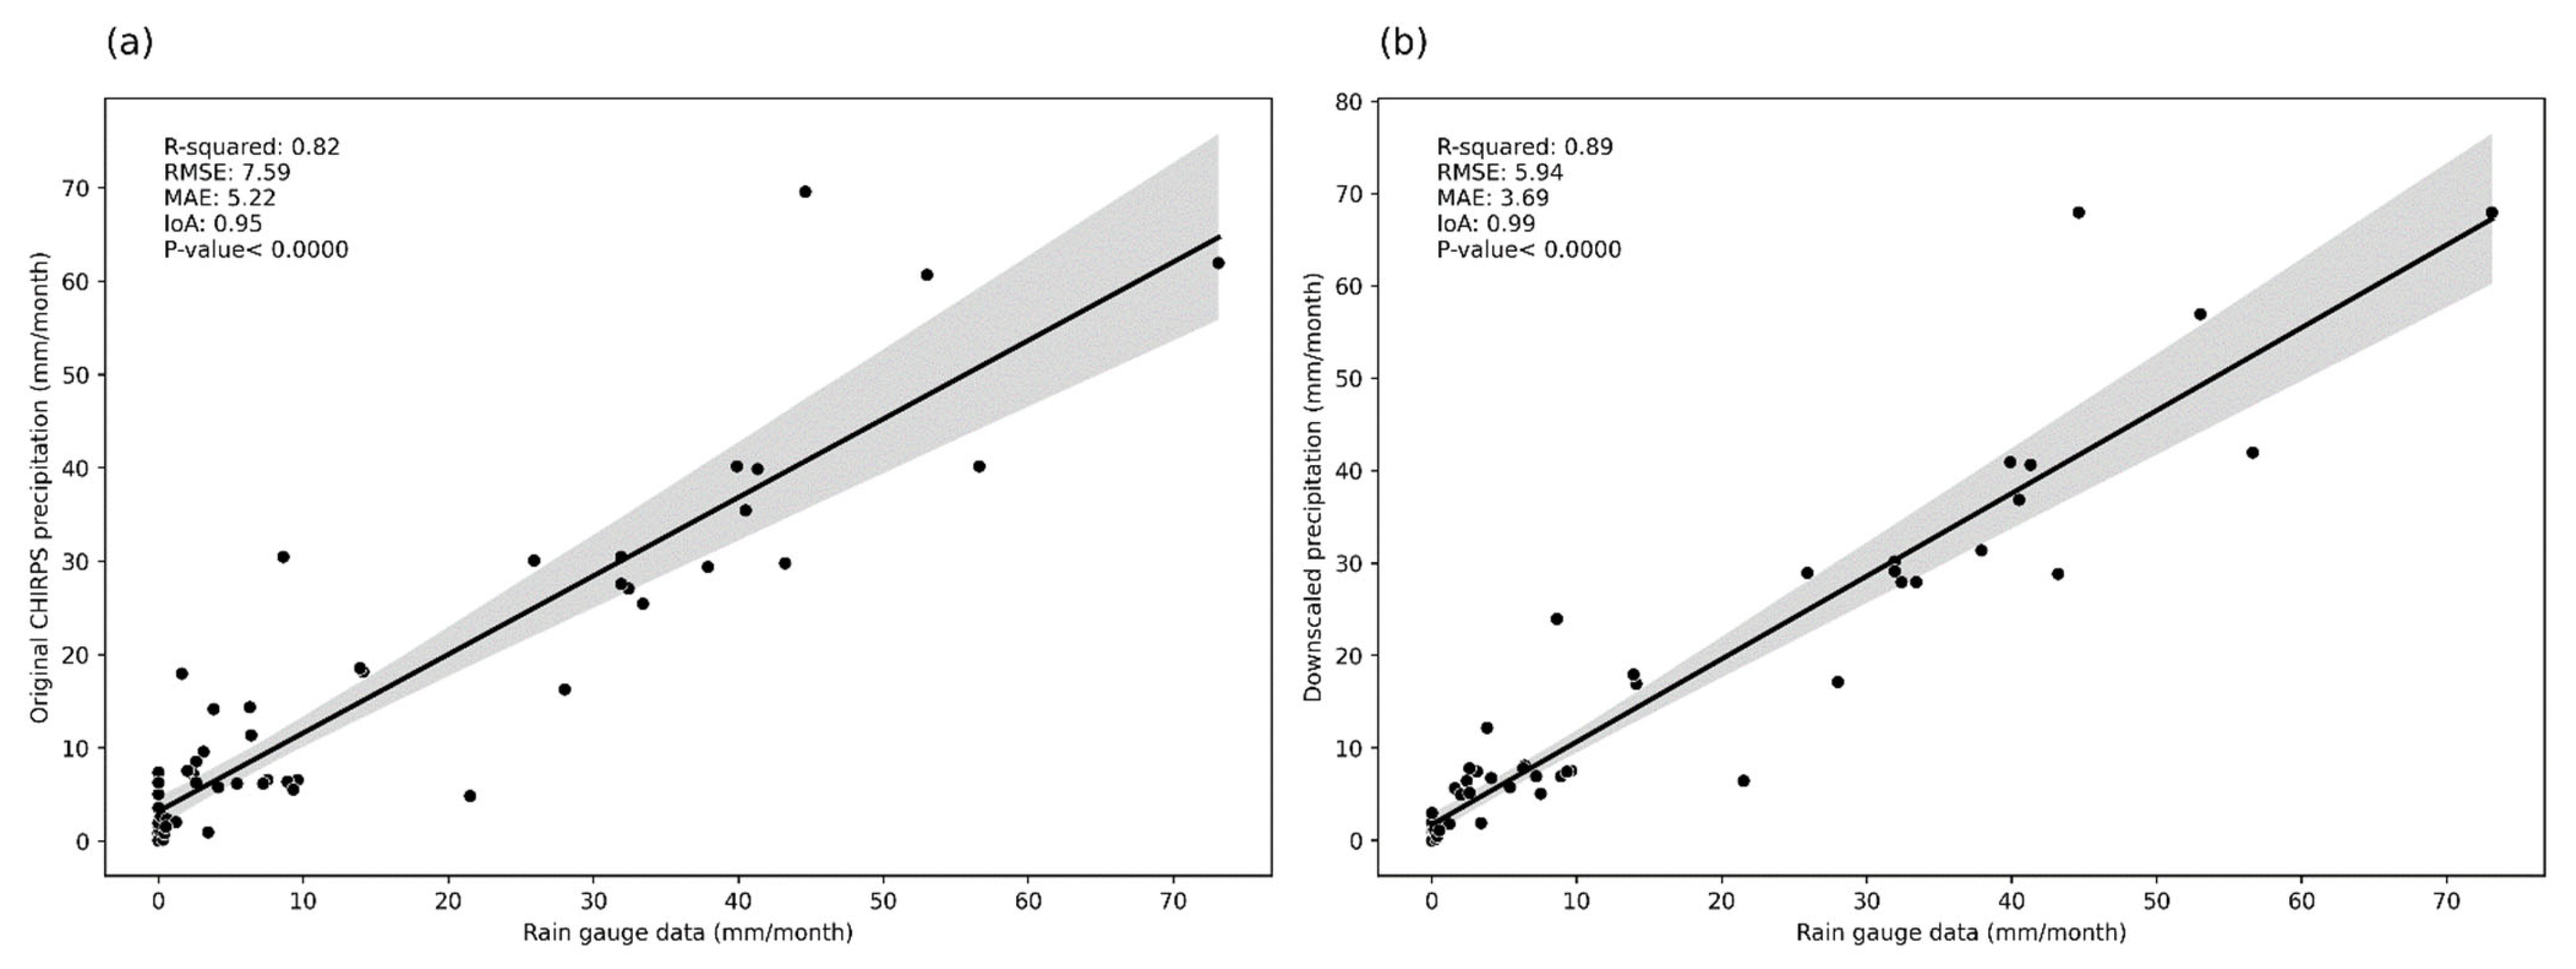
4.4. Downscaling of Original CHIRPS Precipitation Data

Using the RF model, we established functional relationships between CHIRPS data and NDVI and DEM to downscale CHIRPS precipitation. The downscaling process involved several steps:
  • Re-sampling original predictors such as elevation, aspect, slope, longitude, latitude and NDVI from 1 km resolution to 0.05° resolution using pixel averaging. These were then reprojected to the same projection as CHIRPS data.
  • Establishing relationships within the resampled environmental factors and CHIRPS precipitation data via a random forest regression model. This provided an estimated monthly precipitation at the 0.05° scale.
  • Computing residual precipitation estimates with a spatial resolution of 25 km by subtracting predicted CHIRPS monthly precipitation from original CHIRPS monthly data.
  • Interpolating the precipitation residuals from 25 km to 1 km using the algorithm of spline tension [39,40].
  • Generating CHIRPS monthly precipitation at 1 km from environmental variables at 1 km data using the nonparametric regression equation obtained in step 2.
  • Correcting CHIRPS downscaled precipitation results by incorporating the 1 km resolution residual to 1 km downscaled precipitation.

5. Accuracy Evaluation

The efficacy of the estimation models was evaluated using metrics such as the coefficient of determination (R2), index of agreement (IA), root-mean-square error (RMSE) and mean absolute error (MAE). These metrics help assess the accuracy and quality of fit of the models by evaluating their capability to describe an observed dataset and the accuracy of their forecasts. The dataset was split randomly into an 80% training set and a 20% testing set to evaluate model performance.
The R2, IA, RMSE and MAE were computed using the following equations:
R 2 = 1 i = 1 n ( O i P i ) 2 i = 1 n ( O i O ¯ i ) 2
RMSE = i = 1 n ( O i P i ) 2 n
MAE = i = 1 n | P i O i | n
IA = 1 i = 1 n ( | O i P i | ) i = 1 n ( | O i O ¯ i | )
In the given formulas, Pi represents the predicted result, Oi denotes the observed outcome, O ¯ i signifies the mean of all observed outcomes and n indicates the total number of observations.

6. Results and Discussion

6.1. Spatial Downscaling of CHIRPS Precipitation Data

Figure 4 depicts the original 0.05° resolution CHIRPS precipitation alongside the 1 km spatial resolution downscaled precipitation dataset for the year 2020, achieved through random forest algorithms. The residual maps showcased in Figure 4 indicate the unexplained precipitation amount remaining after regression analysis. Additionally, the spatial distribution of downscaled annual CHIRPS precipitation is derived by combining 1 km predictive annual precipitation data with 1 km residuals. The year 2020 was selected as a comprehensive instance to evaluate the effectiveness of the developed approach in downscaling CHIRPS precipitation. The results indicated that while both the CHIRPS dataset and downscaled data exhibited comparable spatial distributions, the downscaled 1 km CHIRPS data provided enhanced resolution, enabling more detailed information display.
To evaluate the effectiveness of our downscaled model using random forest, we compared the downscaled CHIRPS data with weather station records (RGS) spanning from January 2020 to June 2021. Figure 5 displays scatterplots depicting CHIRPS data against weather station observations, revealing R2, RMSE and MAE values of 0.82, 7.59 mm and 5.22 mm, respectively, which tended to overestimate precipitation compared to rain gauge observations [40,41]. Furthermore, Figure 5 illustrates weather station observations (RGS) alongside the downscaled CHIRPS data post-residual corrections. Following these corrections, R2 increased by 0.07, RMSE decreased by 1.65 mm and MAE by 1.53 mm (R2 = 0.89, RMSE = 5.94 mm and MAE = 3.69 mm). These adjustments rendered the downscaled CHIRPS data more aligned with actual rainfall observations from weather stations, underscoring the significance of this correction process in enhancing downscaling accuracy. The increased R2 suggests that downscaled CHIRPS outperformed CHIRPS precipitation data, while reduced RMSE and MAE values indicate improved performance. Figure 6 depicts the significance of predictor variables for the RF algorithm. Among these, elevation, longitude and NDVI emerged as primary contributors to downscaling CHIRPS precipitation in our study area, followed by aspect and slope variables.
In this research, we explored the efficacy of random forest methodologies for downscaling a CHIRPS precipitation dataset from 0.05° to a 1 km resolution across the distribution area of Argane forest stands. This involved establishing regression relationships between CHIRPS precipitation and various environmental variables. Our findings indicated that random forest algorithms performed effectively in predicting CHIRPS precipitation data at 1 km resolution. These results are consistent with the conclusions reached by [41], who demonstrated that RF regression resulted in superior R2, RMSE and MAE values for predicting annual TRMM 3B43 precipitation across continental China at a 1 km spatial resolution compared to exponential and multiple linear models. Validation against precipitation datasets from meteorological stations further substantiated the effectiveness of the RF algorithm, which exhibited lower error rates compared to alternative statistical regression models [41,42]. Additionally, Zhao et al. [33] reported that the RF model excelled in downscaling original TRMM product datasets, achieving notably high accuracy compared to the CART model when incorporating NDVI and DEM data. Similarly, Retalis et al. [43] employed artificial neural networks (ANN) to downscale CHIRPS datasets using altitude and NDVI, while Elnashar et al. [16] applied ANN for TRMM precipitation downscaling.
Through importance analysis, it was revealed that elevation, longitude and NDVI play crucial roles in downscaling CHIRPS precipitation patterns across the southwest region of Morocco. These factors were followed by aspect, slope and latitude in terms of their influence. Topographic factors such as elevation, aspect and slope were identified as significant contributors to downscaled precipitation [41]. While NDVI is a strong predictor of precipitation in semiarid and arid regions [40], its importance lessens in humid areas [41]. NDVI-based downscaling approaches are limited to terrestrial surfaces and cannot be applied to urban areas and water bodies with negative values [40]. Numerous studies have underscored the impact of orographics on the spatial variation of rainfall, integrating it into the downscaling procedure [26]. Slope and aspect also improve precipitation prediction accuracy due to their correlation with the prevailing wind orientation [41]. Elevation exceeds NDVI in terms of importance, particularly in arid, semi-arid and humid regions, due to mountain-induced uplift precipitation patterns and/or saturated NDVI values [16,40,41]. Precise precipitation measurements at precise temporal and spatial resolutions are critical for land surface and water management, as well as for predicting droughts and floods [16,44].

6.2. Construction of Crop Yield and LAI Estimation Model Based on Drought Indices

A study was undertaken to evaluate the effectiveness of different machine learning algorithms, namely XGBoost, GBDT, RF, DT, SVR, LR and ANN, in predicting the Leaf Area Index (LAI) and crop yield. The outcomes of the XGBoost model are illustrated in Figure 7, while a detailed comparison of model prediction accuracy is presented in Table 4. Based on a five-fold cross-validation (cv = 5) analysis, it was observed that among the seven models assessed, the R2 values for both training and overall datasets ranged from above 0.5 to as high as 0.94, except for SVR, which yielded an R2 value of 0.21. Notably, the test sets displayed values ranging between 0.25 and 0.67, indicating favorable performance in LAI and crop yield estimation for Argane trees.
The XGBoost algorithm exhibited superior performance compared to other algorithms in estimating LAI and crop yield for Argania spinosa. Alongside GBDT and RF, the XGBoost model demonstrated efficient crop yield estimation, particularly when incorporating drought indices as input variables. Specifically, the XGBoost model achieved R2 values of 0.93 and 0.60 for the training and testing sets, respectively, with corresponding RMSE values of 6.86 kg/ha and 16.33 kg/ha, and MAE values of 1.36 kg/ha and 7.30 kg/ha. Moreover, the overall dataset maintained a strong R2 value of 0.94, signifying robust model fitting. The reduced RMSE (6.25 kg/ha) and MAE (1.44 kg/ha) further underscored improved prediction accuracy. Regarding crop yield estimation, both XGBoost and GBDT models displayed comparable performances across various metrics, except for the R2 value of the testing set, with XGBoost at 0.93 and GBDT at 0.44. For random forest, an R2 value of 0.87 and 0.56 was observed for the training set and testing set, respectively, highlighting a significant correlation among measured and predicted crop yield values. However, RMSE and MAE values were relatively higher, reflecting slightly diminished prediction accuracy. Specifically, the RMSE stood at 9.17 kg/ha and 17.17 kg/ha, while the MAE was 3.57 kg/ha and 7.87 kg/ha, respectively. Expanding the training dataset to 100% for the RF model yielded enhanced accuracy, with an R2 value of 0.88, reduced RMSE (8.72 kg/ha), and MAE (3.31 kg/ha) for crop yield estimation. In predicting LAI for Argane trees, both the XGBoost and GBDT models demonstrated the highest accuracy, with identical R2 values of 0.64 for the training set and 0.38 for the testing set. The RMSE values were 0.65 and 0.93 for XGBoost and 0.68 and 0.94 for GBDT, respectively. This suggests that XGBoost and GBDT are the optimal models for the LAI and crop yield estimation of Argania spinosa, followed by the random forest algorithm.
The monitoring of crop yield and the Leaf Area Index (LAI) is pivotal for assessing the growth and health of Argane forest stands, aiding in sustainable development and decision-making against abiotic stressors. With the advent of remote sensing technologies, there is a growing need for efficient, accurate and robust machine learning (ML) algorithms to handle high-dimensional data across various applications. Among the seven ML models studied, the crop yield estimation model generally exhibited higher R2 values for both the training and testing sets compared to LAI estimation, aligning with previous findings [5]. Similarly, the RMSE and MAE values for crop yield estimation were notably greater than those for LAI estimation due to the sensitivity of RMSE values to magnitude, as noted by [5]. Utilizing XGBoost, RF and GBDT models for crop yield and LAI estimation and incorporating drought indices, including VCI, PCI, TCI, ETCI and SMCI as independent variables, yielded robust and favorable results for estimating Argane tree traits compared to other algorithms. The higher accuracy of GBDT-, RF- and XGBoost-based crop yield prediction models compared to LAI estimation models can be attributed to their decision tree nature [5]. RF demonstrates resilience against overfitting and noise, albeit with longer training times compared to similar algorithms [45]. Jhajharia and Mathur [18] conducted a comparison of four ML algorithms (RF, DT, SVR and LassoR), indicating that RF and DT outperformed other algorithms in predicting crop yield. This observation aligns with findings by [46], who emphasized the superior accuracy of RF algorithms compared to SVR, ANN and K-NN. Similarly, Kuradusenge et al. [7] reached a similar conclusion in their study with maize and Irish potatoes. The most commonly utilized algorithms for crop yield prediction are RF, ANN and SVR, as highlighted by [19]. Sharifi [47] achieved promising results in barley yield prediction using DT algorithms and vegetation indices, along with drought indices. Pham et al. [14] showed the notable advantages of employing PCA-machine learning regression for crop yield estimation, leveraging VCI and TCI data. Similarly, Prasad et al. [6] utilized LST, SPI, VCI and historical yield data as predictors for the RF model in cotton yield estimation. Abbas et al. [48] demonstrated that SVR models outperformed others in predicting potato tuber yield. The estimation of LAI is an important indicator of tree health, requires diverse methodologies and algorithms tailored to specific vegetation types and imaging technologies. For instance, Mouafik et al. [1] employed random forest to estimate the LAI of Argania spinosa, utilizing vegetation indices from drone and Mohammed VI imagery, achieving a higher R2 compared to Sentinel 2 data. Similarly, Mao et al. [49] showcased the resilience of random forest models in retrieving the cotton LAI. Yuan et al. [50] carried out a comparative analysis of ANN, SVM and RF regression models for estimating the LAI of soybean, concluding that RF is well-suited for such estimations. Zhang et al. [20] affirmed that XGBoost models perform optimally in the LAI estimation of winter wheat using drone imagery due to their fast-processing speed and effectiveness in handling large-scale data. In terms of specific applications, the XGBoost algorithm emerges as a top choice, renowned for its rapid computation rate and accuracy, particularly for handling low- and medium-dimensional data in open-source environments, although it is yet to be widely utilized in forestry domains. Wang et al. [5] demonstrated the precision of XGBoost, RF and GBDT models in LAI estimation, achieving R2 values above 0.8 for LAI in C. camphora, and similar results were observed for predicting maize yield [51], a finding supported by [49] in cotton LAI retrieval. In summary, these ML algorithms exhibit the capability to establish efficient, accurate and robust estimation models for predicting crop yield and LAI. However, the choice of suitable algorithms is determined by specific applications and domains.

6.3. Correlation Analysis

The correlation coefficients among the drought indices and the crop yield and LAI of Argane trees are presented in Figure 8 as a heatmap, generated using the Seaborn library in Python 3.10.12 on the Google Colab platform. The results indicated numerous correlations between environmental variables and both LAI and crop yield. Notably, LAI and ETCI exhibited a positive correlation, each with a coefficient of 0.44. Additionally, a positive correlation was identified among VCI and TCI (r = 0.41). A high correlation has also been found between VCI and SMCI, with a coefficient of 0.50, while slight positive correlations were noted between crop yield and SMCI (r = 0.15), as well as LAI (r = 0.13) and between SMCI and LAI (r = 0.22). Conversely, negative correlations were observed between ETCI and PCI (r = −0.29) and between ETCI and crop yield (r = −0.20). The moderate correlation between LAI and ETCI can be attributed to higher LAI, which indicates a denser canopy. This leads to increased transpiration rates due to a larger surface area for water vapor exchange, raising leaf temperature and humidity by intercepting more solar radiation, thereby enhancing evapotranspiration. Evapotranspiration encompasses both water evaporation from the soil and transpiration from plants. Moreover, increased LAI results in more transpiring leaves, and a denser canopy helps maintain higher soil moisture by reducing direct soil evaporation through shading. Secondly, VCI serves as a crucial drought indicator utilized to evaluate the effects of drought on agricultural areas [52]. The moderately positive correlation between VCI and TCI can be attributed to higher VCI values that indicate better vegetation health, usually associated with adequate moisture and favorable growing conditions. Simultaneously, higher TCI values signify cooler temperatures that are conducive to plant growth, productivity and lower evapotranspiration stress, whereas lower TCI values indicate hotter conditions that can lead to drought. Prasad et al. [6] similarly found a negative correlation between VCI and LST, indicating that higher temperatures lead to droughts, which in turn decrease crop yield. Several studies have shown a significant positive correlation between TCI and VCI, useful for monitoring drought events [11,52,53]. Moreover, the positive correlation between VCI and SMCI, as well as LAI and SMCI, can be understood through the interdependence of vegetation health on soil moisture availability. When soil moisture levels are high, plants perform physiological processes more efficiently, leading to healthier vegetation and higher LAI and VCI values. This is consistent with [54], who found a positive correlation among SMCI and VCI (r = 0.89). These relationships are illustrated through the heatmap plots presented in Figure 8.

6.4. Drought Monitoring

6.4.1. Agricultural Drought Monitoring Using CDI

In this investigation, agricultural drought conditions in the Argane stands region of Morocco, spanning from 2001 to 2021, were assessed using the Combined Drought Index (CDI) approach. The findings depicted in Figure 9 indicate that the CDI effectively captures drought characteristics, including severity, duration, occurrence, and intensity and corresponds closely with historical drought records in the Argane stands region.
According to the CDI results, the index successfully identified significant drought years within the study period. The years with the most severe droughts were 2001, 2006, 2007, 2012, 2014, 2018, 2019, 2020 and 2021, as illustrated in Figure 8. Notably, 2014, 2018, 2019, 2020 and 2021 experienced extreme drought intensity, resulting in reduced yields of −5, −47, −175.25, −191.3 kg/ha and −187.5 kg/ha, respectively, in comparison to the 20-year mean yield per hectare. Figure 9 highlights that the most severe drought year from 2001 to 2021 was 2007, characterized by extreme to moderate drought conditions, surpassing the drought intensity of 2001. The most sensitive and affected areas during these drought years were the south-central and eastern extremities of Tafedna, compared to other areas. Over the last three years of the study, drought conditions deteriorated from moderate to extreme. The drought in 2018 was more severe than in 2014, marked by severe to extreme drought intensity across the Argane growth season, leading to a significant reduction in crop yield due to prolonged drought and minimal precipitation. The entire Tafedna municipality experienced severe drought stress from the western coastal side to the eastern inland areas in 2018, resembling the conditions observed in 2014, but with less dominance in the northern and southern coastal regions. In 2020, drought stress spread from the south-central area to the entire eastern part, characterized by moderate altitudes and foothills. This region became more vulnerable to drought than in 2019 due to its elevations, which have poorly drained soils and retain less water. The drought patterns in 2019 and 2020 were similar, affecting the same regions. During this period, the northern side of the Tafedna commune during this period showed less severe drought stress due to its high density of Argane strands and proximity to the sea, which moderates the climate and provides moisture, contributing to reducing drought conditions. Our results indicate that the CDI index was effective in monitoring agricultural drought conditions in Tafedna from 2001 to 2021 (Figure 10). Based on the drought classification schemes outlined in Table 3, we observed varying degrees of drought severity across different years, attributed to climatic changes. This analysis highlights temporal changes in drought intensity and aids in understanding the resilience and vulnerability of the region to drought stress.

6.4.2. Validation of Results

To demonstrate the effectiveness of the proposed Combined Drought Index (CDI) in drought monitoring, we conducted a validation experiment comparing it with meteorological and agricultural drought indices. This experiment involved a year-by-year assessment, comparing CDI with the Vegetation Health Index (VHI), crop yield, and Standardized Precipitation Index (SPI-1) to assess the precision of the model. The results revealed a strong positive correlation among CDI and VHI (r = 0.83) during the growth period of Argane trees from 2001 to 2021 (Figure 8 and Figure 11), with a statistically significant p-value < 0.001. Both CDI and VHI identified the driest years (2001, 2006, 2007, 2012, 2014, 2018, 2019, 2020 and 2021) and the wettest years (2002, 2009, 2011, 2013, 2015, 2016 and 2017). Furthermore, CDI indicated non-drought conditions (CDI > 40) for 2003, 2005 and 2010, while VHI indicated drought conditions (VHI < 40) during the same periods. This disparity can be attributed to VHI not incorporating direct precipitation and evapotranspiration data. Furthermore, CDI was validated against a yearly crop yield dataset for the study duration of 2001 to 2021 (Figure 12), showing a statistically significant correlation (r = 0.49, p-value < 0.05), consistent with the findings documented by [55], who observed a correlation of 0.5 between the CDMI and maize crop yield. This moderately positive correlation suggests an increase in drought stress due to low precipitation and soil moisture during the active growing periods of Argane trees. Furthermore, in the evaluation of CDI, a significant correlation was observed when comparing it with the SPI-1 meteorological drought index (p-value < 0.001). Specifically, strong correlations were found for January (r > 0.47), February (r > 0.66) and March (r > 0.8), with a moderate correlation of 0.3 observed for April and May during the Argane growing season (Figure 11). These findings indicate that CDI can effectively monitor meteorological drought, offering better spatial distribution results based on precipitation data. Similar observations were reported by [28] in their comparison between SPI-1 and ADCI for drought monitoring. The SPI, a meteorological drought index, not only serves as a benchmark for evaluating different recently suggested drought monitoring indices, but also plays a significant role in constructing comprehensive drought assessments [29]. The heatmap correlation between CDI and drought indices revealed robust relationships, particularly with VHI (r = 0.83) and TCI (r = 0.86), all exhibiting statistically significant correlations (p-value < 0.001) (Figure 12).
Compared to other indices, the CDI showed the best compromise in correlation with drought indicators, positioning it as suitable for monitoring agricultural and meteorological droughts. This investigation suggests a comprehensive approach spanning 21 years to analyze the spatiotemporal patterns of historical droughts in the Argane stands area of southwest Morocco, using predictive methods to analyze agricultural drought characteristics. The CDI, constructed using the random forest method, effectively captures both meteorological and agricultural drought conditions. Our findings are comparable to other composite models, such as the composite model for drought monitoring by [29] and the agricultural drought model by [28]. The correlation of CDI with VHI (0.83) outperforms other indices like ADCI, which is slightly lower at 0.62. This disparity can be attributed to the machine-learning-based variable weighting in CDI compared to the principal component analysis used in ADCI. Overall, the CDI derived from machine learning algorithms, along with indices like PCI, VCI, TCI and ETCI, offers a robust solution for monitoring agricultural and meteorological droughts in Argane forest stands.

6.4.3. Limitation of the CDI

In this study, a novel modeling approach for agricultural drought in Argane stands in the southwestern region of Morocco was proposed, leveraging various remote sensing indices. Initially, the Combined Drought Index (CDI) was formulated to detect and monitor agricultural drought. However, our index does not currently account for soil moisture parameters due to the unavailability of suitable data with comparable spatial and temporal resolutions over a long period, as seen with MODIS NDVI, LST and ET data. Soil moisture is a crucial parameter for agricultural drought monitoring, and its integration with microwave soil moisture data could provide direct insights into soil moisture content, unlike LST, which has limitations in accurately tracking these changes. To enhance the effectiveness of CDI, additional indicators, such as solar-induced chlorophyll fluorescence, could be incorporated. These indicators have the potential to reflect crop photosynthesis and may offer improved capabilities for early drought detection. Furthermore, there is a need to expand our model by utilizing a broader range of data and applying it on a larger scale, encompassing the entire region of Argane forest stands. This broader approach will enable a more comprehensive understanding of agricultural drought dynamics in the region and facilitate more effective drought monitoring and management strategies.

7. Conclusions

The study successfully implemented random forest algorithms to downscale CHIRPS precipitation data, resulting in improved resolution and accuracy compared to the original dataset. Among the ML models evaluated, XGBoost emerged as the most accurate for predicting the LAI and crop yield of Argane stands followed by GBDT and RF, especially when integrating drought indices as input variables, which provided nuanced insights into the relationship between environmental factors and agricultural productivity. Correlation analysis further elucidated the significant relationships between drought indices, crop yield and LAI, offering valuable insights for understanding the dynamics of agricultural systems under varying climatic conditions. Moreover, the CDI model proved effective in monitoring and assessing agricultural and meteorological droughts, identifying years of extreme drought and their corresponding impacts on crop yield. Validation against meteorological and agricultural drought indices underscored the robustness of the CDI, with strong correlations observed with VHI, crop yield and SPI-1. Nevertheless, the absence of soil moisture parameters in the CDI model highlights the need for future enhancements. Incorporating soil moisture data and solar-induced chlorophyll fluorescence could improve the accuracy and early detection of drought stress. Expanding the CDI model’s application across broader regions will further enhance its utility and accuracy.

Author Contributions

Conceptualization, M.M., M.F. and A.E.A.; methodology, M.M.; software, M.M.; validation, M.M., M.F. and A.E.A.; formal analysis, M.F. and A.E.A.; investigation, M.M.; writing—original draft preparation, M.M.; writing—review and editing, M.F. and A.E.A.; visualization, M.M.; supervision, M.F. and A.E.A. All authors have read and agreed to the published version of the manuscript.

Funding

This research received no external funding.

Data Availability Statement

The data presented in this study are available on request from the corresponding author.

Acknowledgments

The corresponding author extends heartfelt appreciation to Ismail Karbal, Abdelhamid Erradi, and Felix Antoine Audet for their indispensable contributions and steadfast support during the progression of this research. Gratitude is also extended to all farmers and right holders for their collaboration and assistance throughout this endeavor. Additionally, sincere thanks are owed to the Moroccan authorities for their valuable support and cooperation. Finally, special recognition is given to the WSP team, ANDZOA, and REFAM teams for their contributions to this work.

Conflicts of Interest

The authors declare no conflicts of interest.

References

  1. Mouafik, M.; Fouad, M.; Audet, F.A.; El Aboudi, A. Comparative Analysis of Multi-Source Data for Machine Learning-Based LAI Estimation in Argania Spinosa. Adv. Space Res. 2024, 73, 4976–4987. [Google Scholar] [CrossRef]
  2. Chakhchar, A.; Ben Salah, I.; El Kharrassi, Y.; Filali-Maltouf, A.; El Modafar, C.; Lamaoui, M. Agro-Fruit-Forest Systems Based on Argan Tree in Morocco: A Review of Recent Results. Front. Plant Sci. 2022, 12, 783615. [Google Scholar] [CrossRef]
  3. El Aboudi, A. Typologie Des Arganeraies Inframéditerranéennes et Écophysiologie de l’arganier (Argania spinosa (L.) Skeels) Dans Le Sous (Maroc). Ph.D. Thesis, Université Joseph Fourier, Grenoble, France, 1990. [Google Scholar]
  4. Mouafik, M.; Chakhchar, A.; Ouajdi, M.; Antry, S.E.; Ettaleb, I.; Aoujdad, J.; Aboudi, A. El Drought Stress Responses of Four Contrasting Provenances of Argania Spinosa. Environ. Sci. Proc. 2022, 16, 25. [Google Scholar] [CrossRef]
  5. Wang, Q.; Lu, X.; Zhang, H.; Yang, B.; Gong, R.; Zhang, J.; Jin, Z.; Xie, R.; Xia, J.; Zhao, J. Comparison of Machine Learning Methods for Estimating Leaf Area Index and Aboveground Biomass of Cinnamomum Camphora Based on UAV Multispectral Remote Sensing Data. Forests 2023, 14, 1688. [Google Scholar] [CrossRef]
  6. Prasad, N.R.; Patel, N.R.; Danodia, A. Crop Yield Prediction in Cotton for Regional Level Using Random Forest Approach. Spat. Inf. Res. 2021, 29, 195–206. [Google Scholar] [CrossRef]
  7. Kuradusenge, M.; Hitimana, E.; Hanyurwimfura, D.; Rukundo, P.; Mtonga, K.; Mukasine, A.; Uwitonze, C.; Ngabonziza, J.; Uwamahoro, A. Crop Yield Prediction Using Machine Learning Models: Case of Irish Potato and Maize. Agriculture 2023, 13, 225. [Google Scholar] [CrossRef]
  8. Li, W.; Guo, L.; Zhao, H.; Hua, L. Estimating Rice Yield by HJ-1A Satellite Images. Rice Sci. 2011, 18, 142–147. [Google Scholar] [CrossRef]
  9. Xin, Q.; Gong, P.; Yu, C.; Yu, L.; Broich, M.; Suyker, A.E.; Myneni, R.B. A Production Efficiency Model-Based Method for Satellite Estimates of Corn and Soybean Yields in the Midwestern US. Remote Sens. 2013, 5, 5926–5943. [Google Scholar] [CrossRef]
  10. Feng, A.; Zhou, J.; Vories, E.D.; Sudduth, K.A.; Zhang, M. Yield Estimation in Cotton Using UAV-Based Multi-Sensor Imagery. Biosyst. Eng. 2020, 193, 101–114. [Google Scholar] [CrossRef]
  11. Zhang, H.; Ali, S.; Ma, Q.; Sun, L.; Jiang, N.; Jia, Q.; Hou, F. Remote Sensing Strategies to Characterization of Drought, Vegetation Dynamics in Relation to Climate Change from 1983 to 2016 in Tibet and Xinjiang Province, China. Environ. Sci. Pollut. Res. 2021, 28, 21085–21100. [Google Scholar] [CrossRef]
  12. Zhang, L.; Jiao, W.; Zhang, H.; Huang, C.; Tong, Q. Studying Drought Phenomena in the Continental United States in 2011 and 2012 Using Various Drought Indices. Remote Sens. Environ. 2017, 190, 96–106. [Google Scholar] [CrossRef]
  13. Du, L.; Tian, Q.; Yu, T.; Meng, Q.; Jancso, T.; Udvardy, P.; Huang, Y. A Comprehensive Drought Monitoring Method Integrating MODIS and TRMM Data. Int. J. Appl. Earth Obs. Geoinf. 2013, 23, 245–253. [Google Scholar] [CrossRef]
  14. Pham, H.T.; Awange, J.; Kuhn, M.; Van Nguyen, B.; Bui, L.K. Enhancing Crop Yield Prediction Utilizing Machine Learning on Satellite-Based Vegetation Health Indices. Sensors 2022, 22, 719. [Google Scholar] [CrossRef] [PubMed]
  15. Kogan, F.N. Operational space technology for global vegetation assessment. Bull. Am. Meteorol. Soc. 2001, 82, 1949–1964. [Google Scholar] [CrossRef]
  16. Elnashar, A.; Zeng, H.; Wu, B.; Zhang, N.; Tian, F.; Zhang, M.; Zhu, W.; Yan, N.; Chen, Z.; Sun, Z.; et al. Downscaling TRMM Monthly Precipitation Using Google Earth Engine and Google Cloud Computing. Remote Sens. 2020, 12, 3860. [Google Scholar] [CrossRef]
  17. Impollonia, G.; Croci, M.; Ferrarini, A.; Brook, J.; Martani, E.; Blandinières, H.; Marcone, A.; Awty-Carroll, D.; Ashman, C.; Kam, J.; et al. UAV Remote Sensing for High-Throughput Phenotyping and for Yield Prediction of Miscanthus by Machine Learning Techniques. Remote Sens. 2022, 14, 2927. [Google Scholar] [CrossRef]
  18. Jhajharia, K.; Mathur, P. Prediction of Crop Yield Using Satellite Vegetation Indices Combined with Machine Learning Approaches. Adv. Space Res. 2023, 72, 3998–4007. [Google Scholar] [CrossRef]
  19. Rashid, M.; Bari, B.S.; Yusup, Y.; Kamaruddin, M.A.; Khan, N. A Comprehensive Review of Crop Yield Prediction Using Machine Learning Approaches with Special Emphasis on Palm Oil Yield Prediction. IEEE Access 2021, 9, 63406–63439. [Google Scholar] [CrossRef]
  20. Zhang, J.; Cheng, T.; Guo, W.; Xu, X.; Qiao, H.; Xie, Y.; Ma, X. Leaf Area Index Estimation Model for UAV Image Hyperspectral Data Based on Wavelength Variable Selection and Machine Learning Methods. Plant Methods 2021, 17, 49. [Google Scholar] [CrossRef]
  21. Funk, C.; Peterson, P.; Landsfeld, M.; Pedreros, D.; Verdin, J.; Shukla, S.; Husak, G.; Rowland, J.; Harrison, L.; Hoell, A.; et al. The Climate Hazards Infrared Precipitation with Stations—A New Environmental Record for Monitoring Extremes. Sci. Data 2015, 2, 150066. [Google Scholar] [CrossRef]
  22. Wan, Z.; Hook, S.; Hulley, G. MODIS/Terra Land Surface Temperature/Emissivity 8-Day L3 Global 1 km SIN Grid V061. Distributed by NASA EOSDIS Land Processes Distributed Active Archive Center. 2021. [Google Scholar] [CrossRef]
  23. Mu, Q.; Zhao, M.; Running, S.W. MODIS Global Terrestrial Evapotranspiration (ET) Product (NASA MODIS Global Terrestrial Evapotranspiration (ET) Product (NASA MOD16A2/A3) Collection 5. NASA Headquarters MOD16A2/A3) Collection 5; NASA Headquarters: Washington, DC, USA, 2013. [Google Scholar]
  24. Xu, J.; Su, Q.; Li, X.; Ma, J.; Song, W.; Zhang, L.; Su, X. A Spatial Downscaling Framework for SMAP Soil Moisture Based on Stacking Strategy. Remote Sens. 2024, 16, 200. [Google Scholar] [CrossRef]
  25. Fang, B.; Lakshmi, V.; Cosh, M.; Liu, P.W.; Bindlish, R.; Jackson, T.J. A Global 1-Km Downscaled SMAP Soil Moisture Product Based on Thermal Inertia Theory. Vadose Zone J. 2022, 21, e20182. [Google Scholar] [CrossRef]
  26. Zhang, Y.; Li, Y.; Ji, X.; Luo, X.; Li, X. Fine-Resolution Precipitation Mapping in a Mountainous Watershed: Geostatistical Downscaling of TRMM Products Based on Environmental Variables. Remote Sens. 2018, 10, 119. [Google Scholar] [CrossRef]
  27. Kogan, F.N. Application of Vegetation Index and Brightness Temperature for Drought Detection. Adv. Space Res. 1995, 15, 91–100. [Google Scholar] [CrossRef]
  28. Mansour Badamassi, M.B.; El-Aboudi, A.; Gbetkom, P.G. A New Index to Better Detect and Monitor Agricultural Drought in Niger Using Multisensor Remote Sensing Data. Prof. Geogr. 2020, 72, 421–432. [Google Scholar] [CrossRef]
  29. Han, H.; Bai, J.; Yan, J.; Yang, H.; Ma, G. A Combined Drought Monitoring Index Based on Multi-Sensor Remote Sensing Data and Machine Learning. Geocarto Int. 2021, 36, 1161–1177. [Google Scholar] [CrossRef]
  30. Pedregosa, F.; Varoquaux, G.; Gramfort, A.; Michel, V.; Thirion, B.; Grisel, O.; Blondel, M.; Prettenhofer, P.; Weiss, R.; Dubourg, V.; et al. Scikit-Learn: Machine Learning in Python. J. Mach. Learn. Res. 2011, 12, 2825–2830. [Google Scholar]
  31. Friedman, J.H. Greedy function approximation: A gradient boosting machine. Ann. Stat. 2001, 29, 1189–1232. [Google Scholar] [CrossRef]
  32. Breiman, L. Random forests. Mach. Learn. 2001, 45, 5–32. [Google Scholar] [CrossRef]
  33. Zhao, X.; Jing, W.; Zhang, P. Mapping Fine Spatial Resolution Precipitation from Trmm Precipitation Datasets Using an Ensemble Learning Method and Modis Optical Products in China. Sustainability 2017, 9, 1912. [Google Scholar] [CrossRef]
  34. Chen, T.; Guestrin, C. XGBoost: A Scalable Tree Boosting System. In Proceedings of the 22nd ACM SIGKDD International Conference on Knowledge Discovery and Data Mining, San Francisco, CA, USA, 13–17 August 2016; pp. 785–794. [Google Scholar] [CrossRef]
  35. Quinlan, J.R. Induction of decision trees. Mach. Learn. 1986, 1, 81–106. [Google Scholar] [CrossRef]
  36. Smola, A.J.; Schölkopf, B. A Tutorial on Support Vector Regression. Stat. Comput. 2004, 14, 199–222. [Google Scholar] [CrossRef]
  37. Tibshiranit, R. Regression Shrinkage and Selection Via the Lasso. J. R. Stat. Soc. Ser. B Stat. Methodol. 1996, 58, 267–288. [Google Scholar] [CrossRef]
  38. van Gerven, M. Computational Foundations of Natural Intelligence. Front. Comput. Neurosci. 2017, 11, 299674. [Google Scholar] [CrossRef]
  39. Immerzeel, W.W.; Rutten, M.M.; Droogers, P. Spatial Downscaling of TRMM Precipitation Using Vegetative Response on the Iberian Peninsula. Remote Sens. Environ. 2009, 113, 362–370. [Google Scholar] [CrossRef]
  40. Duan, Z.; Bastiaanssen, W.G.M. First Results from Version 7 TRMM 3B43 Precipitation Product in Combination with a New Downscaling-Calibration Procedure. Remote Sens. Environ. 2013, 131, 1–13. [Google Scholar] [CrossRef]
  41. Shi, Y.; Song, L. Spatial Downscaling of Monthly TRMM Precipitation Based on EVI and Other Geospatial Variables over the Tibetan Plateau from 2001 to 2012. Mt. Res. Dev. 2015, 35, 180–194. [Google Scholar] [CrossRef]
  42. Shi, Y.; Song, L.; Xia, Z.; Lin, Y.; Myneni, R.B.; Choi, S.; Wang, L.; Ni, X.; Lao, C.; Yang, F. Mapping Annual Precipitation across Mainland China in the Period 2001–2010 from TRMM3B43 Product Using Spatial Downscaling Approach. Remote Sens. 2015, 7, 5849–5878. [Google Scholar] [CrossRef]
  43. Retalis, A.; Tymvios, F.; Katsanos, D.; Michaelides, S. Downscaling CHIRPS Precipitation Data: An Artificial Neural Network Modelling Approach. Int. J. Remote Sens. 2017, 38, 3943–3959. [Google Scholar] [CrossRef]
  44. Fang, J.; Du, J.; Xu, W.; Shi, P.; Li, M.; Ming, X. Spatial Downscaling of TRMM Precipitation Data Based on the Orographical Effect and Meteorological Conditions in a Mountainous Area. Adv. Water Resour. 2013, 61, 42–50. [Google Scholar] [CrossRef]
  45. Jordan, M.I.; Mitchell, T.M. Machine Learning: Trends, Perspectives, and Prospects. Science 2015, 349, 255–260. [Google Scholar] [CrossRef] [PubMed]
  46. Maya Gopal, P.S.; Bhargavi, R. Performance Evaluation of Best Feature Subsets for Crop Yield Prediction Using Machine Learning Algorithms. Appl. Artif. Intell. 2019, 33, 621–642. [Google Scholar] [CrossRef]
  47. Sharifi, A. Yield Prediction with Machine Learning Algorithms and Satellite Images. J. Sci. Food Agric. 2021, 101, 891–896. [Google Scholar] [CrossRef] [PubMed]
  48. Abbas, F.; Afzaal, H.; Farooque, A.A.; Tang, S. Crop Yield Prediction through Proximal Sensing and Machine Learning Algorithms. Agronomy 2020, 10, 1046. [Google Scholar] [CrossRef]
  49. Mao, H.; Meng, J.; Ji, F.; Zhang, Q.; Fang, H. Comparison of Machine Learning Regression Algorithms for Cotton Leaf Area Index Retrieval Using Sentinel-2 Spectral Bands. Appl. Sci. 2019, 9, 1459. [Google Scholar] [CrossRef]
  50. Yuan, H.; Yang, G.; Li, C.; Wang, Y.; Liu, J.; Yu, H.; Feng, H.; Xu, B.; Zhao, X.; Yang, X. Retrieving Soybean Leaf Area Index from Unmanned Aerial Vehicle Hyperspectral Remote Sensing: Analysis of RF, ANN, and SVM Regression Models. Remote Sens. 2017, 9, 309. [Google Scholar] [CrossRef]
  51. Zhang, L.; Zhang, H.; Niu, Y.; Han, W. Mapping Maizewater Stress Based on UAV Multispectral Remote Sensing. Remote Sens. 2019, 11, 605. [Google Scholar] [CrossRef]
  52. Ali, S.; Haixing, Z.; Qi, M.; Liang, S.; Ning, J.; Jia, Q.; Hou, F. Monitoring Drought Events and Vegetation Dynamics in Relation to Climate Change over Mainland China from 1983 to 2016. Environ. Sci. Pollut. Res. 2021, 28, 21910. [Google Scholar] [CrossRef] [PubMed]
  53. Gidey, E.; Dikinya, O.; Sebego, R.; Segosebe, E.; Zenebe, A. Using Drought Indices to Model the Statistical Relationships Between Meteorological and Agricultural Drought in Raya and Its Environs, Northern Ethiopia. Earth Syst. Environ. 2018, 2, 265–279. [Google Scholar] [CrossRef]
  54. Liu, Q.; Zhang, S.; Zhang, H.; Bai, Y.; Zhang, J. Monitoring Drought Using Composite Drought Indices Based on Remote Sensing. Sci. Total Environ. 2020, 711, 134585. [Google Scholar] [CrossRef]
  55. Zhang, Z.; Xu, W.; Shi, Z.; Qin, Q. Establishment of a Comprehensive Drought Monitoring Index Based on Multisource Remote Sensing Data and Agricultural Drought Monitoring. IEEE J. Sel. Top. Appl. Earth Obs. Remote Sens. 2021, 14, 2113–2126. [Google Scholar] [CrossRef]
Figure 1. Geographic locations of the 10 study areas, featuring sample plots.
Agriengineering 06 00134 g001
Figure 2. Comparison of crop yield (kg/ha) and the Leaf Area Index (LAI) of 2021 across different studied areas.
Agriengineering 06 00134 g002aAgriengineering 06 00134 g002b
Figure 3. Flowchart of CDI implementation based on the random forest method.
Agriengineering 06 00134 g003
Figure 4. Downscaling results: (a) original CHIRPS precipitation at 0.05° spatial resolution; (b) predicted precipitation at 1 km resolution; (c) interpolated residuals at 1 km spatial resolution; (d) final downscaled precipitation at 1 km spatial resolution.
Agriengineering 06 00134 g004
Figure 5. Scatter plot assessment results of the original CHIRPS with RGS (a) and 1 km downscaled CHIRPS (b) using the random forest model on a monthly basis spanning from January 2020 to June 2021.
Agriengineering 06 00134 g005
Figure 6. Feature importance scores of environmental variables in precipitation downscaling.
Agriengineering 06 00134 g006
Figure 7. Forecast outcomes depicting the performance of the Aragane stand crop yield and LAI prediction models based on XGBoost for both training and testing datasets.
Agriengineering 06 00134 g007
Figure 8. Correlation between drought indices and crop yield, as well as the LAI of Argane stands. (* p < 0.05, ** p < 0.01, *** p < 0.001).
Agriengineering 06 00134 g008
Figure 9. Annual evolution of CDI and VHI for Argane trees during the study period from 2001 to 2021.
Agriengineering 06 00134 g009
Figure 10. Spatial distribution of agricultural drought in Tafedna municipality monitored by CDI during severe drought years.
Agriengineering 06 00134 g010
Figure 11. Scatterplot showing correlations between CDI and SPI-1 during the Argane tree growing period from January to June, 2001 to 2021.
Agriengineering 06 00134 g011
Figure 12. Correlation between CDI, drought indices and crop yield of Argane stands. (* p < 0.05, *** p < 0.001).
Agriengineering 06 00134 g012
Table 1. Geographic distribution of the 10 Argane stands locations across southern Morocco.
MunicipalitiesProvincesLatitudeLongitudeAltitude
TafednaEssaouira31.11–9.80100 m–250 m
Sidi Hmad ou HamedEssaouira31.35–9.67100 m–250 m
Imi MqournAit Baha30.21–9.21200 m–300 m
LqliaaInzegane Ait Melloul30.31–9.5440 m–70 m
DrarguaAgadir30.45–9.48100 m–900 m
Sidi Ahmed Ou AbdallahTaroudannt30.34–8.61900 m–1100 m
BigoudineTaroudannt30.67–9.22700 m–1100 m
BounrarTaroudannt30.31–8.77900 m–1100 m
TioughzaSidi ifni29.43–9.98150 m–700 m
Sidi BouabdelliTiznit29.47–9.83300 m–800 m
Table 2. Formulas of Drought Condition Indices.
Drought IndexNameFormulationData Source
PCIPrecipitation Condition Index ( C h i r p s ) c u r r e n t ( C h i r p s ) m i n ( C h i r p s ) m a x ( C h i r p s ) m i n × 100 CHIRPS
VCIVegetation Condition Index ( N D V I ) c u r r e n t ( N D V I ) m i n ( N D V I ) m a x ( N D V I ) m i n × 100 MODIS
TCITemperature Condition Index ( L S T ) m a x ( L S T ) c u r r e n t ( L S T ) m a x ( L S T ) m i n × 100 MODIS
ETCIEvapotranspiration Condition Index ( E T ) c u r r e n t ( E T ) m a x ( E T ) m a x ( E T ) m i n × 100 MODIS
SMCISoil Moisture Condition Index ( S M ) c u r r e n t ( S M ) m i n ( S M ) m a x ( S M ) m i n × 100 SMAP
Table 3. Classification of Drought Indices.
Drought SeverityTCI, VCI, PCI, ETCI & VHI ValuesCDI Values
Exceptional droughtVCI ≤ 10CDI ≤ 10
Critical drought10 < VCI ≤ 2010 < CDI ≤ 20
Moderate drought20 < VCI ≤ 3020 < CDI ≤ 30
Slight drought30 < VCI ≤ 4030 < CDI ≤ 40
No droughtVCI ≥ 40CDI ≥ 40
Table 4. Analyzing the accuracy outcomes of prediction models.
TraitModelTraining SetTesting SetAll Data Set
R2RMSEMAER2RMSEMAER2RMSEMAE
Crop YieldXGBoost0.936.861.360.6016.337.300.946.251.44
GBDT0.936.881.490.4419.388.140.946.221.41
RF0.879.173.570.5617.177.870.888.723.31
DT0.6615.036.750.5417.507.790.6714.626.47
SVR0.2122.788.200.2522.297.800.3320.947.95
ANN0.7113.796.390.6714.877.930.7313.386.09
LR0.6315.528.700.5417.5210.810.6914.307.61
LAIXGBoost0.640.650.510.380.930.690.620.670.52
GBDT0.640.680.540.380.940.700.620.670.52
RF0.630.660.520.410.900.660.620.680.53
DT0.580.700.560.340.960.720.570.720.56
SVR0.590.690.550.340.960.670.590.700.55
ANN0.630.660.510.380.930.690.620.670.53
LR0.570.710.560.370.930.720.560.720.58
Disclaimer/Publisher’s Note: The statements, opinions and data contained in all publications are solely those of the individual author(s) and contributor(s) and not of MDPI and/or the editor(s). MDPI and/or the editor(s) disclaim responsibility for any injury to people or property resulting from any ideas, methods, instructions or products referred to in the content.

