Abstract
The handling of the remnants of rice crops in the field is not an easy operation, and farmers prefer burning, which causes air pollution, smog, and disease. This research reports the development of a novel precision crop seeder by handling the remnants of previous crops through mechanization. The precision seeder performed multiple operations in a single path, viz, chop residues, incorporate into soil, make mini trenches, and sow wheat with fertilizer application. The precision seeder has a 2040 mm working width, and specially designed C-type blades are used to shred the crop residue. A multiple-speed gearbox with a gear ratio of 1:0.52 is installed, with a further set of spur gears with 16, 18, and 20 teeth that provide 225, 250, 310, and 350 RPMs to the main rotor. In the middle of the seeder, after the main rotor shaft, 11 V-shaped trencher plates are fixed on the trencher roller for the making of trenches. The trencher roller is powered by star wheels, which showed good results. A zero-tillage-type sharp tip edge novel seeder unit was developed for the precise placement of seed and fertilizer. Seed and fertilizer were placed into the mini trenches through 11 seeder units through a ground wheel calibration system. The field capacity of the precision seeder was 0.408 ha/h and the operational cost was calculated 40.68 USD/ha. The seeder showed good results, with the production of 5028 kg/ha compared to conventional methods. The precision seeder provides a mechanized solution for wheat sowing with minimal operational costs by enhancing organic matter in soil with 13% more yield.
1. Introduction
Wheat (Triticum aestivum L.) and rice (Oryza sativa L.) are the major cereal food crops that are widely consumed by the world’s population; 760.9 million tonnes of wheat was produced in 2021 [1]. In cereal crops, wheat is ranked first in terms of area under cultivation, rice is third [2]. Asia dominates the production and consumption of rice, i.e., about 90% [3]. It is projected that the world population may reach 8.2 billion by the year 2025 [4]. This growing population demands a growth both in the area and per unit production of crops. Specifically, 35 to 40% more rice and wheat production is required as per the present consumption pattern in the world [5]. In 2022, an estimated 735 million individuals, representing 9.2% of the global population, experienced chronic hunger, marking a significant increase compared to 2019 [6]. The United Nations Sustainable Development Goal 2 (SDG 2) aims to end hunger by 2030, achieve food security and improved nutrition, and promote sustainable agriculture [7]. Research focused on the improvement of rice–wheat cropping systems will significantly contribute to the achievement of this goal.
The agricultural sector contributed 4.33 percent of the global Gross Domestic Product (GDP) for the total world economy [8] and offered 37.4 percent employment to the rural labour force [9]. Wheat is generally grown after the harvesting of rice and a cropping system of rice–wheat has been practiced by farmers for over 1000 years in Asia. This cropping system has expanded to cover over 23.5 million hectares [10].
The rice–wheat cropping system is mainly practiced in the Indo-Gangetic Plains (IGP) in Pakistan, India, Nepal, Bangladesh, and the Yangtze River Basin (YRB) in China [11,12,13]. Rice is grown in wet and puddled lands, while wheat requires well-drained soil [14]. The sowing time window is limited for wheat after harvesting the previous crops in rotation, viz, rice, maize, and cotton [15,16]. The soil structure is also compromised due to the development of a hard pan from prior tillage operations in the root zone [17,18].
The soil fertility level is reduced before the sowing of wheat, as rice and maize are exhaustive crops [19] and, in the same cropping system, the risk of pest and weed attack arises due to resistance against the same formulation of chemicals [20]. Rice is a high-residue-producing crop totalling over 826 million tonnes in Asia annually, which is considered 84% of the total production of the world, and in-field straw management is laborious without proper machinery [21]. Rice straw is mainly managed through the uncontrolled burning of fields, which produces smog and causes health- and environment-related issues; it also reduces soil fertility [22].
The direct sowing of wheat in the rice field without burning straw after rice harvesting through a combine harvester reduces environmental pollution [23,24]. Rice residue is comprised of standing stubble in the range of 30–60 cm high, along with loose straw in windrows ∼1 m wide in a substantial quantity after combine harvesting [25,26]. For wheat sowing, loose straw interferes both in tillage and seeding operations [27]. Multiple tillage operations were required for the proper incorporation of straw into the soil [28]. In Punjab, after the partial burning of rice residues, usually five tillage operations were performed by 50% of farmers, and 30% used to till four times after complete burning [29].
The timely sowing of wheat without burning the rice residue is a major challenge [30,31]. Research has shown that the late sowing of wheat affects the grain size and weight within spikes, which results in an 18 kg yield reduction per day per acre [32,33]. Traditionally, farmers collect the rice straw leftover manually, which is a laborious and time-consuming job. Otherwise, it is burned in an open field, which is an easier approach but causes air pollution. Controlled burning produces smog, nitrogen oxides (NOx), sulphur oxides (Sox), and particulate matter (PM), which all pose human health risks [34]. Fire also reduces soil macro- and micronutrients and kills biological bacteria, impacting the following crop production in terms of yield [35,36]. Soil bed preparation for wheat sowing is not an easy task due to rice straw and stubble [37]. Rotavators, disk harrows, and tine cultivators are the common implements used by farmers for tillage and seedbed preparation [38]. A heavy load of rice straw creates hindrances to the penetration of disks, tines, or rotavator blades into soil, reducing their effectiveness [39]. Multiple passes of each tillage tool are required to achieve adequate incorporation of the rice residue [40].
The wheat yield largely depends upon various sowing techniques [41,42]. To manage rice straw and simultaneously sow wheat, three types of seeders have been evaluated: Super Seeder, Happy Seeder, and Smart Seeder [43]. The tests were conducted at a forward speed of 2.6 km·h−1, with a rotor blade speed of 127.5 rpm and a straw load of 6 t·ha−1. The results indicated fuel consumption rates of 6.77, 4.50, and 5.72 L·h−1 for the Super Seeder, Happy Seeder, and Smart Seeder, respectively. The effective field capacities were 0.25, 0.38, and 0.38 ha·h−1, respectively [43]. In another study, farmers used different sowing techniques, out of which four techniques were selected to compare, namely, zero till drill, disc harrows, Happy Seeder, and Rota-drill [44]. Famers obtained a 21–23 q/ac yield with a Happy Seeder and the lowest yield was recorded with disc harrows (16–18 q/ac). Rota-drill was adopted by fewer farmers and obtained good yields compared with disc harrows and zero till drill [45].
A Happy Seeder is a mulcher combination wheat drilling implement that is operated for wheat sowing after rice harvesting [46]. In the field of rice, wheat sowing with a Happy Seeder avoids rice straw burning. A Happy Seeder provides green mulch, improves soil health, saves water, and is an eco-friendly solution [47]. However, one limitation of the Happy Seeder is the inability to handle the high residue rice, which has both a heavy straw load and stubble present during wheat sowing [48]. A straw shredder is necessary to chop the rice straw before the operation of the Happy Seeder [49]. Alternatively, a Rota-drill can be used to plough rice stubble into the soil and sow a wheat crop simultaneously in a single swath after the rice harvest if the straw is collected and removed prior to operation [45,50].
Combine harvesters produce a heavy load of rice straw and also leave stubble that is traditionally burnt out in South Asia and Australia to remove this heavy residue [51]. In late sowing, plant density was reduced to a straw load of 5.1 t/ha and the wheat yield was recorded 9–11% higher when grown through a Happy Seeder without the burning of straw, removing air pollution and increasing soil nutrients and organic matter [51]. Super Seeder technology has emerged as the most cost-effective solution for managing paddy straw without the need for burning prior to the sowing of wheat [52]. The grain yield achieved using a Super Seeder was significantly higher (50.74 q·ha−1) than that with the conventional method (48.72 q·ha−1) [52].
Comparing the Super Seeder (SS) to Conventional Tillage (CT) demonstrated significant resource conservation benefits. The SS technique has resulted in reductions in sowing time by 62.50%, irrigation time by 7.69%, seed cost by 14%, fertilizer cost by 10.81%, and fuel cost by 58.33% [53]. However, it requires a higher horsepower tractor (preferably 85 hp) for optimal sowing operation [54]. Additionally, the SS technique has led to an increased wheat yield of 13.11%, producing 3450 kg·ha−1 compared to 3050 kg·ha−1 with CT in a rice–wheat cropping system [54].
Conventional seeders, such as the Happy Seeder and Smart Seeder, face challenges in managing rice residue prior to sowing wheat in rice fields. These seeders often necessitate an additional pass with a rice shredder or manual removal of straw before operation [43]. Moreover, some seeders require high horsepower to simultaneously sow wheat and manage rice straw [54]. This research identifies and addresses these technical and operational gaps.
This research study reports the novel development, testing, and economic analysis of a multi-functional precision seeder. This seeder performs five operations in a single path for the timely sowing of wheat after rice. It chops the rice straw and stubble, manipulates the soil and incorporates it down to a 100 mm depth, makes mini trenches where it applies seed and fertilizer precisely at the same depth, and provides adequate soil cover.
2. Materials and Methods
To better achieve this task, a novel approach was carried out and a precision seeder was developed.
2.1. Main Frame
The main frame of the precision seeder is made of mild steel (MS). Two 100 mm MS square tubes (C1) with a 6 mm wall thickness and a length of 2145 mm were located at the front and rear joined by MS plates, as shown in Figure 1. The top cover of the main frame is made from a 4 mm thick MS plate and welded with MS square tubing through a 15 mm thick MS plate (C2). The whole frame is bolted at each end to 12 mm thick MS side plates (C4). The Skid Plates (C3) are 18 mm thick and provide multiple bolting locations along the side plates (C4) on both sides to provide height adjustment during field operation.
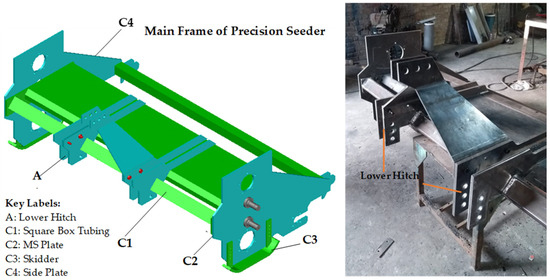
Figure 1.
Main frame of the precision seeder in the isometric view of AutoCAD_2019 and during manufacturing.
2.2. Three-Point Hitch System
The hitch system, also known as Mast A-Frame, was used for the attachment of the implement to the tractor. In this seeder, a category-2-type three-point hitch assembly was designed on the basis of the implement structure and weight. The upper hitch attachment (1) has a hole diameter of 26 mm to facilitate a pin of 25 mm easily, as shown in Figure 2. The lower hitch attachments (4) were designed as a clevis type, with a hole diameter of 29 mm to facilitate a pin of 28 mm. The distance between the two inner faces of yokes (W1) was set to 52 mm and the distance between the outer faces of yokes (W2) was 86 mm. The mast height (H) between the top link and lower attachment was fixed at 610 mm and the span of lower attachment (S) was fixed at 825 mm.
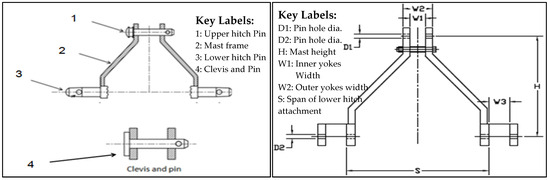
Figure 2.
Three-point hitch assembly for the category-2 implement.
2.3. Rotor Blade
As the paddy straw is more viscous and offers high resistance to shredding, to handle this type of straw a special type of blades (“C”, “J”, and “JF”) were used. For the tillage operation, “C”-shaped blades required less power and the physical properties of soil were checked by observing the following factors: structure and porosity/bulk density [55,56]. The blade material was medium carbon low-alloy steel with a hardness of 50 HRC. The rotor (B3) was made of mild steel pipe with an outer diameter of 90 mm and a wall thickness of 7 mm. The total rotor length was 1915 mm, including neck-shaped flanges (B2) welded on both sides to hold and rotate through the bearing hub (B1). Nine forged mild steel (FMS) plates (B4) were welded on the rotor shaft with equal spacing. Each 12 mm thick plate was designed for mounting six “C”-shaped blades (B) and had a diameter of 260 mm, as shown in Figure 3.
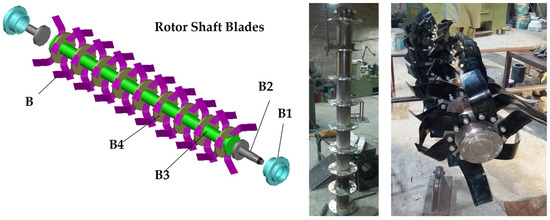
Figure 3.
Rotor shaft equipped with “C”-shaped blades in the isometric view of AutoCAD_2019 and after assembly.
Rotor Design Parameters
The design of the rotor blades was carried out based on the available power source of a 75 HP tractor. This tractor has technical specifications and other performance parameters: the torque value is 290 N·m at 1400 PRM of the engine and the power available at a PTO is 69.5 HP at the rated speed of the engine [57].
The power consumption by the rotor is calculated through Equation (1), with the work method from [58].
where:
Ws = W0 + Wb
- Ws = Total specific work of rotor
- W0 = Static-specific work
- Wb = Dynamic work
W0 = 0.1 C0 · K0
Wb = 0.001au · U2
Wb = 0.001av · V2
- V = Forward speed of tractor (m/s)
- U = Rotor peripheral velocity (m/s)
- K0 = Specific resistance of soil (kg/dm3)
- C0 = Coefficient proportion of soil type and machine parameter
- λ = Coefficient of proportion
To calculate the rotor blade diameter of the precision seeder, Equation (6) is used in which torque is an important factor [59].
where:
Ms = Ks · R
- d = Rotor diameter (mm)
- Ms = Maximum amount of torque on rotor axle (N·mm)
- τ = Shear stress on rotor axle (N/mm2)
- k = Coefficient for concentration of stress
- Sy = Safety factor
- Ks = Max. tangent force on rotor (Mpa)
- R = Rotor radius (mm)
- Cs = Reliability factor, i.e., non-rocky soil = 1.5, rocky soil = 2
- Nc = Tractor power (HP)
- ηc = Tractor PTO efficiency (0.85)
- ηz = Coefficient of reserved tractor power (0.7–0.8)
- Umin = Min. linear velocity of rotor (m/s)
2.4. Multi-Speed Gear Box
To drive the rotor shaft of the precision seeder, power is transferred via a Power Take Off (PTO) shaft through a multi-speed gearbox. A heavy-duty special gearbox was designed to transmit the power to both the blade rotor shaft and the trencher shaft at a multitude of speeds, as shown in Figure 4. The main shaft (G17) is powered by the PTO of the tractor and drives the left shaft (G1) through spiral bevel gears (G15) and also drives the right shaft (G12) through a pair of spur gears (G9) leading to a spiral bevel gear set (G22). At the rear end of the gearbox, an opening (G7) allows for the interchange of the two spur gears (G9). Three identical pitch spur gears with 16, 18, and 20 teeth can be interchanged in different combinations to obtain different speed ratios.
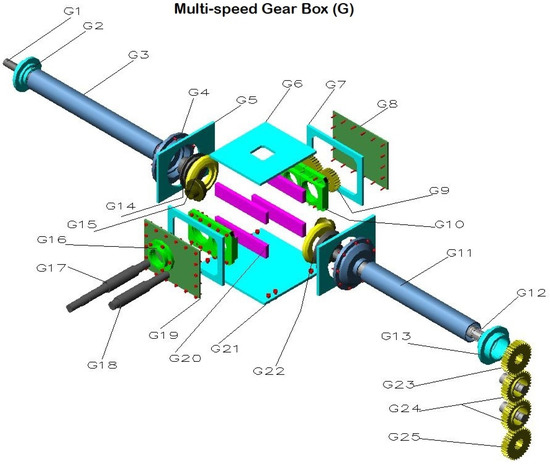
Figure 4.
Multi-speed gear box with power transmission of the precision seeder drawn in AutoCAD_2019.
2.5. Trencher Plates
The trencher rotor was located in the middle of the precision seeder to make mini trenches in the field for the easy sowing of wheat into rice stubble. Eleven trencher plates were equally spaced on the trencher rotor (D2), as shown in Figure 5. The trencher plates were constructed from heat-treated 40 mm thick mild steel (D3) that was 340 mm in diameter with a 190 mm borehole through the centre. The outer edges were sharpened into a V-shaped profile to properly form the bottom of the trench when in operation. The trencher rotor was made of a 190 mm diameter mild steel pipe with a wall thickness of 4 mm. The entire assembly was supported by UCF 209 bearings on each end in between the side plates of the main frame and a drive through double V-groove pulley (D1). Scrapers were designed and attached to the mainframe to remove the soil and other debris from the trencher rotor.
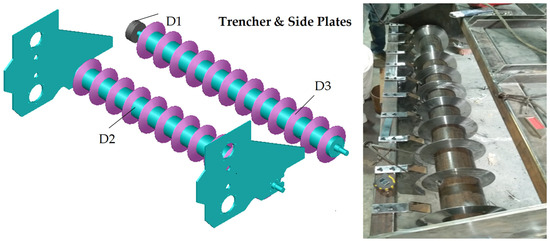
Figure 5.
Trencher rotor fixed in between the side plates.
2.6. Power Transmission
To drive the trencher rotor, four different drive mechanisms were developed. Power was applied to the main gearbox and transmitted via different drive mechanisms, viz, timing belt and pulley, V-belt and pulley, gear system, sprocket chain, and star ground wheels.
- i.
- Timing belt and pulley:
To power the trencher rotor, a heavy-duty timing belt was used with the drive mechanism of the timing belt and pulleys [60]. The drive shaft pulley diameter was fixed at 150 mm and the trencher rotor shaft pulley diameter was fixed at 225 mm.
- ii.
- V-belt and pulley:
In this mechanism, power was transmitted through a B-type double V-belts and pulley system (Figure 6). The driveshaft pulley diameter of 100 mm was driven to a middle pulley diameter of 350 mm that also held a counter pulley with a diameter of 125 mm that was driven to a trencher pulley with a diameter of 150 mm.
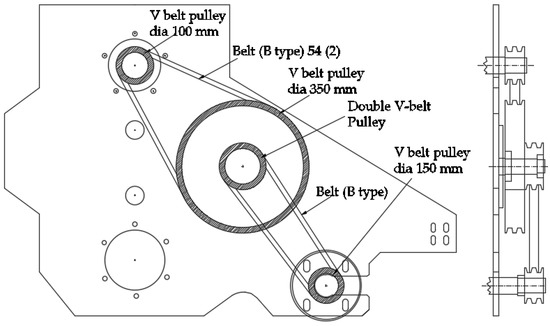
Figure 6.
Trencher rotor drive system drawn on AutoCAD_2019.
- iii.
- Gear System:
This mechanism was designed to provide the final drive ratio for the trencher rotor [61]. The spur gear with 11 teeth was attached to the drive shaft and meshed with a counter drive spur gear with 25 teeth. The counter drive spur gear was meshed with the final spur gear with 23 teeth mounted on the trencher rotor.
- iv.
- Chain and Sprocket:
A roller chain system was designed to drive the trencher rotor from the main gearbox [62]. A drive sprocket (S1) with a 130 mm outer diameter and 20 teeth with an 18.75 mm pitch (No. 60 chain) was bolted on the gear shaft to transmit power to a driven sprocket (S2) with a 190 mm outer diameter and 30 teeth with same pitch bolted on the trencher rotor.
- v.
- Star Wheels:
In this drive mechanism, power from the main gearbox was disconnected and tied to the forward ground speed of the seeder. A star-type ground wheel was designed and installed on both sides of the trencher roller. The trencher roller speed in revolutions per minute (rpm) will match with the forward speed of the seeder.
2.7. Seeder Units
Seeder units were designed for efficient placement of wheat seed and fertilizer in the mini trenches (Figure 7). Each seeder unit (S) has provision for the separate placement of fertilizer and wheat seed. The first slot was designed for the fertilizer, while the second was for wheat. Each unit was formed from a 3 mm MS sheet via a tooled press and spot-welding process. The end of the seeder was closed to the soil, heat treated to a Rockwell C hardness of 40, and welded directly behind the trencher plates for the best placement of fertilizer and seed. Seed and fertilizer were conveyed through hoses connected to the seed and fertilizer box. A roller (R) was provided at the rear end to apply the layer of soil cover on seed and fertilizer.
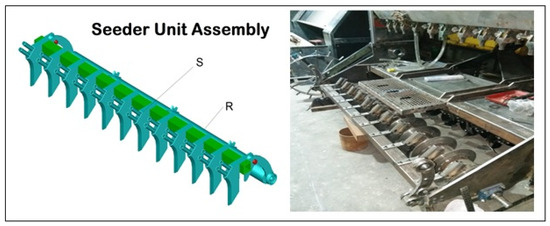
Figure 7.
Seeder unit assembly drawn in AutoCAD_2019 and attached at the rear end of the precision seeder.
2.8. Seed and Fertilizer Distribution
Seed and fertilizer were stored in a trapezoidal-shaped (H1) seed and fertilizer box (H3) separately, with a storage capacity of 100 kg for each hopper (Figure 8). A mild steel sheet (18 SWG) was used for the fabrication of the seed and fertilizer box. Nylon stator and brush-type fluted rollers (H2) were fixed with equal spacing for the distribution of seed and fertilizer. Fluted rollers (H4) were provided at the bottom of the seed and fertilizer box and joined through a 22 mm MS round stock shaft. A visual scale was fixed on each shaft to control the quantity of seed and fertilizer per hectare. A hopper box was mounted on the top of the precision seeder through a 516 × 50 mm MS channel (H5). Fluted rollers were driven through a ground contact wheel (H6).
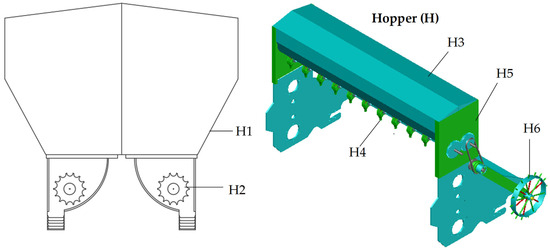
Figure 8.
Seed and fertilizer box equipped with fluted rollers drawn on AutoCAD_2019.
2.9. Seed and Fertilizer Calibration
The quantity of seed and fertilizer was set by moving the position of the fluted roller. A 685 mm diameter ground contact wheel, also known as the drive and calibration wheel (G), was attached to calibrate the seed and fertilizer amount, as shown in Figure 9. The seed and fertilizer rates in kilograms per hectare were calculated individually using Equation (10).
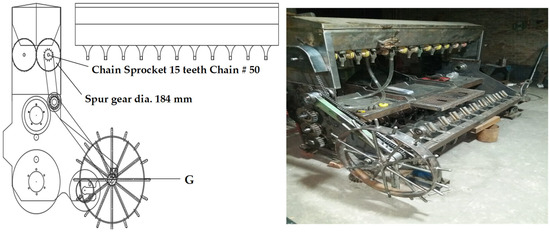
Figure 9.
Ground wheel working diagram in AutoCAD_2019 and after assembly.
- (i = 1, 2, 3, …, n)
- Ms = Mass of seed/fertilizer collected under each fluted roller (kg)
- n = Number of fluted rollers on the seeder
- Ws = Width of the seeder (m)
- Cgw = Circumference of the ground wheel (m)
- N = Number of ground-wheel revolutions, e.g., 10
2.10. Draft Measurement
To measure the drawbar power of the seeder, a dynamometer was used to measure the draw force in kilonewtons (kN). For this measurement, two tractors were used during field testing. A dynamometer was attached to the front side of the first tractor and the precision seeder was mounted at the rear using a three-point hitch assembly. Another tractor with higher horsepower was connected to the other end of the dynamometer. The tractor with higher horsepower at the front pulled the second tractor, which was attached to the working seeder. The value of the drawbar force (kN) was read from the dynamometer over a distance of 20 m. This procedure was repeated with the seeder in a lifted position and the drawbar force (kN) was recorded again from the dynamometer. The difference between the two values provided the actual drawbar force required for the seeder [63]. The draft power of the seeder was then calculated using Equation (11).
where:
- Pdb = Drawbar power (HP)
- V = Forward speed of the tractor (km/h)
- Db = Drawbar force (kN)
- a = Working depth (cm)
- b = Seeder working width (mm)
- Da = Avg. specific resistance
2.11. Field Efficiency
The field efficiency of the seeder was used to check and evaluate the performance in the field. The field efficiency was calculated as the ratio of effective field capacity (EFC) to the theoretical field capacity (TFC) and was presented as a percentage. The effective field capacity, also known as the actual field capacity of the seeder, was calculated in hectares per hour by noting the time (h) consumed for the complete operation of 1 hectare. During this time, both productive and non-productive time was noted. The productive time is the time that was consumed during the operation of the seeder, while the non-productive time is the time that was consumed during the filling of hoppers with seed and fertilizer, turning, loading/unloading, cleaning, and refuelling. The theoretical field capacity of the precision seeder was calculated using Equation (13) in hectares per hour.
- St = Forward speed of tractor during operation with the seeder (km·h−1)
- Ws = Working width of the seeder (m)
The effective field capacity (EFC) of the precision seeder was measured in the field testing by using Equation (14) in hectares per hour.
The field efficiency of the precision seeder was calculated by using Equation (15).
2.12. Cost Analysis
A cost analysis of the precision seeder was conducted to determine the cost of rice straw shredding and wheat sowing per unit area (hectare). The operating costs are comprised of the fixed costs and variable costs of the precision seeder. The fixed costs included: depreciation, interest rate, insurance, housing, and repair. The variable costs included: fuel, lubrication, and labour. At the end, both the fixed and variable costs were summed and the total operating cost per hour and per hectare was calculated by using formulas. In Figure 10, the complete designed and fabricated unit of the precision seeder can be seen for a perspective view and better understanding, along with the technical specifications in Table 1.
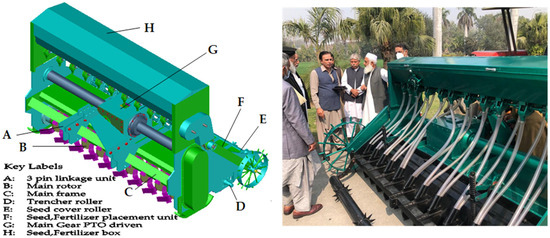
Figure 10.
Perspective view of precision seeder.

Table 1.
Technical specifications of the precision seeder.
3. Results and Discuss
After fabrication, the precision seeder was tested under lab conditions to verify its working parameters. The hardness of the C-shaped tines was tested via a portable harness tester and was verified to achieve a minimum of 50 HRC. The rotational speeds of the main rotor blade and trencher shafts were calculated via formulas and also accounted for through a tachometer. All the fabricated parts of the seeder were assembled and, after the critical components were verified in the lab, the seeder was tested under different field conditions.
3.1. Laboratory Testing
3.1.1. Blade Rotor RPM
The main rotor, equipped with soil-engaging blades, was driven through a multi-speed gearbox. At 540 RPM of the tractor PTO shaft with spur gear ratios of 16:18, 16:20, 18:20, 18:16, 20:16, and 20:18, and a further 13/25 ratio of crown and pinion gears, provides different rotational speeds to the blade rotor, as shown in below Table 2.
Table 2.
Main blade rotor RPMs at different gear ratios.
3.1.2. Trencher Plates Rotor
The trencher rotor is the main component of the precision seeder that facilitates the press of the un-chopped straw into the soil and makes mini trenches for the application of seed and fertilizer at equal depth throughout the field. Power was transmitted from the main gearbox to the trencher rotor via a timing belt and pulley system. During lab testing, 187 rpm was measured at the trencher rotor. The final trencher rotor RPMs received when using different power transmission systems are presented in Table 3.
Table 3.
Trencher rotor RPMs using different power transmission systems (PTSs).
3.2. Field Testing
3.2.1. Blade Rotor RPM
This seeder was tested at different blade rotor speeds (rpm) by changing the spur gears at the rear end of the gearbox. In the field test, at 250, 252, 310, and 316 rpm, the blades and rotor showed optimum results: a straw and stubble chopping efficiency of 90%, the soil bed preparation was fine tilth, trench formation with a depth of 6.5 cm, application of seed and fertilizer uniformly at 4 cm, and a tractor load of 63.75 HP. When the rotor was at 225 rpm, the seeder showed sluggish results in terms of a reduced straw chopping efficiency 73.8% and soil incorporating was coarse tilth, while when the rotor was at 350 rpm, the seeder placed a high load with 2400 engine RPM on the tractor, as presented in the graph (Figure 11). The optimal speed of the rotor depended on the soil type, soil moisture, and quantity of straw in the field, which is further correlated with the forward speed (km·h−1) of the tractor. High moisture content in soil and straw (23%) offered less resistance and load on the tractor at a forward speed of 2.05 km·h−1.
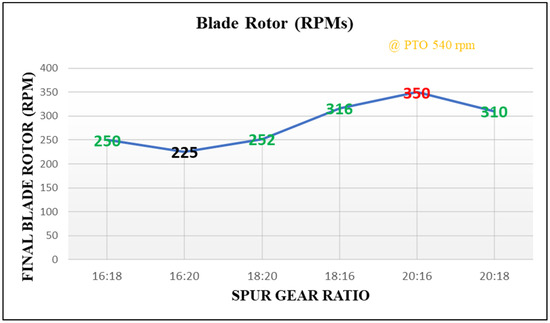
Figure 11.
Blade rotor (RPMs) at different spur gear ratios of the multi-speed gearbox, RPMs in green colour showed good/optimum results while the other RPMs in black and red colour showed poor results as sluggish and high load respectively.
3.2.2. Trencher Rotor Speed
The trencher rotor speed (rpm) was calculated in different power transmission systems, as shown in Table 3. In the first design, the TBP system failed during field testing due to the breakage of the timing belt. A V-belt and pulleys (VBP) system was designed to power the trencher rotor; this VBP system also failed due to breakage of the V-belt due to high load, speed, and power losses [64]. The third design used a sprocket chain (SC) system to drive the trencher units. The SC system produced 192 RPMs and also collapsed due to the breakage of the chain. A fourth spur gear (SG) system was designed with different teeth ratios to power the trencher rotor. The SG system generated 134 RPMs, which produced good results but created a heavy torque load on the tractor. A star wheel (SW) system gave the rated RPM to the trencher unit and was well matched with the forward speed, which produced good results in terms of less torque load on the tractor. The nominal speed of the trencher was calculated by using the equation below:
In the field test, the timing belt and pulley system failed (Table 4) due to the nonmatching of the trencher rotor speed with the forward speed of the seeder at 2 km h−1. The nominal speed of the trencher rotor was calculated at 32 revolutions per minute at an optimum forward speed for the seeder of 2 km h−1.
Table 4.
Trencher rotor RPMs in different power transmission systems (PTSs).
3.3. Seed and Fertilizer Calibration
Seed and fertilizer were distributed by means of a ground contact wheel powering fluted roller units on each row. The seed and fertilizer application rate per unit area is very important for farmers. To set and determine the seed rate per hectare, a calibration test was performed before operation in the field. We filled the hopper with seed and placed the buckets under each seeder unit in the lifted position. Then, we measured the working width of the seeder and circumference of the ground wheel with a measuring tape. The working width and circumference were measured at 2.04 m and 2.1509 m, respectively. The ground wheel was moved and 10 revolutions counted. The seed was collected in each bucket and the weight of the seed was measured for all 11 seeder units for a total of 0.542 kg. The seed rate was calculated by using the equation:
If the required seed rate was not achieved, then the position of the seed adjustment lever was changed to obtain the required application rate in kilograms per hectare. Similarly, this test was performed to set the fertilizer rate (kg ha−1).
3.4. Field Efficiency
The field efficiency of the precision seeder was tested by calculating the theoretical field capacity of the seeder and measuring the effective field capacity. Field efficiency is the ratio of effective field capacity to theoretical field capacity and is calculated as a percentage. The theoretical field capacity was calculated in hectares per hour by using the below equation:
The effective field capacity was measured in the field during the operation of the precision seeder (Figure 12) for a particular area and included the productive and non-productive times. The productive time is the actual time used for operation, while the non-productive time is the time that was consumed in turning, loading and unloading, filling the hopper with seed and fertilizer, etc.
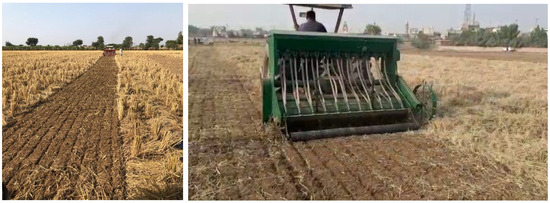
Figure 12.
Precision seeder during field testing.
The time was recorded with a stopwatch for multiple operations in the field. After detailed testing, the field efficiency of the precision seeder was found to be 85.78 percent.
The tractor forward speed is a major factor in determining the optimum drive speed of a precision seeder. A 75-horsepower tractor was used during field testing, which was operated at three low-gear speeds (2.05, 3.4, and 4.7 km·h−1), as mentioned in Table 5. The highest rice straw crushing efficiency achieved was 90.2%, with a straw load of 8 t/ha at a speed of 2.05 km·h−1; increasing the forward speed caused load on the tractor.
Table 5.
Straw crushing efficiency in percentage at different forward speeds of the tractor.
3.5. Wheel Slippage
The precision seeder is a ground-driven implement and, during operation, a certain amount of draft (N) is required to move forward. Draft was measured with a dynamometer and the amount of load on the tractor was varied with the amount of straw crushing and incorporation into the soil. Trencher and seeder penetration into soil caused wheel slippage. Tractor wheel slippage increased by increasing the ploughing depth. Wheel slippage was calculated by measuring the distance (A) for five revolutions of the wheel in normal operation (near zero slippage). During fieldwork with the seeder attached, a second measured distance (B) for five revolutions of the tractor wheel was recorded [63]. Wheel slippage was found to be 8.2% with Equation (17).
3.6. Cost Analysis
After technical and field testing, a cost examination was performed to study the economics of the seeder. The operational cost was carried out in USD/h and USD/ha by calculating the annual fixed cost and variable cost [63]. All the input variables, viz, salvage value, the life of the machine, interest rate, insurance, tax, housing, repair and maintenance, labour, fuel charges, field capacity, and fuel consumption were counted per the market rates [65]. The operational cost for this seeder was calculated 16.27 USD/h and 40.68 USD/ha, as mentioned in Table 6 by adopting the detailed procedure [66].
Table 6.
Cost analysis of the precision seeder to study the economics/operational cost in terms of USD/ha and USD/h.
3.7. Precision Seeding
In precision seeding, the seed depth and uniformity are the independent variables (predictors) that affect the precise placement of precision seeding at various forward speeds of the tractor [67]. The mean seed depth was calculated by measuring the depth of each planted seed and then averaging the measurements in each pass. During the test, the mean depth was measured 4 cm in every row. The coefficient of uniformity for seed placement was calculated by measuring the maximum spacing between seeds over the minimum spacing between seeds. After sowing, the plant emergence rate was calculated in terms of the number of plants sprouted per unit area. The plants were counted in a 1- metre squared area across the test field and the mean was calculated on 255 plants per square metre. To check the response of the variable, multiple linear regression analysis was performed.
The p-value is less than α = 5%, hence the plant count has a significant direct positive relationship between the seed depth (cm) and coefficient of uniformity, as calculated in Table 7. The R-squared value is 0.968, which means there is a very strong relationship between the independent (Y) and dependent (X1, X2) variables. The p-value of seed depth (cm) and the coefficient of uniformity are 0.006 and 0.001, respectively, which are highly significant for plant count and in the end played a vital role in the yield of wheat.
Table 7.
Multi-linear regression analysis to check the significance b/w independent and response variables.
3.8. Vegetative Growth/Yield
After performing multiple tests, the wheat crop was grown in the field of rice using the precision seeder at 80 hectares in the districts of Sheikhupura, Lahore, and Faisalabad during the Rabi 2021-22 and 2022-23 seasons (Figure 13). The varieties of seeds used were Akbar-19 and Faisalabad-8. The values of N, P, and K with carbon content were measured in the soil of the field trial and were found to be high [68] after the incorporation of rice straw into the soil. The method of sowing wheat with the precision seeder was compared with conventional sowing. The field parameters observed included the vegetative growth, tillering, spike size, and plant population per square meter area [69], which were recorded as 20–25, 10–12, and 255 cm long, respectively. At the time of harvesting, 13% more yield was calculated in the same environment without affecting the soil health.
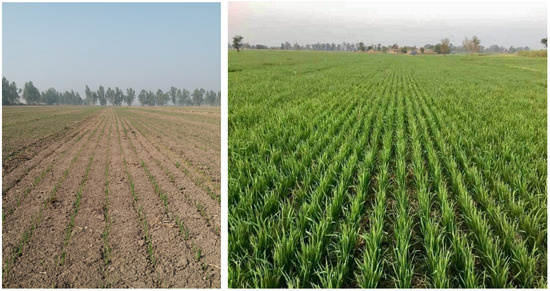
Figure 13.
Vegetative growth of wheat sown with the precision seeder in the prior season’s rice field.
Wheat Yield Comparison under Different Sowing Methods
Wheat was sowed in rice fields with four different methods to study the straw burning and tillage impact at the end of harvesting in terms of yield per kilogram per hectare. The Akbar-19 variety of wheat seed was selected for trial and sowed on 15th November. In this study, two seasons of data were collected and analysed in 2021. In the first two methods of sowing, straw was burnt, while the last two methods of sowing were without burning, as shown in Figure 14. After burning, the soil seed was prepared with a disc harrow and tine cultivators; the broad-casting and Rabi seed drill methods were used to sow wheat in the first and second methods of sowing. In the third method, straw was collected manually and wheat was directly drilled into stubbles with the help of a Happy Seeder. In the fourth method, rice straw was incorporated into the soil and wheat sown with the precision seeder in a single path. At the time of harvesting, the yields recorded were 3754 kg/ha, 3952 kg/ha, 4446 kg/ha, and 5028 kg/ha, respectively, for the four methods. The results showed that straw burning causes adverse effects on the soil and yield, while straw incorporation into soil imposes a positive impact and increases yield. A significant positive trend was seen for sowing methods in terms of yield, and the precision seeder trial field produced 5028 kg/ha without harming the soil health or environment, which is high compared to a study of a seeder that produced a 3497 kg/ha grain yield [45].
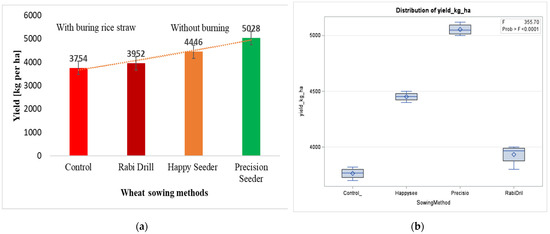
Figure 14.
Wheat yield under different sowing methods. (a) Bar graph describes the yield (kg/ha), with a baseline of the first two methods with burning, while the other two methods are without the burning of the rice straw. (b) Boxplot of mean with F-score.
To compare the wheat yields of the four different methods of sowing, analysis of variance (ANOVA) and F-test analyses were conducted by checking all assumptions of the test, viz, independent samples, data are normally distributed, same variance, and random sampling. The level of significance (α = 1%) is defined by formulating the hypotheses as: the null hypothesis (H0) is all means are equal, while the alternative hypothesis (H1) is at least one mean is different from the other means. SAS version 9.4 was used to calculate the ANOVA and upper tail F-test, as shown in Table 8. The p-value (<0.0001) is less than alpha (0.01), rejecting the null hypothesis, which means the yield from at least one method of sowing is different from the other methods.
Table 8.
ANOVA in SAS9.4 to compare the means of wheat yield using different sowing methods.
The Tukey–Kramer method was used to investigate the pairwise yield comparison for all four methods of sowing and the Honestly Significant Difference (HSD) (Equation (19)) was used.
Equation (20) states that if the absolute mean difference between two samples is less than or equal to the HSD value (169.60), then there is no significant difference between μ₁ and μ₂. In the case of the control and Rabi drill methods of sowing, the mean yields of both methods are less than the HSD value (169.60). Therefore, the means of both methods are significantly the same. For the other five pairs of comparisons, the absolute values of the mean yields are greater than the HSD value. Hence, the average yields of all other methods are significantly different from each other.
4. Conclusions
The precision seeder that was developed and previously described successfully performed multiple operations, viz: (i) crush the prior crop’s residue, (ii) prepare the soil seedbed and incorporate the straw into the soil, (iii) make mini trenches, (iv) place seed and fertilizer precisely in a single path along the mini trench. The design achieved the research goal of simultaneously sowing the wheat while managing both heavy rice straw and stubble in a rice–wheat cropping system. The theoretical field capacity of the precision seeder was measured as 0.408 ha/h, with 85.78% field efficiency and a minimum operational cost of 40.68 USD/ha. A uniform seed placement depth of 4 cm was achieved throughout the operation. The tractor was operated in the first low gear with a forward speed of 2.05 km/h, and for best results, a tractor with a creeper gear system is recommended. The straw crushing efficiency was measured as 90.2% at a straw load of 8 t/ha. The precision seeder method produced a significant (α = 0.01) increase in yield over all the other sowing methods measured. It also helped to reduce environmental pollution, particularly the smog that mainly arises from rice burning, and enhanced organic matter in the soil with the incorporation of the rice straw translating into a 13% higher yield than the Happy Seeder, which required manual removal of the straw from the field. This study has the following key conclusions:
- Wheat sowing is achieved in a single pass without burning or removal of rice residue by incorporating rice straw and stubble directly into the soil profile ahead of the trenching units.
- This seeder requires less tractor power (75 HP) to operate compared to other advanced multi-operation seeders via the introduction of a novel multi-gear box transmission.
- The operational cost of 40.68 USD/ha is lower than conventional tillage and reported a significantly (α = 0.01) higher yield (5028 kg/ha) versus conventional methods of tillage and drilling (3952 kg/ha) in rice–wheat cropping systems.
This research study provides a novel single-pass method for sowing wheat into heavy rice residue without the need for burning. The previous rice crop residue is retained and incorporated into the soil profile. By using this seeder, farmers can avoid burning straw and are able to sow wheat in a timely fashion with lower operational costs. This research directly contributes to SDG 1 by reducing the operational costs of wheat sowing, thereby increasing farmers’ incomes and helping to alleviate poverty. Additionally, it advances SDG 2 by improving agricultural productivity through a significant yield increase, promoting sustainable food production practices, and minimizing environmental pollution from straw burning. The integration of rice residue into the soil enhances soil health and organic matter, ensuring long-term sustainability and food security. This research also provides for farm policymakers, when framing regulations, a new tool that can be provided to farmers on a subsidy basis to encourage farmers to protect the environment and soil.
Author Contributions
Conceptualization, M.U.Y. and M.A.; methodology, M.U.Y. and S.A. (Sikander Ameer); software, H.A.R., D.O. and M.U.Y.; validation, M.A., S.A. (Shahzad Ahmad), H.I. and M.U.Y.; formal analysis, H.A.R., S.A. (Sikander Ameer) and D.O.; investigation, S.A. (Shahzad Ahmad); resources, S.A. (Shahzad Ahmad), M.U.Y., D.O. and M.A.; data curation, M.A., M.U.Y. and J.M.L.; writing—original draft preparation, M.U.Y.; writing—review and editing, J.M.L. and H.I.; visualization, H.I.; supervision, M.A. All authors have read and agreed to the published version of the manuscript.
Funding
This research received no external funding.
Data Availability Statement
The data presented in this study are available on request from the corresponding author.
Acknowledgments
The corresponding author extends heartfelt appreciation to farmers and all other stakeholders who provided with facility to test and trial of this precision seeder.
Conflicts of Interest
The authors declare that they have no conflicts of interest.
References
- World Food and Agriculture—Statistical Yearbook 2022; FAO: Rome, Italy, 2022; ISBN 978-92-5-136930-2.
- Erenstein, O.; Jaleta, M.; Mottaleb, K.A.; Sonder, K.; Donovan, J.; Braun, H.-J. Global Trends in Wheat Production, Consumption and Trade. In Wheat Improvement: Food Security in a Changing Climate; Reynolds, M.P., Braun, H.-J., Eds.; Springer International Publishing: Cham, Switzerland, 2022; pp. 47–66. ISBN 978-3-030-90673-3. [Google Scholar]
- Su, D.; Qiao, Y.; Kong, H.; Sukkarieh, S. Real Time Detection of Inter-Row Ryegrass in Wheat Farms Using Deep Learning. Biosyst. Eng. 2021, 204, 198–211. [Google Scholar] [CrossRef]
- World Population Clock: 8.1 Billion People (LIVE, 2023)—Worldometer. Available online: https://www.worldometers.info/world-population/ (accessed on 5 October 2023).
- Shah, B.H.; Hamid, F.S.; Islam, S.U.; Ahmed, N.; Ahmad, F.; Khan, N.; Zaman, Q.U. Evaluation of Elite Rice (Oryza sativa L.) Lines for Yield and Yield Components. PJAR 2020, 33, 1–191. [Google Scholar] [CrossRef][Green Version]
- Martin Goal 2: Zero Hunger. United Nations Sustainable Development. Available online: https://www.un.org/sustainabledevelopment/hunger/ (accessed on 18 June 2024).
- United Nations. Department of Economic and Social Affairs The Sustainable Development Goals Report 2023: Special Edition; The Sustainable Development Goals Report; United Nations: San Francisco, CA, USA, 2023; ISBN 978-92-1-002491-4. [Google Scholar]
- Share of Economic Sectors in the Global Gross Domestic Product (GDP) from 2011 to 2021. Available online: https://www.statista.com/statistics/256563/share-of-economic-sectors-in-the-global-gross-domestic-product/ (accessed on 5 October 2023).
- Ministry of Finance | Government of Pakistan |. Available online: https://www.finance.gov.pk/survey_2022.html (accessed on 5 October 2023).
- Liu, K.; Harrison, M.T.; Wang, B.; Yang, R.; Yan, H.; Zou, J.; Liu, D.L.; Meinke, H.; Tian, X.; Ma, S.; et al. Designing High-Yielding Wheat Crops under Late Sowing: A Case Study in Southern China. Agron. Sustain. Dev. 2022, 42, 29. [Google Scholar] [CrossRef]
- McDonald, A.J.; Riha, S.J.; Duxbury, J.M.; Steenhuis, T.S.; Lauren, J.G. Soil Physical Responses to Novel Rice Cultural Practices in the Rice–Wheat System: Comparative Evidence from a Swelling Soil in Nepal. Soil Tillage Res. 2006, 86, 163–175. [Google Scholar] [CrossRef]
- Balwinder-Singh; Humphreys, E.; Gaydon, D.S. Sudhir-Yadav Options for Increasing the Productivity of the Rice–Wheat System of North West India While Reducing Groundwater Depletion. Part 2. Is Conservation Agriculture the Answer? Field Crops Res. 2015, 173, 81–94. [Google Scholar] [CrossRef]
- Ferdows, M.N.; Rahman, M.A.; Ali, M.R.; Hanif, M.A.; Tabriz, S.S.; Hossen, M.S.; Rokonuzzaman, M. Development and Performance Evaluation of Low-Cost 2WT-Operated Earthing-Up Machine for Sugarcane Cultivation in Bangladesh. AgriEngineering 2023, 5, 1327–1346. [Google Scholar] [CrossRef]
- Bhatt, R.; Kukal, S.S.; Busari, M.A.; Arora, S.; Yadav, M. Sustainability Issues on Rice–Wheat Cropping System. Int. Soil Water Conserv. Res. 2016, 4, 64–74. [Google Scholar] [CrossRef]
- Upadhyay, G.; Raheman, H. Comparative Analysis of Tillage in Sandy Clay Loam Soil by Free Rolling and Powered Disc Harrow. Eng. Agric. Environ. Food 2019, 12, 118–125. [Google Scholar] [CrossRef]
- Tadić, V.; Gligorević, K.; Mileusnić, Z.; Miodragović, R.; Hajmiler, M.; Radočaj, D. Agricultural Engineering Technologies in the Control of Frost Damage in Permanent Plantations. AgriEngineering 2023, 5, 2079–2111. [Google Scholar] [CrossRef]
- Singh, G.; Jalota, S.K.; Sidhu, B.S. Soil Physical and Hydraulic Properties in a Rice-Wheat Cropping System in India: Effects of Rice-Straw Management. Soil Use Manag. 2005, 21, 17–21. [Google Scholar] [CrossRef]
- Liu, C.; Wang, L.; Cocq, K.L.; Chang, C.; Li, Z.; Chen, F.; Liu, Y.; Wu, L. Climate Change and Environmental Impacts on and Adaptation Strategies for Production in Wheat-Rice Rotations in Southern China. Agric. For. Meteorol. 2020, 292–293, 108136. [Google Scholar] [CrossRef]
- Timsina, J.; Jat, M.L.; Majumdar, K. Rice-Maize Systems of South Asia: Current Status, Future Prospects and Research Priorities for Nutrient Management. Plant Soil 2010, 335, 65–82. [Google Scholar] [CrossRef]
- Capinera, J.L. Relationships between Insect Pests and Weeds: An Evolutionary Perspective. Weed Sci. 2005, 53, 892–901. [Google Scholar] [CrossRef]
- Goswami, S.B.; Mondal, R.; Mandi, S.K. Crop Residue Management Options in Rice–Rice System: A Review. Arch. Agron. Soil Sci. 2020, 66, 1218–1234. [Google Scholar] [CrossRef]
- FAO. Remote Sensing for Space-Time Mapping of Smog in Punjab and Identification of the Underlying Causes Using Geographic Information System (R-SMOG); FAO: Rome, Italy, 2020; ISBN 978-92-5-131960-4. [Google Scholar]
- Sharma, A.; Brar, A.S. Wheat Drilling Directly in Combine Harvested Paddy Fields: A Comparative Input-Output Energy Analysis. J. Biosyst. Eng. 2022, 47, 370–385. [Google Scholar] [CrossRef]
- Badagliacca, G.; Messina, G.; Praticò, S.; Lo Presti, E.; Preiti, G.; Monti, M.; Modica, G. Multispectral Vegetation Indices and Machine Learning Approaches for Durum Wheat (Triticum durum Desf.) Yield Prediction across Different Varieties. AgriEngineering 2023, 5, 2032–2048. [Google Scholar] [CrossRef]
- Ghosh, S.; Das, T.K.; Rana, K.S.; Biswas, D.R.; Das, D.K.; Singh, G.; Bhattacharyya, R.; Datta, D.; Rathi, N.; Bhatia, A. Energy Budgeting and Carbon Footprint of Contrasting Tillage and Residue Management Scenarios in Rice-Wheat Cropping System. Soil Tillage Res. 2022, 223, 105445. [Google Scholar] [CrossRef]
- Nigon, C.M.; Shinners, K.J.; Friede, J.C. An Apparatus and Method for Evaluating Particle-Size Distribution of Small Grain Crop Residues. AgriEngineering 2022, 4, 1016–1029. [Google Scholar] [CrossRef]
- Li, C.; Tang, Y.; McHugh, A.D.; Wu, X.; Liu, M.; Li, M.; Xiong, T.; Ling, D.; Tang, Q.; Liao, M.; et al. Development and Performance Evaluation of a Wet-Resistant Strip-till Seeder for Sowing Wheat Following Rice. Biosyst. Eng. 2022, 220, 146–158. [Google Scholar] [CrossRef]
- Liu, X.; Peng, C.; Zhang, W.; Li, S.; An, T.; Xu, Y.; Ge, Z.; Xie, N.; Wang, J. Subsoiling Tillage with Straw Incorporation Improves Soil Microbial Community Characteristics in the Whole Cultivated Layers: A One-Year Study. Soil Tillage Res. 2022, 215, 105188. [Google Scholar] [CrossRef]
- Kornecki, T.S.; Kichler, C.M. Influence of Recurrent Rolling/Crimping of a Cereal Rye/Crimson Clover Cover Crop on No-Till Bush Bean Yield. AgriEngineering 2022, 4, 855–870. [Google Scholar] [CrossRef]
- Zhuo, S.-N.; Ren, H.-Y.; Xie, G.-J.; Xing, D.-F.; Liu, B.-F. Conversion Mechanism of Biomass to Nano Zero-Valent Iron Biochar: Iron Phase Transfer and in Situ Reduction. Engineering 2023, 21, 124–134. [Google Scholar] [CrossRef]
- Sahbeni, G.; Székely, B.; Musyimi, P.K.; Timár, G.; Sahajpal, R. Crop Yield Estimation Using Sentinel-3 SLSTR, Soil Data, and Topographic Features Combined with Machine Learning Modeling: A Case Study of Nepal. AgriEngineering 2023, 5, 1766–1788. [Google Scholar] [CrossRef]
- Chu, J.; Guo, X.; Zheng, F.; Zhang, X.; Dai, X.; He, M. Effect of Delayed Sowing on Grain Number, Grain Weight, and Protein Concentration of Wheat Grains at Specific Positions within Spikes. J. Integr. Agric. 2023, 22, 2359–2369. [Google Scholar] [CrossRef]
- Kirthiga, S.M.; Patel, N.R. In-Season Wheat Yield Forecasting at High Resolution Using Regional Climate Model and Crop Model. AgriEngineering 2022, 4, 1054–1075. [Google Scholar] [CrossRef]
- Ma, C.; Liu, Y.; Wang, J.; Xue, L.; Hou, P.; Xue, L.; Yang, L. Warming Increase the N2O Emissions from Wheat Fields but Reduce the Wheat Yield in a Rice-Wheat Rotation System. Agric. Ecosyst. Environ. 2022, 337, 108064. [Google Scholar] [CrossRef]
- Nazim Ud Dowla, M.A.N.; Edwards, I.; O’Hara, G.; Islam, S.; Ma, W. Developing Wheat for Improved Yield and Adaptation Under a Changing Climate: Optimization of a Few Key Genes. Engineering 2018, 4, 514–522. [Google Scholar] [CrossRef]
- Yaseen, M.U.; Ashraf, M.; Munir, A. Development and Performance Evalution of Solar Assisted Milk Pasteurizer by Using Vacuum Tube Collector. Pak. J. Agric. Sci. 2019, 56, 693–700. [Google Scholar] [CrossRef]
- Luo, W.; Chen, X.; Guo, K.; Qin, M.; Wu, F.; Gu, F.; Hu, Z. Optimization and Accuracy Analysis of a Soil–Planter Model during the Sowing Period of Wheat after a Rice Stubble Based Discrete Element Method. Agriculture 2023, 13, 2036. [Google Scholar] [CrossRef]
- Cui, N.; Pozzobon, V. Food-Grade Cultivation of Saccharomyces Cerevisiae from Potato Waste. AgriEngineering 2022, 4, 951–968. [Google Scholar] [CrossRef]
- Toscano, P.; Cutini, M.; Filisetti, A.; Premoli, E.; Porcu, M.; Catalano, N.; Bisaglia, C.; Brambilla, M. Workability Assessment of Different Stony Soils by Soil–Planter Interface Noise and Acceleration Measurement. AgriEngineering 2022, 4, 1139–1152. [Google Scholar] [CrossRef]
- Priori, S.; Zanini, M.; Falcioni, V.; Casa, R. Topsoil Vertical Gradient in Different Tillage Systems: An Analytical Review. Soil Tillage Res. 2024, 236, 105947. [Google Scholar] [CrossRef]
- Bhaduri, D.; Purakayastha, T.J. Long-Term Tillage, Water and Nutrient Management in Rice-Wheat Cropping System: Assessment and Response of Soil Quality. Soil Tillage Res. 2014, 144, 83–95. [Google Scholar] [CrossRef]
- Shorstkii, I.; Sosnin, M.; Mounassar, E.H.A.; Bindrich, U.; Heinz, V.; Aganovic, K. The Effect of High-Pressure Pre-Soaking on the Water Absorption, Gelatinization Properties, and Microstructural Properties of Wheat Grains. AgriEngineering 2022, 4, 1153–1163. [Google Scholar] [CrossRef]
- Manpreet-Singh; Chaleka, A.T.; Goyal, R.; Gupta, N.; Singh, A.; Singh, M.; Sharma, S.; Dixit, A.K.; Malik, A.; Al-Ansari, N.; et al. PAU Smart Seeder: A Novel Way Forward for Rice Residue Management in North-West India. Sci Rep 2024, 14, 11747. [Google Scholar] [CrossRef] [PubMed]
- Jaidka, M.; Sharma, M.; Sandhu, P.S. Evaluation of Rice Residue Management Options in District Shaheed Bhagat Singh Nagar of Punjab—A Survey. Agricul. Res. Jour. 2020, 57, 358. [Google Scholar] [CrossRef]
- Kirandeep; Sharma, M.; Singh, R. Effect of Different Sowing Techniques and Varieties on Yield of Wheat (Triticum aestivum L.). J. Krishi Vigyan 2020, 9, 92–98. [Google Scholar] [CrossRef]
- Choudhary, S.; Upadhyay, G.; Patel, B.; Naresh; Jain, M. Energy Requirements and Tillage Performance Under Different Active Tillage Treatments in Sandy Loam Soil. J. Biosyst. Eng. 2021, 46, 353–364. [Google Scholar] [CrossRef]
- Mooventhan, P.; Singh, S.R.K.; Venkatesan, P.; Dixit, A.; Sharma, K.C.; Sivalingam, P.N.; Gupta, A.K.; Singh, U.; Kaushal, P. Happy Seeder—A Promising Technology In Conservation Agriculture. Har. Dhara 2018, 1, 27–29. [Google Scholar]
- Fernandez-Gallego, J.A.; Kefauver, S.C.; Gutiérrez, N.A.; Nieto-Taladriz, M.T.; Araus, J.L. Wheat Ear Counting In-Field Conditions: High Throughput and Low-Cost Approach Using RGB Images. Plant Methods 2018, 14, 22. [Google Scholar] [CrossRef]
- Bindu; Sharma, M.; Manan, J. Ways and Means of Paddy Straw Management: A Review. J. Rev. Agric. Allied Fields 2018, 1, 1–8. [Google Scholar] [CrossRef]
- Grahmann, K.; Honsdorf, N.; Crossa, J.; Alvarado Beltrán, G.; Govaerts, B.; Verhulst, N. Dry Sowing Reduced Durum Wheat Performance under Irrigated Conservation Agriculture. Field Crops Res. 2021, 274, 108310. [Google Scholar] [CrossRef]
- Sidhu, H.S.; Manpreet-Singh; Humphreys, E.; Yadvinder-Singh; Balwinder-Singh; Dhillon, S.S.; Blackwell, J.; Bector, V.; Malkeet-Singh; Sarbjeet-Singh. The Happy Seeder Enables Direct Drilling of Wheat into Rice Stubble. Aust. J. Exp. Agric. 2007, 47, 844–854. [Google Scholar] [CrossRef]
- Bishnoi, R.; Kumar, V.; Bishnoi, D.K.; Meena, M.S. Economics of Super Seeder Technique of Wheat Cultivation in Haryana. IJECC 2023, 13, 574–582. [Google Scholar] [CrossRef]
- Dhanda, S.; Yadav, A.; Yadav, D.B.; Chauhan, B.S. Emerging Issues and Potential Opportunities in the Rice–Wheat Cropping System of North-Western India. Front. Plant Sci. 2022, 13, 832683. [Google Scholar] [CrossRef] [PubMed]
- Latif, M.T.; Hussain, M.; Zohaib, A.; Hassan, I. Performance Evaluation of Super Seeder for Wheat Sowing in Rice-Wheat Cropping System of Pakistan. SJA 2024, 40, 109. [Google Scholar] [CrossRef]
- Salokhe, V.M.; Hanif Miah, M.; Hoki, M. Effect of Blade Type on Power Requirement and Puddling Quality of a Rotavator in Wet Clay Soil. J. Terramechanics 1993, 30, 337–350. [Google Scholar] [CrossRef]
- Sokolowski, A.C.; Prack McCormick, B.; De Grazia, J.; Wolski, J.E.; Rodríguez, H.A.; Rodríguez-Frers, E.P.; Gagey, M.C.; Debelis, S.P.; Paladino, I.R.; Barrios, M.B. Tillage and No-Tillage Effects on Physical and Chemical Properties of an Argiaquoll Soil under Long-Term Crop Rotation in Buenos Aires, Argentina. Int. Soil Water Conserv. Res. 2020, 8, 185–194. [Google Scholar] [CrossRef]
- New MF 375 Tractor for Sale in Pakistan. Import Now. Available online: https://www.masseyferguson.com.pk/details-mf-375.html (accessed on 18 June 2024).
- Mollazade, K.; Ahmadi, H.; Alimardani, R. Optimal Design of Rotary Tiller. Int. J. Agric. Biol. Eng. 2009, 2, 1–7. [Google Scholar] [CrossRef]
- Daood, K. Mechanics of Materials by B. J. 7th. 2013. Available online: https://www.academia.edu/35205827/Mechanics_of_Materials_By_B_J_7th (accessed on 18 June 2024).
- Domek, G.; Kołodziej, A.; Dudziak, M.; Woźniak, T. Identification of the Quality of Timing Belt Pulleys. Procedia Eng. 2017, 177, 275–280. [Google Scholar] [CrossRef]
- Hirasawa, K.; Kataoka, T.; Kubo, T. Relationship between Required Power and PTO Speed in Rotary Tiller. IFAC Proc. Vol. 2013, 46, 141–146. [Google Scholar] [CrossRef]
- Conwell, J.C.; Johnson, G.E. Design, Construction and Instrumentation of a Machine to Measure Tension and Impact Forces in Roller Chain Drives. Mech. Mach. Theory 1996, 31, 525–531. [Google Scholar] [CrossRef]
- RNAM Test Codes and Procedures for Farm Machinery. Tech. Ser. Reg. Netw. Agric. Mach. 1983, 12, 297.
- Balta, B.; Sonmez, F.O.; Cengiz, A. Speed Losses in V-Ribbed Belt Drives. Mech. Mach. Theory 2015, 86, 1–14. [Google Scholar] [CrossRef]
- Yaseen, M.U.; Saddique, G.; Ashraf, M.; Yasmeen, Z.; Ahmad, S. Design, development and testing of mobile sprinkler raingun for smart irrigation in arid zone-based crops. J. Agric. Res. 2019, 57, 103–112. [Google Scholar]
- Smith, D.W.; Sims, B.G.; O’Neill, D.H. Testing and Evaluation of Agricultural Machinery and Equipment: Principles and Practices; FAO Agricultural Services Bulletin; Food and Agriculture Organization of the United Nations: Rome, Italy, 1994; ISBN 978-92-5-103458-3. [Google Scholar]
- Sun, J.; Zhang, Y.; Zhang, Y.; Li, P.; Teng, G. Precision Seeding Compensation and Positioning Based on Multisensors. Sensors 2022, 22, 7228. [Google Scholar] [CrossRef] [PubMed]
- Shi, Y.; Jiang, Y.; Wang, X.; Thuy, N.T.D.; Yu, H. A Mechanical Model of Single Wheat Straw with Failure Characteristics Based on Discrete Element Method. Biosyst. Eng. 2023, 230, 1–15. [Google Scholar] [CrossRef]
- Wang, F.; Li, F.; Mohan, V.; Dudley, R.; Gu, D.; Bryant, R. An Unsupervised Automatic Measurement of Wheat Spike Dimensions in Dense 3D Point Clouds for Field Application. Biosyst. Eng. 2022, 223, 103–114. [Google Scholar] [CrossRef]


Disclaimer/Publisher’s Note: The statements, opinions and data contained in all publications are solely those of the individual author(s) and contributor(s) and not of MDPI and/or the editor(s). MDPI and/or the editor(s) disclaim responsibility for any injury to people or property resulting from any ideas, methods, instructions or products referred to in the content. |
© 2024 by the authors. Licensee MDPI, Basel, Switzerland. This article is an open access article distributed under the terms and conditions of the Creative Commons Attribution (CC BY) license (https://creativecommons.org/licenses/by/4.0/).