Article

Geospatial Approach to Determine Nitrate Values in Banana Plantations

by
Angélica Zamora-Espinoza
1,
Juan Chin
1,2,
Adolfo Quesada-Román
3,* and
Veda Obando
4
1
Escuela de Ingeniería en Biosistemas, Universidad de Costa Rica, San José 2060, Costa Rica
2
Centro de Investigación en Contaminación Ambiental (CICA-UCR), San José 2060, Costa Rica
3
Escuela de Geografía, Universidad de Costa Rica, San José 2060, Costa Rica
4
Corporación Bananera Nacional (CORBANA), San José 6504-1000, Costa Rica
*
Author to whom correspondence should be addressed.
AgriEngineering 2024, 6(3), 2513-2525; https://doi.org/10.3390/agriengineering6030147
Submission received: 29 May 2024 / Revised: 4 July 2024 / Accepted: 25 July 2024 / Published: 1 August 2024

Abstract

:
Banana (Musa sp.) is one of the world’s most planted and consumed crops. Analysis of plantations using a geospatial perspective is growing in Costa Rica, and it can be used to optimize environmental analysis. The aim of this study was to propose a methodology to identify areas prone to water accumulation to quantify nitrate concentrations using geospatial modeling techniques in a 40 ha section of a banana plantation located in Siquirres, Limón, Costa Rica. A total of five geomorphometric variables (Slope, Slope Length factor (LS factor), Terrain Ruggedness Index (TRI), Topographic Wetness Index (TWI), and Flow Accumulation) were selected in the geospatial model. A 9 cm resolution digital elevation model (DEM) derived from unmanned aerial vehicles (UAVs) was employed to calculate geomorphometric variables. ArcGIS 10.6 and SAGA GIS 7.8.2 software were used in the data integration and analysis. The results showed that Slope and Topographic Wetness Index (TWI) are the geomorphometric parameters that better explained the areas prone to water accumulation and indicated which drainage channels are proper areas to sample nitrate values. The average nitrate concentration in high-probability areas was 8.73 ± 1.53 mg/L, while in low-probability areas, it was 11.28 ± 2.49 mg/L. Despite these differences, statistical analysis revealed no significant difference in nitrate concentrations between high- and low-probability areas. The method proposed here allows us to obtain reliable results in banana fields worldwide.

1. Introduction

Banana (Musa sp.) is one of the world’s most important crops planted in the tropics. It is produced in more than 130 countries worldwide and provides food and income to families of all continents [1]. According to the statistical database of the Food and Agriculture Organization of the United Nations (FAO) [1], in 2019, there was an approximate global production of 116 million tons of banana in a plantation area of 5 million hectares. In Latin America, the countries of Ecuador, Colombia, and Costa Rica lead the market and supply nearly 70% of the imports made by the European Union [2]. Extensive tropical banana plantations, like those in Costa Rica, share several common environmental characteristics. These plantations are typically located in flat lands near coastal regions (less than 100 km from the sea) and are known for their well-drained soils, high temperatures, and substantial annual precipitation. These conditions are not unique to Costa Rica but are prevalent in other major banana-producing regions such as Ecuador, Colombia, parts of Central America, and Southeast Asia. Therefore, the findings and methodologies proposed in our study can be applicable to other similar environments.
Banana plantations play a pivotal role in Costa Rica’s economy and agriculture; therefore, it is necessary to develop strategies to improve and optimize crop resources to identify chemical compounds such as nitrate (NO3). Nitrogen (N) is one of the most important nutrients for crops, and NO3 is the main source of nitrogen available for plants [3]. The use of fertilizers is necessary to provide enough NO3 to increase crop yield and maintain production according to the needs of the crop market [4]. Low nitrogen use efficiency in plants can be a potential source of contamination for the atmosphere, soil surface, and deep waters, resulting in eutrophication and polluting potable water [5,6,7].
To control concentrations of chemical compounds applied in the water and soil matrix, adequate environmental monitoring must be defined to ensure that nutrients are not lost in other natural processes, such as surface runoff and leaching [4,5]. Sampling these areas would allow banana producers to define alternatives to prevent or mitigate and, thus, reduce the environmental impact that their industry may cause without losses in the profitability of production [8]. Advances in current technology, such as precision agriculture, Geographic Information Systems (GISs), and geospatial models, allow for managing territory and agriculture with the aim of reducing the impacts that minerals may have on the environment, as well as determining cultivation areas, estimating productivity, and diagnosing diseases [9,10].These types of research are well known around the world; in India and Tanzania, GIS techniques were used in the optimization of banana crop fertilization [11,12,13]; in Australia and Africa, for the detection of banana plants [14,15]; in Kenya, to estimate erosion [16]; and others. The strategy of analyzing the crops with GIS technologies has also been implemented in different crops like fruits [17,18], rice [19,20], cereal crops [21], and others.
The novelty of this study lies in the integration of high-resolution digital elevation models (DEMs) derived from unmanned aerial vehicles (UAVs) with geomorphometric variables to develop a geospatial model specifically for identifying areas prone to water accumulation and nitrate concentration in banana plantations. While existing geospatial methods have been applied to other crops, this study uniquely addresses the context of banana plantations, offering tailored insights and practical recommendations for this important crop.
In this study, we aimed to develop a geospatial methodology for optimizing environmental analysis in banana plantations, focusing on a 40 ha section in Siquirres, Limón, Costa Rica. The hypothesis was that this methodology would effectively identify areas prone to water accumulation and allow the quantification of nitrate concentrations. To test this hypothesis, three research questions were addressed: (1) Can geospatial modeling techniques accurately identify areas prone to water accumulation using geomorphometric variables? (2) Is there a significant relationship between the selected geomorphometric variables (Slope and Topographic Wetness Index) and areas prone to water accumulation? (3) Can the geospatial model effectively indicate proper drainage channels for nitrate sampling? The study’s positive implication lies in its potential to enhance environmental sustainability in banana plantations globally. Successfully employing this geospatial approach, not only in Costa Rica but also in similar lowland and homogeneous land properties, offers a reliable means of minimizing water pollution and improving the overall ecological health of banana plantations. This achievement holds the promise of more efficient and eco-friendly banana cultivation practices in the future.

2. Material and Methods
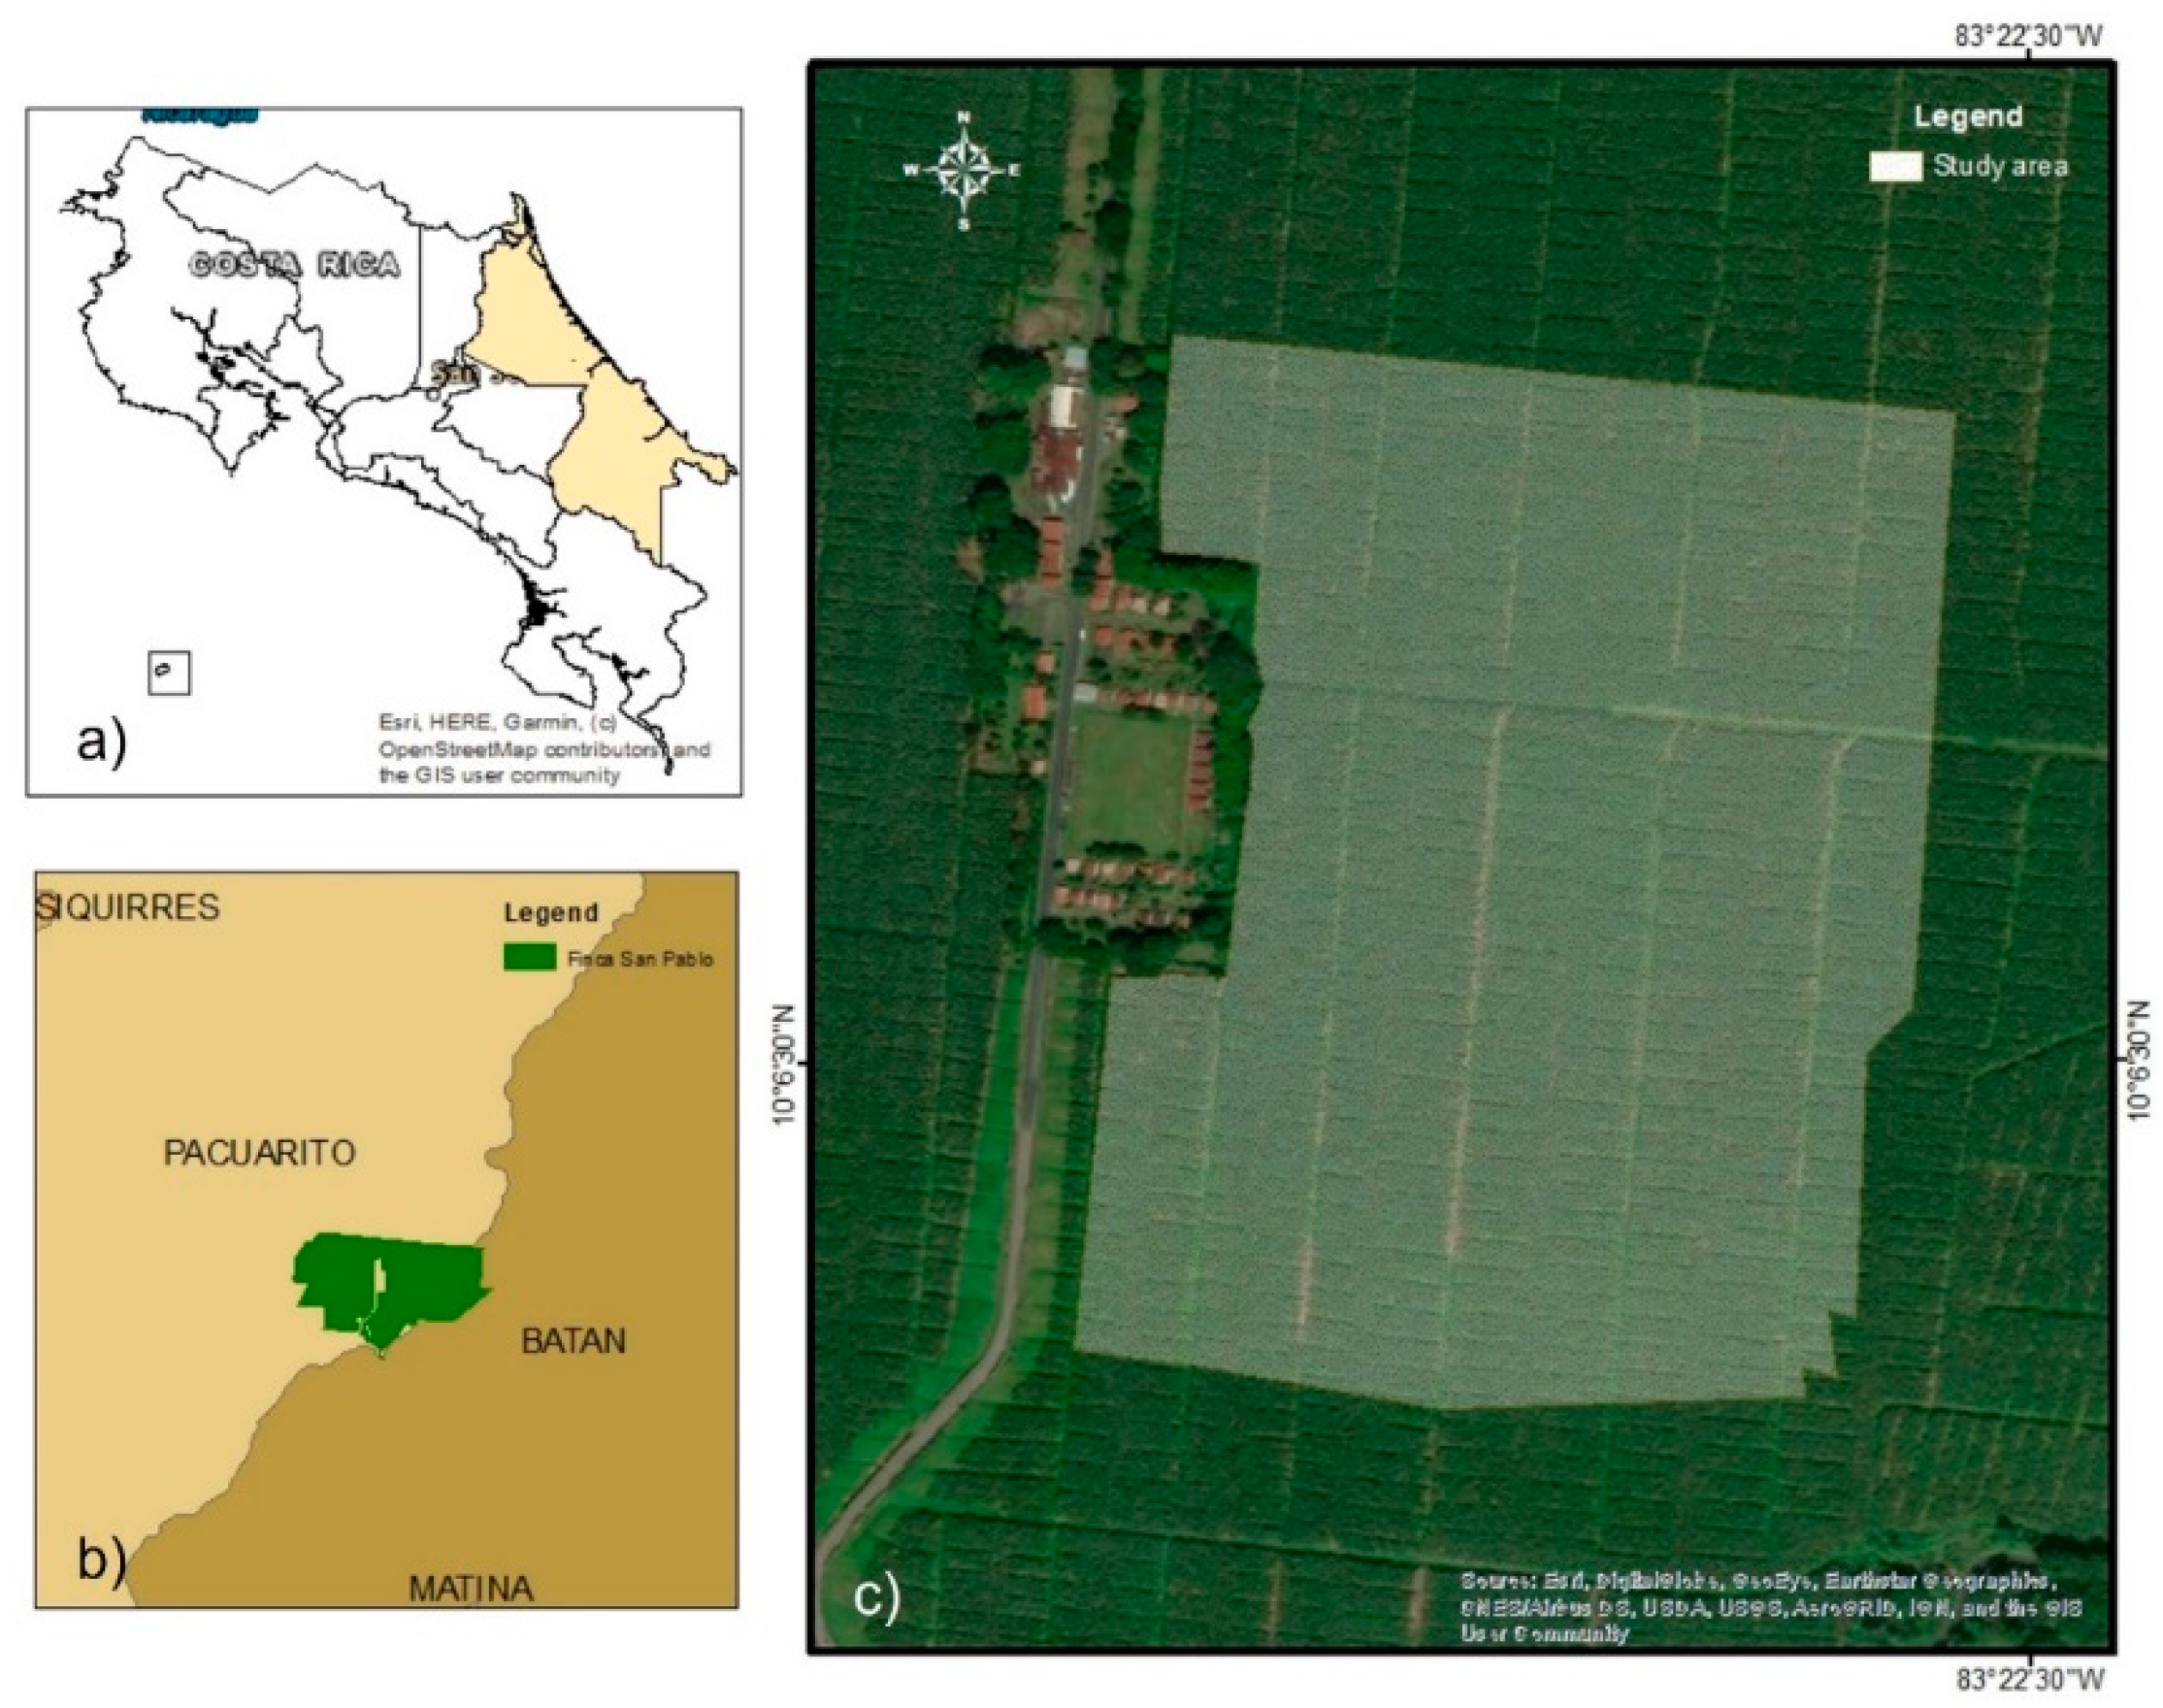
2.1. Study Area

The study was carried out in a 40 ha section of a banana plantation with a total area of 267 ha located in Siquirres, Limón, Costa Rica, between August 2021 and August 2022 (Figure 1). The climate is humid tropical with a mean annual temperature of 25.7 °C and a mean annual precipitation of 2254 mm. The minimum elevation is 22 m asl and rises to the maximum elevation of 44 m asl. These banana cultivars belong to the Grand Nain variety Musa sp., AAA group, Cavendish subgroup. The study area morphology is mostly flat with the scattered presence of domes. The plot used in this research is divided into several principal, secondary, and tertiary drainages.

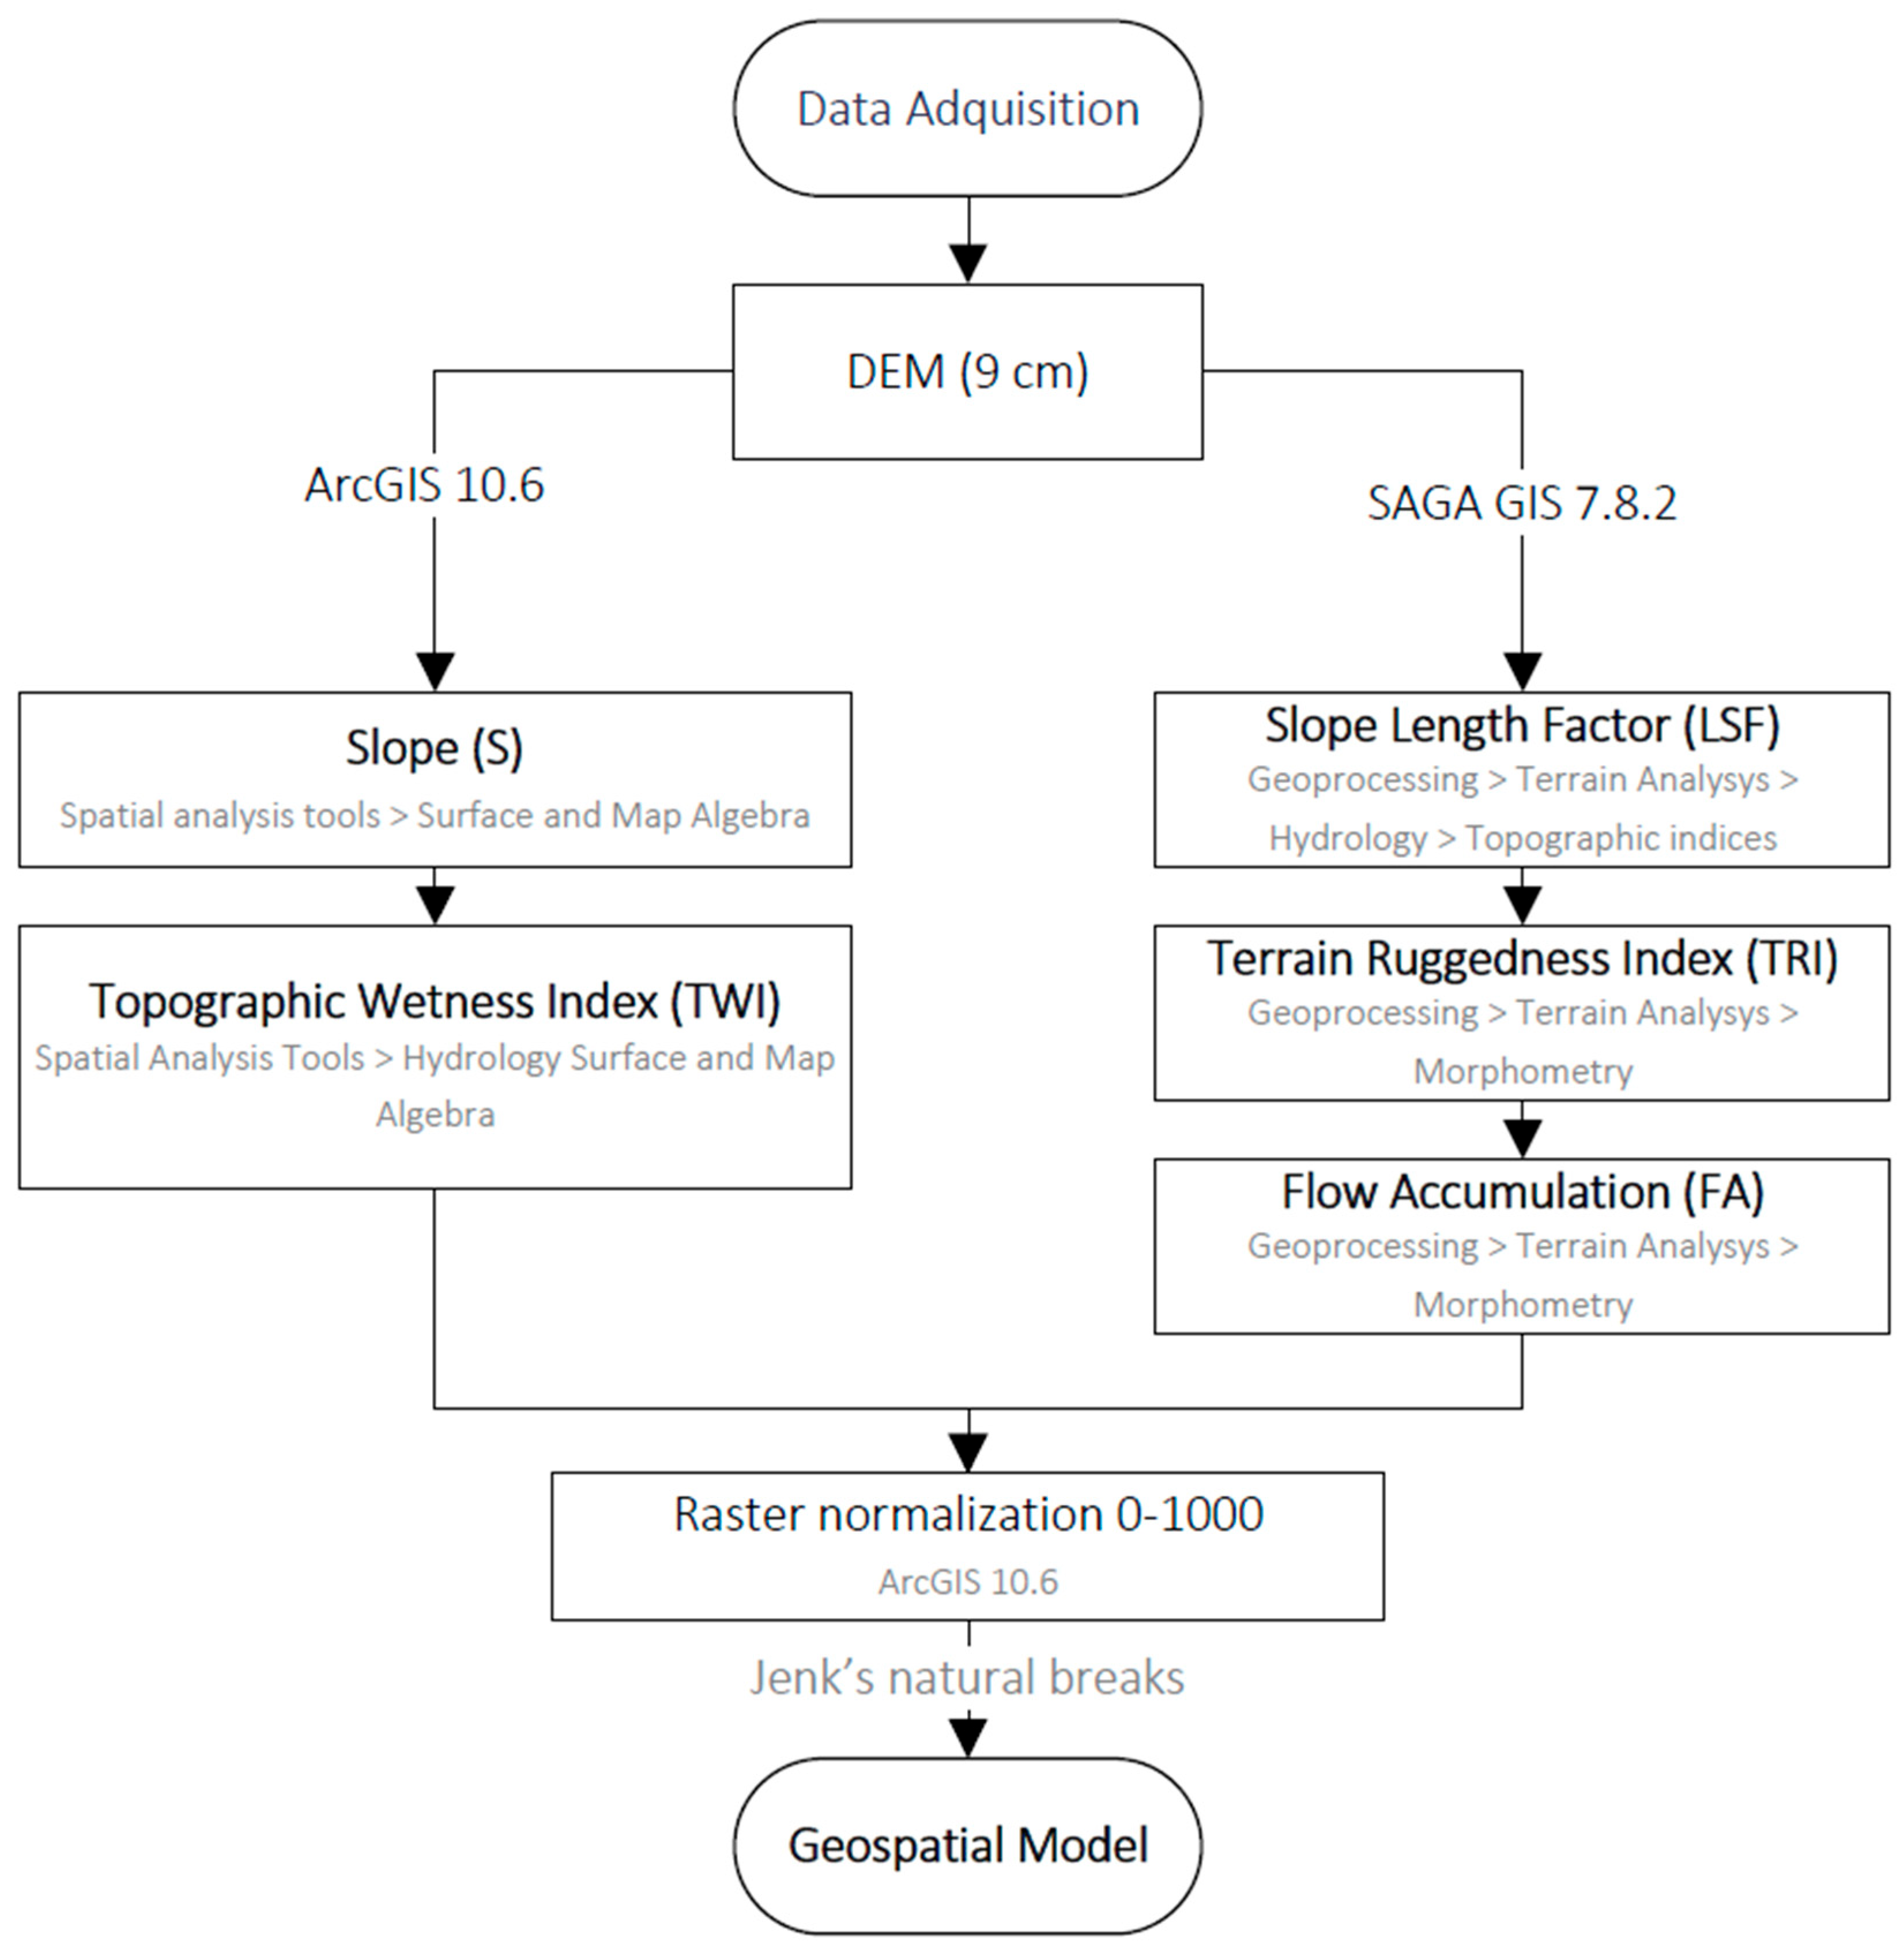
2.2. Geospatial Model
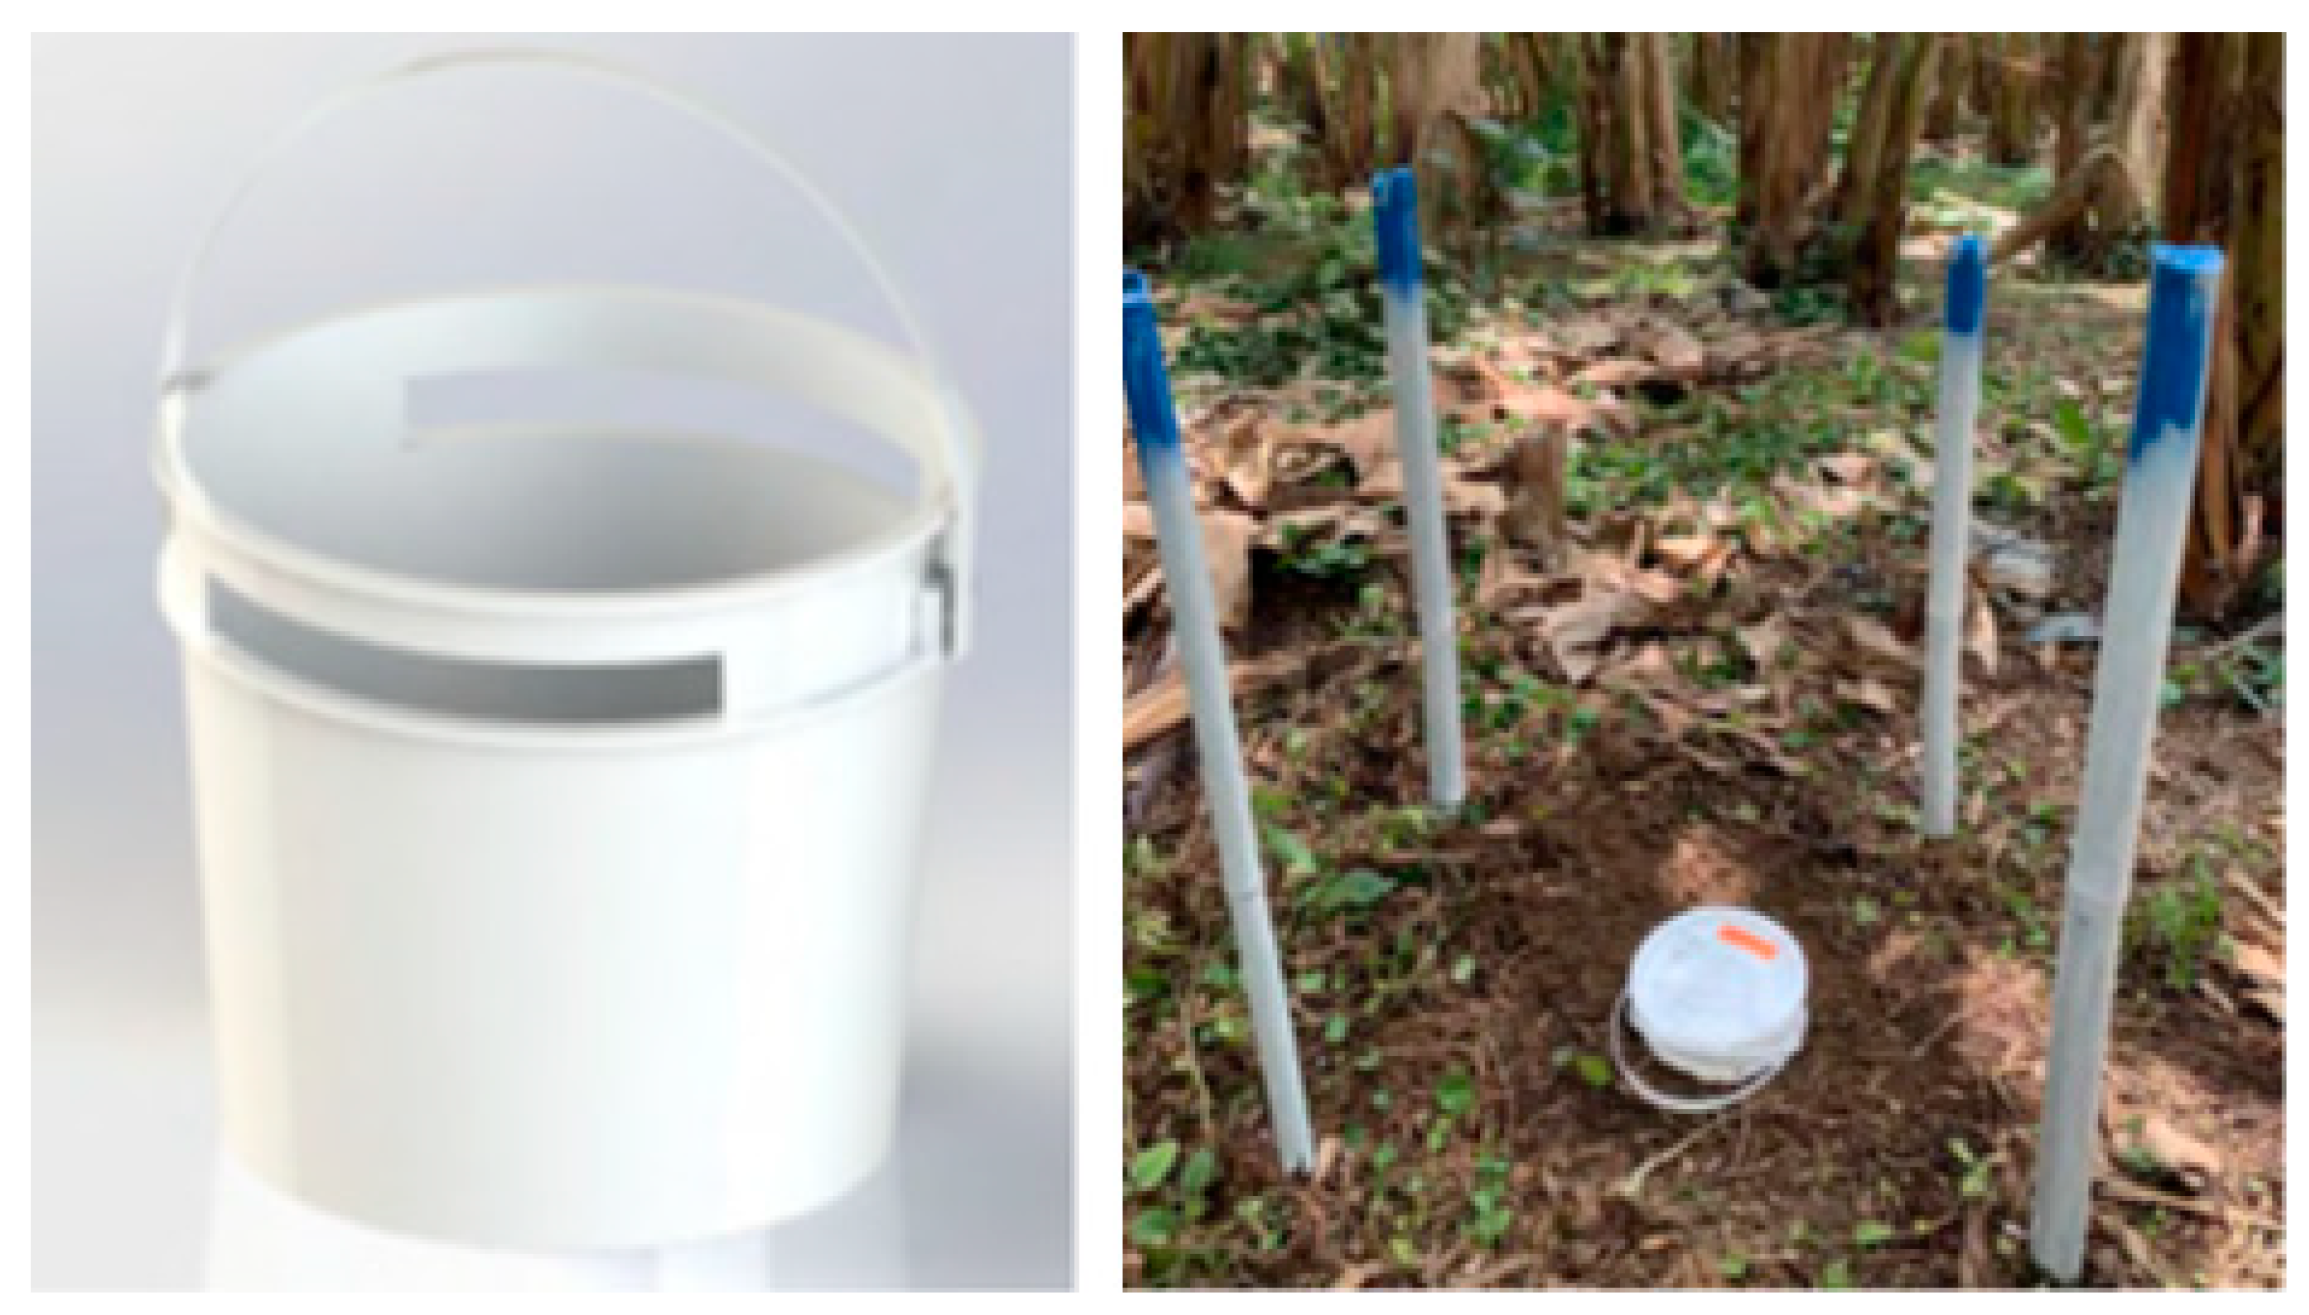
The geospatial model was obtained from the superposition of geomorphological data layers and indices. The model was run based on six factors: Slope Length factor (LS factor), Terrain Ruggedness Index (TRI), and Flow Accumulation (FA) were performed in SAGA GIS 7.8.2 (Figure 2). Meanwhile, Slope and Topographic Wetness Index (TWI) were calculated in ArcGIS 10.6 software [22]. The selected geomorphometric variables are directly related to water movement and accumulation in the landscape. Slope affects the velocity and direction of surface runoff; TWI indicates areas that are more likely to accumulate water; LS factor is related to soil erosion potential; TRI reflects terrain ruggedness, which can influence water flow paths; and Flow Accumulation identifies drainage patterns. Together, these variables provide a comprehensive picture of the hydrological dynamics that influence nitrate transport and accumulation. All the data sets were overlayed and normalized using spatial analyst tools in ArcGIS 10.6. Jenks’s natural breaks with two classes—high and low—were used to classify areas prone to water accumulation. Figure 2 shows the flow chart of the methodology used in this study.
The 9 cm resolution (9 cm × 9 cm pixel size) DEM used as a base for the geospatial model was collected from previous research conducted by CORBANA. The DJI Phantom 4 V.2 equipped with a camera RGB+ multispectral imaging system was used to capture the images and create the DEM. The UAV hovered at an elevation of 100 m above the floor with 20 ground control points (GCP) in June 2018.

2.3. Sampling

A chemical sampling program was established based on the geospatial model to analyze the behavior of the chemical compound at different points in the study area. Ten sampling points were defined according to the statistical design proposed. After obtaining the nitrate ion concentration, a statistical analysis was carried out. Surface water monitoring was conducted within 96 h (4 days) after five precipitation events greater than 50 mm. Surface water sampling was carried out in November and December 2021 and June 2022. The information recorded by the 28 Millas Meteorological Station was considered to define the sampling date.
The sampling points, which aimed to analyze nitrate concentration in the areas of high probability of moisture concentration, were placed at the beginning of the tertiary channels and those of low probability in the center of the domes (in the middle of the plantation). Then, 100 mL of surface water collected in runoff traps located at the entrance of the tertiary channels or in the center of the domes was taken according to the experimental design. The traps consisted of 3785 mL plastic containers, which were buried approximately 14.5 cm deep, and with the openings on the sides, surface water was allowed to enter, and the surplus overflowed (Figure 3). These containers were emptied prior to precipitation events to obtain samples of water stored for less than 96 h. Each sample was collected with gloves and labeled appropriately to identify the points; then, they were transferred to CORBANA’s Research Center at a temperature below 6 °C for processing.

2.4. Sample Analysis

The surface water samples were analyzed at CORBANA’s Scientific Research Center. A total of 50 surface water samples were analyzed in the investigation period. To quantify the concentration of nitrate, an Ion-Selective Electrode (ISE) was used [23] that was connected to a Thermo Scientific Orion Star A329 portable meter (Thermo Scientific, Waltham, MA, USA) [23]. To calibrate the equipment, 50 mL of standard solutions of 1 mg/L, 10 mg/L, and 100 mg/L in three 100 mL containers was used, and subsequently, 1 mL of ISA solution (Ionic Strength Adjuster 2M ((NH4)2SO4)) was added [24]. Finally, the ISE was introduced and shaken until the points of the calibration curve were adjusted.
In the sample preparation process, 50 mL of the collected runoff water was taken and filtered with Whatman 42 filter paper by gravity, and then 1 mL of ISA solution was added. Then, the EIS was introduced into the sample and stirred until the concentration reading of nitrate ion stabilized. Prior to sample preparation, it was ensured that both the standards and the samples were at a temperature of 23 °C to 25 °C.

2.5. Statistical Analysis

All analyses were performed with InfoStat statistical software version 2018 [25], and a significant level of α = 0.05 was considered. The normality of the distribution of the database was tested using the Shapiro–Wilk normality test, where if the probability value (p) was greater than the level of significance, the data were processed as a normal distribution; otherwise, there was no normality. If normal behavior was shown, a parametric variance statistic one-way ANOVA with Tukey test analysis was performed to define whether there were statistically significant differences. If the data did not show normal behavior, a nonparametric Kruskal–Wallis test [26] was performed to identify whether there were significant differences between samples. The null hypothesis (H0) was established as follows: “There is no significant difference in nitrate concentration between high and low range of probability of concentrating moisture”.

2.6. Generalized Linear Model

The Generalized Linear Model (GLM) was carried out based on an analysis of the Akaike Information Criterion (AIC) to predict minor errors and the quality of the statistical model [27]. A Pearson correlogram was performed to establish the linear correlation between the variables and the correlation coefficient (r) with a number between 1 and −1 (0.9 or −0.9 was considered with high collinearity) [28]. Subsequently, with a GLM in the R Studio program [29], the dependent variable, that is, nitrate ion concentration (C), was linked with the geomorphometric variables (independent variable) used in the geospatial model: Slope Length factor (LS factor), Terrain Ruggedness Index (TRI), Flow Accumulation (FA), Slope (S), and Topographic Wetness Index (TWI). In addition, with a statistical backward selection, we counteracted the null hypothesis (C~LSF + TWI + TRI + FA + S) against the alternative hypothesis (C~TWI + S). All covariates were standardized from 0 to 1. Finally, the model parameters were used to evaluate the weight of each interaction of covariate that explains the nitrate ion concentration.

3. Results

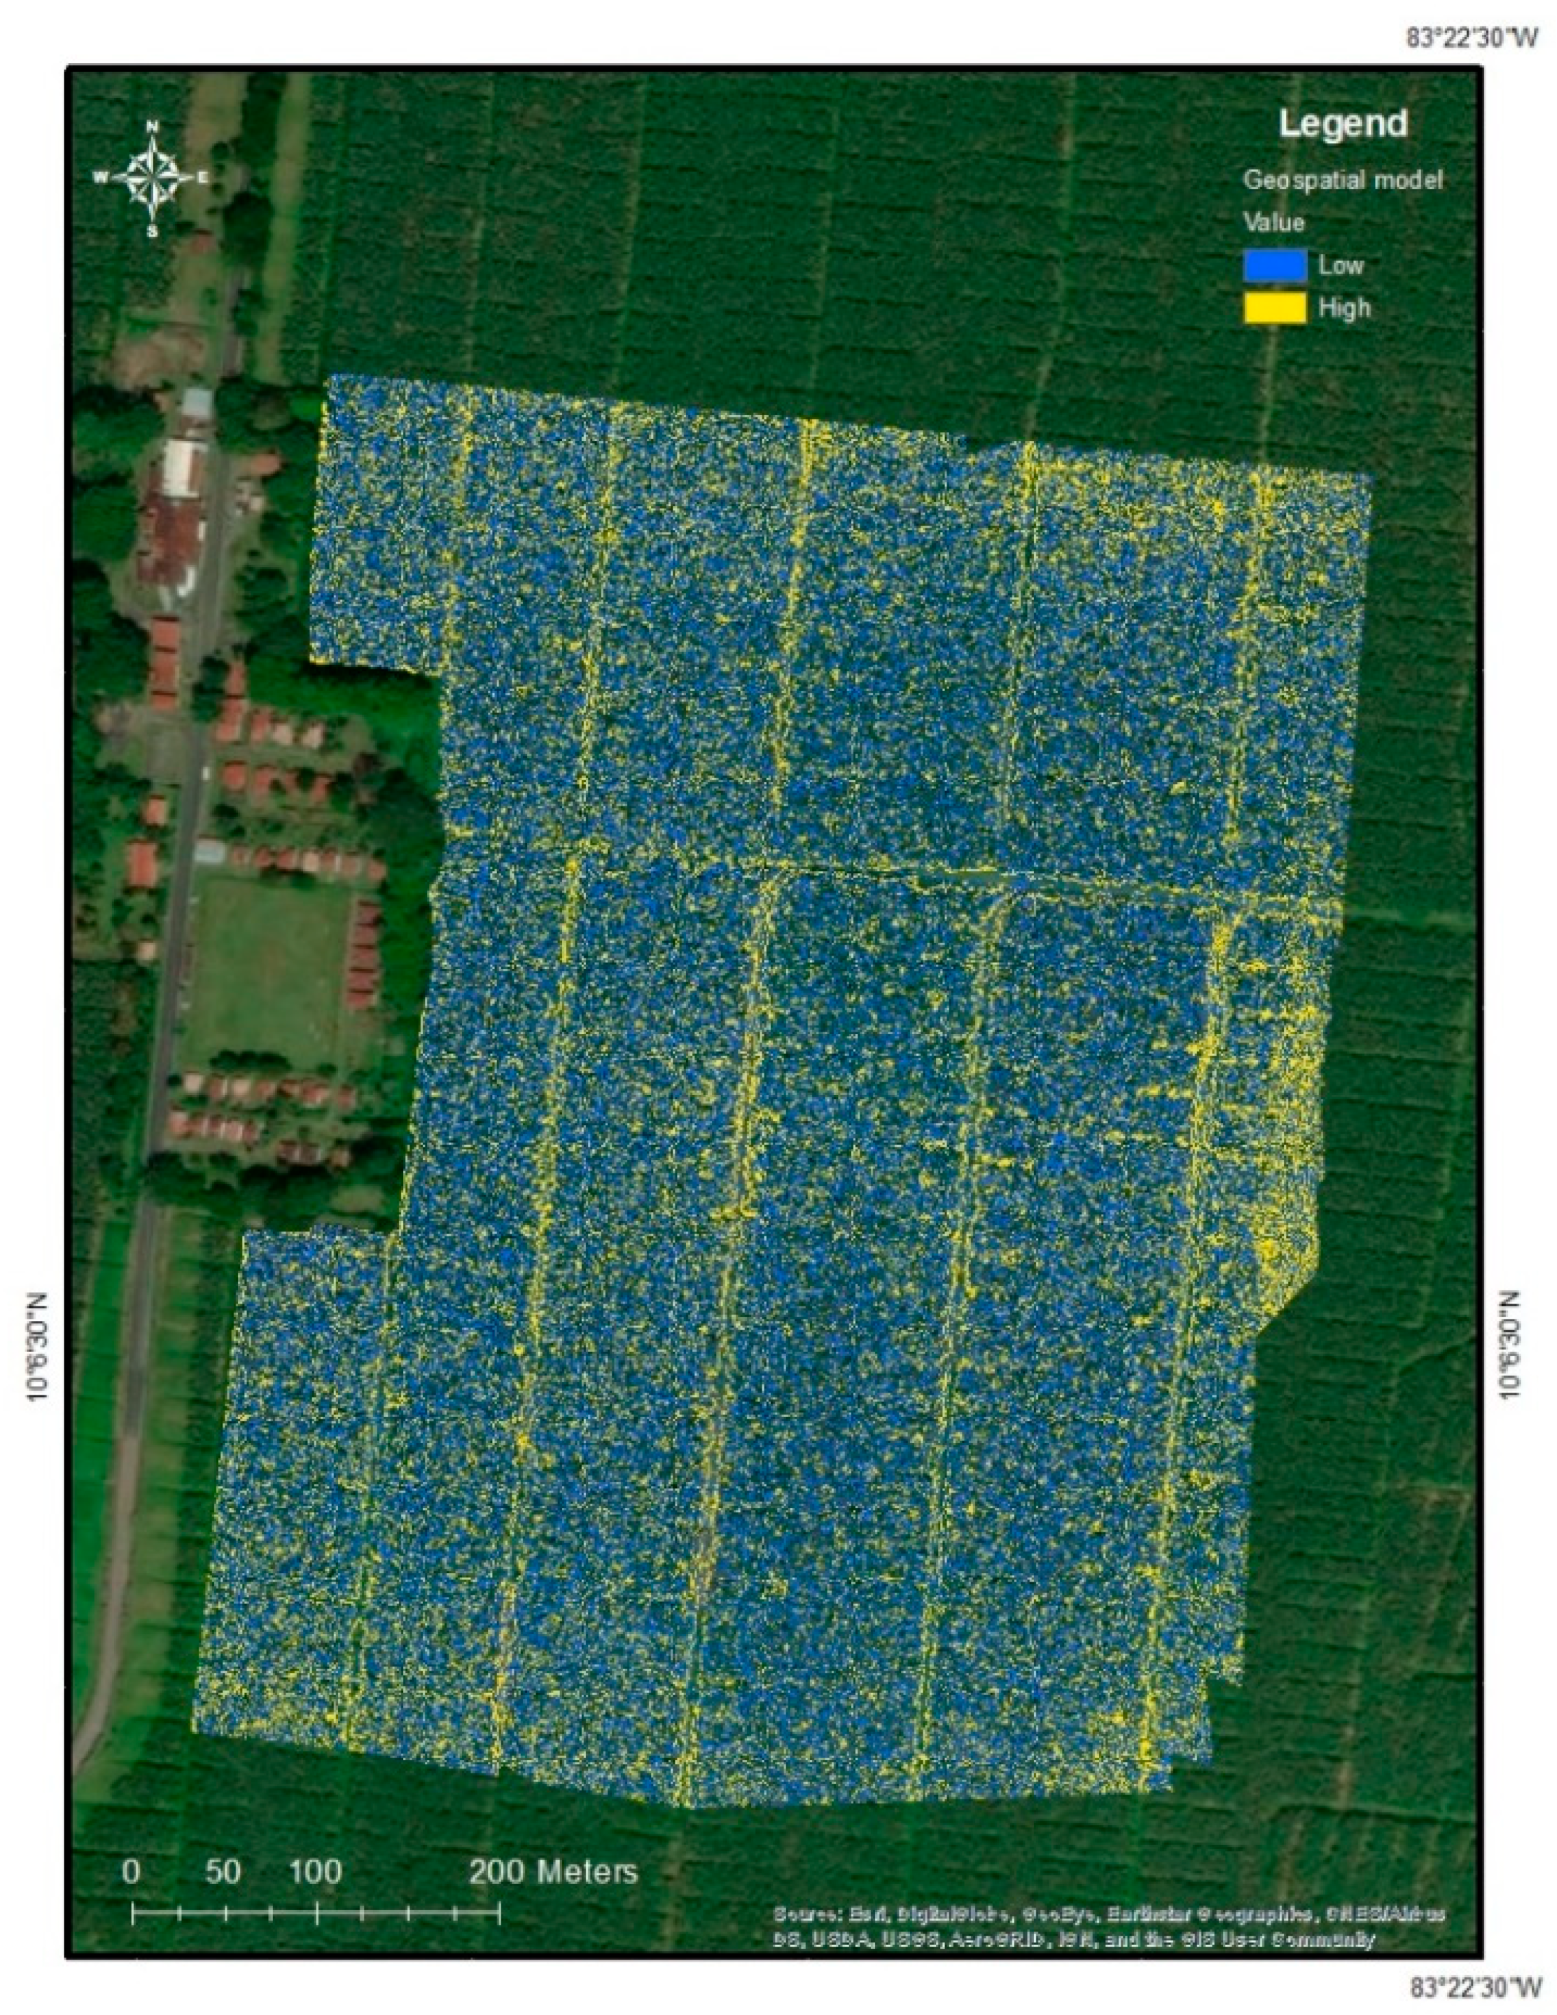
3.1. Geospatial Model

The analysis of nitrate concentrations derived from the samplings revealed intriguing patterns within the plantation areas. Contrary to expectations, lower probabilities of identifying high moisture concentrations were observed in certain regions of the plantation. This unexpected finding suggests a nuanced relationship between nitrate levels and moisture content, indicating that factors beyond mere moisture presence influence nitrate distribution within the plantation landscape.
Interestingly, a notable concentration of nitrate was consistently observed in close proximity to drainage channels, aligning with expectations given the heightened moisture levels associated with these features (Figure 4). This spatial clustering of nitrate concentration near drainage channels underscores the significance of hydrological dynamics in shaping nutrient distribution within the plantation environment.
Moreover, our geospatial model, complemented by a generalized linear model, revealed a significant interaction effect between Slope and Topographic Wetness Index (TWI) in elucidating areas prone to water accumulation. This interaction highlights the complex interplay between terrain characteristics and moisture dynamics, emphasizing the multifaceted nature of environmental influences on nitrate distribution.
By integrating geospatial analysis techniques with empirical data and statistical modeling, our study provides valuable insights into the spatial variability of nitrate concentrations within banana plantations. These findings contribute to a more comprehensive understanding of the environmental factors driving nutrient distribution, thereby facilitating targeted interventions for sustainable agricultural management practices.

3.2. Nitrate Ion Concentration

The analysis of nitrate concentrations in surface water, derived from the five samplings, revealed distinct average values across different probability treatments. In the high-probability treatment areas, the average nitrate concentration was measured at 8.73 ± 1.53 mg/L, while in the low-probability treatment areas, it was slightly higher at 11.28 ± 2.49 mg/L (Figure 5). Despite these apparent differences, a deeper statistical examination revealed intriguing insights into the distribution patterns of nitrate concentrations within the study area. Upon subjecting the nitrate concentration values to the Shapiro–Wilk test, it was determined that they did not conform to a normal distribution (p < 0.05). Furthermore, the Kruskal–Wallis test yielded a probability value of p = 0.5687, exceeding the level of significance (p > 0.05). Consequently, with a confidence level of 95%, the null hypothesis is upheld, suggesting no statistically significant difference in nitrate concentration between treatments with varying probabilities of moisture concentration.
This unexpected finding challenges conventional assumptions regarding the relationship between moisture accumulation and nitrate levels within plantation environments. While initial observations hinted at a potential correlation between moisture-prone areas and elevated nitrate concentrations, the statistical analysis suggests a more nuanced interplay of factors governing nutrient distribution. The absence of a statistically significant difference underscores the complexity of nutrient dynamics within the studied landscape and emphasizes the need for comprehensive, multifaceted approaches to environmental analysis. By elucidating the intricate relationships between hydrological processes and nutrient distribution, our findings contribute to a more nuanced understanding of agricultural ecosystems and inform targeted strategies for sustainable land management practices.

3.3. Generalized Linear Model

The application of the Akaike Information Criterion (AIC) served as a valuable tool for model selection, shedding light on the factors most influential in shaping nitrate concentration within the study area. According to the AIC criterion, the model corresponding to the alternative hypothesis (AICc = 15.76) received stronger support compared to the null hypothesis (AICc = 23.61). This outcome underscores the significance of incorporating Slope values (S) and the Topographic Wetness Index (TWI) in predicting nitrate concentration dynamics within the plantation landscape.
The selected GLM highlights the pivotal role of terrain characteristics and moisture dynamics in modulating nutrient distribution patterns. Specifically, the model suggests that nitrate concentrations within the study area are significantly influenced by variations in Slope and Topographic Wetness Index. These findings underscore the utility of geospatial modeling techniques in elucidating the complex interplay of environmental variables governing nutrient dynamics in agricultural ecosystems. Moreover, the identification of key predictor variables, namely Slope and TWI, offers practical insights for optimizing future geospatial modeling efforts. By focusing on these variables, users can streamline the modeling process without sacrificing predictive accuracy, thereby enhancing the efficiency and applicability of the proposed methodology.
Furthermore, to further refine the model and improve its predictive capabilities, future endeavors could involve obtaining topographic information extracted during the same timeframe as sampling activities. This approach ensures temporal consistency between model inputs and field observations, minimizing potential discrepancies and enhancing the robustness of the geospatial model. Overall, the GLM-based approach presented in this study represents a valuable tool for understanding and predicting nitrate distribution patterns within banana plantations. By leveraging key terrain variables and moisture indices, our methodology offers actionable insights for optimizing agricultural management practices and promoting sustainable land use strategies in similar agricultural landscapes.

4. Discussion

4.1. Geospatial Model Implications in Agriculture

The objective of this study was to develop a proposal to sample concentration levels of nitrate ion in a banana farm in the Costa Rican Caribbean using geospatial modeling techniques. For the first time, CORBANA’s farm can identify nitrate with a new methodology using its own available resources based on the result of the geospatial model. Indeed, the use of unmanned aerial vehicles (UAVs) for precision agriculture is becoming more accessible for farmers than they were in the past decade, thus allowing farms to have a better knowledge of their crop nutrition [30].
In the plantation areas, there is a lower probability of moisture concentration. On the other hand, as expected, it is more likely that a higher nitrate ion concentration will occur in both primary and secondary drainage since they are areas of greater humidity accumulation. However, despite it being observed that the drainage areas had a high probability and the center of the domes had a low probability of concentrating humidity, the high resolution (9 cm) of the geospatial model could condition the result obtained since it does not allow the classified areas to be visualized clearly [31,32]. Moreover, the results suggest that TWI and Slope were the best generalized linear model factors to explain the areas prone to water accumulation that are better to sample. This study will be a motivation for further studies in similar land conditions that would need steps to identify chemical compounds in different crops.
Drones provide not only visual spectral information for the creation of the DEM but also infrared and thermal range images that can be manipulated to generate vegetation health indices, such as the Normalized Difference Vegetation Index (NDVI), the Green Normalized Difference Vegetation Index (GNDVI), and the Enhanced Vegetation Index (EVI2). These indices were employed in multi-classifier models to map the banana plantations in villages in Rwanda [33]. Furthermore, UAV-based crop monitoring can also be used to determine the growing stages of banana crops and predict harvest yield to some extent. Multispectral imagery is suitable for tracking temporal phenological changes in banana canopies at every stage of their growth [34].

4.2. Factors Controlling Chemical Substance Concentrations in Banana Fields

It is a fact that landforms influence land use/cover and its spatial distribution, but specifically, elevation, Slope, and TWI strongly affect the land use/cover diversity and pattern [35]. Therefore, it was expected that the concentration of the chemical compound under study in the areas with high probability would be higher; however, the data obtained differed from what was expected.
The behavior seen in the field can be due to different reasons. The first is that erosion in banana farms with a bare soil system can be between 1 t/ha/year to 1.8 t/ha/year in soil class I and II (predominant in the study area) [36]. This condition of the probability of erosion could cause the modification of the topographic design of the domes (lower in Slope) between the period in which the UAV images were taken, from which topographic information was extracted (2018), and the period in which the validation of the geospatial model with sampling was carried out (2021–2022). In fact, erosion and deposition of topsoil are often regulated by topographic variables, such as TWI and relief, as found in regression models used to determine soil organic carbon density [37]. Thus, the modification of the topographic design could have been affected by erosion.
Likewise, the observed behavior could also be explained because the study area presented the water table at 180 cm depth; this value allows the area to be classified as poorly drained [38], and consequently, the water could accumulate in the center of the domes, resulting in a higher nitrate ion concentration. Since there are no significant differences between the location of the sampling points (center of the domes and entrance of the tertiary channels), other criteria of convenience and opportunity may be involved in selecting the sampling sites when replicating the methodology. During the field visits, it was observed that the sampling points at the entrance to the tertiary channels had a lower risk of being obstacles to daily production tasks on the farm compared to those located in the center of the domes.
UAV multispectral imagery associated with field topographic metrics can also be combined with soil properties, vegetation indices, and crop height to best estimate canopy nitrogen weight. A study in a corn field in Ontario, Canada, tested machine learning regression methods to predict nitrogen weight, yet the authors documented that there is an intelligible limitation in agricultural research [39]. The applicability of geospatial models is constrained to the dataset. Therefore, it is also limited to the in situ measurements and variable conditions.
While the methodology proposed in our study has proven effective for the specific plantation examined, further validation and adaptation are necessary for its application in different environmental and agricultural settings. In addition, future studies on nitrate concentrations in banana fields should include both surface water and soil sampling to provide a more comprehensive understanding of nitrate leaching and accumulation throughout the soil profile, allowing for more accurate assessment and management of nitrate dynamics. Future research should focus on testing the model in various regions with differing topography, climates, and farming practices to ensure its robustness and versatility. In addition to geospatial analysis, it is important to consider how seasonal changes, farming methods, and soil properties affect nitrate levels in banana plantations. These factors play significant roles in nutrient dynamics and environmental impact. Future research should include longitudinal studies across different seasons, incorporate various agricultural practices, and analyze detailed soil characteristics and microbial activity to provide a more comprehensive understanding of nitrate behavior and fertilizer usage. Such studies will enhance the applicability of our methodology and contribute to more sustainable and effective nitrate management practices in banana cultivation.

4.3. Geospatial Model Application in Other Croplands

Based on the results obtained using GIS tools, it is determined that analyzing the land using geomorphometric variables could provide a guide for decision-makers in different fields of agriculture. These methodologies were used in different crops but also to identify other chemical compounds, such as heavy metals in rice [40], nitrogen in pineapple [41], cadmium in rice and wheat [42], and others. The use of satellite land cover images combined with soil survey data has been used to examine whether it is feasible to rotate rice crops with other crops in California’s Sacramento Valley [43]. That geospatial model found that pH, electric conductivity, and saturated hydraulic conductivity best explained the agroecological diversification of the rice fields. Another application of geospatial models can be found in the prediction of nitrogen, soil organic carbon, potassium, and the thickness of the humus-accumulative (AB) horizon in the arable lands of a steppe zone in Russia [44]. The study found that elevation, Slope, and multiresolution ridge top flatness index were the most important variables in predicting agrochemical soil properties. Finally, UAV-generated DEMs can also detect susceptible areas to water stagnation using the relative elevation attribute algorithm; this method is effective for studying convex and concave signatures of the agricultural surface [45,46]. This methodology can be used in the context of degraded tropical soils.

5. Conclusions

The proposed methodology to identify nitrate in the banana plantation in Limon, Costa Rica, allowed CORBANA to have the necessary information and tools to carry out regular environmental monitoring of nitrate based on a geospatial model obtained from the geomorphometric data of the study area. The method proposed here allows reliable results to be obtained in a field with low Slope and homogeneous land properties. Another advantage of the proposed methodology was the optimization of company resources. From the beginning, this study was proposed and adapted to the infrastructure conditions and the available resources of the company to ensure environmental monitoring of nitrate in the banana farm over time.
According to geospatial model analysis, Slope and Topographic Wetness Index (TWI) were the geomorphometric parameters that better explained the areas prone to water accumulation, where nitrate samples can be taken. Even so, nitrate concentration analytical results showed there is no significant difference between taking surface water samples in the planting area compared to collecting the samples near the drainage channels; however, experimental work in the field showed that samples must be taken near drainage channels to avoid being an obstacle to daily operation tasks.

Author Contributions

Conceptualization, A.Z.-E., J.C. and V.O.; Methodology, A.Z.-E., J.C., A.Q.-R. and V.O.; Formal analysis, A.Z.-E. and A.Q.-R.; Investigation, A.Z.-E. and J.C.; Resources, V.O.; Data curation, A.Z.-E.; Writing—original draft, A.Z.-E., J.C., A.Q.-R. and V.O.; Writing—review & editing, A.Z.-E., J.C., A.Q.-R. and V.O. All authors have read and agreed to the published version of the manuscript.

Funding

Funding by the Costa Rica National Banana Corporation (CORBANA S.A) and the University of Costa Rica (UCR).

Data Availability Statement

Data will accessible under request.

Acknowledgments

We thank Gabriela Becerra for assistance during the manuscript writing.

Conflicts of Interest

Author Veda Obando was employed by the company Corporación Bananera Nacional (CORBANA). The remaining authors declare that the research was conducted in the absence of any commercial or financial relationships that could be construed as a potential conflict of interest.

References

  1. Kumar, P.L.; Selvarajan, R.; Iskra-Caruana, M.L.; Chabannes, M.; Hanna, R. Biology, etiology, and control of virus diseases of banana and plantain. In Advances in Virus Research; Elsevier Inc.: Amsterdam, The Netherlands, 2015; Volume 91, pp. 1–240. [Google Scholar]
  2. Evans, E.A.; Ballen, F.H.; Siddiq, M. Banana production, global trade, consumption trends, postharvest handling, and processing. In Handbook of Banana Production, Postharvest Science, Processing Technology, and Nutrition; Siddiq, M., Ed.; John Wiley & Sons, Inc.: Hoboken, NJ, USA, 2020; pp. 1–18. [Google Scholar]
  3. Audesirk, G.; Audesirk, T.; Byers, B.E. Biology: Life on Earth with Physiology, 9th ed.; Pearson: Boston, MA, USA, 2011. [Google Scholar]
  4. Udvardi, M.; Below, F.E.; Castellano, M.J.; Eagle, A.J.; Giller, K.E.; Ladha, J.K.; Liu, X.; Maaz, T.M.; Nova-Franco, B.; Raghuram, N.; et al. A Research Road Map for Responsible Use of Agricultural Nitrogen. Front. Sustain. Food Syst. 2021, 5, 660155. [Google Scholar] [CrossRef]
  5. Wang, Z.-H.; Li, S.-X. Nitrate N loss by leaching and surface runoff in agricultural land: A global issue (a review). Adv. Agron. 2019, 156, 159–217. [Google Scholar]
  6. Zhao, J.; Pullens, J.W.M.; Sørensen, P.; Blicher-Mathiesen, G.; Olesen, J.E.; Børgesen, C.D. Agronomic and environmental factors influencing the marginal increase in nitrate leaching by adding extra mineral nitrogen fertilizer. Agric. Ecosyst. Environ. 2022, 327, 107808. [Google Scholar] [CrossRef]
  7. Sun, R.; Ding, J.; Li, H.; Wang, X.; Li, W.; Li, K.; Ye, L.; Sun, S. Mitigating nitrate leaching in cropland by enhancing microbial nitrate transformation through the addition of liquid biogas slurry. Agric. Ecosyst. Environ. 2023, 345, 108324. [Google Scholar] [CrossRef]
  8. Di, H.J.; Cameron, K.C. Nitrate leaching in temperate agroecosystems: Sources, factors and mitigating strategies. Nutr. Cycl. Agroecosyst. 2002, 64, 237–256. [Google Scholar] [CrossRef]
  9. Brase, T. Basics of a geographic information system. In Precision Agriculture Basics; John Wiley & Sons, Inc.: Hoboken, NJ, USA, 2018; pp. 37–62. [Google Scholar]
  10. Guzmán-Álvarez, J.A.; González-Zuñiga, M.; Fernandez, J.A.S.; Calvo-Alvarado, J.C. Use of remote sensing in agriculture: Applications in banana crop. Agron. Mesoam. 2022, 33, 139–154. [Google Scholar]
  11. Vélez Duque, P. Optimization of banana crop fertilization using GIS tools. Centrosur Agrar. 2022, 15, 1–13. [Google Scholar]
  12. Meya, A.I.; Ndakidemi, P.A.; Mtei, K.M.; Swennen, R.; Merckx, R. Optimizing soil fertility management strategies to enhance banana production in volcanic soils of the Northern Highlands, Tanzania. Agronomy 2020, 10, 258. [Google Scholar] [CrossRef]
  13. Borole, V.Y.; Kulkarni, S.B. Comparative Analysis of Soil Properties for Influence of Fertilizers using Remote Sensing Techniques. Int. J. Comput. Appl. 2017, 975, 8887. [Google Scholar] [CrossRef]
  14. Aeberli, A.; Johansen, K.; Robson, A.; Lamb, D.W.; Phinn, S. Detection of Banana Plants Using Multi-Temporal Multispectral UAV Imagery. Remote Sens. 2021, 13, 2517. [Google Scholar] [CrossRef]
  15. Gomez Selvaraj, M.; Vergara, A.; Montenegro, F.; Ruiz, H.A.; Safari, N.; Raymaekers, D.; Ocimatie, W.; Ntamwirac, J.; Titsd, L.; Blomme, G.; et al. Detection of banana plants and their major diseases through aerial images and machine learning methods: A case study in DR Congo and Republic of Benin. ISPRS J. Photogramm. Remote Sens. 2020, 169, 110–124. [Google Scholar] [CrossRef]
  16. Boitt, M.K. Hyperspectral Remote Sensing for Cropland Assessment and Modeling for Agro-Ecological Zones: A Case Study of Taita Hills, Kenya. Ph.D. Thesis, University of Twente, Enschede, The Netherlands, 2016. [Google Scholar]
  17. Ochola, D.; Boekelo, B.; van de Ven, G.W.; Taulya, G.; Kubiriba, J.; van Asten, P.J.; Giller, K.E. Mapping spatial distribution and geographic shifts of East African highland banana (Musa spp.) in Uganda. PLoS ONE 2022, 17, e0262752. [Google Scholar] [CrossRef] [PubMed]
  18. Quinta-Nova, L.; Ferreira, D. Land suitability analysis for emerging fruit crops in central Portugal using gis. Agric. For. 2020, 66, 41–48. [Google Scholar] [CrossRef]
  19. Hassan, S.I.; Alam, M.M.; Zia, M.Y.; Rashid, M.; Illahi, U.; Su’ud, M.M. Rice Crop Counting Using Aerial Imagery and GIS for the Assessment of Soil Health to Increase Crop Yield. Sensors 2022, 22, 7885. [Google Scholar] [CrossRef] [PubMed]
  20. Singha, C.; Swain, K.C.; Swain, S.K. Best Crop Rotation Selection with GIS-AHP Technique Using Soil Nutrient Variability. Agriculture 2020, 10, 221. [Google Scholar] [CrossRef]
  21. Debesa, G.; Gebre, S.L.; Melese, A.; Regassa, A.; Teka, S. GIS and remote sensing-based physical land suitability analysis for major cereal crops in Dabo Hana district, South-West Ethiopia. Cogent Food Agric. 2020, 6, 1780102. [Google Scholar] [CrossRef]
  22. ESRI (Environmental Systems Research Institute). ArcGIS Desktop 10.6; Environmental Systems Research Institute: Redlands, CA, USA, 2018. [Google Scholar]
  23. Cole-Parmer. Oakton by Cole-Parmer® Combination Ion-Selective Electrode (ISE), Nitrate. Available online: https://www.coleparmer.com/i/oakton-by-cole-parmer-combination-ion-selective-electrode-ise-nitrate/2750422 (accessed on 29 May 2024).
  24. Thermo Fisher Scientific. Orion StarTM A329 pH/ISE/Conductivity/Dissolved Oxygen Portable Multiparameter Meter; Thermo Fisher Scientific: Waltham, MA, USA, 2021. [Google Scholar]
  25. Cole-Parmer. Oakton Ionic Strength Adjustor (ISA) Solution, 2M (NH4)2SO4. Available online: https://www.coleparmer.com/i/oakton-ionic-strength-adjustor-isa-solution-2m-nh4-2so4/2750423 (accessed on 29 May 2024).
  26. Rienzo, J.; Casanoves, F.; Balzarini, M.; Gonzalez, L.; Tablada, M.; Robledo, C. InfoStat; Grupo InfoStat, FCA, Universidad Nacional de Córdoba: Córdoba, Argentina, 2018. [Google Scholar]
  27. Kruskal, W.; Wallis, A. Use of ranks in one-criterion variance analysis. J. Am. Stat. Assoc. 1952, 47, 583–621. [Google Scholar] [CrossRef]
  28. Burnham, K.P.; Anderson, D.R. Multimodel Inference: Understanding AIC and BIC in Model Selection. Sociol. Methods Res. 2004, 33, 261–304. [Google Scholar] [CrossRef]
  29. Vinod, H.D. Generalized correlation and kernel causality with applications in development economics. Commun. Stat. Simul. Comput. 2017, 46, 4513–4534. [Google Scholar] [CrossRef]
  30. R Core Team. R: A Language and Environment for Statistical Computing; R Foundation for Statistical Computing: Vienna, Austria, 2013. [Google Scholar]
  31. Hafeez, M.A.; Singh, S.P.; Chauhan, A.; Khan, M.T.; Kumar, N.; Chauhan, A.; Soni, S.K. Implementation of drone technology for farm monitoring & pesticide spraying: A review. Inf. Process. Agric. 2023, 10, 192–203. [Google Scholar] [CrossRef]
  32. Chen, Z.; Ye, F.; Fu, W.; Ke, Y.; Hong, H. The influence of DEM spatial resolution on landslide susceptibility mapping in the Baxie River basin, NW China. Nat. Hazards 2020, 101, 853–877. [Google Scholar] [CrossRef]
  33. Dai, W.; Yang, X.; Na, J.; Li, J.; Brus, D.; Xiong, L.; Tang, G.; Huang, X. Effects of DEM resolution on the accuracy of gully maps in loess hilly areas. Catena 2019, 177, 114–125. [Google Scholar] [CrossRef]
  34. Kilwenge, A.; Adewopo, J.; Sun, Z.; Schut, M. UAV-based mapping of banana land area for village-level decision-support in Rwanda. Remote Sens. 2021, 13, 4985. [Google Scholar] [CrossRef]
  35. Aeberli, A.; Phinn, S.; Johansen, K.; Robson, A.; Lamb, D.W. Characterisation of Banana Plant Growth Using High-Spatiotemporal-Resolution Multispectral UAV Imagery. Remote Sens. 2023, 15, 679. [Google Scholar] [CrossRef]
  36. Wang, C.; Cheng, W. Geomorphic influences on land use/cover diversity and pattern. Catena 2023, 230, 107245. [Google Scholar] [CrossRef]
  37. Murillo, J.; Méndez-Estrada, V.H.; Brenes Prendas, S. Efecto de Geophila macropoda (Rubiaceae) como arvense de cobertura en la erosión hídrica en bananales de Guápiles, Limón, Costa Rica. UNED Res. J. 2016, 8, 217–223. [Google Scholar] [CrossRef]
  38. Li, X.; McCarty, G.W.; Karlen, D.L.; Cambardella, C.A. Topographic metric predictions of soil redistribution and organic carbon in Iowa cropland fields. Catena 2018, 160, 222–232. [Google Scholar] [CrossRef]
  39. Salvato, L.A.; Pittelkow, C.M.; O’Geen, A.T.; Linquist, B.A. A geospatial assessment of soil properties to identify the potential for crop rotation in rice systems. Agric. Ecosyst. Environ. 2024, 359, 108753. [Google Scholar] [CrossRef]
  40. Yu, J.; Wang, J.; Leblon, B. Evaluation of Soil Properties, Topographic Metrics, Plant Height, and Unmanned Aerial Vehicle Multispectral Imagery Using Machine Learning Methods to Estimate Canopy Nitrogen Weight in Corn. Remote Sens. 2021, 13, 3105. [Google Scholar] [CrossRef]
  41. Valverde, E. Efecto de Distintos Sistemas de Manejo de Coberturas Sobre la Salud del Suelo, en una Finca Bananera de Siquirres, Limón, Costa Rica. Master’s Thesis, Universidad de Costa Rica, San José, Costa Rica, 2021. [Google Scholar]
  42. Jia, Z.; Wang, J.; Li, B.; Li, Y.; Zhou, Y.; Tong, G.; Yan, D.; Zhou, S. An integrated methodology for improving heavy metal risk management in soil-rice system. J. Clean. Prod. 2020, 273, 122797. [Google Scholar] [CrossRef]
  43. Hasni, R.; Mohidin, H.; Khan, M.Y.M.A.; Narawi, A.; Banchit, A.; Tamrin, K.F.; Jack, R.; Jos, S.; Salam, N.D. Determining Suitable Spatial Resolution To Estimate Nitrogen Status in Md2 Pineapple Crop Cultivated on Mineral Soil. J. Theor. Appl. Inf. Technol. 2022, 100, 870–885. [Google Scholar]
  44. Li, X.; Zhou, L.; Zhang, C.; Li, D.; Wang, Z.; Sun, D.; Liao, C.; Zhang, Q. Spatial distribution and risk assessment of fluorine and cadmium in rice, corn, and wheat grains in most karst regions of Guizhou province, China. Front. Nutr. 2022, 9, 958472. [Google Scholar] [CrossRef]
  45. Suleymanov, A.; Abakumov, E.; Suleymanov, R.; Gabbasova, I.; Komissarov, M. The Soil Nutrient Digital Mapping for Precision Agriculture Cases in the Trans-Ural Steppe Zone of Russia Using Topographic Attributes. ISPRS Int. J. Geo-Inf. 2021, 10, 243. [Google Scholar] [CrossRef]
  46. Straffelini, E.; Cucchiaro, S.; Tarolli, P. Mapping potential surface ponding in agriculture using UAV-SfM. Earth Surf. Process. Landf. 2021, 46, 1926–1940. [Google Scholar] [CrossRef]
Figure 1. (a) Costa Rica with Limón province highlighted, (b) San Pablo plantation located in Pacuarito district, and (c) location map of study area.
Agriengineering 06 00147 g001
Figure 2. Geospatial model methodology.
Agriengineering 06 00147 g002
Figure 3. Runoff trap representations.
Agriengineering 06 00147 g003
Figure 4. Geospatial model to identify areas prone to high or low water accumulation.
Agriengineering 06 00147 g004
Figure 5. Average concentration of nitrate ion in surface water in the treatment of high and low probability of concentrating humidity according to the proposed geospatial model.
Agriengineering 06 00147 g005
Disclaimer/Publisher’s Note: The statements, opinions and data contained in all publications are solely those of the individual author(s) and contributor(s) and not of MDPI and/or the editor(s). MDPI and/or the editor(s) disclaim responsibility for any injury to people or property resulting from any ideas, methods, instructions or products referred to in the content.

