Article

An Integrated Engineering Method for Improving Air Quality of Cage-Free Hen Housing

Department of Poultry Science, College of Agricultural and Environmental Sciences, University of Georgia, Athens, GA 30602, USA
*
Author to whom correspondence should be addressed.
AgriEngineering 2024, 6(3), 2795-2810; https://doi.org/10.3390/agriengineering6030162
Submission received: 23 June 2024 / Revised: 4 August 2024 / Accepted: 5 August 2024 / Published: 9 August 2024
(This article belongs to the Section Livestock Farming Technology)

Abstract

:
High particulate matter levels in cage-free (CF) houses have led to concerns from producers, as that can pose significant risks to the health and well-being of hens and their caretakers. This study aimed to assess the effectiveness of an electrostatic particle ionization (EPI) + bedding management (BM) treatment in reducing particulate matter (PM) concentrations. Four identical CF rooms each housed 175 hens for six weeks, with two rooms assigned to the EPI + BM treatment (EPI + 20% wood chip topping over 81-week-old litter) and the other two as controls. Measurements of PM were conducted twice a week for 10 min using TSI DustTrak. Additionally, small and large particle concentrations were monitored continuously using a Dylos monitor, with a sampling period of one minute. Footpad scoring was recorded for logistic analysis. Statistical analysis was performed using ANOVA with the Tukey HSD method (p < 0.05). Results demonstrated that the EPI + BM treatment significantly reduced particle counts (37.83% decrease in small particles, 55.90% decrease in large particles) compared to the control group (p < 0.01). PM concentrations were also substantially lowered across different size fractions, ranging from 58.41% to 64.17%. These findings underscore the effectiveness of the EPI + BM treatment in reducing PM in CF houses. The integration of EPI and bedding management innovated in this study holds promise for improving air quality and contributing to the well-being of hens and caretakers in CF housing systems.

1. Introduction

The US egg industry has been facing the challenge of high levels of air pollutants, particularly particulate matter (PM), in cage-free (CF) housing [1,2,3,4]. While CF housing was adopted as a response to animal welfare concerns, it has presented new challenges regarding air quality [4]. Higher PM concentrations require attention and mitigation strategies to ensure a healthy environment in CF housing systems. Study have shown that PM levels in CF housing are almost 7–12 times higher than in conventional caged (CC) housing, as reported in ref. [5]. The higher the concentration of air pollutants inside the housing, the higher the risk to health and welfare [6]. The primary harmful effects on birds include harmful impacts on the respiratory system and decreased lung function [3,7,8,9]. In addition, PM poses a higher risk to individuals with pre-existing cardiac conditions such as asthma [10]. If an air pollutant is present in high concentrations, it may increase mortality risk. Therefore, air pollutant mitigation strategies should be implemented.
The effectiveness of various technologies in mitigating air pollutants in poultry housing has shown variation, necessitating the development of technically efficient and economically feasible solutions [4,11]. One promising approach involves using an oil/water mixture to combat air pollutants, but it can lead to the accumulation of PM on surfaces, requiring frequent cleaning of the entire poultry house to maintain air quality and worker safety [12,13]. In addition, excess water spray may result in higher ammonia generation [2] and footpad dermatitis (FPD) issues [14,15] with lower PM. Wet scrubbers with packed-bed configurations and filter/biofilter systems are other commonly employed methods but can have drawbacks such as clogging, liquid waste concerns, and the need for regular cleaning and replacement [11,16,17]. Implementing proper manure handling procedures has shown effectiveness, although installing related equipment poses challenges, especially in CF floor-raised hen houses [2].
However, electrostatic charging systems (ESCS) have emerged as the most effective method for reducing air pollutants [18,19,20,21,22,23]. According to a study by Ritz et al. [24], ESCS significantly reduced airborne dust levels in poultry houses. In a broiler house, ESCS reduced dust by an average of 43%. In a small broiler breeder house, ESCS reduced dust by 60% and total bacteria by 76% [25]. These findings suggest that ESCS could be a potential biosecurity measure for reducing the spread of airborne pathogens during disease outbreaks.
Similarly, shavings and chips are popular bedding materials used in commercial henhouses, and high-quality shaving products should be super absorbent, compostable, and have minimal dust [2,26]. Using wood shavings/chips in substrate mixes may help reduce dust generation from litter floors in poultry houses. Previous research has reported that using different bedding materials (aspen wood chips, large pine flake shaving, and small pine flake shaving) alters PM reduction properties by changing physical and chemical properties, such as shape, size, porosity, and moisture content [3]. Wood chips and other bedding materials of 20% topping decrease dust by 30–39% [27]. Therefore, the top-application of new bedding on old litter is a potential strategy for reducing PM levels in CF houses [3].
An integrated system incorporating the most current methods can enhance the indoor air quality for CF egg production, aiming to reduce airborne PM levels. Therefore, the proposed work integrates electrostatic particle ionization (EPI) and bedding materials for better results. This study hypothesizes that using an integrated method combining new bedding and an EPI system significantly reduces PM. Additionally, the study aims to achieve the following objectives: (a) to investigate the impact of this integrated method on PM concentrations, (b) to quantify the extent of emissions reduction resulting from this approach, and (c) to identify the impact on footpad health. The findings from this study will contribute to reducing air pollutants, thereby enhancing the overall health and welfare of hens and the well-being of those responsible for their care.

2. Materials and Methods

2.1. Ethical Approval

All procedures for this study at the University of Georgia were approved by the Institutional Animal Care and Use Committee (IACUC).

2.2. Research Facilities and Animal Management

The study was conducted at the University of Georgia Poultry Research Center in a laying hen facility with four identical rooms. Each room had dimensions of approximately 24 feet long (7.3 m), 20 feet wide (6.1 m), and 10 feet high (3.1 m). A total of 175 Hy-line W-36 laying hens were housed in each room, resulting in a combined total of 700 hens. It is worth noting that this stocking density exceeded the recommended minimum space of 0.116–0.14 square meters per bird [28] to facilitate natural behaviors such as dustbathing, foraging, and social interaction. The detailed cage-free house design is mentioned in a previous paper [29].
Pine wood shavings were used as bedding materials in each room. Additionally, an A-shaped perch, measuring a total length of 36.6 m or 120 feet (equivalent to 0.21 m per bird), was installed within each CF room. The feed formulations for the hens were prepared at the University of Georgia’s Poultry Research Center feed mill following the guidelines specified by Hy-Line W-36 commercial layer management [28].
The farming and management practices implemented adhered to the recommended Hy-Line W-36 commercial layer guidelines. A Chore-Tronics Model 8 controller (Chore-Time Group, Milford, IN, USA) controlled the room temperature, lighting system, and ventilation rates. The lighting duration was 16 h, as mentioned in layer management guidelines [28]. The target temperature inside each room was maintained to provide a comfortable environment for laying hens. Furthermore, to ensure continuous air circulation and temperature distribution throughout the rooms, two circulating fans (Vortex circulating fan, Munter Corporation, Mason, MI, USA) were installed in each room and affixed to the ceiling.

2.3. Experimental Design

This research integrated electrostatic particle ionization (EPI) (EPIAir, Columbia, MO, USA) and bedding management (BM) to improve air quality in four CF rooms. In each treatment room, the existing litter (82 weeks old) had a height of 6 cm and received a top-dressing of wood chips (Beta Chips, Northeastern Products Corp., Warrensburg, NY, USA). This top-dressing accounted for 20% of the initial litter depth. The 11 m (36 ft) EPI systems were operated continuously. The 11 m (36 ft) length was used because this length had shown a higher PM reduction in the same kind of housing [29]. In addition, this adjustment was made to accommodate other equipment in the rooms, including heaters, circulating fans, and water supply pipes. To ensure no electric field effects on nearby objects, it was crucial to maintain a minimum distance of 1 foot between the EPI system and the ceiling or walls. The corona pipes were positioned 1 foot (0.3 m) away from the side walls and 8 feet (2.4 m) away from the front and back walls, leaving a gap between the corona pipes (Figure 1). Bird-repellent spikes (Bird-X, Inc., Elmhurst, IL, USA) were securely attached above the corona pipe using adhesive glue to prevent hens from perching on the corona pipe and avoid potential harm. Among the four rooms, two were randomly designated as treatment rooms (EPI + BM 1 and EPI + BM 2 rooms), while the remaining two served as control rooms (Control 1 and Control 2 rooms without any treatments). It is important to acknowledge that this study faced limitations due to the availability of a limited number of rooms (four rooms).

2.4. Environment Parameter Measurements

2.4.1. Temperature and Relative Humidity

Onset HOBO data loggers (Onset Computer Corporation, Bourne, MA, USA) were used inside each room to monitor temperature and relative humidity (RH) levels. In addition, one Onset data logger was placed outside the room to measure outside temperature and RH. These data loggers were programmed to gather measurements every 10 min, providing a comprehensive understanding of the conditions throughout the day and night. Inside each room, the sensor was positioned in the middle, 1.2 m above the floor, while outside, it was placed 1.8 m above the ground. Daily data checks were conducted using a phone to ensure that the birds were maintained in a comfortable environment.

2.4.2. Ventilation Measurement

In each room, both small (12-inch) and large tunnel exhaust fans (24-inch) (Vortex circulating fan, Munter Corporation, Mason, MI, USA) were manually controlled to make sure all control and treatment rooms had the same ventilation rate. Manual airflow checking was conducted twice weekly with an anemometer (Alnor velometer thermal anemometer AVM410, TSI Incorporated, Shoreview, MN, USA) to ensure ventilation rates were same in all rooms. The anemometer, positioned 5 cm away from the exhaust fan, has a measurement range of 0 to 20 m/s (0 to 4000 ft/min) with an accuracy of ±3% for reading or ±0.015 m/s and a resolution of 0.01 m/s. The recorded data included the airflow speed (W) in m/s, along with the opening area (A) of the small exhaust fan (0.0723 m2) and the large exhaust fan (0.292 m2). Later, these measurements were analyzed based on the airflow rate (Q) in m3 min−1 using Equations (1) and (2), as described in the study by Ni et al. [4].
Qsmall = 0.0723 m2 × W
Qlarge = 0.292 m2 × W
where, Qsmall is the airflow rate of small ventilation and Qlarge is the airflow rate of large ventilation.

2.4.3. Litter Depth and Litter Moisture Content Measurements

This research measured litter depth data weekly from four selected areas within each room (Control and EPI + BM). Measurements were taken using a measuring instrument to determine the depth of the litter. The data were recorded and analyzed to assess the impact of bedding material on litter depth. This approach allowed for the evaluation of how the addition of bedding material affected the depth of the litter in the hen housing environment.
Similarly, to evaluate the moisture content of the litter, 100 g samples were collected weekly from four locations within each room and stored in ziplock bags. These samples were transported to a UGA Poultry Science laboratory for analysis. The collected litter samples weighing 100 g each were thoroughly mixed in the laboratory, and two 10 g samples were taken from each bag. One sample was analyzed, while the other served as a validation sample. To ensure accurate measurements, the litter samples were weighed using an air-tight Mettler AE 160 balance to prevent any interference from external air. The initial weights of the samples were recorded, followed by heating of the samples at 105 °C in an oven for 24 h. After the specified time, the samples were removed from the oven, and the final litter weights were recorded. A previous study described the entire procedure in detail [30]. The moisture content of the litter was then calculated using Equation (3).
LMC = 100 × (LWW − LDW)/LWW
where, LMC—litter moisture content, %; LWW—litter wet weight, g; LDW—litter dry weight, g.

2.5. PM Measurement

For monitoring PM concentrations, this study utilized five new Dylos optical particle monitors (Model DC1700, Dylos Corporation, Riverside, CA, USA) [4,31]. In each room, one Dylos monitor was positioned at the center, 0.5 m above the ground. An additional monitor was kept as a backup throughout the research period. The Dylos monitors operated continuously, collecting data at one-minute intervals. These sensors measured particle concentrations for small particles (>0.5 µm) and large particles (>2.5 µm) per 0.01 ft3 (0.0003 m3) in each treatment room. Every week, data stored in the Dylos monitors were transferred to a hard drive for storage and further analysis. By comparing the readings for large and small particles, this study can determine the particle count within the range of 0.5 µm to 2.5 µm [4].
To assess the reading of the Dylos monitor, this study used two newly calibrated TSI DustTrak sensors (TSI Incorporated, Shoreview, MN, USA) to monitor PM concentrations at the same time. These sensors were positioned 0.5 m above the ground at the center of each room. During the data collection process, both devices were simultaneously placed and turned on in opposite treatment rooms: one sensor was placed in the control room, while the other was placed in the EPI + BM room. Each device recorded data for 10 min, resulting in 600 samples collected at a sampling rate of one sample per second. To ensure the accuracy of the data analysis, the initial minute of data (60 samples) was excluded to account for any potential device repositioning. The collected data encompassed various PM size fractions, including PM1, PM2.5, PM4, PM10, and the total suspended particles (TSP), providing valuable insights into the dust levels in the respective treatment conditions.

2.6. Working Principle of EPI

EPI technology is specifically designed for agricultural applications, contributing to improved air quality for animals and workers. Electrostatic particle ionization technology enhances air quality by electrically charging airborne particles. The EPI system (EPIAir, Columbia, MO, USA) comprises a 2.0 mA power supply, a corona pipe with a sharp point, a manual winch, insulators, and a negatively charged high-voltage direct current (−30 KV; 1.6 × 10¹² electrons/second) for safety [32]. EPI systems release a substantial number of negative ions (up to a thousand trillion per second) into the air, saturating particles and causing shifts in their charges. Thus, released charged particles adhere to surfaces or settle on the ground, leading to cleaner and safer air. These systems are energy-efficient, consume power comparable to a 100-watt light bulb, and can be connected to a standard electrical service.
In a room treated by EPI technology, negative ions emitted from the corona pipe points naturally attract and surround airborne particles, making them more prone to being drawn to grounded or negatively charged surfaces. This attraction induces particle collisions, polarization, and the acquisition of positive and negative charges. Consequently, the particles aggregate and adhere to surfaces that encounter, creating a negatively charged ionized airspace. This magnetic-like effect generates an environment inhospitable to pathogens, including bacteria. Additionally, chemical reactions in the air assist in reducing harmful gases. In summary, EPI technology effectively enhances air quality by saturating the air with negative ions, charging and binding particles to surfaces, or causing them to settle, thereby ensuring a cleaner and safer breathing environment.

2.7. Footpad Dermatitis Scoring

In this study, 40 hens were randomly selected from each of four rooms (Control and EPI + BM) to examine the effects of topping bedding material over old litters on FPD and were scored following the Global Animal Partnership (GAP’s) animal welfare rating standard [33] (Table 1). Before the implementation of the treatment, a trained specialist conducted initial FPD scoring on the selected hens. The FPD scores, ranging from 0 to 2, were recorded as baseline data, with 0 indicating a normal footpad condition and 2 representing the worst FPD condition. After the study, the same specialist performed final FPD scoring on the hens from both groups, and the corresponding scores were documented.

2.8. Statistical Analysis

The research study utilized a random arrangement of four CF raised-floor houses, where two rooms were assigned to the control and the other two rooms to the treatment (implementing EPI technology along with bedding materials) over six weeks. Various data were collected and analyzed using two-way ANOVA in R-studio, including temperature, RH, ventilation rates, LMC, and PM, with the WOA blocking factor. Similarly, FPD scoring was analyzed using logistic regression. The mean values were compared using the LSMeans Tukey HSD method, and statistically significant differences were determined at a significance level of p ≤ 0.05.

3. Results and Discussion

3.1. Environment Parameters

3.1.1. Temperature and Relative Humidity

This study set an indoor temperature of 22 °C in the research facility; however, challenges arose due to variations in the outside temperature. The control and EPI + BM rooms demonstrated relatively stable temperatures, with average values of 22.97 °C ± 0.99 °C and 23.46 °C ± 0.95 °C, respectively (Figure 2). Although the EPI + BM room exhibited a slightly higher average temperature, the difference compared to the control rooms was not statistically significant (p > 0.05). Conversely, the outside environment displayed a significantly lower average temperature of 14.19 °C ± 5.29 °C, indicating considerable temperature variations likely influenced by daily and seasonal changes. A significant temperature difference was observed between the outside environment and the indoor treatment rooms (p < 0.05) because of the environmentally controlled indoor housing. The environmentally controlled housing system maintained a constant temperature throughout the rooms, ensuring optimal bird health and productivity [3,34].
Regarding humidity, the outside environment exhibited the highest average RH of 77.77 ± 12.61%, signifying significant fluctuations (Figure 2). Comparatively, the control condition displayed an average RH of 51.61 ± 11.35%, while the EPI + BM condition demonstrated a slightly lower average RH of 50.94 ± 11.56%. However, there was no significant difference in RH between control and EPI + BM rooms (p > 0.05) due to environment-controlled housing. The controlled housing system maintains consistent RH levels, and minor variations can occur due to factors such as ventilation, air circulation, and cooling or heating systems [3,34]. It is important to address these discrepancies to ensure precise and uniform RH levels throughout the treatment rooms.

3.1.2. Ventilation Rates

The study compared the airflow rates in two different ventilation conditions, small ventilation and large ventilation, and between treatment rooms (Figure 3). In the case of small ventilation, the average airflow rates were 12.31 ± 1.55 m3 min−1 for the control group and 13.08 ± 1.33 m3 min−1 for the EPI + BM treatment group. The average airflow rates for large ventilation were 52.17 m3 min−1 for the control group and 55.85 m3 min−1 for the EPI + BM treatment group, with standard deviations of 8.18 and 7.10 m3 min−1, respectively. Statistical analysis revealed no significant difference in airflow rates between the control and EPI + BM treatments for both large ventilation (p = 0.1894) and small ventilation (p = 0.4668). EPI + BM treatment did not significantly improve airflow rates because similar temperature and ventilation rates were programmed in each house. However, there was a significant difference in airflow rates between the small and large ventilation conditions (p = 0.0109), indicating that the size of the exhaust fan has a notable impact on the airflow rates. Further investigations should focus on other factors influencing airflow rates, such as the poultry house design, ventilation system layout, and potential obstructions. Understanding these factors will contribute to optimizing ventilation systems and ensuring adequate airflow rates for poultry to maintain a healthy and comfortable environment.

3.1.3. Litter Moisture Content

Litter depth is important in poultry housing, providing a comfortable surface and promoting bird well-being. The study examined litter depth in control and EPI + BM conditions (Figure 4). The control group had an average litter depth of 10.63 ± 0.53 cm, while the EPI + BM exhibited a significantly greater average depth of 13.36 ± 0.99 cm. Higher litter depth was due to the topping of bedding material in EPI + BM rooms. Monitoring and managing litter depth is crucial for maintaining optimal conditions in poultry housing. Future research should focus on identifying the management practices and bedding materials used in the EPI + BM condition that contributed to the observed differences in litter depth, aiming to improve poultry housing practices and promote bird welfare.
Similarly, the study compared the litter moisture content between a control group and EPI + BM treatment rooms (Figure 4). The control group had an average litter moisture content of 11.73 ± 0.78%, while the EPI + BM showed a slightly lower average of 10.69 ± 0.67%, which might be due to the topping of new bedding materials with low LMC (7.98 ± 0.16%). Excess moisture in the litter can lead to bacterial and fungal growth, posing risks to bird health [35,36]. The lower moisture content observed in the EPI + BM suggests improved ventilation [37] and litter management techniques [3]. Further investigation is needed to determine the specific strategies employed in the EPI + BM condition and their effectiveness in maintaining optimal litter moisture content for poultry welfare.

3.2. Effects on PM

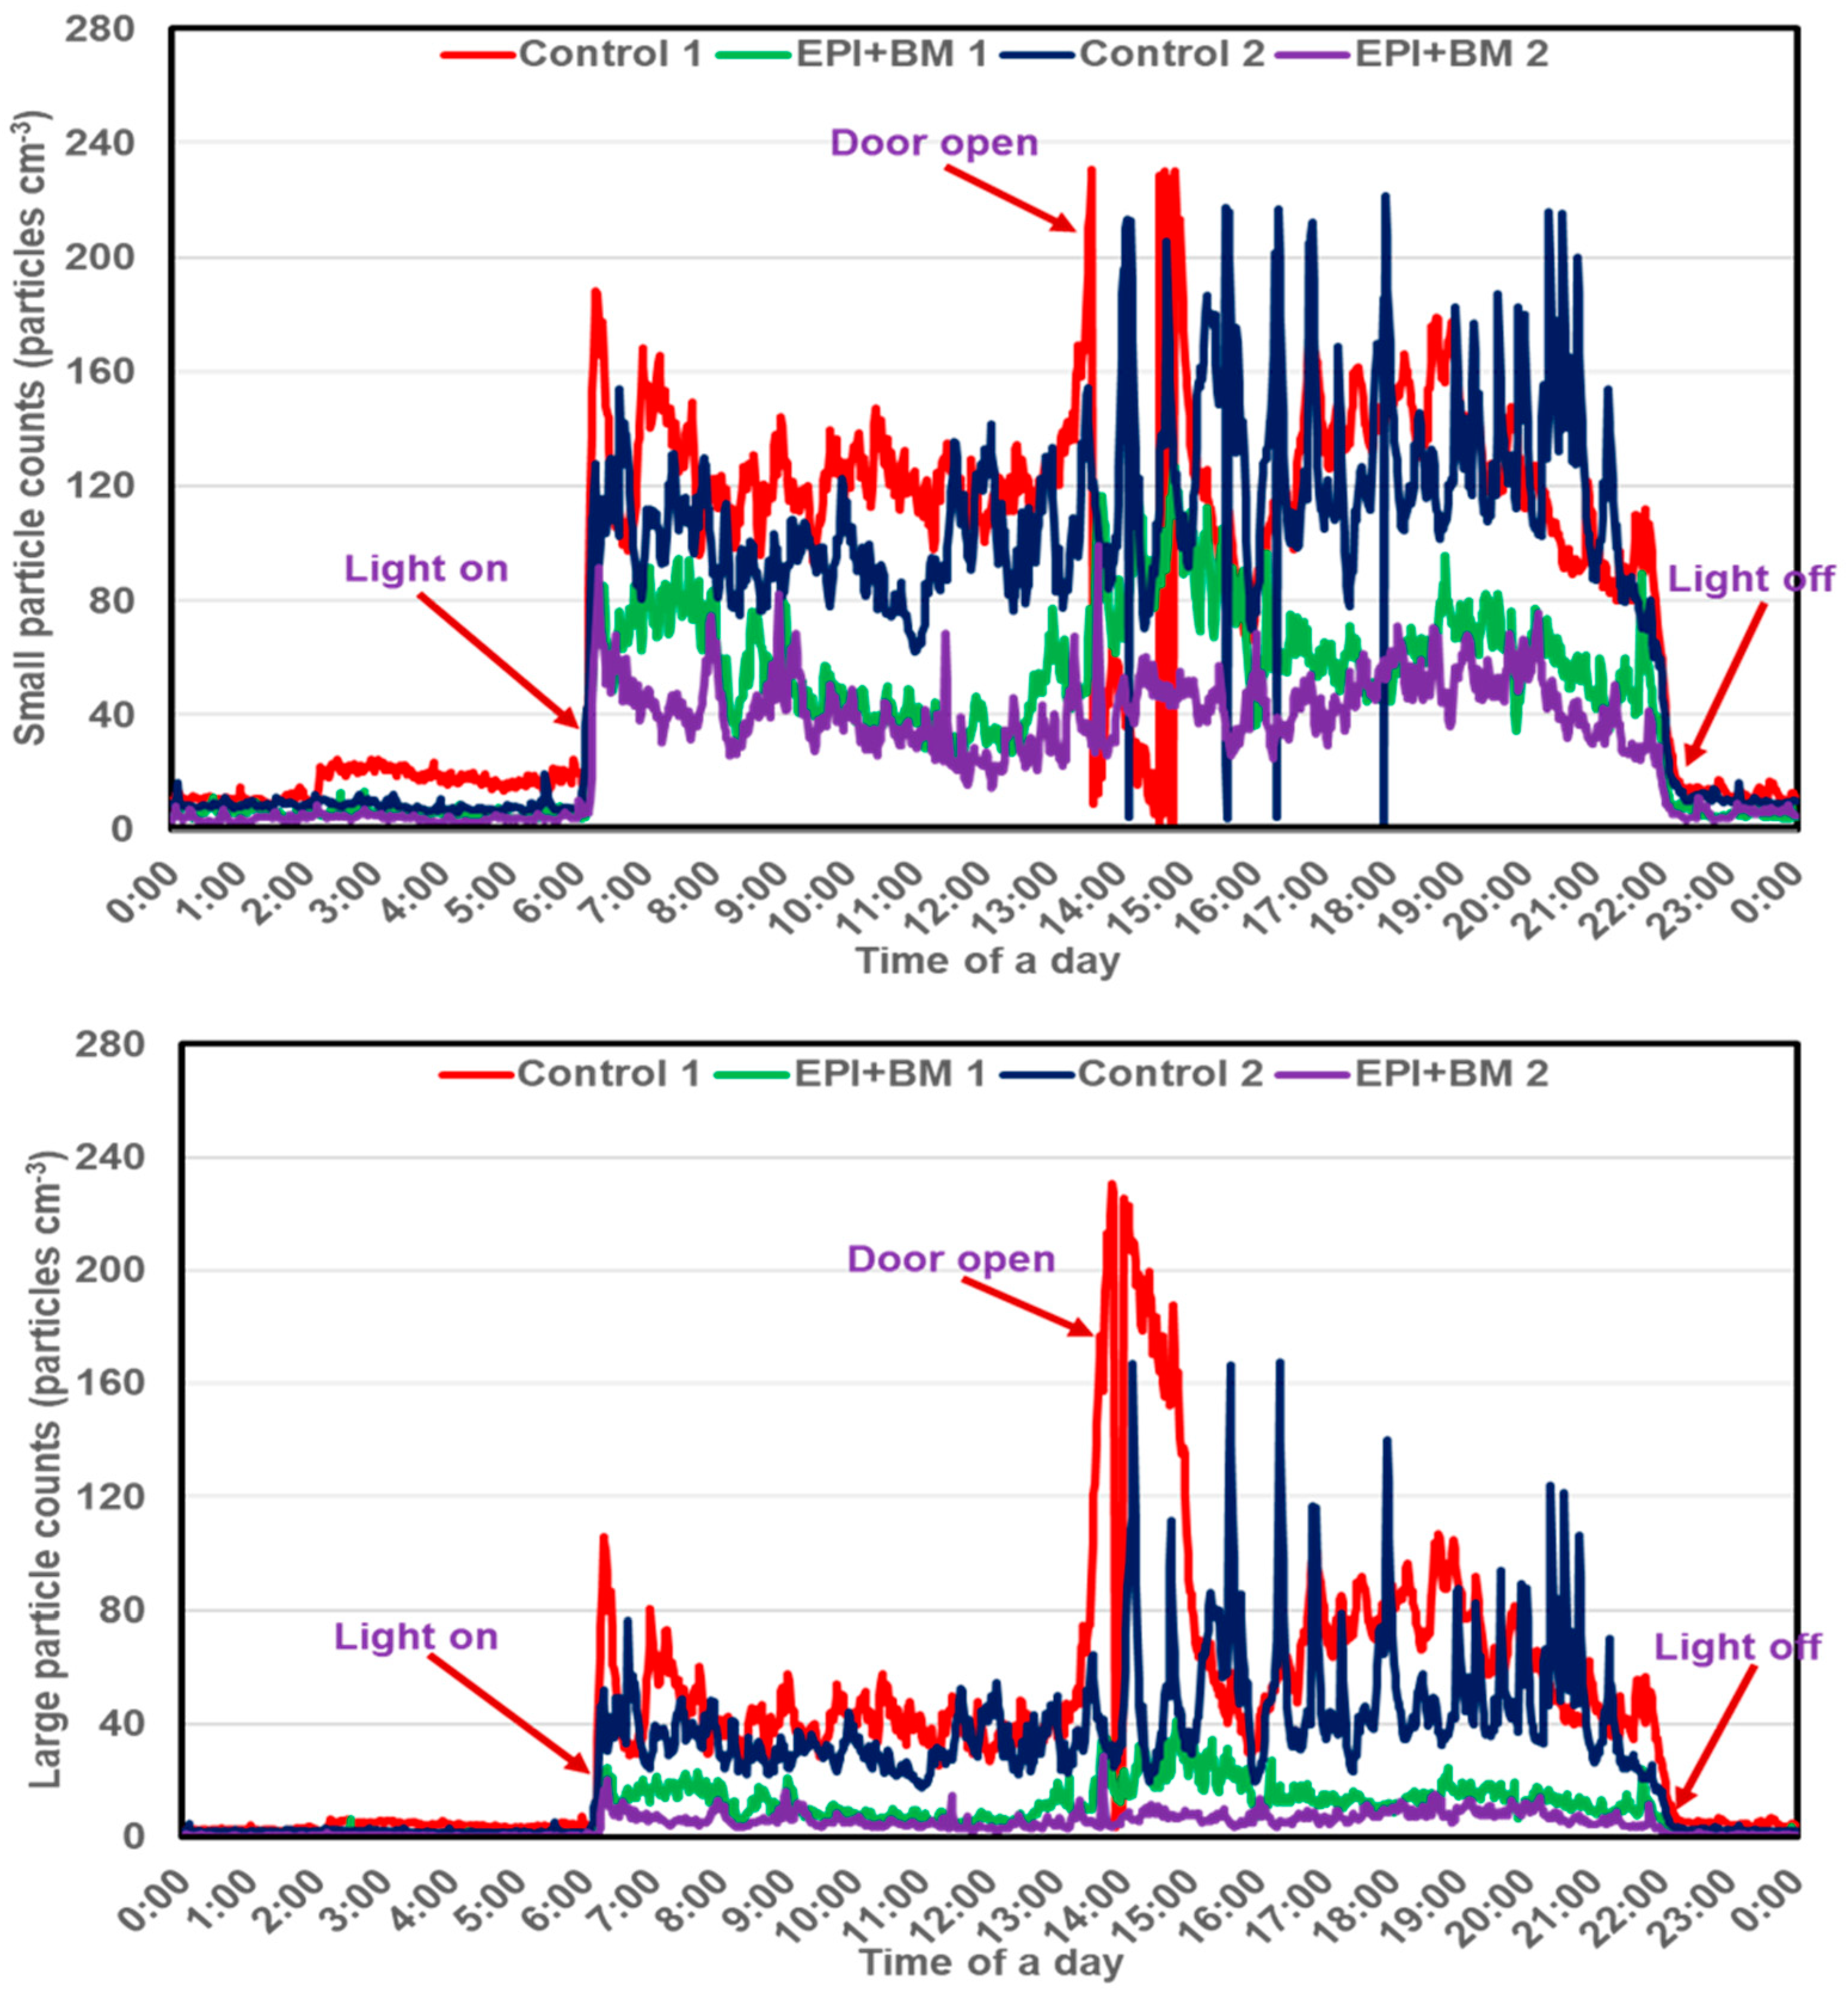
3.2.1. Temporal Variation in Particle Concentrations

The study compared the temporal variation in dust particles in Control 1, Control 2, EPI + BM 1, and EPI + BM 2 rooms (Figure 5). Control 1 and Control 2 rooms, which lacked specialized treatment for dust particles, consistently exhibited higher particle counts throughout the day. In contrast, rooms equipped with EPI + BM treatment measures consistently maintained lower dust levels. The highest particle counts were observed during specific periods, such as when the lights were turned on in the morning (6 to 7 a.m.) and before that were turned off in the evening (3 to 8 p.m.). Throughout the day, particle counts in the EPI + BM rooms remained at low levels due to the continuous operation of the treatment measures. However, there were significantly lower particle counts during nighttime than daytime (p < 0.01). These findings emphasize the importance of regular maintenance and monitoring practices to sustain a clean environment and minimize dust particles in treatment rooms. The study concluded that the treatment measures implemented in the EPI + BM rooms successfully maintained lower dust levels than the control rooms, providing valuable insights for ensuring clean and healthy environments in various settings.

3.2.2. Particle Concentration

Concerning, the effects of the EPI + BM treatment on small and large particle counts in CF hen housing compared to the control group, this study revealed significant differences regarding particle counts between the treatment and control groups (p < 0.05). In the control group, the average small particle count was 51.39 ± 18.50 particles/cm3, while in the EPI + BM treatment group it decreased significantly to 31.95 ± 3.60 particles/cm3 (p < 0.01), representing a reduction of 37.83%. Similarly, the average large particle count in the control group was 17.092 ± 14.18 particles/cm3, which was substantially reduced to 7.54 ± 1.66 particles/cm3 in the EPI + BM treatment group (p < 0.05), indicating a reduction of 55.90%. These findings demonstrate the effectiveness of the EPI + BM treatment in reducing both small and large particle counts in the context of CF hen housing.
The significant reduction in particle counts observed in the EPI + BM treatment group can be attributed to implementing both PM mitigation strategies together. The EPI + BM treatment creates a cleaner and healthier environment for the hens by minimizing the presence of small and large particles. The results indicate that the treatment measures successfully maintained stable and controlled particle levels, as evidenced by the low standard deviations within the EPI + BM group. The findings of this study have important implications for the welfare and health of hens in CF housing systems. Further research and investigation are necessary to refine and expand upon the findings of this study, providing valuable insights for developing effective strategies to mitigate PM in CF hen housing.

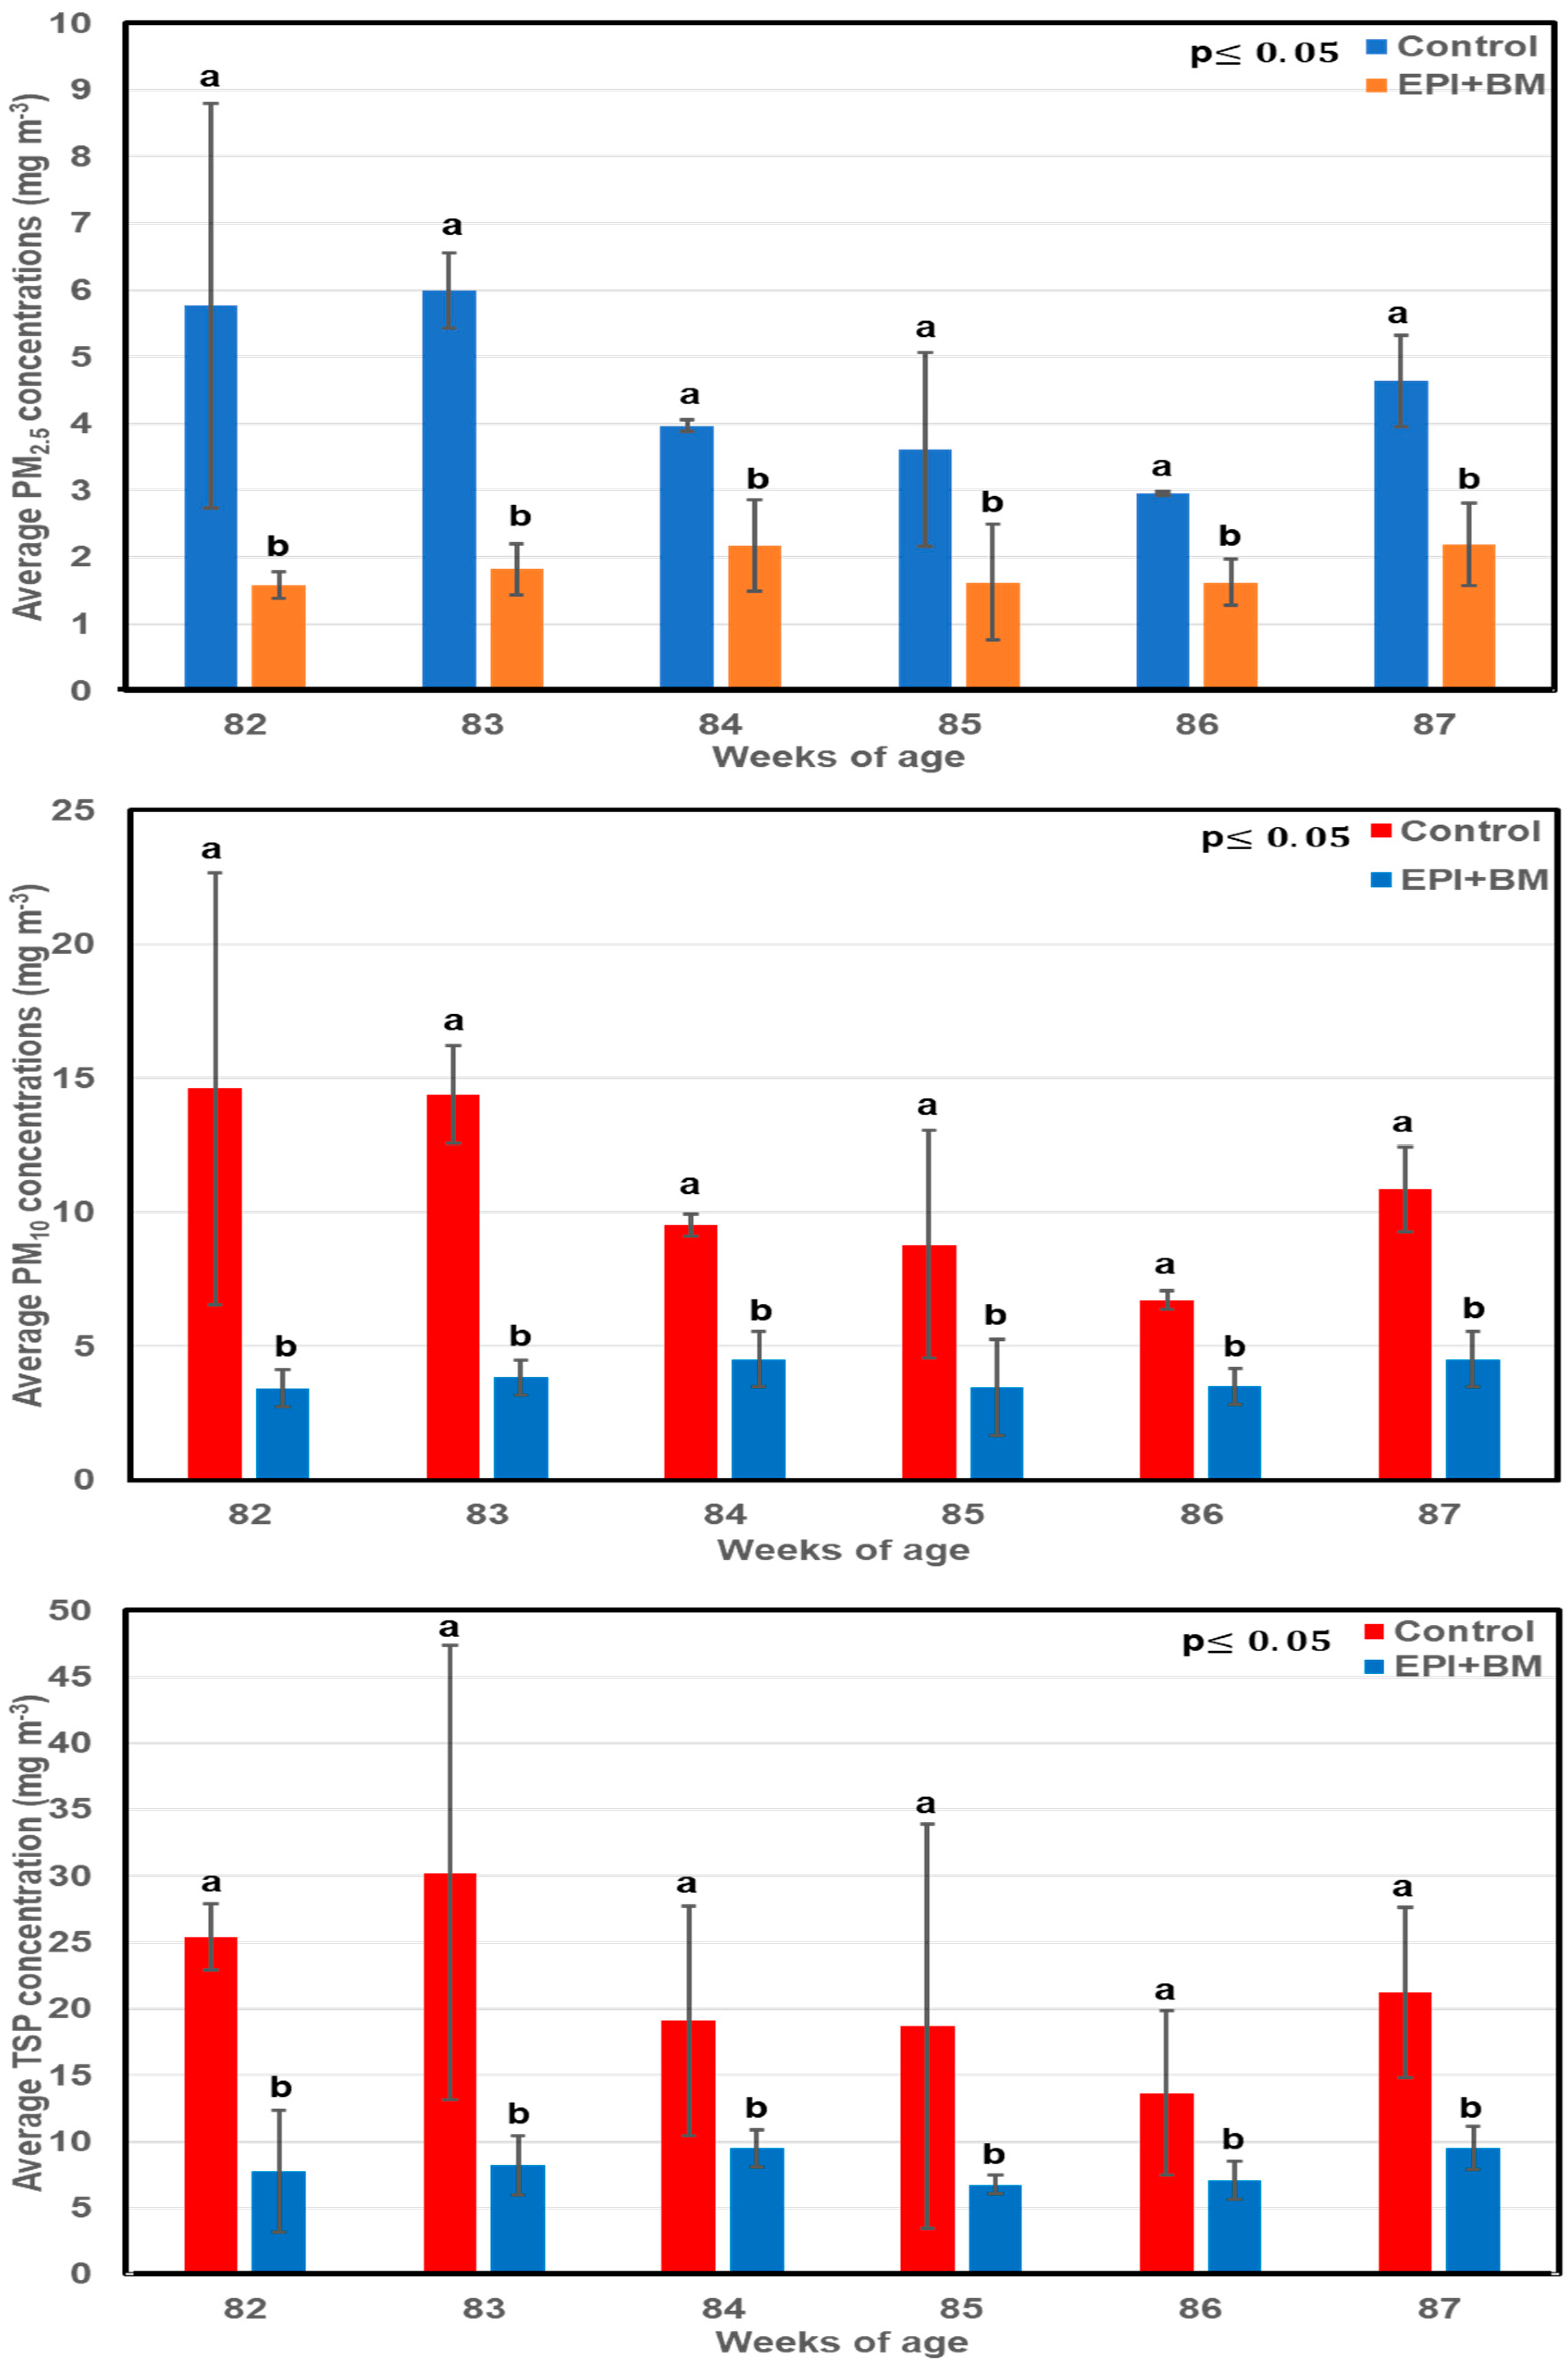
3.2.3. PM Mass Concentrations

Figure 6 presents a detailed analysis of the PM mass concentrations in CF hen housing and evaluates the effectiveness of the EPI + BM treatment in reducing PM levels. The study focused on assessing the impact of the treatment on different size fractions of PM, including PM1, PM2.5, PM4, PM10, and TSP, over six weeks (Figure 6). The results revealed significant differences in PM concentrations between the control group and the EPI + BM treatment group (p < 0.001). Specifically, in the control group, the average concentrations of PM1, PM2.5, PM4, PM10, and TSP were higher than in the EPI + BM treatment group (Table 2). The EPI + BM treatment substantially reduced PM concentrations, with percentage reductions ranging from 58.41% to 64.17%. These findings highlight the efficacy of the EPI + BM treatments in reducing PM.
The success in reducing PM concentrations in the EPI + BM treatment group can be attributed to implementing specific measures tailored for CF hen housing. These measures effectively minimized the release and accumulation of PM in the housing environment, resulting in significantly lower PM concentrations than in the control group. Further research and investigation are warranted to refine and optimize the treatment interventions specifically designed for CF hen housing. This study can enhance CF egg production systems’ sustainability and welfare standards by advancing our understanding of PM reduction strategies in these settings.
However, the issue of PM or dust accumulation on grounded objects in poultry houses, including the litter floor, ceiling, and equipment, remains a significant concern when utilizing EPI [21]. This accumulation can adversely affect various aspects of poultry production and welfare. One area of particular concern is the presence of dust on devices such as heaters, circulating and exhaust fans, lights, and perches. Dust accumulation on these surfaces necessitates regular cleaning to maintain functionality and prevent potential negative consequences. For instance, dust that collects on bulbs and light fixtures can obstruct light distribution, reducing light intensity reaching the birds. This reduction in lighting can have detrimental effects on the behavior of the hens, leading to issues such as mislaying, piling, and pecking behavior. Moreover, dust accumulation above perches poses additional risks. When perches become coated with dust, it can become slippery, increasing the chances of accidents and injuries to the birds. To address these challenges, implementing a dust collector system has been considered to effectively capture and remove dust from the poultry house environment [21]. However, installing dust collectors inside the housing presents certain risks, particularly regarding the safety required to operate these devices and hen care. Given that hens are active and frequently move and jump around, there is a potential risk of accidents or disturbances caused by the presence of electrical equipment. As a result, researchers and poultry producers must explore alternative approaches that prioritize safety while effectively minimizing dust levels within the farm. Finding innovative solutions that not only prevent accidents but also remove dust effectively from the poultry environment is crucial for maintaining optimal conditions and ensuring the well-being of the birds.
The limitations of this study include the small number of rooms available (only four), which restricted our ability to create multiple replications and provided limited capacity for making robust comparisons between treatments. Additionally, due to the limited number of rooms, we could not evaluate individual treatment effects; instead, we relied on previous research comparing conditions with and without added bedding materials. Moreover, this study did not measure behavior and welfare aspects, which we plan to address in future research. Future studies will involve more replications and will include all treatment conditions to enhance the robustness of the findings.

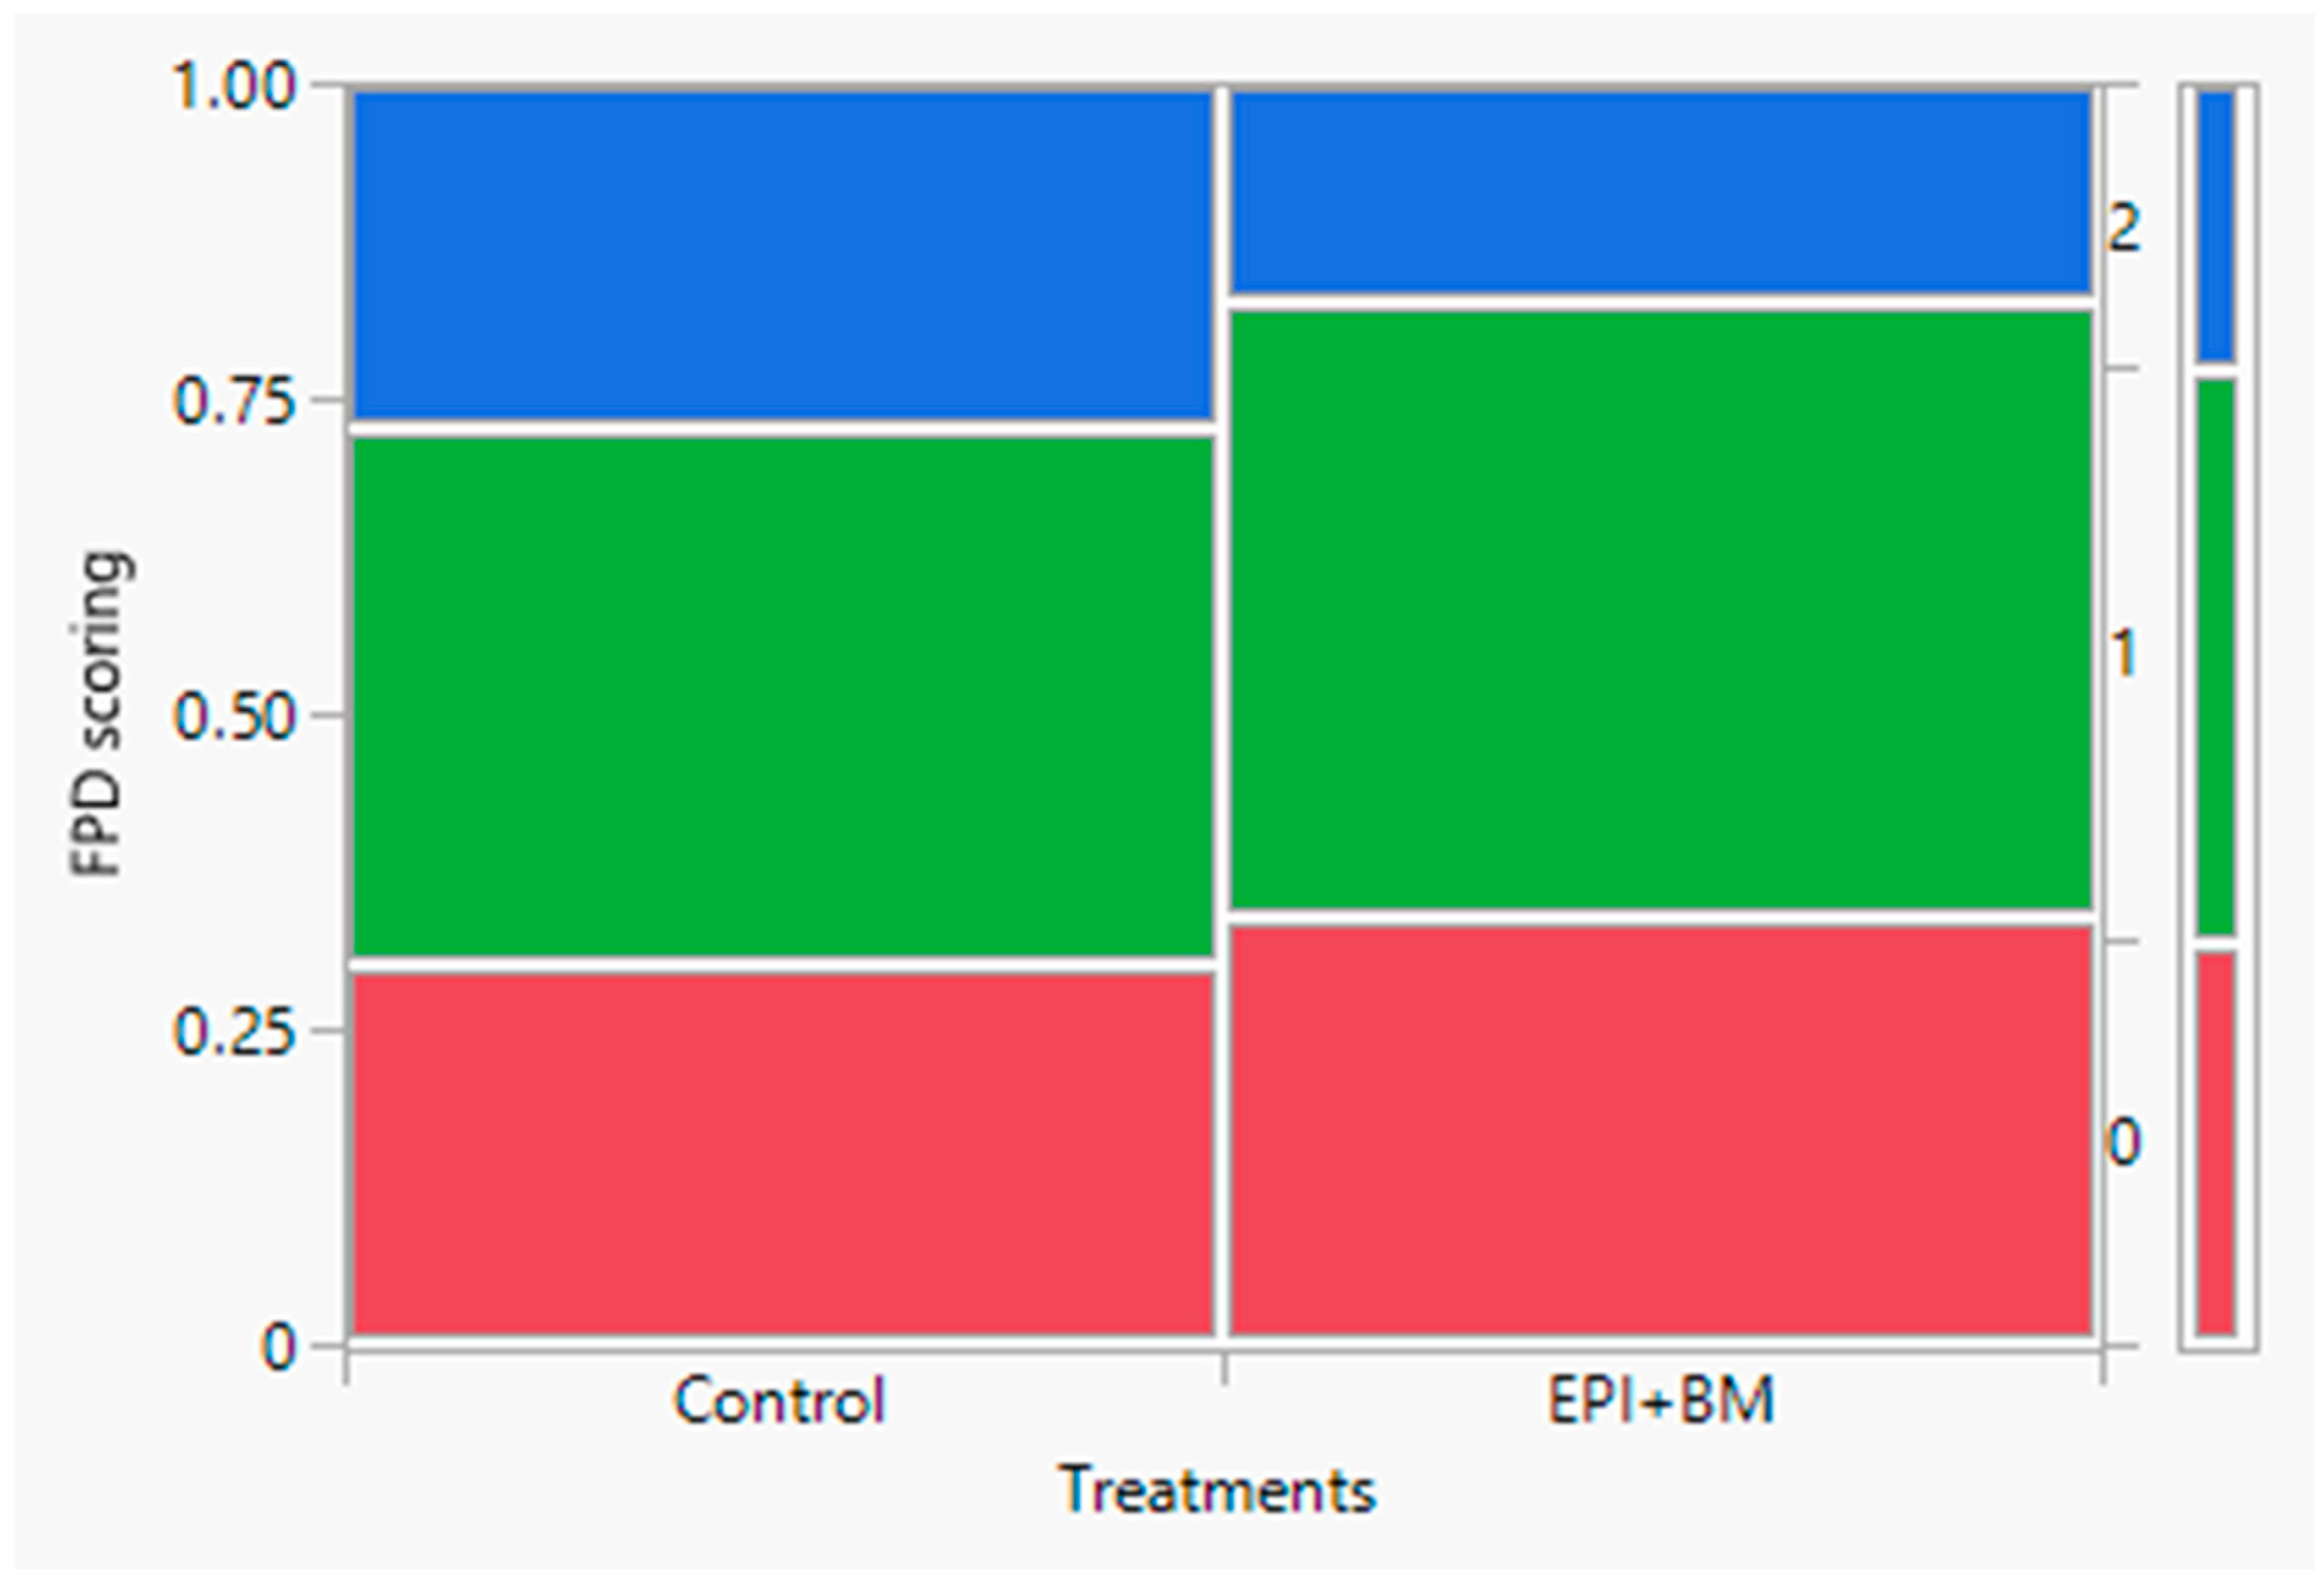
3.3. Footpad Dermatitis Scoring

The study examined the impact of new bedding treatment on FPD scoring in laying hens compared to a control group. Topping litter may offer enhanced cushioning, insulation, moisture absorption, and retention, potentially reducing footpad lesions [38]. The FPD scoring was assessed on a scale of 0 to 2, with higher scores indicating more severe footpad conditions, as mentioned in Figure 7. The results revealed no significant difference in FPD scoring between the control and EPI + BM treatments (ChiSquare p = 0.3147), indicating that adding new bedding did not improve footpad conditions (Figure 7), possibly due to the short experimental duration. The FPD scores of 0, 1, and 2 were 30–35%, 43–49%, and 18–28%, respectively.
These findings suggest that the new bedding materials did not affect FPD in laying hens in the short term. Despite the expectation that introducing fresh bedding would enhance footpad health, there was no significant reduction in FPD severity compared to the control group, possibly due to low LMC (dry litter) [15,39]. The lack of significant difference between the treatments highlights the need for further investigation and the implementation of comprehensive strategies to address FPD in laying hens. Additional approaches should be explored, such as optimizing housing systems, improving litter management protocols, or considering genetic selection for enhanced footpad health. A multifaceted approach encompassing various aspects of farming and management is necessary to effectively mitigate FPD and promote the overall welfare of laying hens.

4. Conclusions

This study investigated the effectiveness of an integrated method for improving air quality in CF hen housing. The study found that the EPI + BM treatment effectively reduced PM, resulting in a cleaner and healthier environment for laying hens. The reduction in PM concentrations ranged from 58.41% to 64.17% across different size fractions of PM. These findings emphasize the importance of proactive PM management and the potential of EPI + BM treatment in improving bird health and welfare. Future research should focus on refining and expanding these strategies for practical implementation in commercial poultry production systems and exploring comprehensive approaches to address animal health and welfare concerns.

Author Contributions

Methodology, R.B.B. and L.C.; Validation, R.B.B.; Investigation, R.B.B., X.Y., S.S., B.P. and L.C.; Resources, L.C.; Data curation, R.B.B.; Writing—original draft, R.B.B., X.Y. and L.C.; Project administration, L.C.; Funding acquisition, L.C. All authors have read and agreed to the published version of the manuscript.

Funding

The study was sponsored by the USDA-NIFA AFRI (2023-68008-39853), Egg Industry Center, Georgia Research Alliance; and USDA-NIFA Hatch Multistate projects: Fostering Technologies, Metrics, and Behaviors for Sustainable Advances in Animal Agriculture (S1074).

Data Availability Statement

The raw data supporting the conclusions of this article will be made available by the authors on request.

Conflicts of Interest

The authors declare no conflict of interest.

References

  1. Ni, J.-Q. Research and Demonstration to Improve Air Quality for the US Animal Feeding Operations in the 21st Century—A Critical Review. Environ. Pollut. 2015, 200, 105–119. [Google Scholar] [CrossRef] [PubMed]
  2. Chai, L.; Xin, H.; Zhao, Y.; Wang, T.; Soupir, M.; Liu, K. Mitigating Ammonia and PM Generation of Cage-Free Henhouse Litter with Solid Additive and Liquid Spray. Trans. ASABE 2018, 61, 287–294. [Google Scholar] [CrossRef]
  3. Bist, R.B.; Chai, L. Advanced Strategies for Mitigating Particulate Matter Generations in Poultry Houses. Appl. Sci. 2022, 12, 11323. [Google Scholar] [CrossRef]
  4. Ni, J.-Q.; Erasmus, M.; Jones, D.R.; Campbell, D.L. Effectiveness and Characteristics of a New Technology to Reduce Ammonia, Carbon Dioxide, and Particulate Matter Pollution in Poultry Production with Artificial Turf Floor. Environ. Technol. Innov. 2023, 29, 102976. [Google Scholar] [CrossRef]
  5. Zhao, Y.; Shepherd, T.A.; Li, H.; Xin, H. Environmental Assessment of Three Egg Production Systems—Part I: Monitoring System and Indoor Air Quality. Poult. Sci. 2015, 94, 518–533. [Google Scholar] [CrossRef] [PubMed]
  6. Zhao, Y.; Zhao, D.; Ma, H.; Liu, K.; Atilgan, A.; Xin, H. Environmental Assessment of Three Egg Production Systems—Part III: Airborne Bacteria Concentrations and Emissions. Poult. Sci. 2016, 95, 1473–1481. [Google Scholar] [CrossRef] [PubMed]
  7. US EPA. Health and Environmental Effects of Particulate Matter (PM). Available online: https://www.epa.gov/pm-pollution/health-and-environmental-effects-particulate-matter-pm (accessed on 30 September 2022).
  8. US EPA. Particulate Matter (PM) Basics. Available online: https://www.epa.gov/pm-pollution/particulate-matter-pm-basics (accessed on 30 September 2022).
  9. Koren, H.; Bisesi, M. Handbook of Environmental Health, Fourth Edition, Volume II: Pollutant Interactions in Air, Water, and Soil; Herman, K., Michael, S.B., Eds.; Routledge: London, UK, 2003; Volume 2. [Google Scholar]
  10. Schwarze, P.; Øvrevik, J.; Låg, M.; Refsnes, M.; Nafstad, P.; Hetland, R.; Dybing, E. Particulate Matter Properties and Health Effects: Consistency of Epidemiological and Toxicological Studies. Hum. Exp. Toxicol. 2006, 25, 559–579. [Google Scholar] [CrossRef] [PubMed]
  11. Zhao, Y.; Aarnink, A.; De Jong, M.; Ogink, N.; Koerkamp, P.G. Effectiveness of Multi-Stage Scrubbers in Reducing Emissions of Air Pollutants from Pig Houses. Trans. ASABE 2011, 54, 285–293. [Google Scholar] [CrossRef]
  12. Winkel, A.; Mosquera, J.; Aarnink, A.J.; Koerkamp, P.W.G.; Ogink, N.W. Evaluation of Oil Spraying Systems and Air Ionisation Systems for Abatement of Particulate Matter Emission in Commercial Poultry Houses. Biosyst. Eng. 2016, 150, 104–122. [Google Scholar] [CrossRef]
  13. Chai, L.; Xin, H.; Wang, Y.; Oliveira, J.; Wang, K.; Zhao, Y. Mitigating Particulate Matter Generation in a Commercial Cage-Free Hen House. Trans. ASABE 2019, 62, 877–886. [Google Scholar] [CrossRef]
  14. Shepherd, E.; Fairchild, B. Footpad Dermatitis in Poultry. Poult. Sci. 2010, 89, 2043–2051. [Google Scholar] [CrossRef] [PubMed]
  15. De Jong, I.C.; Gunnink, H.; Van Harn, J. Wet Litter Not Only Induces Footpad Dermatitis but Also Reduces Overall Welfare, Technical Performance, and Carcass Yield in Broiler Chickens. J. Appl. Poult. Res. 2014, 23, 51–58. [Google Scholar] [CrossRef]
  16. Forero, D.; Pena, C.; Acevedo, P.; Hernandez, M.; Cabeza, I. Biofiltration of Acetic Acid Vapours Using Filtering Bed Compost from Poultry Manure-Pruning Residues-Rice Husks. Chem. Eng. Trans. 2018, 64, 511–516. [Google Scholar]
  17. Strohmaier, C.; Schmithausen, A.J.; Krommweh, M.S.; Diekmann, B.; Büscher, W. Evaluation of a Dry Filter for Dust Removal under Laboratory Conditions in Comparison to Practical Use at a Laying Hen Barn. Environ. Sci. Pollut. Res. 2018, 25, 29511–29517. [Google Scholar] [CrossRef]
  18. Mitchell, B.; Buhr, R.; Berrang, M.; Bailey, J.; Cox, N. Reducing Airborne Pathogens, Dust and Salmonella Transmission in Experimental Hatching Cabinets Using an Electrostatic Space Charge System. Poult. Sci. 2002, 81, 49–55. [Google Scholar] [CrossRef]
  19. Mitchell, B.W.; Waltman, W.D. Reducing Airborne Pathogens and Dust in Commercial Hatching Cabinets with an Electrostatic Space Charge System. Avian Dis. 2003, 47, 247–253. [Google Scholar] [CrossRef]
  20. Ritz, C.; Fairchild, B.; Lacy, M. Implications of Ammonia Production and Emissions from Commercial Poultry Facilities: A Review. J. Appl. Poult. Res. 2004, 13, 684–692. [Google Scholar] [CrossRef]
  21. Mitchell, B.W.; Baumgartner, J.W. Electrostatic Space Charge System for Reducing Dust in Poultry Production Houses and the Hatchery. In International Conference How to Improve Air Quality; Citeseer, 2007; pp. 23–24. Available online: https://citeseerx.ist.psu.edu/document?repid=rep1&type=pdf&doi=b5467e69bce33c3b5691d6a4a4a8d065ed1a35f2 (accessed on 23 April 2024).
  22. Cambra-López, M.; Winkel, A.; Van Harn, J.; Ogink, N.; Aarnink, A. Ionization for Reducing Particulate Matter Emissions from Poultry Houses. Trans. ASABE 2009, 52, 1757–1771. [Google Scholar] [CrossRef]
  23. Jerez, S.B.; Mukhtar, S.; Faulkner, W.; Casey, K.D.; Borhan, M.S.; Smith, R.A. Evaluation of Electrostatic Particle Ionization and BioCurtainTM Technologies to Reduce Air Pollutants from Broiler Houses. Appl. Eng. Agric. 2013, 29, 975–984. [Google Scholar]
  24. Ritz, C.; Mitchell, B.; Fairchild, B.; Czarick III, M.; Worley, J. Improving In-House Air Quality in Broiler Production Facilities Using an Electrostatic Space Charge System. J. Appl. Poult. Res. 2006, 15, 333–340. [Google Scholar] [CrossRef]
  25. Mitchell, B.; Richardson, L.; Wilson, J.; Hofacre, C. Application of an Electrostatic Space Charge System for Dust, Ammonia, and Pathogen Reduction in a Broiler Breeder House. Appl. Eng. Agric. 2004, 20, 87. [Google Scholar] [CrossRef]
  26. Munir, M.; Belloncle, C.; Irle, M.; Federighi, M. Wood-Based Litter in Poultry Production: A Review. World’s Poult. Sci. J. 2019, 75, 5–16. [Google Scholar] [CrossRef]
  27. Bist, R.B.; Regmi, P.; Karcher, D.; Guo, Y.; Singh, A.K.; Ritz, C.W.; Kim, W.K.; Jones, D.R.; Chai, L. Bedding Management for Suppressing Particulate Matter in Cage-Free Hen Houses. AgriEngineering 2023, 5, 1663–1676. [Google Scholar] [CrossRef]
  28. Hy-Line 36 COM ENG. Available online: https://www.hyline.com/filesimages/Hy-Line-Products/Hy-Line-Product-PDFs/W-36/36%20COM%20ENG.pdf (accessed on 10 September 2022).
  29. Bist, R.B.; Yang, X.; Subedi, S.; Ritz, C.W.; Kim, W.K.; Chai, L. Electrostatic Particle Ionization for Suppressing Air Pollutants in Cage-Free Layer Facilities. Poult. Sci. 2024, 103, 103494. [Google Scholar] [CrossRef]
  30. Bist, R.B.; Yang, X.; Subedi, S.; Sharma, M.K.; Singh, A.K.; Ritz, C.W.; Kim, W.K.; Chai, L. Temporal Variations of Air Quality in Cage-Free Experimental Pullet Houses. Poultry 2023, 2, 320–333. [Google Scholar] [CrossRef]
  31. Yasmeen, R.; Ali, Z.; Tyrrel, S.; Nasir, Z.A. Estimation of Particulate Matter and Gaseous Concentrations Using Low-Cost Sensors from Broiler Houses. Environ. Monit. Assess. 2019, 191, 470. [Google Scholar] [CrossRef]
  32. Bist, R.B.; Yang, X.; Subedi, S.; Paneru, B.; Chai, L. Enhancing Dust Control for Cage-Free Hens with Electrostatic Particle Charging Systems at Varying Installation Heights and Operation Durations. AgriEngineering 2024, 6, 1747–1759. [Google Scholar] [CrossRef]
  33. GAP Chicken Welfare Standards. Available online: http://glblanimalpartnership.blob.core.windows.net/standards/Chicken%20Welfare%20Standards.pdf (accessed on 25 June 2023).
  34. Verma, K.K.; Singh, V.; Gupta, S.L.; Yadav, J.; Verma, A.K. Environmentally Controlled House-In Poultry Production. Poult. Line 2014, 1, 29–32. [Google Scholar]
  35. Elliott, H.; Collins, N. Factors Affecting Ammonia Release in Broiler Houses. Trans. ASAE 1982, 25, 413–0418. [Google Scholar] [CrossRef]
  36. Chen, B.; Shao, Y.; Shi, M.; Ji, L.; He, Q.; Yan, S. Anaerobic Digestion of Chicken Manure Coupled with Ammonia Recovery by Vacuum-Assisted Gas-Permeable Membrane Process. Biochem. Eng. J. 2021, 175, 108135. [Google Scholar] [CrossRef]
  37. Carr, L.; Wheaton, F.; Douglass, L. Empirical Models to Determine Ammonia Concentrations from Broiler Chicken Litter. Trans. ASAE 1990, 33, 1337–1342. [Google Scholar] [CrossRef]
  38. Shepherd, E.M.; Fairchild, B.D.; Ritz, C.W. Alternative Bedding Materials and Litter Depth Impact Litter Moisture and Footpad Dermatitis. J. Appl. Poult. Res. 2017, 26, 518–528. [Google Scholar] [CrossRef]
  39. Bilgili, S.; Hess, J.; Blake, J.; Macklin, K.; Saenmahayak, B.; Sibley, J. Influence of Bedding Material on Footpad Dermatitis in Broiler Chickens. J. Appl. Poult. Res. 2009, 18, 583–589. [Google Scholar] [CrossRef]
Figure 1. Treatment used in this experiment: (a) bedding material (wood chips) and (b) electrostatic particle ionization system.
Agriengineering 06 00162 g001
Figure 2. Daily mean room temperature (top) and relative humidity (bottom) in four rooms over 6 weeks. EPI—electrostatic particle ionization; BM—bedding material. Control 1, Control 2, EPI + BM 1, and EPI + BM 2 are the treatment rooms.
Agriengineering 06 00162 g002
Figure 3. Comparison of small (top) and large (bottom) ventilation airflow rates between treatment rooms over 6 weeks. The presence of distinct letters within the figure indicates significant differences, with a significance level of p < 0.05.
Agriengineering 06 00162 g003
Figure 4. Comparative analysis of weekly litter depth (top) and litter moisture content (bottom) levels among treatment groups over 6 weeks.
Agriengineering 06 00162 g004
Figure 5. Variation in small (top) and large (bottom) particle counts among four rooms throughout a standard day (10 April 2023). EPI—Electrostatic particle ionization, BM—bedding material. Small particles—particle size > 0.5 µm and large particles—particle size > 2.5 µm.
Agriengineering 06 00162 g005
Figure 6. Synergistic effects of EPI with bedding material on PM2.5 (top), PM10 (middle), and TSP (bottom) concentrations over 6 weeks. EPI—electrostatic particle ionization, BM—bedding material. The error bar in the figure represents the standard deviation. The presence of distinct letters within the figure indicates significant differences, with a significance level of p < 0.05.
Agriengineering 06 00162 g006
Figure 7. Mosaic plot of footpad dermatitis scoring among different treatments. FPD—footpad dermatitis; Control—without EPI and BM treatment; EPI—electrostatic particle ionization; BM—bedding material treatment. “0” represents a normal footpad condition and “2” represents the worst FPD condition.
Agriengineering 06 00162 g007
Table 1. Grading scale for footpad lesions in a cage-free hen house.
Score 0Score 1Score 2
No or very small lesionsMild and/or superficial lesionsSevere lesions with ulceration and significant damage
No discoloration or slight areaSubstantial footpad discolorationDark papillae and ulceration
Old scars or no scarringDark papillae without ulcerationAbscesses and/or swollen feet (bumblefoot)
Note: The table presents a grading scale for footpad lesions, outlining the scores associated with varying degrees of severity. The presence or absence of lesions, discoloration, scars, and the level of damage observed define each score.
Table 2. Comparison of PM concentrations between Control and EPI + BM treatment rooms.
TreatmentsPM1 (mg/m3)PM2.5 (mg/m3)PM4 (mg/m3)PM10 (mg/m3)TSP (mg/m3)
Control4.25 ± 1.45 a4.49 ± 1.56 a5.25 ± 1.91 a10.82 ± 4.14 a21.39 ± 9.62 a
EPI + BM1.77 ± 0.47 b1.84 ± 0.50 b2.06 ± 0.54 b3.88 ± 0.93 b8.15 ± 2.06 b
PM reduction (%)58.4159.0960.8064.1761.89
p-value (treatments)<0.001<0.001<0.001<0.001<0.001
p-value (WOA)0.3310.3390.3580.3630.607
Note: PM is particulate matter; PM1, PM2.5, PM4, PM10, and TSP represent different PM sizes; The PM levels are expressed in means ± standard deviation. Lowercase letters a,b indicate significant differences between the Control and EPI + BM groups. The p-values indicate the statistical significance of the differences in PM concentrations between the treatment groups (p-value for treatments) and within each treatment group (p-value for WOA, within-group analysis).
Disclaimer/Publisher’s Note: The statements, opinions and data contained in all publications are solely those of the individual author(s) and contributor(s) and not of MDPI and/or the editor(s). MDPI and/or the editor(s) disclaim responsibility for any injury to people or property resulting from any ideas, methods, instructions or products referred to in the content.

