

Rapid Analysis of Soil Organic Carbon in Agricultural Lands: Potential of Integrated Image Processing and Infrared Spectroscopy


Abstract
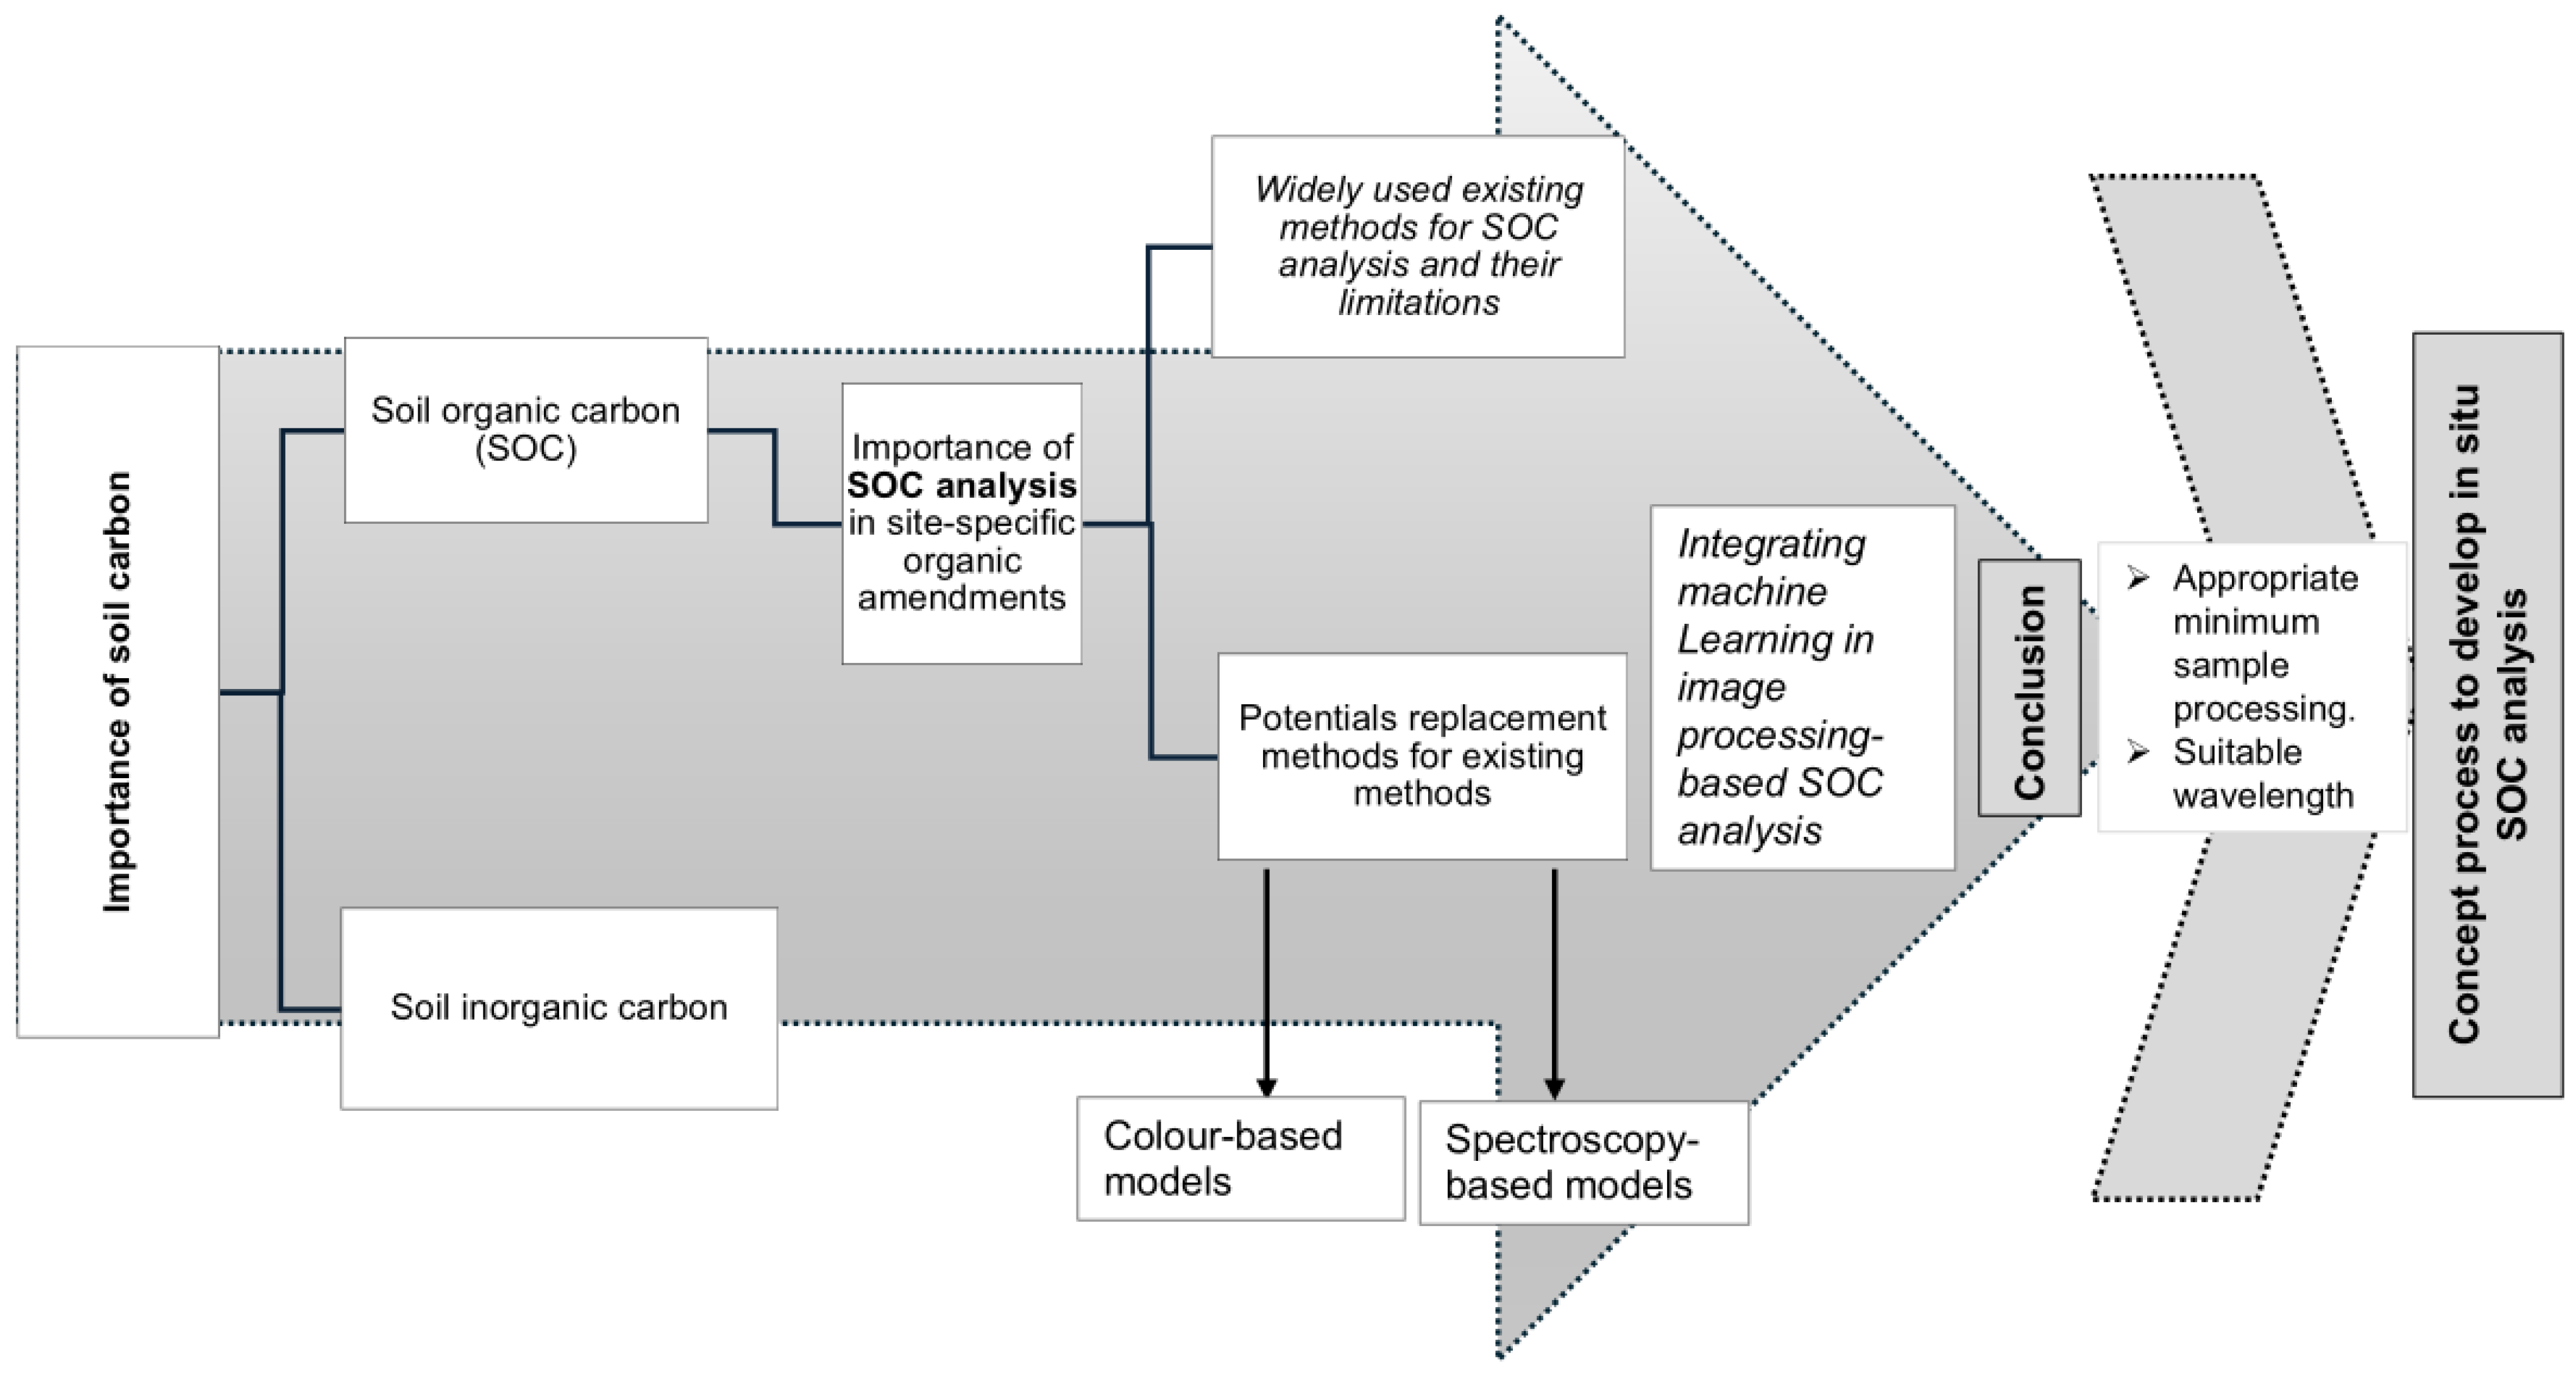
:1. Introduction
2. Widely Used Existing Methods for SOC Analysis and Their Limitations
2.1. Walkley and Black Method
2.2. Elemental Analysis
2.3. Limitations
3. Potential Replacement Methods for Existing Methods
3.1. Color-Based Models
3.2. Spectroscopy-Based Models
3.3. NIR Image-Based Model to Analyze SOC
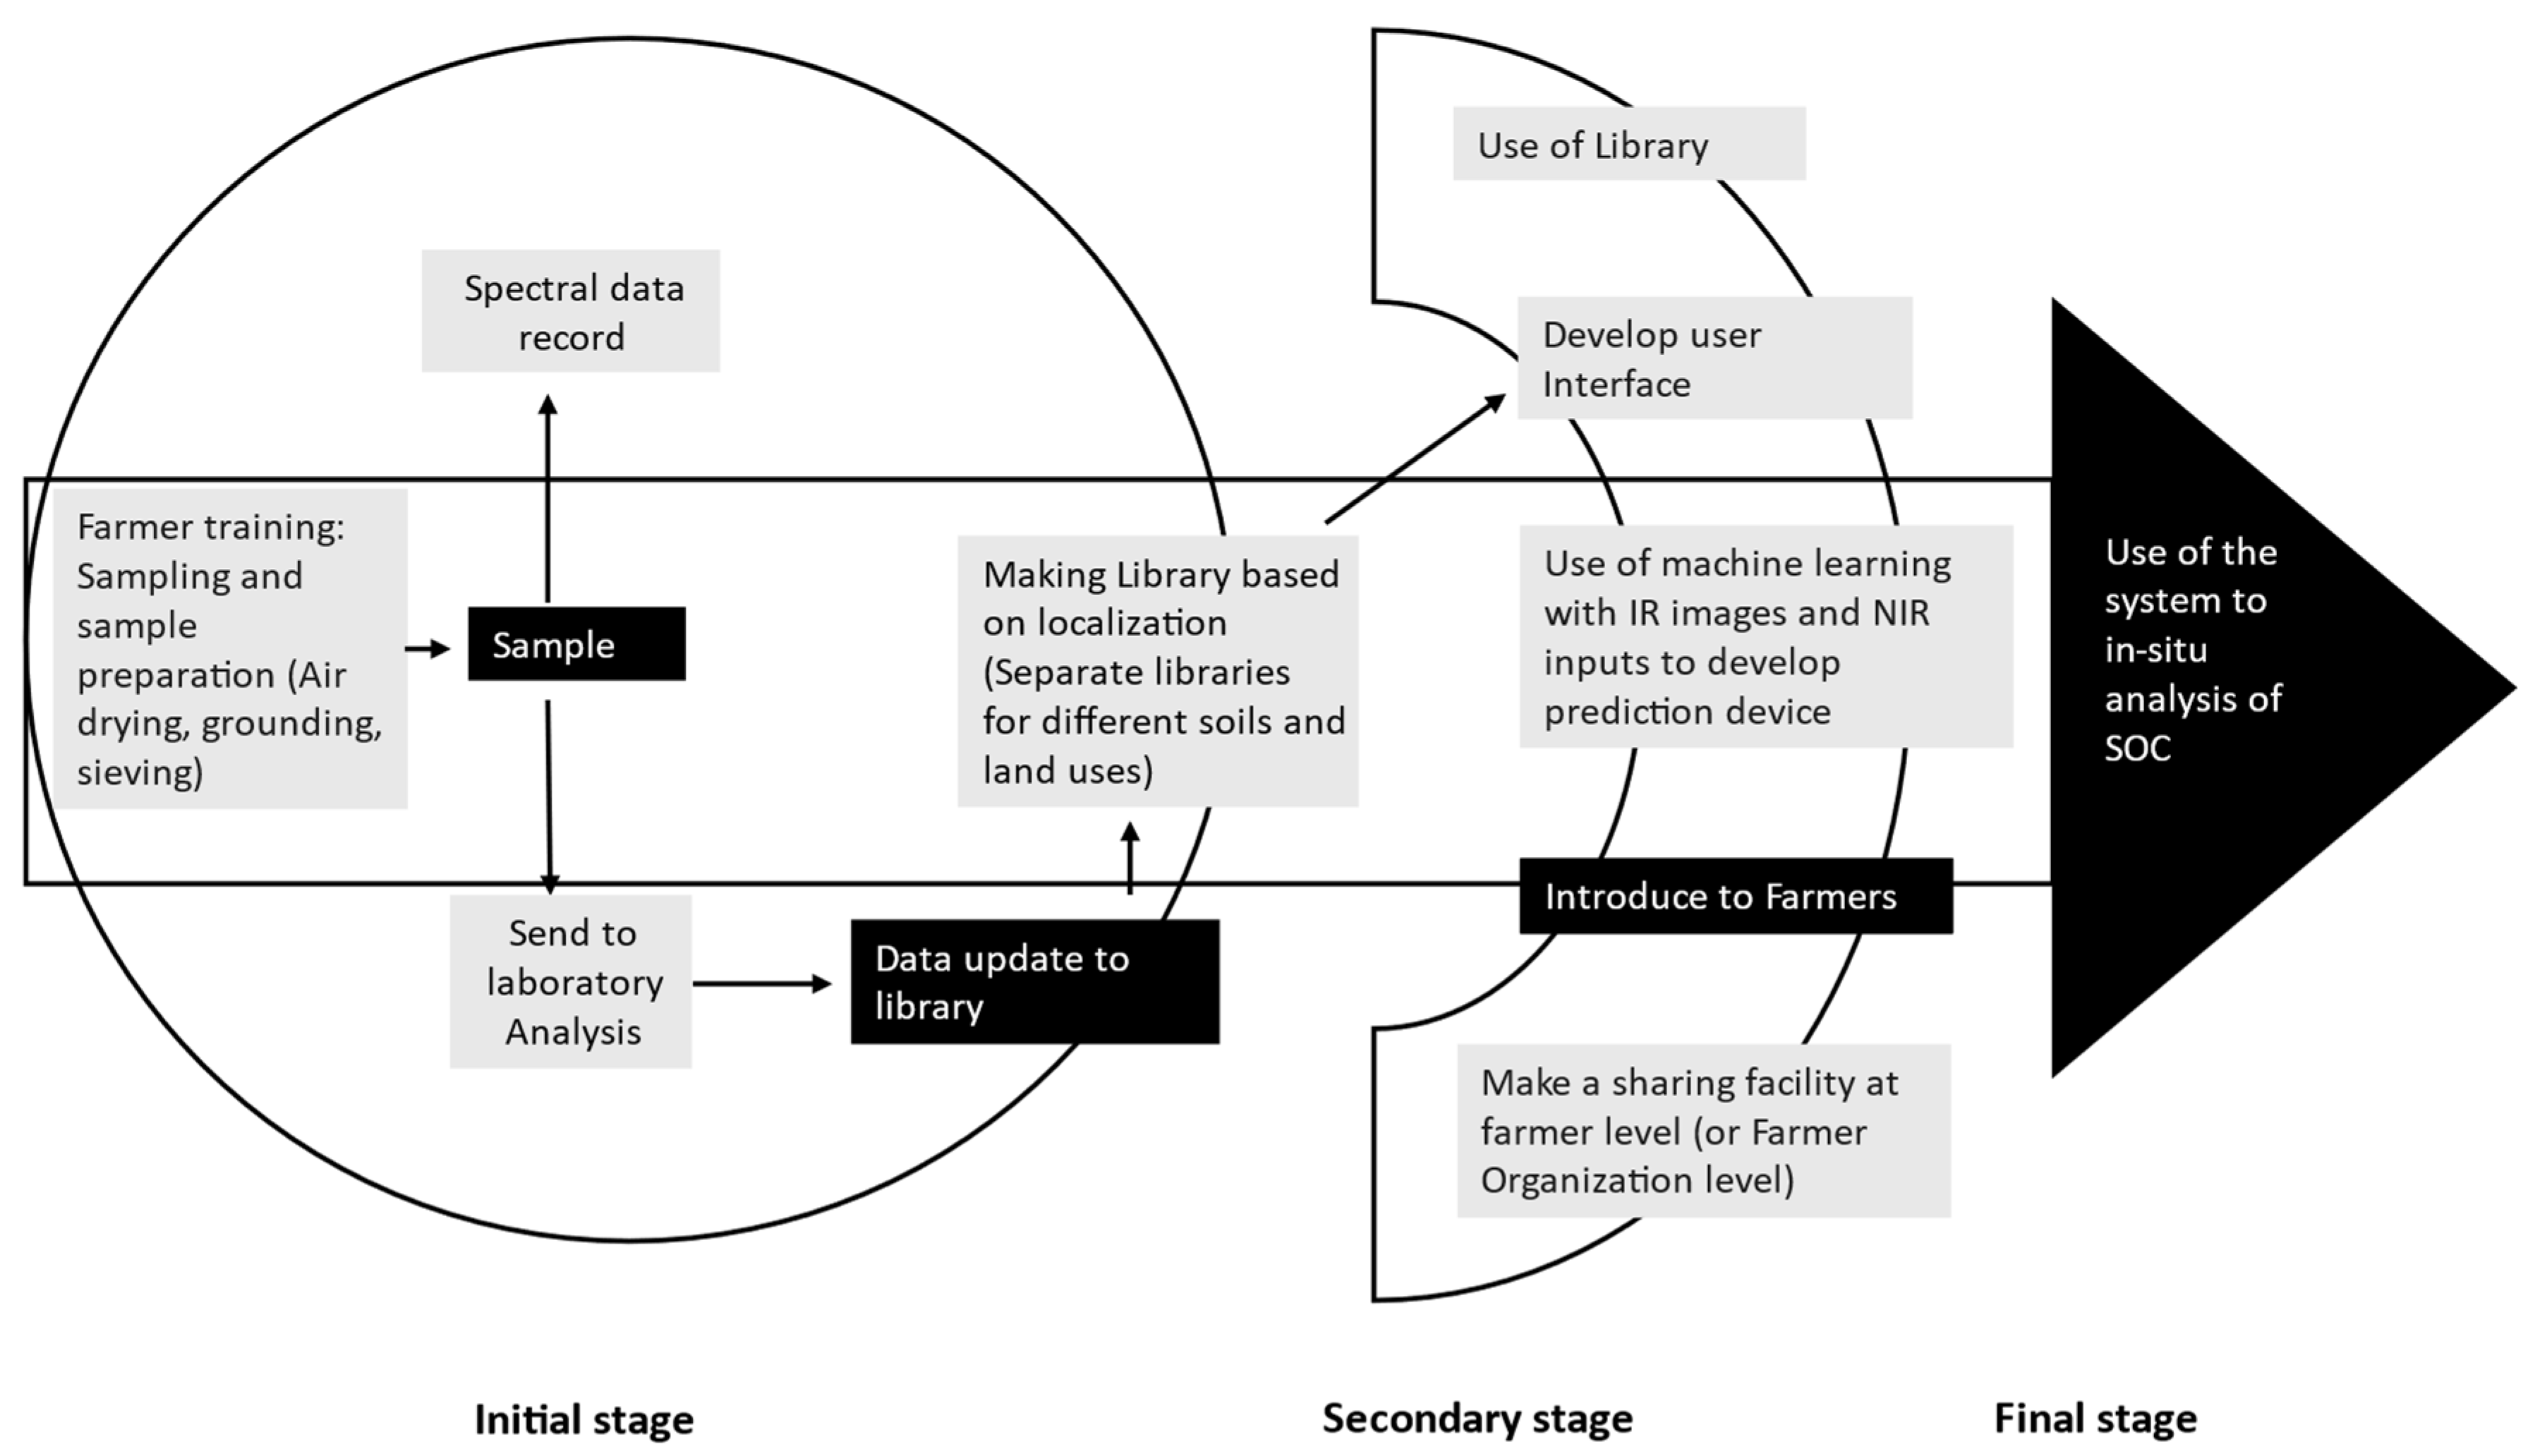
3.4. Integrated Image Processing-Based SOC Analysis
4. Discussion
4.1. Color-Based Models and Machine Learning
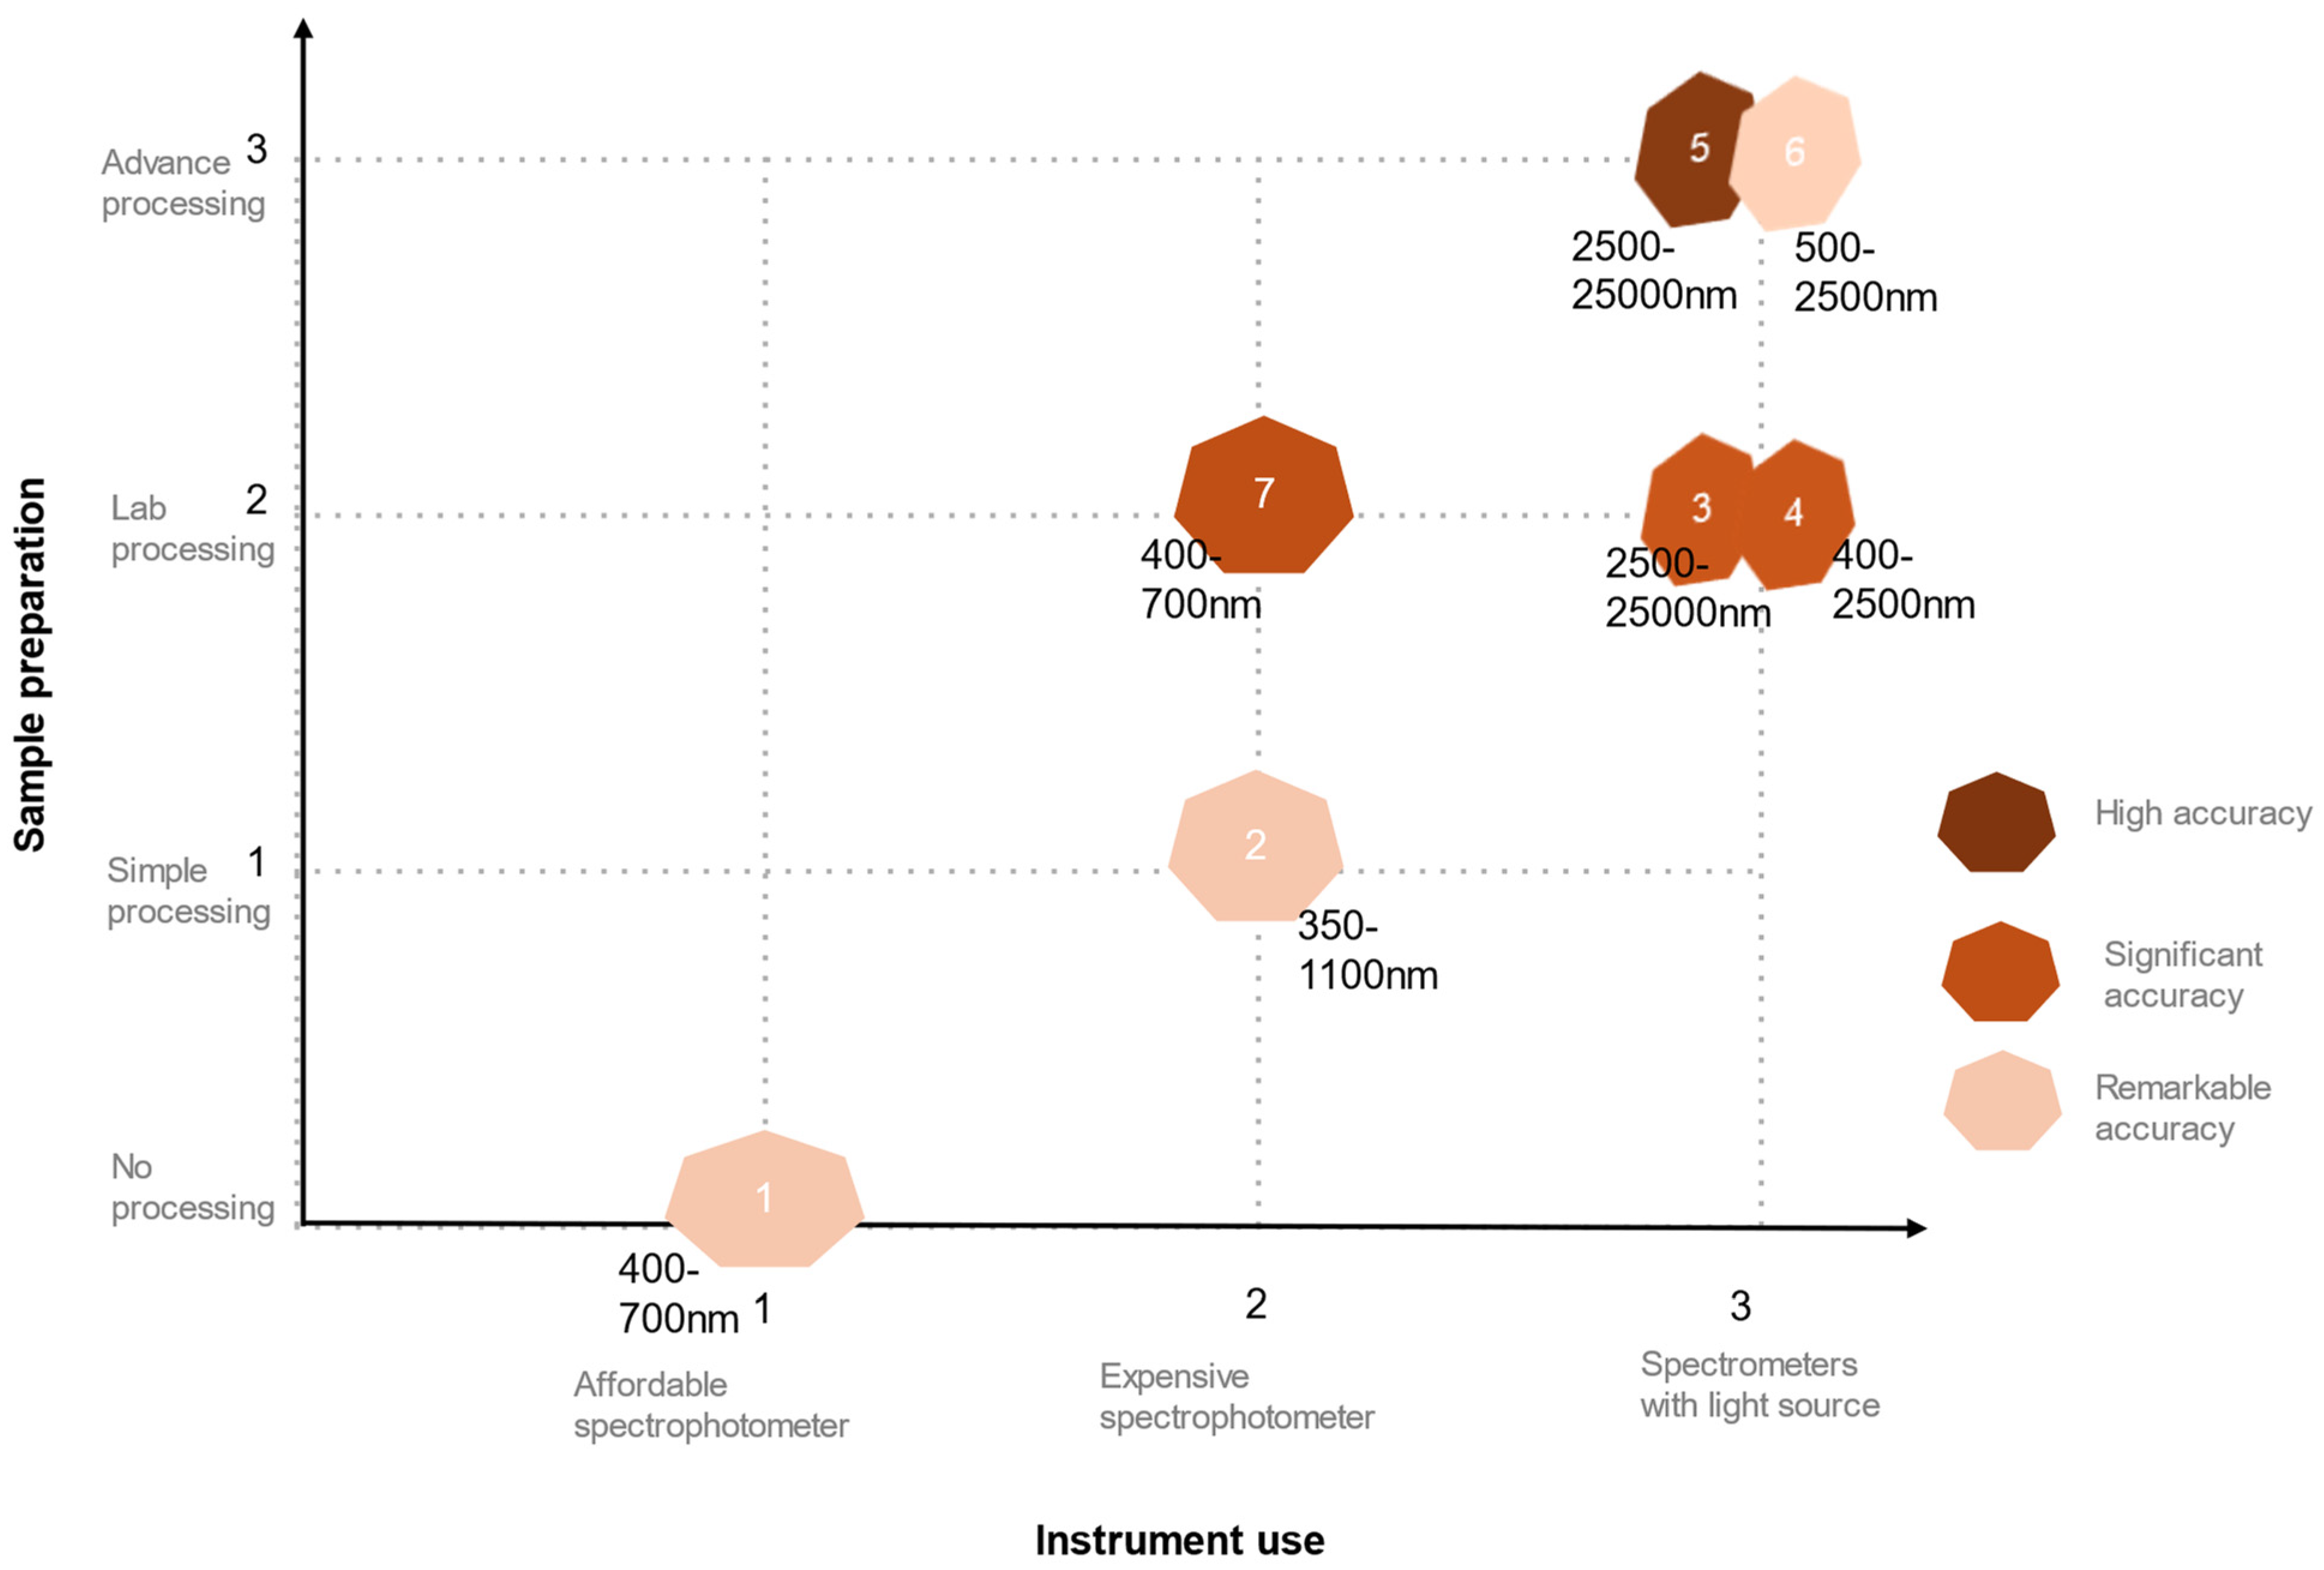
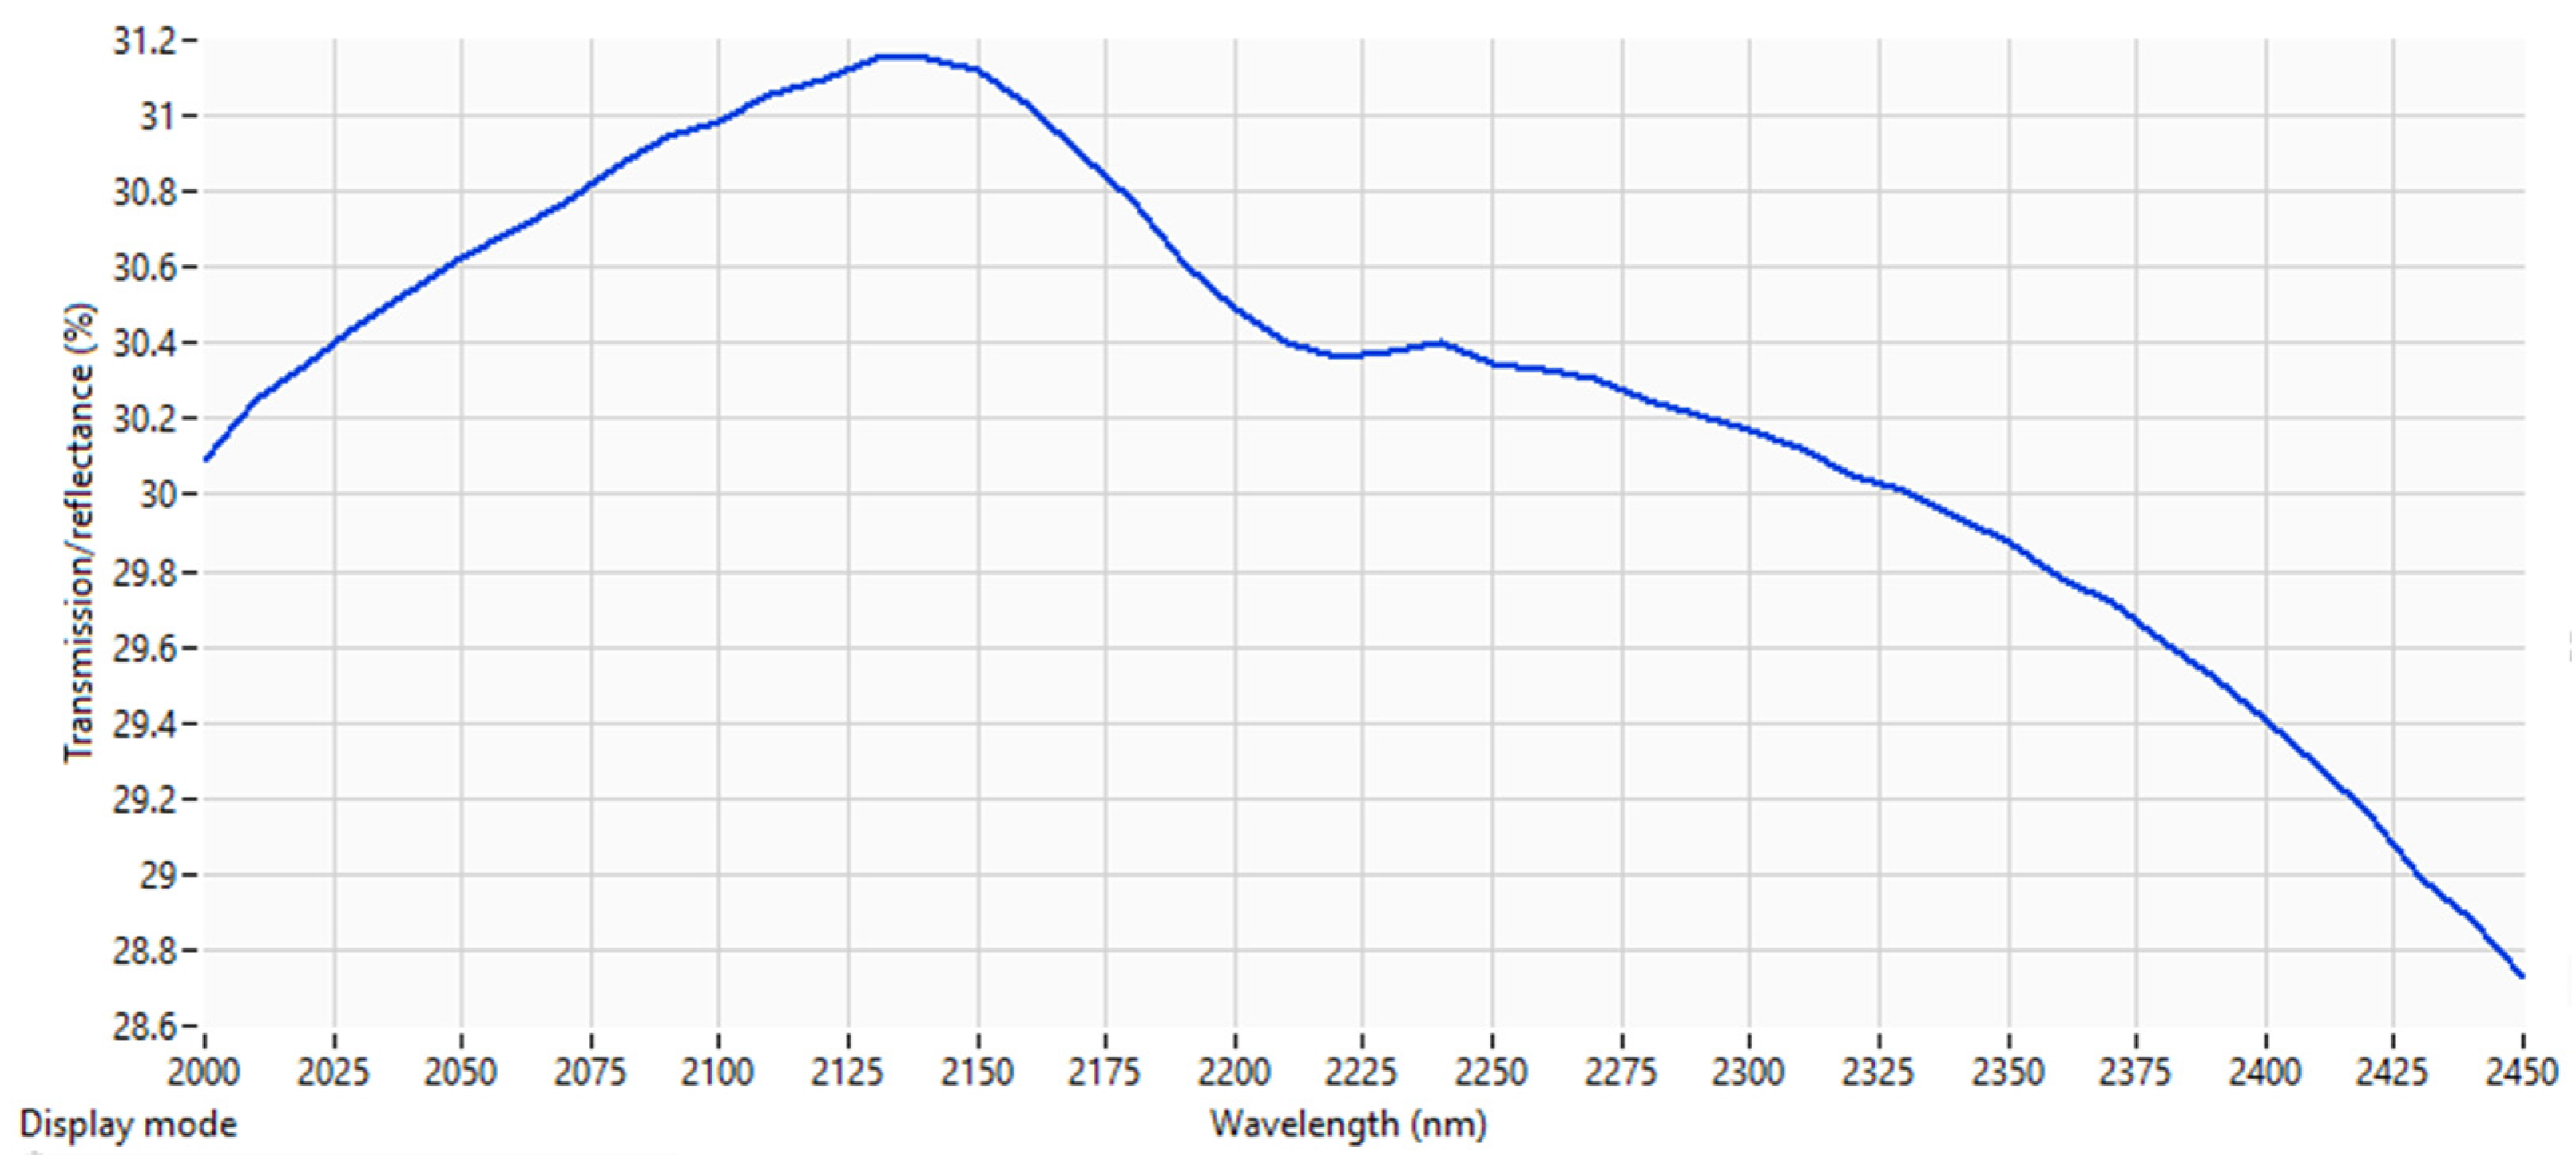
4.2. Spectroscopy
4.3. NIR-Based Image Analysis
4.4. Integration with Multiple Sensors
5. Conclusions
- With similar types of soil samples, analysis using color-based models is more accurate, and there are no universal equations for all types of soils.
- The information from spectroscopy data can be used in the process of SOC analysis, and the accuracy is higher around the 2000 to 2500 nm wavelength range.
- The accuracy of the color models can be increased using spectroscopic data. Inexpensive spectrophotometers can be used to record diffuse reflection data to develop an in situ SOC analysis method.
Author Contributions
Funding
Data Availability Statement
Acknowledgments
Conflicts of Interest
References
- Lal, R. Soil Carbon Sequestration Impacts on Global Climate Change and Food Security. Science 2004, 304, 1623–1627. [Google Scholar] [CrossRef]
- Batjes, N.H. Total carbon and nitrogen in the soils of the world. Eur. J. Soil Sci. 1996, 47, 151–163. [Google Scholar] [CrossRef]
- Batjes, N.H. Total carbon and nitrogen in the soils of the world. Eur. J. Soil Sci. 2014, 65, 10–21. [Google Scholar] [CrossRef]
- De Oliveira Morais, P.A.; de Souza, D.M.; Madari, B.E.; da Silva Soares, A.; de Oliveira, A.E. Using image analysis to estimate the soil organic carbon content. Microchem. J. 2019, 147, 775–781. [Google Scholar] [CrossRef]
- Silvero, N.E.Q.; Dematte, J.A.M.; Minasny, B.; Rosin, N.A.; Nascimento, J.G.; Albarracin, H.S.R.; Bellinaso, H.; Gomez, A.M.R. Sensing technologies for characterizing and monitoring soil functions: A review. Adv. Agron. 2023, 177, 125–168. [Google Scholar] [CrossRef]
- Chenu, C.; Angers, D.A.; Barré, P.; Derrien, D.; Arrouays, D.; Balesdent, J. Increasing organic stocks in agricultural soils: Knowledge gaps and potential innovations. Soil Tillage Res. 2019, 188, 41–52. [Google Scholar] [CrossRef]
- Food and Agriculture Organization for United Nations (FAO). Standard Operating Procedure for Soil Organic Carbon; Global Soil Laboratory Network (GLOSOLAN); FAO: Rome, Italy, 2019; Available online: https://openknowledge.fao.org/server/api/core/bitstreams/e498d73e-1711-4d18-9183-aa8476387e2c/content (accessed on 4 June 2024).
- Patrick, M.; Tenywa, J.S.; Ebanyat, P.; Tenywa, M.M.; Mubiru, D.N.; Basamba, T.A.; Leip, A. Soil Organic Carbon Thresholds and Nitrogen Management in Tropical Agroecosystems: Concepts and Prospects. J. Sustain. Dev. 2013, 6, 31–43. [Google Scholar] [CrossRef]
- Benslama, A.; Lucas, I.G.; Jordan Vidal, M.M.; Almendro-Candel, M.B.; Navarro-Pedreño, J. Carbon and Nitrogen Stocks in Topsoil under Different Land Use/Land Cover Types in the Southeast of Spain. AgriEngineering 2024, 6, 396–408. [Google Scholar] [CrossRef]
- Bationo, A.; Fening, J.O. Soil Organic Carbon and Proper Fertilizer Recommendation. In Improving the Profitability, Sustainability and Efficiency of Nutrients through Site Specific Fertilizer Recommendations in West Africa Agro-Ecosystems; Bationo, A., Ngaradoum, D., Youl, S., Lompo, F., Fening, J., Eds.; Springer: Cham, Switzerland, 2018; pp. 1–9. [Google Scholar] [CrossRef]
- Sun, Y.; Huang, S.; Yu, X.; Zhang, W. Stability and saturation of soil organic carbon in rice fields: Evidence from a long-term fertilization experiment in subtropical China. J. Soils Sediments 2013, 13, 1327–1334. [Google Scholar] [CrossRef]
- Lal, R. Enhancing crop yields in the developing countries through restoration of the soil organic carbon pool in agricultural lands. Land Degrad. Dev. 2006, 17, 197–209. [Google Scholar] [CrossRef]
- Ma, Y.; Woolf, D.; Fan, M.; Qiao, L.; Li, R.; Lehmann, J. Global crop production increases by soil organic carbon. Nat. Geosci. 2023, 16, 1159–1165. [Google Scholar] [CrossRef]
- Angelopoulou, T.; Tziolas, N.; Balafoutis, A.; Zalidis, G.; Bochtis, D. Remote sensing techniques for soil organic carbon estimation: A review. Remote Sens. 2019, 11, 676. [Google Scholar] [CrossRef]
- Konen, M.E.; Burras, C.L.; Sandor, J.A. Organic Carbon, Texture, and Quantitative Color Measurement Relationships for Cultivated Soils in North Central Iowa. Soil Sci. Soc. Am. J. 2003, 67, 1823–1830. [Google Scholar] [CrossRef]
- Schumacher, B.A. Methods for the Determination of Total Organic Carbon (TOC) in Soils and Sediments; Environment Protection Agency: Las Vegas, NV, USA, 2002; Available online: http://bcodata.whoi.edu/LaurentianGreatLakes_Chemistry/bs116.pdf (accessed on 15 June 2024).
- McCarty, G.W.; Reeves, J.B.; Reeves, V.B.; Follett, R.F.; Kimble, J.M. Mid-infrared and Near-Infrared Diffuse Reflectance Spectroscopy for Soil carbon measurement. Soil Sci. Soc. Am. J. 2002, 66, 640–646. [Google Scholar] [CrossRef]
- Goovaerts, P. Geostatistical modelling of uncertainty in soil science. Geoderma 2001, 103, 3–26. [Google Scholar] [CrossRef]
- Zhang, W.C.; Wan, H.S.; Zhou, M.H.; Wu, W.; Liu, H.B. Soil total and organic carbon mapping and uncertainty analysis using machine learning techniques. Ecol. Indic. 2022, 143, 109420. [Google Scholar] [CrossRef]
- Ibraheem, N.A.; Hasan, M.M.; Khan, R.Z.; Mishra, P.K. Understanding Color Models: A Review. ARPN J. Sci. Technol. 2012, 2, 265–275. [Google Scholar]
- Jorge, N.F.; Clark, J.; Cárdenas, M.L.; Geoghegan, H.; Shannon, V. Measuring soil color to estimate soil organic carbon using a large-scale citizen science-based approach. Sustainability 2021, 13, 11029. [Google Scholar] [CrossRef]
- Rossel, R.A.V.; Minasny, B.; Roudier, P.; McBratney, A.B. Color space models for soil science. Geoderma 2006, 133, 320–337. [Google Scholar] [CrossRef]
- Bellinaso, H.; Alexandre Melo Demattê, J.; Araújo Romeiro, S. Soil spectral library and its use in soil classification resumo: Biblioteca espectral e sua aplicação em classificação DE SOLOS. Soil Spectr. Libr. Its Use Soil Classif. 2010, 34, 862–870. [Google Scholar] [CrossRef]
- Barrett, L.R. Spectrophotometric color measurement in situ in well drained sandy soils. Geoderma 2002, 108, 49–77. [Google Scholar] [CrossRef]
- Rossel, R.A.V.; Walter, C. Assessment of two reflectance techniques for the quantification of the within-field spatial variability of soil organic carbon. In Precision Agriculture; Wageningen Academic: Wageningen, The Netherlands, 2003; pp. 697–703. [Google Scholar] [CrossRef]
- Baumann, K.; Schöning, I.; Schrumpf, M.; Ellerbrock, R.H.; Leinweber, P. Rapid assessment of soil organic matter: Soil color analysis and Fourier transform infrared spectroscopy. Geoderma 2016, 278, 49–57. [Google Scholar] [CrossRef]
- Nocita, M.; Stevens, A.; Toth, G.; Panagos, P.; van Wesemael, B.; Montanarella, L. Prediction of soil organic carbon content by diffuse reflectance spectroscopy using a local partial least square regression approach. Soil Biol. Biochem. 2014, 68, 337–347. [Google Scholar] [CrossRef]
- Wight, J.P.; Ashworth, A.J.; Allen, F.L. Organic substrate, clay type, texture, and water influence on NIR carbon measurements. Geoderma 2016, 261, 36–43. [Google Scholar] [CrossRef]
- Kirchhoff, G.R. Radiative Transfer; California Institute for Technology: Pasadena, CA, USA, 1891; pp. 51–55. Available online: https://web.gps.caltech.edu/~mbrown/classes/ge108/week3/lec6.pdf (accessed on 5 May 2024).
- Mahesh, B. Machine Learning Algorithms—A Review. Int. J. Sci. Res. 2018, 9, 381–386. [Google Scholar] [CrossRef]
- Pratap, A.; Sardana, N. Machine learning-based image processing in materials science and engineering: A review. Mater. Today Proc. 2022, 62, 7341–7347. [Google Scholar] [CrossRef]
- Tang, K.; Dong, K.; Nicolai, C.J.; Li, Y.; Li, J.; Lou, S.; Qiu, C.W.; Raulet, D.H.; Yao, J.; Wu, J. Millikelvin-resolved ambient thermography. Sci. Adv. 2020, 6, e00680. [Google Scholar] [CrossRef] [PubMed]


| Methodology | Limitations of the Method | Advantages | Reference |
|---|---|---|---|
| Walkley Black | Analyzes only SOC; destructive method; produces toxic waste; requires analytical skills; requires access to laboratory instruments; takes 3 to 5 days to complete analysis; chloride, ferrous iron, and higher oxides of manganese can cause interference. | Analysis of all types of soil organic carbon. Higher accuracy. | [7,14,17] |
| Elemental analysis | Destructive method; high cost; requires analytical skills; requires access to laboratory instruments; takes 3 to 5 days to complete analysis. | Analysis of all types of soil carbon. Higher accuracy. | [14,17] |
| Methodology | Limitations of the Method | Advantages | Reference |
|---|---|---|---|
| Munsell soil color chart (MCC) |
| Useful to compare different soils with significant SOC changes. Useful in rapid in situ assessments. | [20,22] |
| Munsell soil color (Munsell HVC) model |
| Useful to compare SOC changes over time. Compatible freely available software can be used with smart devices. Have potential to avoid human error. | [20,22] |
| CIE color model |
| Useful to predict SOC in soils after calibration. When reflectance spectra are used to color designate the system, the accuracy is high. | [22] |
| RGB color model |
| Qualitative measurements with chronometer are possible. | [4] |
| Sample Type | Instrument Used | Wavelength Used | Key Findings | Reference |
|---|---|---|---|---|
| Minolta CM508d spectrometer Xenon light source | 400–700 nm with 10 nm increments (visible spectroscopy) | Better results compared to visual matching methods. Cannot isolate small soil features. | [24] |
| FieldSpec® Pro visible and near-infrared spectrometer | 350 nm to 1100 nm at 1.5 nm intervals (UV–visible spectroscopy) | CIE model performance is better than spectroscopy-based PLS regression model performance. | [25] |
| Konica Minolta chroma meter CR410 camera with a light conducting tube Bio-Rad FTS spectrometer | 2500–25,000 nm at 1 cm−1 resolution (4000–400 cm−1) | L* values and SOC are negatively correlated. Ground soils have higher correlation. Visible NIR region is better for soil with high SOC. | [26] |
| FOSS XDS Rapid Content Analyzer | 400–2500 nm with 0.5 nm increments | Reflectance and SOC content are negatively corelated. | [27] |
| MIR: DigiLab FTS-60 Fourier transform spectrometer. NIR: Fosss-NIR System Model 6500 | 2500–25,000 nm at 4 cm−1 resolution (4000–400 cm−1); 1100–2498 nm at 2 nm intervals. | Carbonate carbon influences the MIR and NIR spectra. MIR has a higher model fit. Acid-treated soils respond better than untreated ones. | [17] |
| Analytical Spectral Device (ASD Boulder) | 500–2500 nm | Significant accuracy. Cross-validated model. Requires powerful hardware and software. | [28] |
| Tristimulus colorimeter. Minolta CR310 chroma meter fitted with CR A33e glass light projection tube | 400 to 700 nm (visible spectroscopy) | Strong correlation with the Munsell value/chroma and reflectance. Soils with similar properties provide better correlation. | [15] |
Disclaimer/Publisher’s Note: The statements, opinions and data contained in all publications are solely those of the individual author(s) and contributor(s) and not of MDPI and/or the editor(s). MDPI and/or the editor(s) disclaim responsibility for any injury to people or property resulting from any ideas, methods, instructions or products referred to in the content. |
© 2024 by the authors. Licensee MDPI, Basel, Switzerland. This article is an open access article distributed under the terms and conditions of the Creative Commons Attribution (CC BY) license (https://creativecommons.org/licenses/by/4.0/).
Share and Cite
Senevirathne, N.S.L.; Ahamed, T. Rapid Analysis of Soil Organic Carbon in Agricultural Lands: Potential of Integrated Image Processing and Infrared Spectroscopy. AgriEngineering 2024, 6, 3001-3015. https://doi.org/10.3390/agriengineering6030172
Senevirathne NSL, Ahamed T. Rapid Analysis of Soil Organic Carbon in Agricultural Lands: Potential of Integrated Image Processing and Infrared Spectroscopy. AgriEngineering. 2024; 6(3):3001-3015. https://doi.org/10.3390/agriengineering6030172
Chicago/Turabian StyleSenevirathne, Nelundeniyage Sumuduni L., and Tofael Ahamed. 2024. "Rapid Analysis of Soil Organic Carbon in Agricultural Lands: Potential of Integrated Image Processing and Infrared Spectroscopy" AgriEngineering 6, no. 3: 3001-3015. https://doi.org/10.3390/agriengineering6030172
APA StyleSenevirathne, N. S. L., & Ahamed, T. (2024). Rapid Analysis of Soil Organic Carbon in Agricultural Lands: Potential of Integrated Image Processing and Infrared Spectroscopy. AgriEngineering, 6(3), 3001-3015. https://doi.org/10.3390/agriengineering6030172