Article

Agricultural Tire Test: Straw Cover Effect on Reducing Soil Compaction by Cargo Vehicles

by
Alberto Kazushi Nagaoka
1,*,
Aldir Carpes Marques Filho
2 and
Kléber Pereira Lanças
3
1
Rural Engineering Department, College of Agricultural Sciences, Santa Catarina Federal University—UFSC, Florianópolis 88034-001, SC, Brazil
2
Agricultural Engineering Department, Federal University of Lavras—UFLA, Lavras 37200-000, MG, Brazil
3
Rural Engineering and Agricultural Mechanization Department, College of Agricultural Sciences, São Paulo State University—UNESP, Botucatu 18610-034, SP, Brazil
*
Author to whom correspondence should be addressed.
AgriEngineering 2024, 6(3), 3016-3029; https://doi.org/10.3390/agriengineering6030173
Submission received: 22 July 2024 / Revised: 11 August 2024 / Accepted: 14 August 2024 / Published: 21 August 2024

Abstract

:
Agricultural cargo vehicles are responsible for applying severe soil pressures. However, the ground straw cover can attenuate the loads applied by wheels to the soil surface. This research evaluated the effect of three tires, p1—Radial Very Flex, p2—Radial Improved Flex, and a p3—Bias Ply tire, on three amounts of straw on the soil surface (0, 15, and 30 Mg ha−1). We adopted a completely randomized design (CRD) with a rigid surface for three replications for the total contact area and punctual area claws. The soil bin test verified the deformable surface, tread marks, and soil penetration resistance (SPR). The tire’s claw design determines its punctual contact area, and the construction model determines the total contact area. The contact area in the soil bin increased linearly due to a increase in straw covering, reducing sinkage; p2 to 30 Mg ha−1 straw shows the most significant contact area, p1 and p3 showed no difference. A straw increase from 0 to 30 Mg ha−1 increased the contact areas by 25.5, 38.0, and 20.0% for p1, p2, and p3, respectively. Compared to the rigid surface, the p1 and p3 contact areas in the soil bin increased 6.2, 6.8, and 7.8 times in bare soil, 15, and 30 Mg ha−1; for p2, this increase was up to 4.2, 4.5, and 5.9 times on the same surfaces. Keeping the straw on the soil improves its physical quality by reducing the SPR, so the straw has a buffer function in the wheel–soil relationship.

1. Introduction

Heavy agricultural machinery applies severe loads to the soil through its wheels and tires, so agricultural vehicle tires cause soil compaction and reduce crop performance. Compaction relocates soil particles, increasing soil density and reducing root development by decreasing the flow of water and nutrients to the plants. This process was intensified by the increasing weight of agricultural machinery [1], commonly equipped with pneumatic wheels.
Therefore, tires are present in several agricultural operations, augmenting transport vehicles during harvests and transporting inputs to agricultural areas. Depending on the tire contact area and the vehicle’s total mass, it can exert severe pressure on the soil. Agricultural machinery tires have features designed to optimize traction, self-cleaning, and load capacity in varied terrain conditions. Furthermore, they should have less soil impact and a high-grip terrain [1,2,3]. Zeng et al. [4] studied the tire’s effect on granular terrain, showing that tire design determines the tread mark contact area and the traction energy demand.
Agricultural vehicle tire models vary in their internal constructions. They have different deformation capacities and contact areas [5,6,7,8]. The studies relating to tire models and soils are essential to determine traction parameters, such as the study by El-Sayegh et al. [9], and the impact on the crop root development zone [10,11,12]; in addition, the studies can be utilized to permit estimates of rolling resistance and energy demand [13,14]. However, determining the tire–soil interaction characteristics is highly complex [15], mainly because it involves unpredictable soil deformation [16], and complicated control variables, such as the soil and tire dynamics [17,18]. Estimating tire effects in controlled tests can reduce experimental errors and improve results [19].
Gheshlaghi and Mardani [20] applied the Smoothed-Particle Hydrodynamics–Finite Element Analysis (SPH-FEA) technique to evaluate the impact of a tire on subsoil at different soil moistures. They correlated 0.97 with the proposed model and soil bin test conditions. Jjagwe et al. [21] estimated the tire–soil effect in controlled tests using rigid plates with a known tire contact area on the soil. However, modeling the machine–soil interaction requires testing mechanisms under standardized conditions. According to Zhao et al. [22], these modeling systems based on controlled tests can reduce the time and, consequently, the assessment costs. Phakdee and Suvanjumrat [23] built a tire testing unit to evaluate machine–soil interaction. They inferred that this equipment could contribute to decision-making on tire acquisition and promote better knowledge in soil compaction research.
Agricultural vehicle tire models are constantly improved, and technologies allow for greater machine field efficiency [24,25]. Controlled vehicle traffic can mitigate the compaction of agricultural areas [26]. Thus, new tire models with reduced contact widths have been developed for these applications. The tread mark area and tire depth can directly affect agricultural machinery’s energy demand [27].
According to Harris [28], flexible tires can increase the contact area with the ground. The Increased Flexion (IF) and Very High Flexion (VF) technologies in radial tires can support 20–40% larger vertical loads, respectively, compared to conventional standard tires at the same tire inflation pressure; these technologies are currently applied to heavy cargo and transshipment vehicles.
Loading and transshipment vehicles can damage soils’ physical structure, especially if they enter crops in high soil humidity [29]. In sugarcane farming, cargo transport vehicles have the most significant impact on the soil, so producers have adopted new tire models for cargo vehicles. Technologies that integrate modern and flexible tires are an applicable alternative to reduce the impact on the soil and increase the profitability of sugarcane fields.
Some crops leave residues on the soil or are grown under permanent straw cover. The surface straw effect on wheel movement and soil compaction mitigation still needs to be discovered. Maintaining straw cover on the ground can mitigate the machine–soil impact since straw cover expands the tire contact area and reduces the pressure applied to the soil [6]. The removal of straw from sugarcane crops’ surfaces affects the soil’s physical quality and reduces its productive capacity and fertility [30].
This study evaluated the three cargo tire models’ performance on different amounts of sugarcane straw in the soil under controlled test conditions with Bias Ply, Radial IF, and VF tires.

2. Materials and Methods

2.1. Site of Study

Controlled tests were conducted on agricultural vehicle cargo tires at the Agroforestry Machines and Tires Test (NEMPA) Faculty of Agricultural Sciences at São Paulo State University/Botucatu-SP, Brazil. These tests were conducted using a Fixed Tire Test Unit (FTTU) on rigid and deformable soil bin surfaces. The FTTU, designed with a central support and hydraulic drive, allows the wheelsets to be fixed to the axle. This design enables the application of controlled loads to the wheelsets on various surfaces (Figure 1).

2.2. Test Proceedings

Tire dimensions are shown as width, shape factor (height as % of the width), tire type (“R” if Radial or “-” if Bias Ply), and wheel size in inches. For example, a 445/50R22.5 tire is 445 mm wide, 50% of 445 in height (222.5 mm), radial construction (R), and wheel with 22.5 inches in diameter (571.5 mm). Three commercial tire models with applications in load cargo vehicles were evaluated: p1—Radial Very Flex (445/50R22.5), p2—Radial Improved Flex (600/50R22.5), and p3—Bias Ply (600/50-22.5). The tires are commonly used in agricultural implements, cargo machines, and transshipment wagons pulled by tractors.
The tests were carried out on two types of surfaces: rigid (table) and deformable (soil bin). The tread mark characteristics on the rigid surface were assessed, including the contact areas for each tire model divided into total and punctual areas (claws). The response variables measured included the total contact area (m2), punctual area (m2), length (cm), and width (cm). The soil bin tests evaluated three surface conditions with different amounts of straw covering: 0, 15, and 30 Mg ha1 of straw on the soil (Figure 2).

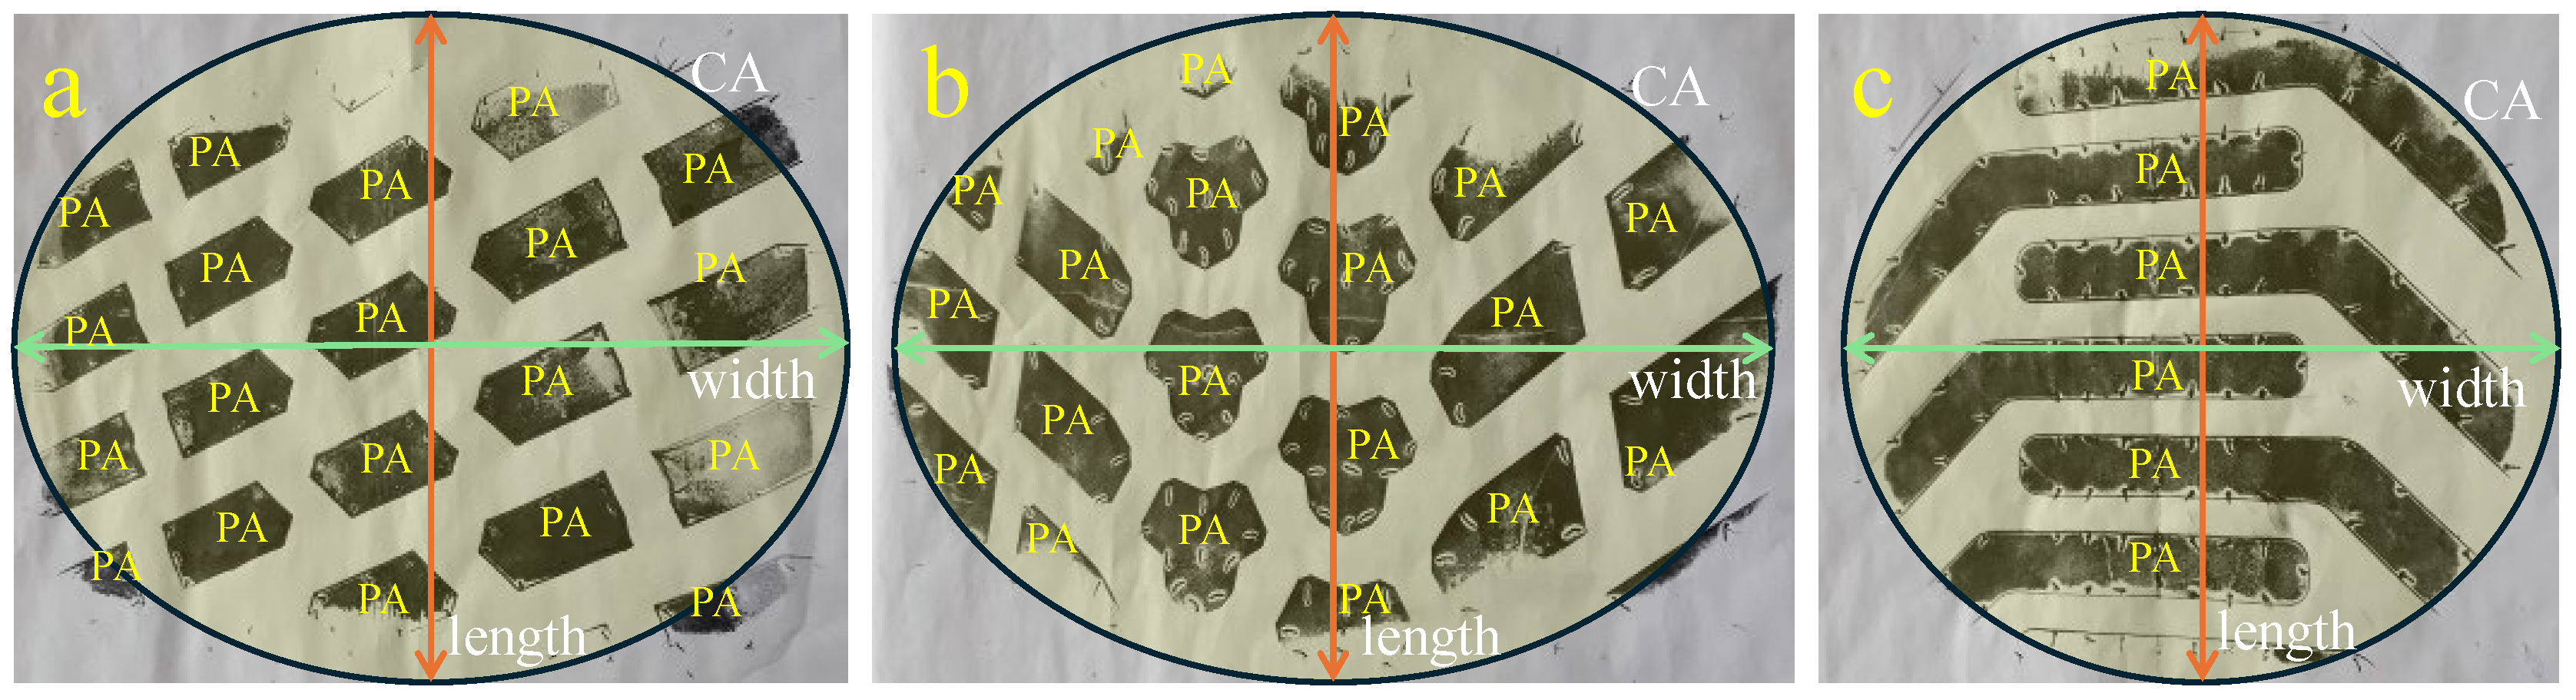
2.3. Details of Rigid Surface Test

The tire tread was previously coated with black paint for testing on a rigid surface. Subsequently, the tire was pressed onto a piece of white cardboard positioned on a 50 mm thick non-deformable steel surface (orange table) at FTTU. The tire pressure was adjusted to the internal inflation pressure recommended by the Latin American Tire and Wheel Association [31] for the specified loads. With the axle and wheel stopped, the FTTU hydraulic system was activated progressively down the axle, applying an increasing load in the tire until it reached 50.5 kN (for 10 s). This load is selected according to the maximum individual load recommended for the tire models tested [31]. The 10 s time was chosen to represent a momentary load application, simulating a tire treading on agricultural soil. Afterward, the tire reverted to its initial position, and data were collected (Figure 3).
The punctual areas were obtained by scanning using Surfer v.18 software. For each treatment (tires), mosaics with a known scale were created by a color filter; the software detected the black area and the paper’s white background. The punctual area was determined by the claw design of each tire model tested. The images obtained in the tests were always taken at the same height and angle of photography to reduce parallax effects.

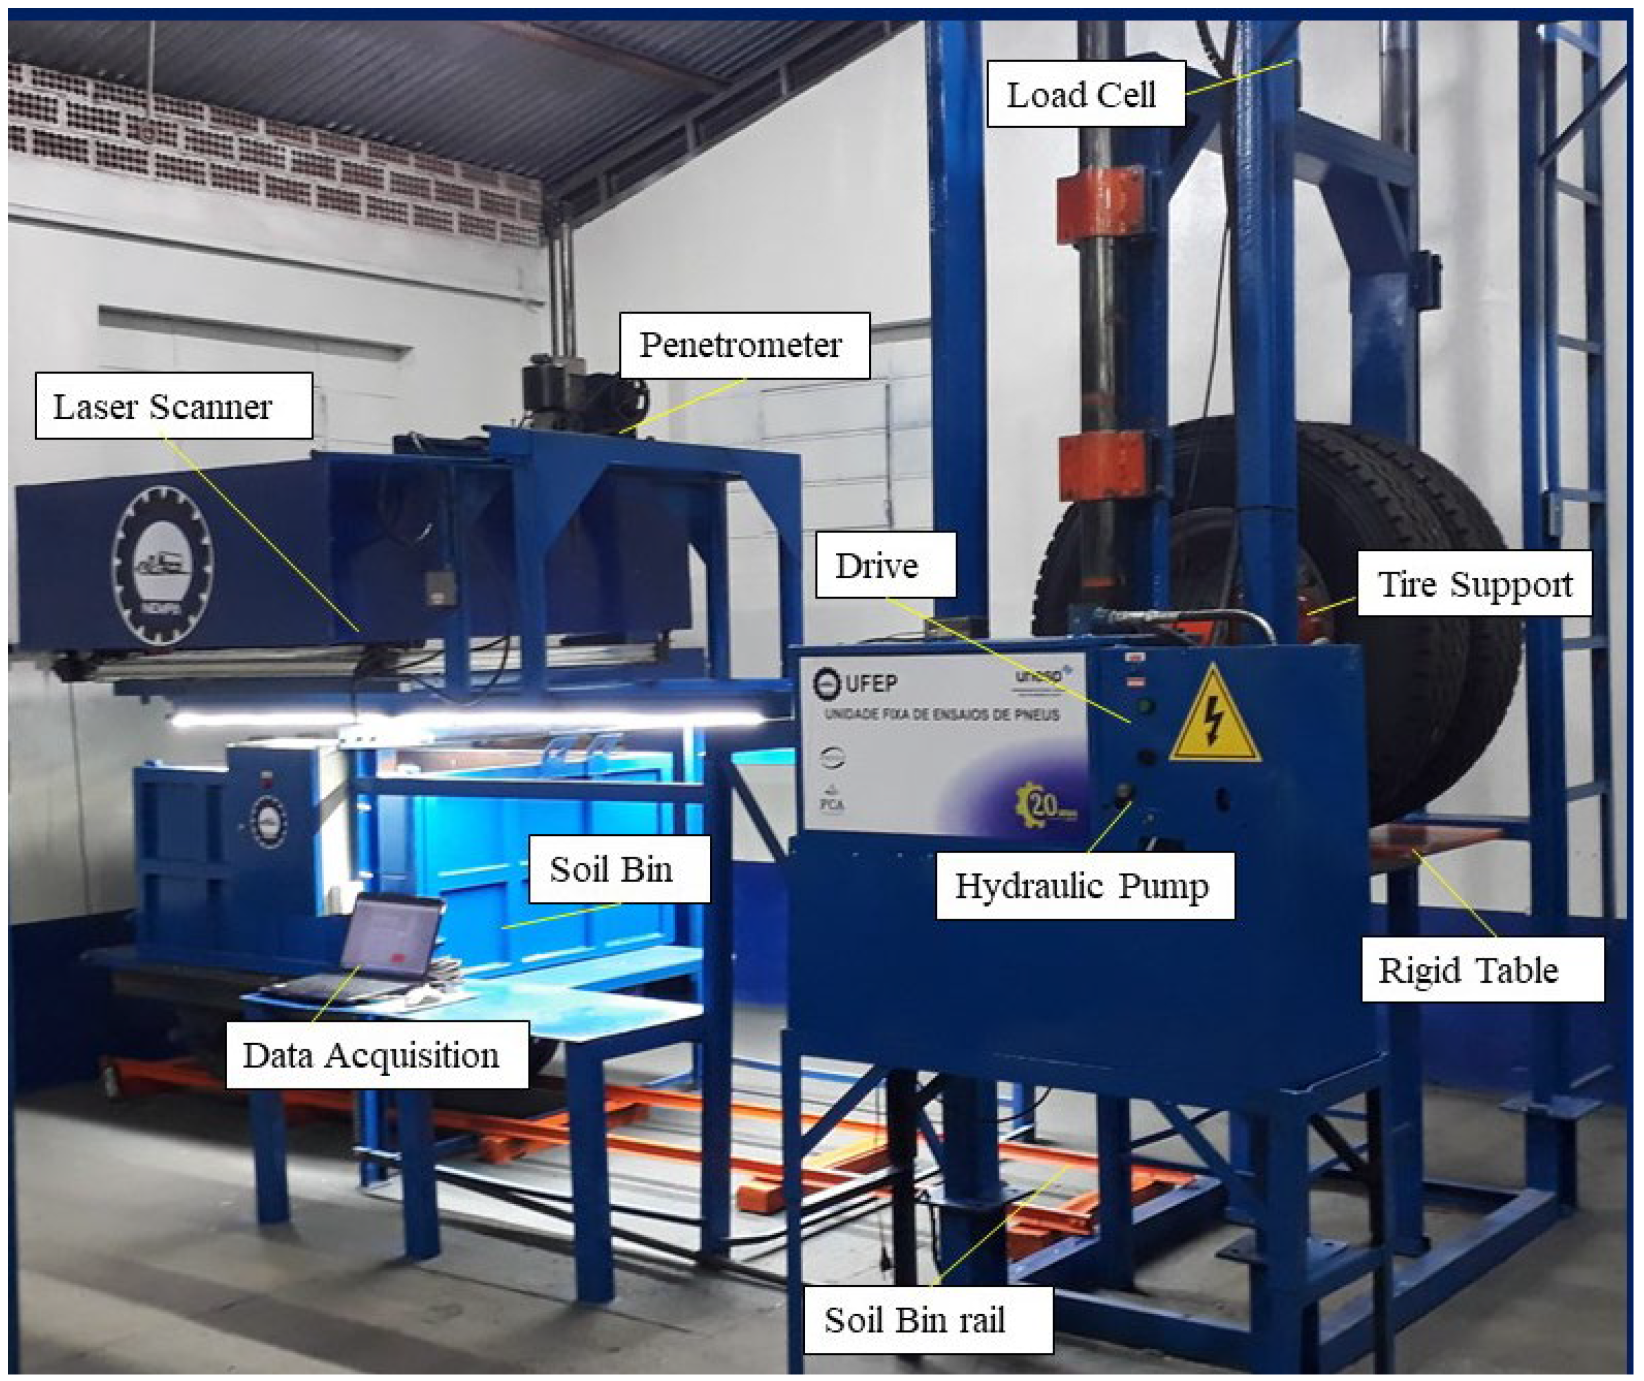
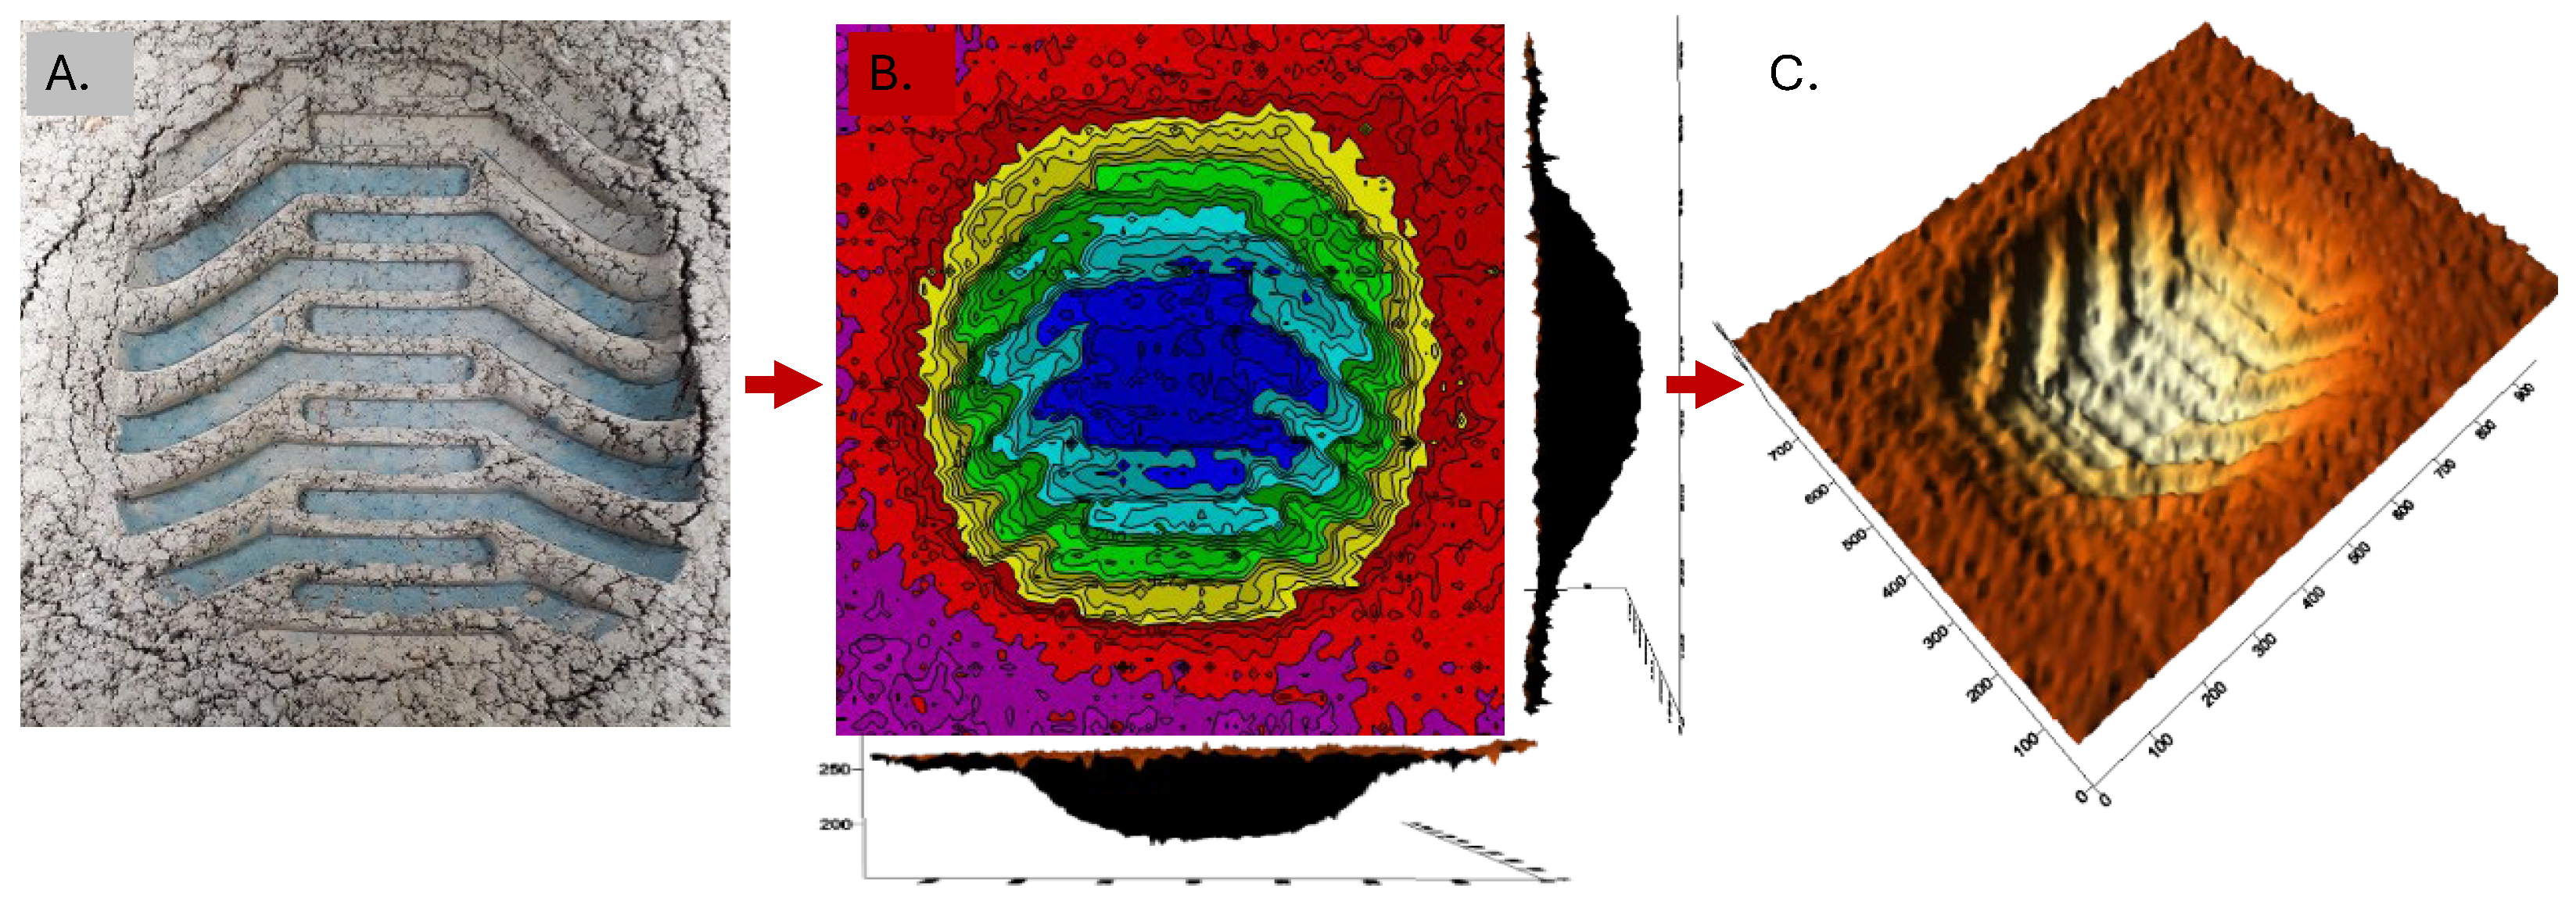
2.4. Details of Soil Bin Controlled Tests

During the standardized tire tests in a soil bin, a representative soil of the Brazilian cerrado was selected. This soil is important in the productive and economic scenario of sugarcane, soybeans, and corn crops. According to Santos et al. [32], the soil was classified as a red-yellow latosol and a Typic Hapludox (Oxisol) according to Soil Taxonomy [33]. The soil physical analysis showed that it is sandy, with 65% sand, 31% clay, and 4% silt.
Then, we determined the available water capacity based on the water content at the field capacity and the water content at the permanent wilting point, with the water content at the field capacity determined by the −10 kPa soil matrix tension. The soil bin was then filled with a controlled water content of 0.20 m3 m−3, the recommended time for agricultural operations and machinery [34]. The bulk density in the standardized tank preparation was 1.59 ± 0.02 g cm3.
During the deformable surface tests, we imposed wheelset loads on a soil sample within a rigid soil bin measuring 1.03 m in width, 1.30 m in length, and 0.60 m in height, situated at the FTTU. The soil sample was standardized and assembled into the bins in five layers, each with a pre-homogenized water content of 0.20 ± 0.01 m3 m−3; this water content was selected based on its approximation to the Oxisol friability point in the sugarcane crop [34]. Subsequently, the soil was passed through a 10 mm sieve with two meshes. This resulted in a total of 0.2 Mg of soil sample per layer, across five layers, each with a controlled density. The samples were compacted in the soil bin by applying loads to each standardized soil layer. After the soil was sieved, passes with a compacting roller were carried out until the soil sample reached the desired density. The initial density was measured by the height of the compacted soil layer; thus, using the tank area and mass of soil inserted, the soil bin apparent density (Mg m−3) was obtained. At each test stage, samples in undisturbed rings were collected to estimate density using the laboratorial method [35].
After assembling the soil bin tanks, different amounts of straw cover were applied to the surface. The covering straws were arranged evenly over the soil. We used sugarcane straw of 0, 15, and 30 Mg ha1, simulating farming conditions with the total suppression or collection of straw for industrial use (0 Mg ha1); a crop with a partial collection of straw and maintenance of 15 Mg ha1 on the soil and, finally, a crop with a full straw cover maintenance of 30 Mg ha1. The sugarcane straw was used for the tested tires’ importance in being applied to this crop, especially during harvesting, when heavy transport wagon vehicles enter the field and travel over the crop.
After assembling the tanks, the cover was placed on the surface and after the loads were applied to the FTTU, the straw was meticulously removed, so as not to harm the tread mark collection data. A soft brush removed small straw residues from the soil bin surface. The FTTU hydraulic system was activated to lower the tire at a constant speed, applying an increasing and controlled load until it reached 50.5 kN for 10 s and then returned to the starting position. This load is selected according to the maximum individual load recommended for the tire models tested [31].
The response variables obtained through digital scanning and FTTU electromechanical penetrometer were the total contact area and soil penetration resistance (SPR) in each surface condition. A laser scanner system from FTTU was applied to the soil bin to obtain the total contact area. Later, the data were transferred to the Golden Surfer v.18 software, where the isoline maps were generated in each sample soil bin (Figure 4). The maps are average representations of 27 standardized soil bins, interpolated via kriging by the Surfer v.18 software.
Soil compaction assessments for each treatment were obtained using an electromechanical penetrometer in FTTU. The SPR was obtained at five different points within the tread mark of the soil bin in each surface condition: 0, 15, and 30 Mg ha−1 of straw, with a collection system developed in a Labview environment, v.2016 (National Instruments). The SPR results were interpolated into cone-index graphs for each tire model and surface condition.

2.5. Statistical Analysis

In the soil bin tests, a completely randomized design (CRD) was applied. This involved 3 contact surfaces, 3 tire models, and 3 replicates. Similarly, a CRD was adopted for the rigid surface tests, which consisted of 3 treatments applied to 3 different tire types. The tread mark characteristics were compared between the tires relating to contact areas, length, and width by comparing means, normality test, variance, and Tukey at 5% probability. Test results were submitted to Shapiro–Wilk normality tests; Bartlett and Levene’s test of homogeneity of variance; analysis of variance (ANOVA) and, when applicable, Tukey’s test at 5% probability.
The resistance to soil penetration and contact areas results on different amounts of straw on the soil were subjected to linear regression tests to determine the data’s predictive equations and trend lines. All analyses were developed using the statistical system R software version 4.2.2.

3. Results and Discussion

3.1. Rigid Surface Test

The largest areas were obtained for the p2 radial model (0.117 m2). This tire has the largest widths (0.543 m) and contact lengths (0.430 m) among the models evaluated, which increased its total area on a rigid surface (Table 1). The p2 tire showed a width equivalent to 90% of its original construction width on a rigid surface. The internal tire pressures and the load applied directly affect the interaction tread mark area [7].
Radial tires showed the most significant percentages of the factory width (Table 1), showing that their flexible construction affects the tire contact area. Tires p1 and p3 have similar contact areas, 0.069 and 0.070 m2, respectively. However, the p1 tire has a smaller factory width (0.44 m) than the p3, built with 0.60 m. Thus, while p1 can express 78.5% of its factory width, the p3 tire expresses only 65.8% of its original width on rigid surfaces; this indicates that the tires cannot touch their entire tread area on rigid surfaces, such as hard soil or dirt roads.
According to Silva et al. [19], high tire inflation pressures affect their contact area with the ground, increasing pressure on the ground. Reduced contact areas are undesirable in agriculture, as they can increase soil compaction in the wheel travel areas and the plant root growth zone.
Zeng et al. [4] inferred that tire grips are decisive for traction capacity and soil sinking, but the load on the wheels has discrete effects on these characteristics. Thus, knowing the tread mark in detail allows for the appropriate selection of tires for different agricultural applications and management. The punctual areas (claw areas) vary according to each tire model and the design of its tread area. Notably, p3 presented a statistical difference to p1 and p2; p1 and p3 showed punctual area percentages of 56.5 and 54.2%, respectively. Although tire p2 presented the largest contact area, it had the lowest punctual area index (Table 1).
Punctual areas (claws) are relevant in slightly deformable terrain and roads, as in these conditions, the point areas (claws) are truly responsible for traction and terrain application loads. The tire claw’s depth directly affects the tread mark’s depth and increases the soil’s apparent density [23].
New tire models focus on equalizing the relationships between claw contact areas and agricultural vehicle tire design. Zhang et al. [25] used bioengineering models to show relationships between claw shapes and increased friction with the ground surface.
Agricultural vehicle tires are designed for greater traction efficiency and to withstand work in severe clayey conditions, so they must be self-cleaning. The punctual areas directly affect these characteristics and determine the tires’ application in each crop condition [36,37].
In no-tillage areas, the soil surfaces show natural densification just below the straw decomposition area. These compacted layers prevent the tire claws from penetrating the ground, so the contact area is the same as the tire claws. In conditions of surface density, it is important to apply tires with a larger claw area to gain traction and reduce impact on the ground.
The contact length showed a significant difference between the three tire models (Table 1), with the highest value for p2 (0.430 m), followed by p3 (0.324 m) and p1 (0.256 m). Tire p1 has the shortest length among the models evaluated; this shows that the greatest deformation obtained in this Very Flex (VF) tire occurs fundamentally in the width contact. Tire p3 showed significant longitudinal deformation in terms of its total contact area. It can be inferred that p1 deforms in the width direction, p2 deforms in width and length, and p3 deforms primarily in the longitudinal direction. Larger total contact areas are recommended for attenuation and more homogeneous ground load distribution, following the findings by Farhadi et al. [2].
According to Mamkagh [38], varying the tires’ internal inflation pressure can change the tire–ground contact area interface. However, this ratio must obey certain limits to not damage the tire’s structure. The authors indicate that correct internal tire pressure and adequate soil moisture conditions improve mechanized operation efficiency.
Jjagwe et al. [21] studied the relationships between standardized plates of a tire contact patch with the soil bin to estimate traction performance. They obtained correlations consistent with existing predictive machine–ground interaction models. Our results on a rigid surface can support similar tests on cargo tires and their effects on crops.

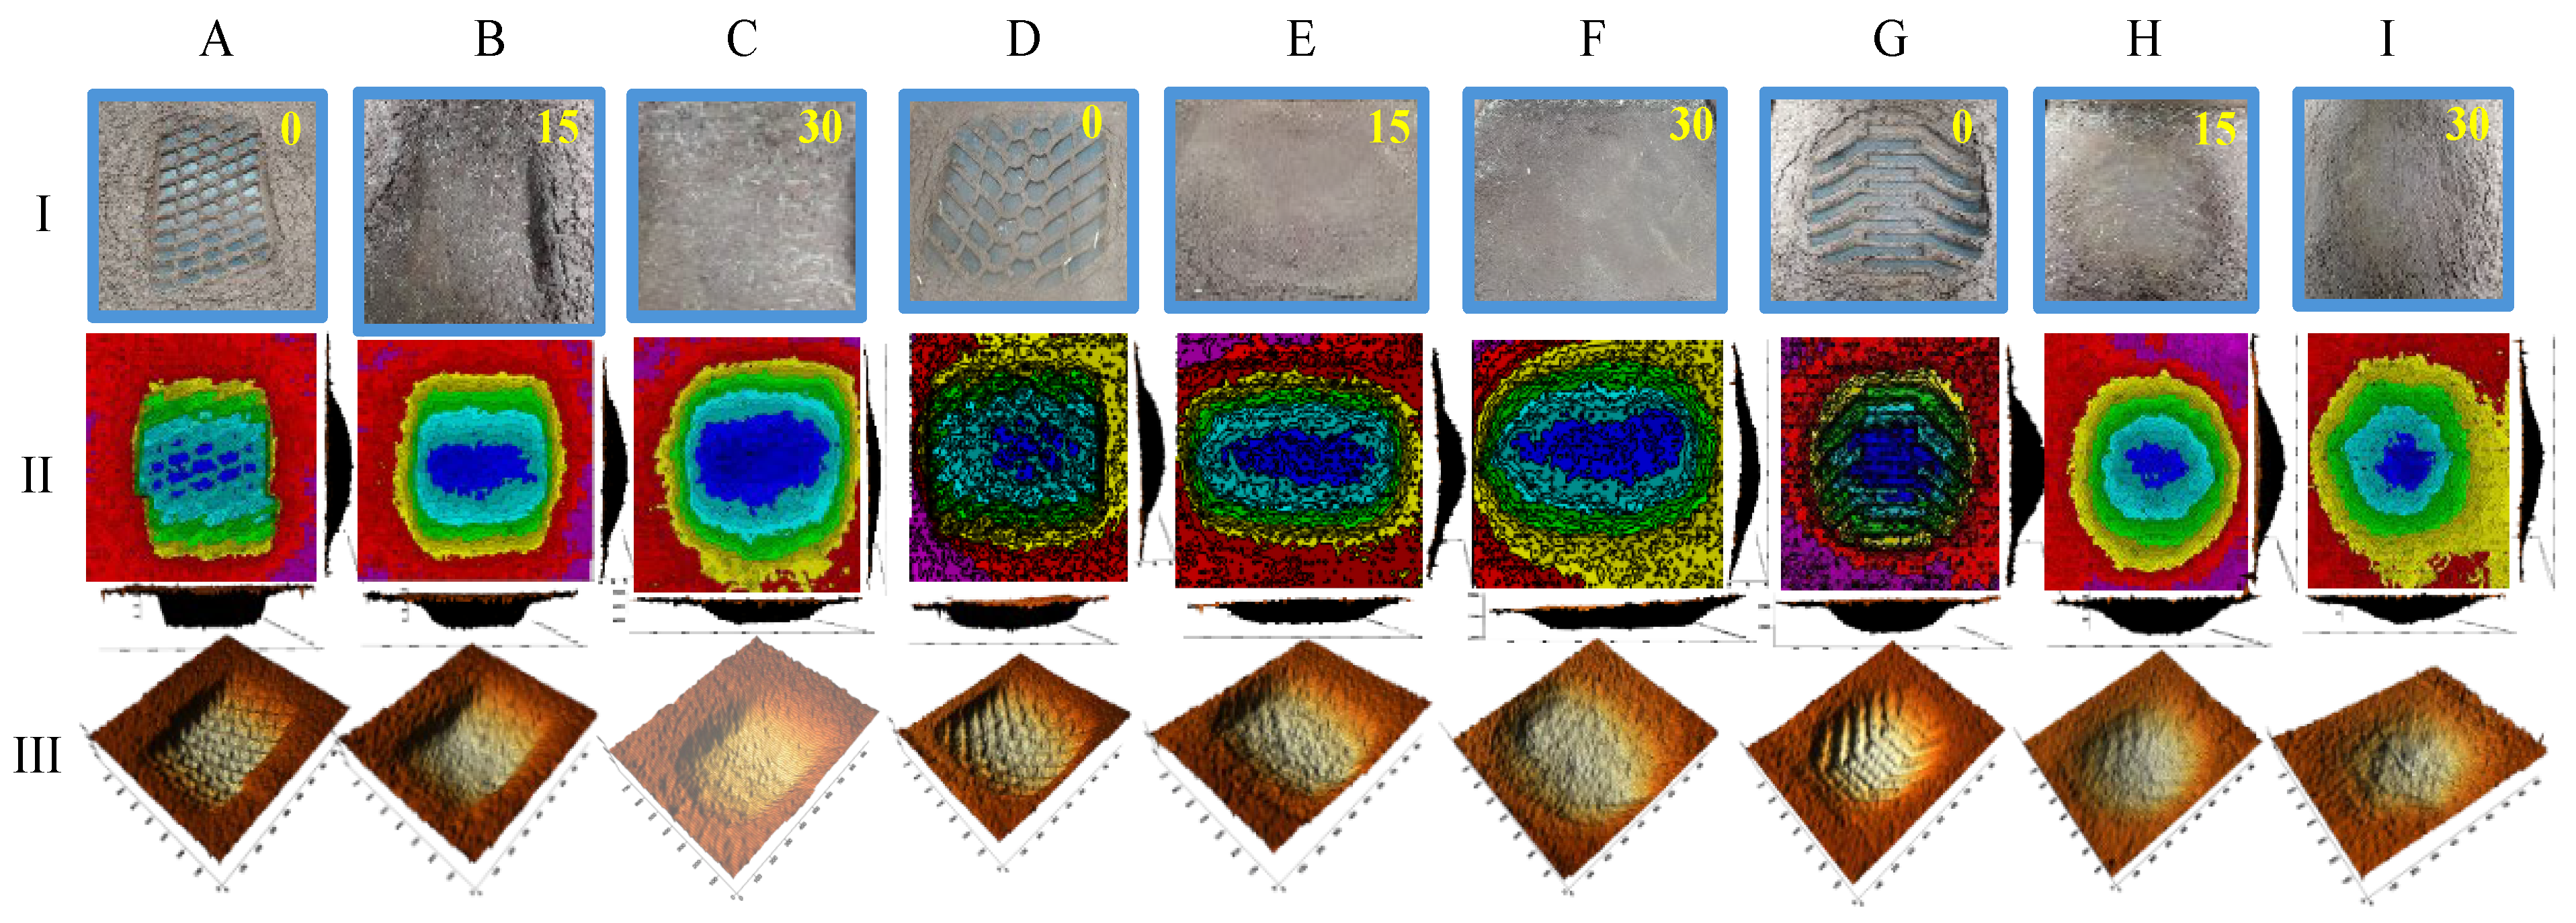
3.2. Deformable Surface Test

The Figure 5 matrix shows capital letters in the columns and Roman numerals in the rows. The images A-I represent the soil tank with the tire tread mark on bare soil; B-I show the same tread mark with 15 Mg ha−1, and B-II with 30 Mg ha−1 of the straw surface. Line II describes the scanned tire surface by FTTU in a color matrix of points ranging from purple to blue. In this scale, red and purple represent the highest surface areas; as the depth increases, yellow, green, light blue, and dark blue describe the tread mark depth. Digital scanning of the surface (Figure 5—Line II) was used to calculate the contact surface and the impact caused by each tire on the ground. Next to and below the images in Line II, the contact depth (black) for each tire on the longitudinal and transverse tread mark axes is observed.
Line III (Figure 5) demonstrates three-dimensional maps for each tire model and surface studied. Columns A, B, and C indicate p1 tread marks; D, E, F p2 and G, H, and I p3 tread marks with different soil bin coverage.
Adding straw to the soil surface increased the total contact areas and reduced the sinkage (depth). Our results support the findings of Farhadi et al. [27], where smaller tire–soil contact areas increase the applied pressure and the tread mark deformation depth. The presence of straw mitigates soil deformation by dissipating pressure over larger areas. This suggests that surface straw protects the soil and reduces the machine’s energy demand. Table 2 shows the soil-deformed area for each type of tire tread mark.
The largest contact areas were found for p2 (0.69 m2) with 30 Mg ha−1 of straw on the ground (Table 2). Tires p1 and p3 did not show a significant difference in the contact area with the ground. There was a 38% increase in the p2 contact area with the increase in the amount of straw on the soil from 0 to 30 Mg ha−1. Thus, tire p2 had a contact area of 0.50 m2 in bare soil, equivalent to the contact areas of p1 and p3 tires at 15 Mg ha−1. Therefore, soils with straw cover on the surface, even when subjected to heavy machine traffic, suffer mitigated load effects due to the attenuation provided by straw.
The tread mark length increased with the increase in straw on the soil surface. However, no statistical differences were found in length between the different tires. The greatest contact length was obtained in p3 (0.73 m) with a straw equivalent to 30 Mg ha−1 (Table 2). Marques Filho et al. [8] concluded that the relationship between the punctual area (claws) and the total tire area is relevant for applications on severe terrains, with the claw area tending to equal the total area on complex terrain (most rigid surface).
When the amount of straw on the surface increased, tire width increased for all tires (Table 2), but it differed significantly between tire models. The smallest contact widths were found for p1 on bare ground (0.48 m). The greatest contact width was obtained for p2 with a 30 Mg ha−1 straw cover. Tread mark depth also positively correlates with traction load [4]. Likewise, straw on the surface can affect tire-to-ground friction and wheel slippage. However, static tests present higher soil density and wheel impact values than dynamic tests [23].
Tire deformation, construction model, and the amount of straw cover affect the tire–soil contact area [10]. Different tire models can affect soils differently depending on the management adopted in the crops. Maintaining straw cover on the ground can have the same effect as using a tire with a large contact area. Tire p2 presented the lowest depth of soil deformation, 0.07 m, with 30 Mg ha−1 straw (Table 2). The bare soil shows the greatest deformation depths. The soil cover reduces the intensity of load soil application, dissipating loads in larger areas and reducing the total contact pressure.
Our results were obtained by applying a single load and tire inflation pressure. Further research should address the effect of these variables on soil deformation. El-Sayegh et al. [9] indicated in controlled tire tests that tread mark depth and contact area can vary depending on the applied tire load, soil water content, and tire inflation pressure.
When the contact area results are compared to a rigid surface (Table 1) and a deformable surface (Table 2), the contact area for p1 and p3 in bare soil increases by 6.2, 6.8, and 7.8 times in 0, 15, and 30 Mg ha−1, respectively. For the p2 tire, this increase in contact area was 4.2, 4.5, and 5.9 times as much in 0, 15, and 30 Mg ha−1, respectively. By providing a deeper understanding of soil deformation through indirect methods, our research findings can be crucial in advancing more accurate mathematical modeling research [17].
Correctly modeling the increase in the contact area to the amount of straw on the ground can provide new guidelines to encourage decisions about collecting this biomass from the field for reuse in industry. The sugarcane industry has recently used straw to generate energy in boilers or even produce second-generation ethanol [30]. Using linear regression, Figure 6 shows the relationship between the contact area and straw amount on the soil surface.
The largest contact areas were expressed by p2, followed by p1 and p3. The positive linear coefficients indicate high correlation coefficients for p1 and p3, with r2 = 0.94 and 0.91, respectively, confirming that the increase in straw cover linearly increases the contact area for these models. The tire p2 presented a correlation coefficient considered low, r2 = 0.65, with linear adjustment and a positive angular coefficient, confirming the increasing trend for straw and total contact area.
The increase in the contact area between tire and soil can be considered in mathematical modeling in research and can support decision-making in managing production units. Agriculture vehicle tires represent the considerable cost of mechanized agriculture. Furthermore, the results of this research allow us to infer that radial tires have less impact on the soil when compared to bias ply tires.
The results showed that even with smaller dimensions, the p1 tire presented an equivalent total and punctual contact area of a larger dimensions tire p2 (Table 2). This was possibly due to the “Very High Flexion” technology, where gains of up to 40% in the contact area can occur due to the tire’s high flexibility [28]. Tests with agricultural wheelsets allow us to define the parameters and applications of these technologies for new models with agricultural potential, such as the non-pneumatic wheelsets [24].
Controlled tests can provide information about new tire models under field conditions [8,22]. Mathematical and simulation models have been developed [12,13], and our research can provide support for feedback on computational models.
The SPR varied significantly between the tire models studied, indicating that each tire’s impact can affect the subsoil differently in intensity and depth. Figure 7 describes the cone index for different tire types and straw amounts on the soil surface. The highest SPR was obtained with bare soil, regardless of the tire type.
The highest SPR was shown at p3 in the bare soil condition (Figure 7C). Tires p1 and p2 presented similar cone indices (Figure 7A,B). However, p1 dissipated loads in depth, with the area of greatest resistance to soil penetration below a 0.3 m depth. Tire p2, in contrast, increased the resistance to soil penetration in the surface layers. This behavior can be validated by the bulb Boussinesq theory [39] and Soane et al. [40], where loads concentrated in smaller contact areas tend to dissipate greater pressures at depth. In contrast, high loads, dissipated in large contact areas, tend to dissipate load isolines laterally with a shallower reach depth.
Gheshlaghi and Mardani [20], obtained the highest stresses close to a 20 cm depth under test conditions for clayey soil, corroborating our findings. The SPR showed a more prominent effect between 15 and 25 cm for tires p1, p2, and p3. Contact length and tread mark depth are shown to be dependent variables and can be interchangeable in dynamic study equations between tire and soil [16].
The greater amounts of straw resulted in lower SPR (Figure 7), positively attenuating the wheelsets’ impact. This characteristic is highlighted when modeling straw quantity versus SPR (Figure 8).
Straw positively reduced soil resistance to penetration (Figure 8), promoting greater areas of contact with the soil and attenuating the machine’s pressures in traffic conditions. Soil compaction is among the main limiting factors for crop development and restricts root growth and nutrient and water absorption by the plant [1,41,42]. In our studies, the soil water content was 21%; this may have attenuated the resistance to soil penetration because of water particle lubrication. On deformable surfaces, water content is fundamental for determining soil compaction and its spatial distribution in crops [43].
There is a trend towards applying controlled traffic to annual crops such as soybeans and corn [44]. This alternative reduces the impact on soils and increases crop sustainability. New industrial tires are being tested [45]; however, low flexibility and high inflation pressure harm the soil structure. In addition to the straw surface, highly flexible agricultural tires can mitigate soil compaction and improve controlled traffic machinery.
Cutini et al. [36] stated the need to conduct soil tire deformation studies to feed predictive informational systems of dynamic field conditions. New tire models and load situations must be analyzed individually and directly for each new technology; thus, controlled tests become fundamental. New research needs to be carried out to determine the effect of other biomass straw types on mitigating the wheelset’s impact. This research promotes improvements in soil quality and increases global agricultural sustainability.

4. Conclusions

This research related the impact of different agricultural vehicle tires on rigid and deformable surfaces, with and without straw, to the wheel–soil interaction. The main conclusions of this research were:
  • The tire’s claw design determines its punctual contact area. However, the main tire design and construction model affect the total contact area.
  • The radial tires’ IF (p2) and VF (p1) technology established the largest total contact areas. Smaller modern tires with high flexibility technologies can prevent plant trampling and enable controlled traffic, reducing soil compaction.
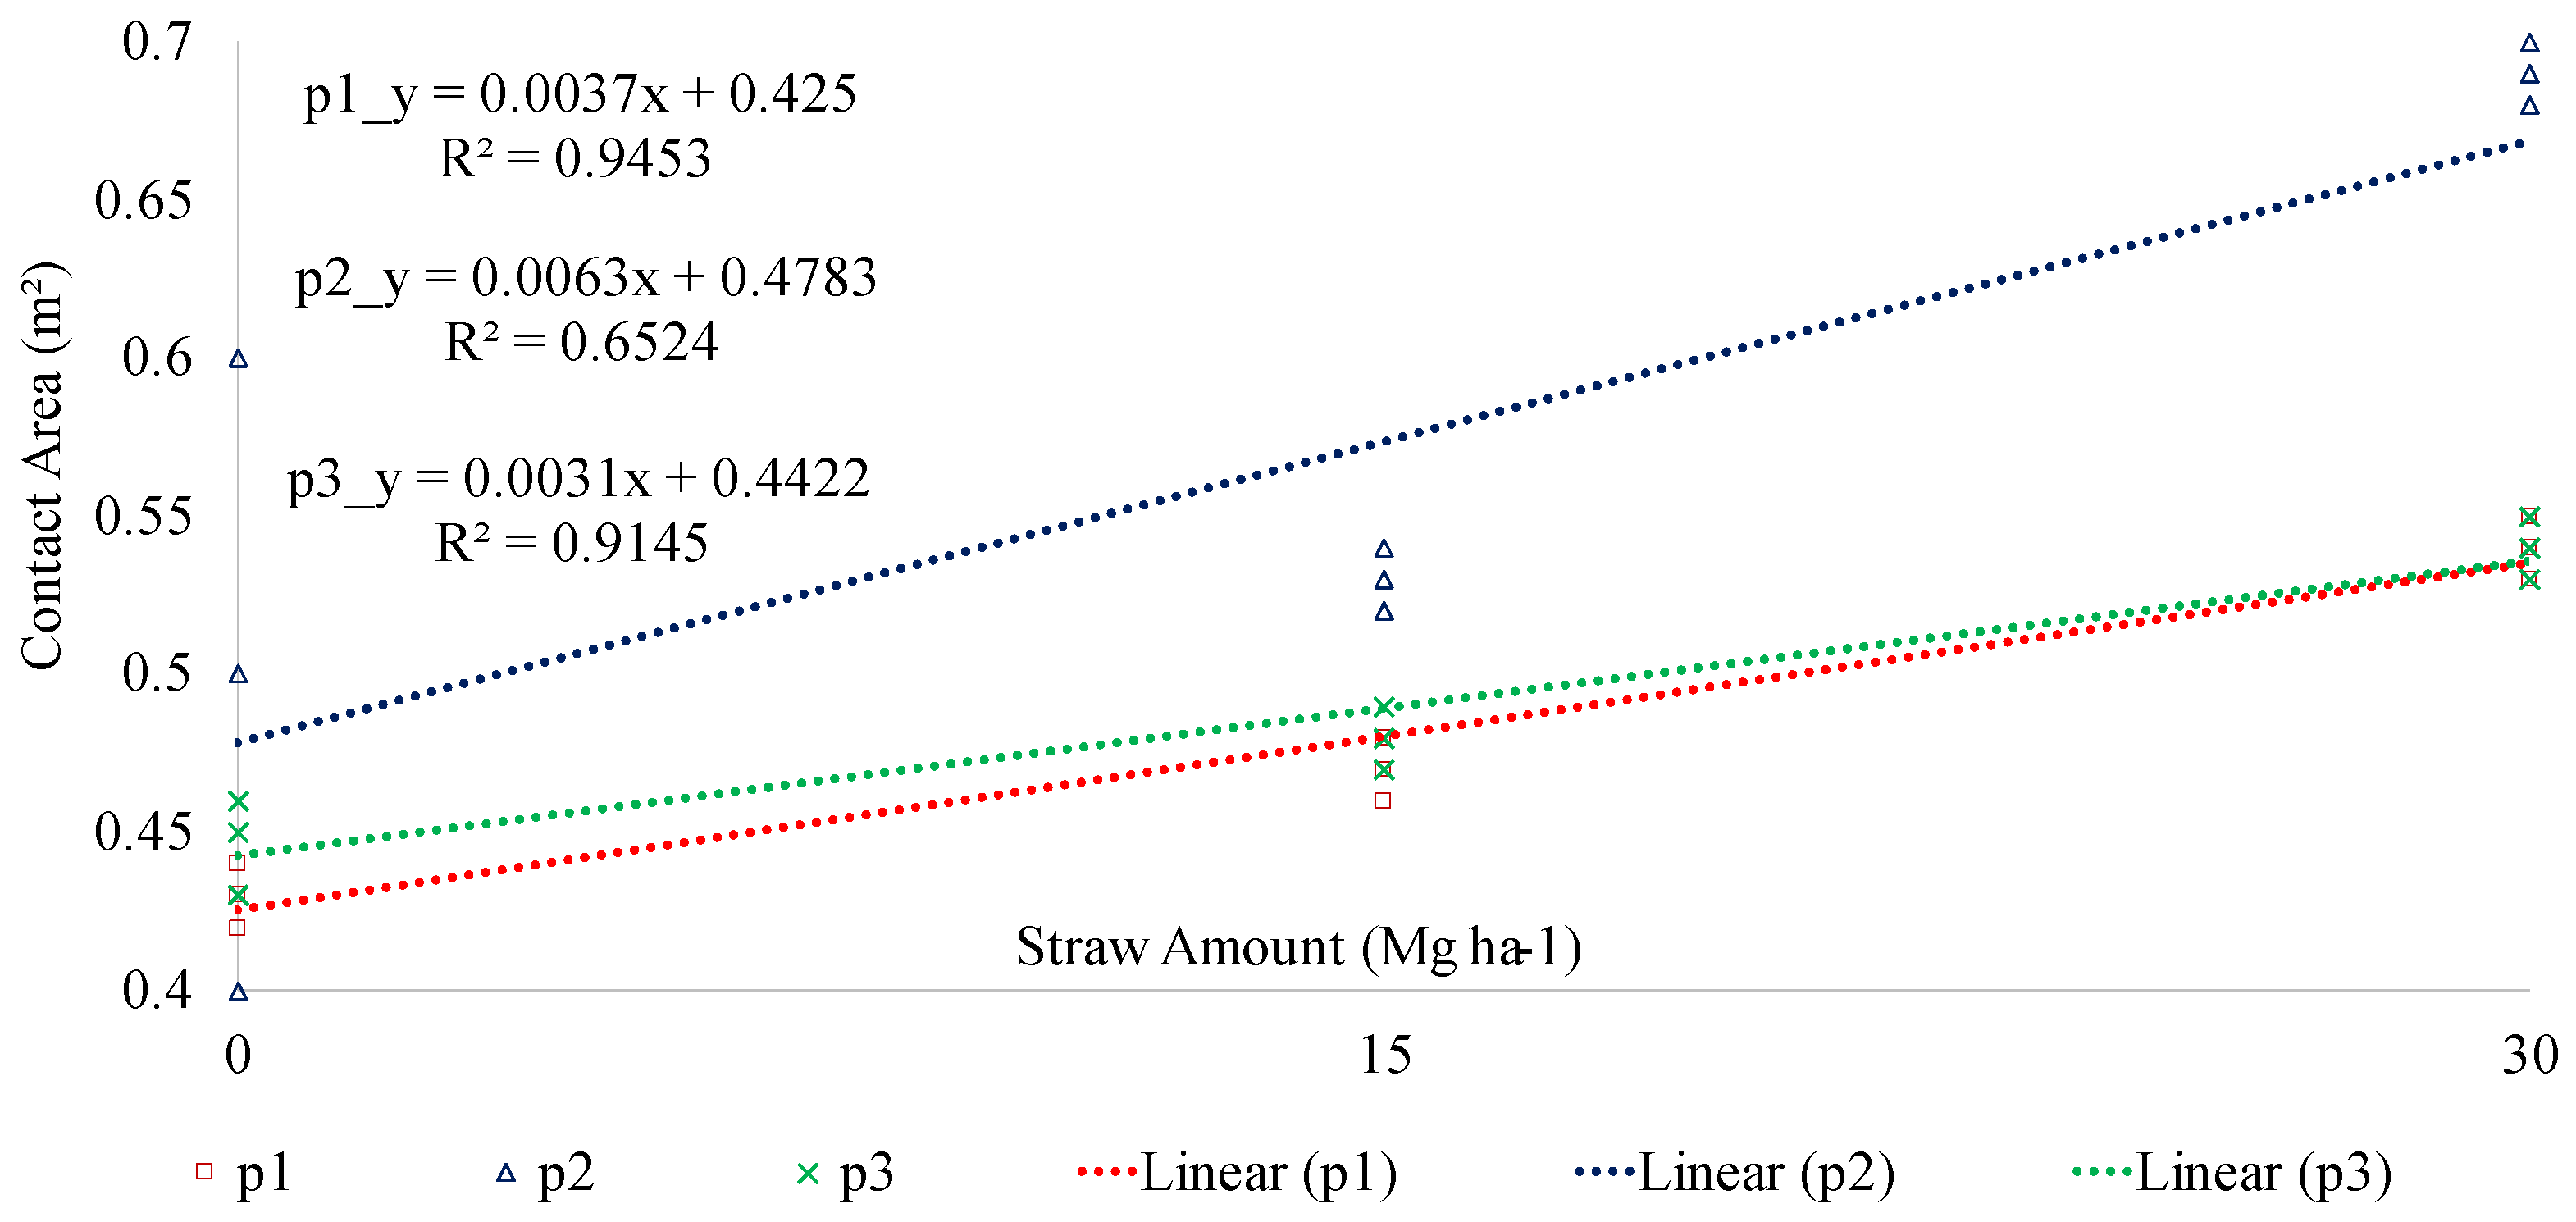
  • The contact area on the deformable surface (soil bin) increased linearly due to the increased straw covering, which reduced sinkage (tread mark depth). The largest contact areas were found in p2 to 30 Mg ha−1 straw.
  • The increase in straw soil surface from 0 to 30 Mg ha−1 promoted an increase in contact areas by 25.5, 38.0, and 20.0% for p1, p2, and p3, respectively. Compared to the rigid surface, the p1 and p3 contact areas in the soil bin increased 6.2, 6.8, and 7.8 times in bare soil, 15, and 30 Mg, respectively; for p2, this increase was 4.2, 4.5, and 5.9 times on the same surfaces.
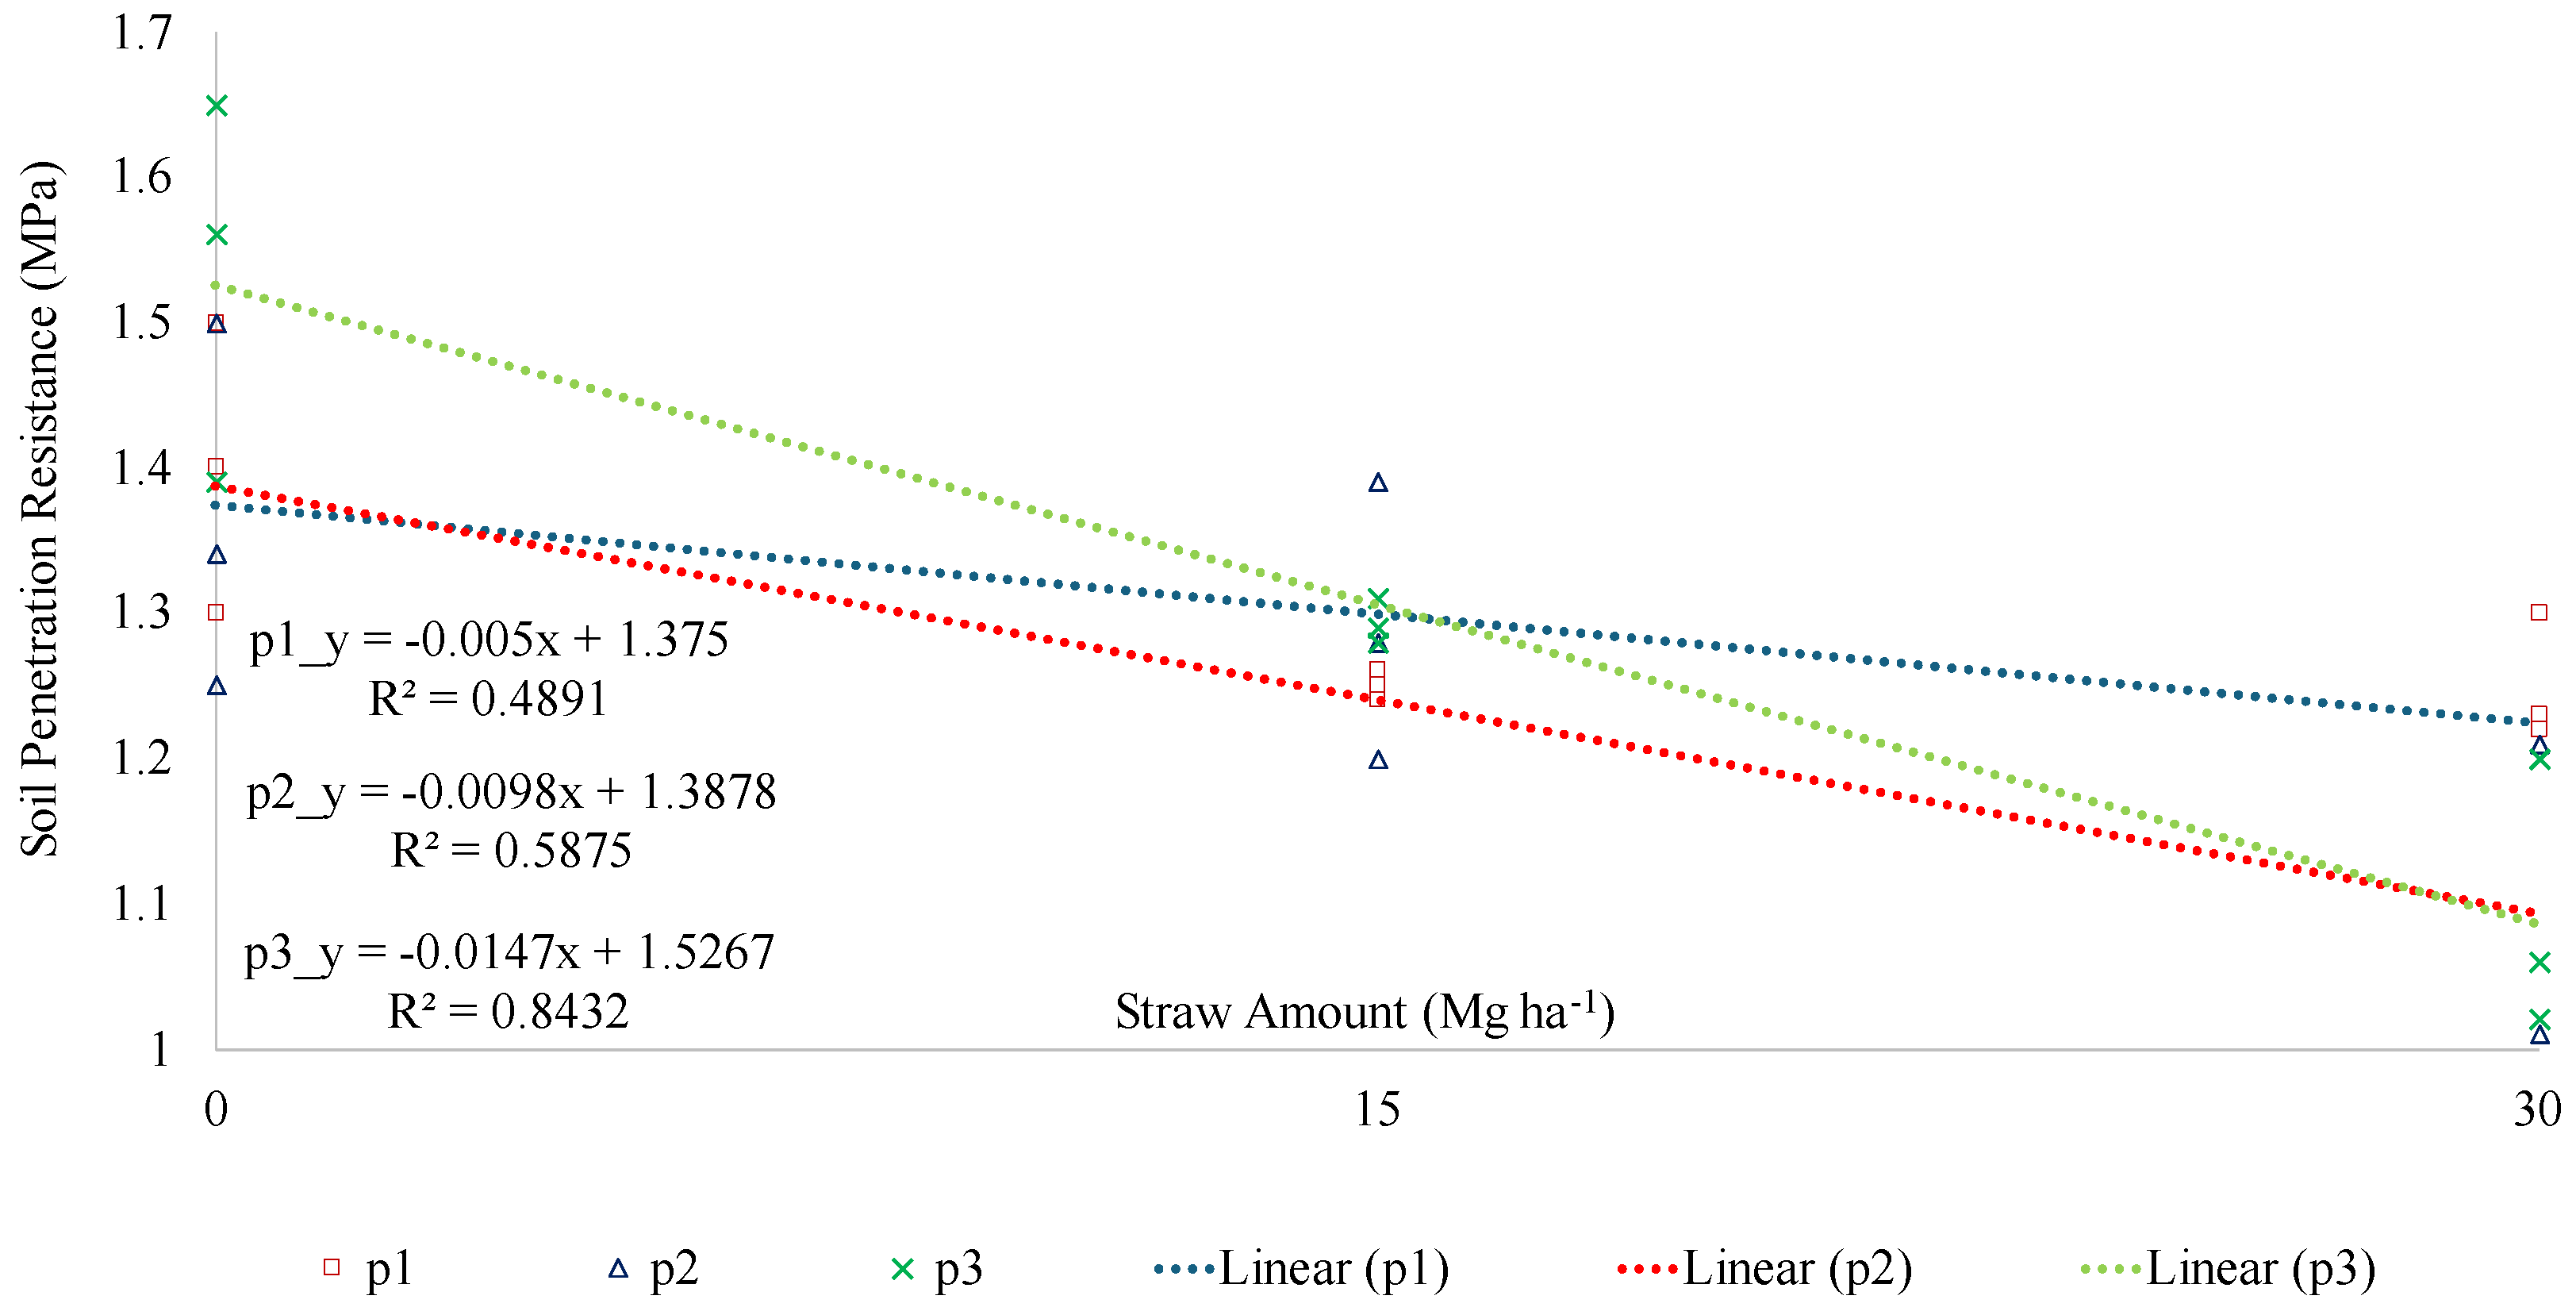
  • The positive angular coefficients indicate that the amount of straw cover proportionally increases the tire contact area. Straw reduces soil penetration resistance linearly (negative angular coefficients), attenuating soil compaction.

Author Contributions

A.K.N., Conceptualization, validation, resources, writing—original draft preparation, writing—review and editing, supervision, funding acquisition. A.C.M.F. and K.P.L., Conceptualization, methodology, validation, formal analysis, investigation, data curation, writing—original draft preparation, writing—review and editing, project administration. All authors have read and agreed to the published version of the manuscript.

Funding

This research received no external funding.

Data Availability Statement

The data are available on request to the corresponding author.

Acknowledgments

This research was supported by the National Council for Scientific and Technological Development (CNPq); the Coordination for the Improvement of Higher Education Personnel (CAPES); the Rural Engineering Department—Federal University of Santa Catarina (UFSC) and the Rural Engineering Department—São Paulo State University (UNESP/Botucatu).

Conflicts of Interest

The authors declare no conflicts of interest.

References

  1. Keller, T.; Sandin, M.; Colombi, T.; Horn, R.; Or, D. Historical increase in agricultural machinery weights enhanced soil stress levels and adversely affected soil functioning. Soil Tillage Res. 2019, 194, 104293. [Google Scholar] [CrossRef]
  2. Farhadi, P.; Golmohammadi, A.; Malvajerdi, A.S.; Gholamhossein, S. Finite element modeling of the interaction of a treaded tire with clay-loam soil. Comput. Electron. Agric. 2019, 162, 793–806. [Google Scholar] [CrossRef]
  3. Yue, L.; Yi, W.; Wang, L.; Yao, S.; Cong, C.; Ren, L.; Zhang, B. Impacts of soil compaction and historical soybean variety growth on soil macropore structure. Soil Tillage Res. 2021, 214, 105166. [Google Scholar] [CrossRef]
  4. Zeng, H.; Wei, X.; Zang, M. Experimental investigation of tire traction performance on granular terrain. J. Terramech. 2022, 104, 49–58. [Google Scholar] [CrossRef]
  5. Roşca, R.; Cârlescu, P.; Vlahidis, I.T.V.; Perşu, C. The improvement of a traction model for agricultural tire–soil interaction. Agriculture 2022, 12, 2035. [Google Scholar] [CrossRef]
  6. Marques Filho, A.C.; Medeiros, S.D.S.; Martins, M.B.; Moura, M.S.; Lanças, K.P. Can the Straw Remaining on the Ground Reduce the Wheelsets Impact on Sugarcane Crop? Sugar Tech 2022, 24, 1814–1820. [Google Scholar] [CrossRef]
  7. Alkhalifa, N.; Tekeste, M.Z.; Jjagwe, P.; Way, T.R. Effects of vertical load and inflation pressure on tire-soil interaction on artificial soil. J. Terramech. 2024, 112, 19–34. [Google Scholar] [CrossRef]
  8. Marques Filho, A.C.; Martins, M.B.; Medeiros, S.D.S.; Santana, L.S.; Lopes, A.G.C.; Lanças, K.P. Wheel–Ground Interaction Test for Sugarcane Cargo Transshipments. Sugar Tech 2024, 26, 894–901. [Google Scholar] [CrossRef]
  9. El-Sayegh, Z.; El-Gindy, M.; Johansson, I.; Öijer, F. Modelling tire-moist terrain interaction using advanced computational techniques. J. Terramech. 2020, 91, 23–30. [Google Scholar] [CrossRef]
  10. Cutini, M.; Costa, C.; Brambilla, M.; Bisaglia, C. Relationship between the 3D footprint of an agricultural tire and drawbar pull using an artificial neural network. Appl. Eng. Agric. 2022, 38, 293–301. [Google Scholar] [CrossRef]
  11. He, R.; Sandu, C.; Osorio, J.E. Systematic tests for study of tire tractive performance on soft soil: Part I—Experimental data collection. J. Terramech. 2019, 85, 59–76. [Google Scholar] [CrossRef]
  12. Yadav, R.; Raheman, H. Development of an artificial neural network model with graphical user interface for predicting contact area of bias-ply tractor tyres on firm Surface. J. Terramech. 2023, 107, 1–11. [Google Scholar] [CrossRef]
  13. Acquah, K.; Chen, Y. Discrete element modelling of soil pressure under varying number of tire passes. J. Terramech. 2023, 107, 23–33. [Google Scholar] [CrossRef]
  14. Teimourlou, R.F.; Taghavifar, H. Determination of the super-elliptic shape of tire-soil contact area using image processing method. Cercet. Agron. Mold. 2015, 48, 5–14. [Google Scholar] [CrossRef]
  15. Jasoliya, D.; Untaroiu, A.; Untaroiu, C. A review of soil modeling for numerical simulations of soil-tire/agricultural tools interaction. J. Terramech. 2024, 111, 41–64. [Google Scholar] [CrossRef]
  16. Golanbari, B.; Mardani, A. An analytical model for stress estimation at the soil-tire interface using the dynamic contact length. J. Terramech. 2024, 111, 1–7. [Google Scholar] [CrossRef]
  17. Karelina, M.; Balabina, T.; Mamaev, A. Wheel Rolling on a Deformable Support Surface. In Proceedings of the 2022 International Conference on Engineering Management of Communication and Technology, Vienna, Austria, 20–22 October 2022; Volume 1, pp. 1–4. [Google Scholar] [CrossRef]
  18. Vieira, D.; Orjuela, R.; Spisser, M.; Basset, M. An adapted Burckhardt tire model for off-road vehicle applications. J. Terramech. 2022, 104, 15–24. [Google Scholar] [CrossRef]
  19. Silva, R.B.; Iori, P.; Souza, Z.M.D.; Pereira, D.M.G.; Vischi Filho, O.J.; Silva, F.A.M. Contact pressures and the impact of farm equipment on Latosol with the presence and absence of sugarcane straw. Ciência Agrotecnol. 2016, 40, 265–278. [Google Scholar] [CrossRef]
  20. Gheshlaghi, F.; Aref, M. Prediction of soil vertical stress under off-road tire using smoothed-particle hydrodynamics. J. Terramech. 2021, 95, 7–14. [Google Scholar] [CrossRef]
  21. Jjagwe, P.; Tekeste, M.Z.; Alkhalifa, N.; Way, T.R. Modeling tire-soil compression resistance on artificial soil using the scaling law of pressure-soil sinkage relationship. J. Terramech. 2023, 108, 7–19. [Google Scholar] [CrossRef]
  22. Zhao, H.; Yuxiang, H.; Liu, Z.; Liu, W.; Zheng, Z. Applications of discrete element method in the research of agricultural machinery: A review. Agriculture 2021, 11, 425. [Google Scholar] [CrossRef]
  23. Phakdee, S.; Suvanjumrat, C. Development of a tire testing machine for evaluating the performance of tractor tires based on the soil compaction. J. Terramech. 2023, 110, 13–25. [Google Scholar] [CrossRef]
  24. Deng, Y.; Wang, Z.; Shen, H.; Gong, J.; Zhen, X. A comprehensive review on non-pneumatic tyre research. Mater. Des. 2023, 1, 111742. [Google Scholar] [CrossRef]
  25. Zhang, F.; Qiu, Y.; Teng, S.; Cui, X.; Wang, X.; Sun, H.; Ali, S.; Guo, Z.; Jiajia, W.; Fu, S. Design and Test of Tread-Pattern Structure of Biomimetic Goat-Sole Tires. Biomimetics 2022, 7, 236. [Google Scholar] [CrossRef] [PubMed]
  26. Luz, F.B.; Gonzaga, L.C.; Castioni, G.A.F.; Lima, R.P.; Carvalho, J.L.M.; Cherubin, M.R. Controlled traffic farming maintains soil physical functionality in sugarcane fields. Geoderma 2023, 432, 116427. [Google Scholar] [CrossRef]
  27. Farhadi, P.; Golmohammadi, A.; Malvajerdi, A.S.; Gholamhossein, S. Tire and soil effects on power loss: Measurement and comparison with finite element model results. J. Terramech. 2020, 92, 13–22. [Google Scholar] [CrossRef]
  28. Harris, B.J. Increased Deflection Agricultural Radial Tires Following the Tire and Rim Association IF, VF, and IF/CFO Load and Inflation Standards; ASABE, Distinguished Lecture Series. Tractor Design No. 39. ASABE Publication 913C0117; ASABE: St. Joseph, MI, USA, 2017. [Google Scholar]
  29. Guimarães Júnnyor, W.S.; Diserens, E.; De Maria, I.C.; Araujo-Junior, C.F.; Farhate, C.V.V.; Souza, Z.M.D. Prediction of soil stresses and compaction due to agricultural machines in sugarcane cultivation systems with and without crop rotation. Sci. Total Environ. 2019, 681, 424–434. [Google Scholar] [CrossRef] [PubMed]
  30. Castioni, G.A.; de Lima, R.P.; Cherubin, M.R.; Bordonal, R.O.; Rolim, M.M.; Carvalho, J.L. Machinery traffic in sugarcane straw removal operation: Stress transmitted and soil compaction. Soil Tillage Res. 2021, 213, 105122. [Google Scholar] [CrossRef]
  31. Alapa. Associação Latino-Americana dos Fabricantes de Pneus, Aros e Rodas. 2019. Available online: https://alapa.org.br/manuais-e-publicacoes/ (accessed on 20 December 2021).
  32. Santos, H.G.; Jacomine, P.K.T.; Dos Anjos, L.H.C.; De Oliveira, V.A.; Lumbreras, J.F.; Coelho, M.R.; Cunha, T.J.F. Sistema Brasileiro de Classificação de Solos, 5th ed.; Embrapa: Brasília, DF, Brasil, 2018; Available online: http://www.infoteca.cnptia.embrapa.br/infoteca/handle/doc/1094003 (accessed on 26 March 2024).
  33. USDA. Soil Survey Staff, Keys to Soil Taxonomy, 12th ed.; United States Department of Agriculture: Washington, DC, USA, 2014. [Google Scholar]
  34. Araújo, F.S.; Souza, Z.M.; Souza, G.S.; Silva, R.B.; Esteban, D.A.A.; Tavares, R.L.M. Load-Bearing Capacity of an Oxisol under Burned and Mechanized Harvest Sugarcane Crops. Sustainability 2023, 15, 15185. [Google Scholar] [CrossRef]
  35. Teixeira, P.C.; Donagemma, G.K.; Fontana, A.; Teixeira, W.G. Manual de Métodos de Análise de Solo, 3rd ed.; Empresa Brasileira de Pesquisa Agropecuária: Brasília, DF, Brasil, 2017; 564p. [Google Scholar]
  36. Cutini, M.; Brambilla, M.; Pochi, D.; Fanigliulo, R.; Bisaglia, C. A simplified approach to the evaluation of the influences of key factors on agricultural tractor fuel consumption during heavy drawbar tasks under field conditions. Agronomy 2022, 12, 1017. [Google Scholar] [CrossRef]
  37. Mamontov, A.; Pelypenko, Y.; Rebrova, O.; Shevtsov, V. Determination of Rational Operating Modes of Operation of Tractor Agricultural Tires. Technol. Transf. Fundam. Princ. Innov. Tech. Solut. 2020, 1, 36–38. [Google Scholar] [CrossRef]
  38. Mamkagh, A.M. Effect of soil moisture, tillage speed, depth, ballast weight and, used implement on wheel slippage of the tractor: A review. Asian J. Adv. Agric. Res. 2019, 1, 1–7. [Google Scholar] [CrossRef]
  39. Boussinesq, J. Application des Potentiels à L’étude de L’équilibre et du Mouvement des Solides Élastiques; Gauthier-Villars, Imprimeur-Libraire: Paris, France, 1885. [Google Scholar]
  40. Soane, B.; Blackwell, P.; Dickson, J.; Painter, D. Compaction by agricultural vehicles: A review ii. compaction under tyres and other running gear. Soil Tillage Res. 1980, 1, 373–400. [Google Scholar] [CrossRef]
  41. Otto, R.; Silva, A.P.; Franco, H.C.J.; Oliveira, E.; Trivelin, P.C.O. High soil penetration resistance reduces sugarcane root system development. Soil Tillage Res. 2011, 117, 201–210. [Google Scholar] [CrossRef]
  42. Sá, M.A.C.; Santos Junior, J.D.G.; Franz, C.A.B.; Rein, T.A. Soil physical quality and sugarcane yield with the use of inter-row chiseling. Pesqui. Agropecuária Bras. 2016, 51, 1610–1622. [Google Scholar] [CrossRef]
  43. Alaoui, A.; Diserens, E. Mapping soil compaction—A review. Curr. Opin. Environ. Sci. Health 2018, 5, 60–66. [Google Scholar] [CrossRef]
  44. Martins, M.B.; Marques Filho, A.C.; Seron, C.D.C.; Guimarães Júnnyor, W.D.S.; Vendruscolo, E.P.; Bortolheiro, F.P.D.A.P.; Santana, L.S. Controlled Traffic Farm: Fuel Demand and Carbon Emissions in Soybean Sowing. AgriEngineering 2024, 6, 1794–1806. [Google Scholar] [CrossRef]
  45. Marques Filho, A.C.; Medeiros, S.D.S.; Martins, M.B.; Lanças, K.P. Can Road Tires be Applied in Agriculture? Paper No. 2023-36-0086; SAE Technical Paper; SAE International: Warrendale, PA, USA, 2024. [Google Scholar] [CrossRef]
Figure 1. Fixed Tire Test Unit (FTTU). Adapted from Marques Filho et al. [8].
Agriengineering 06 00173 g001
Figure 2. Tire models tested and research procedures. The tests were carried out in two stages: first, a rigid surface, and second, deformable surfaces in the soil bin. The tires tested were: p1—Radial Very Flex (445/50R22.5); p2—Radial Improved Flex (600/50R22.5); p3—Bias Ply (600/50-22.5). The response variables for statistical analyses at each testing stage are shown in each procedure.
Agriengineering 06 00173 g002
Figure 3. Tread marks in rigid surface: (a) p1—Radial Very Flex (445/50R22.5); (b) p2—Radial Improved Flex (600/50R22.5); (c) p3—Bias Ply (600/50-22.5). CA is the total contact area, and PA represents the punctual contact area (claws). The transverse and longitudinal measurements of the contact area determine the length (orange arrows) and width (green arrows) of each tread mark.
Agriengineering 06 00173 g003
Figure 4. Soil bin footprint detail (deformable surface scanner). (A) RGB image tread mark; (B) digital scanner CNC FTTU; (C) 3D footprint map model.
Agriengineering 06 00173 g004
Figure 5. Soil bin footprint (deformable surface scanner) for the evaluated tire models: p1 (445/50R22.5); p2 (600/50R22.5) e p3 (600/50-22.5) in different straw surfaces: 0, 15, and 30 Mg ha−1. Columns A—I describe different tires and surfaces. Row I show the footprint RGB photos in the soil bin; row II shows the laser scan of that surface; and row III shows the 3D surface of each test on a deformable surface.
Agriengineering 06 00173 g005
Figure 6. Increase in contact area (m2) about the amount of straw on the soil (Mg ha−1).
Agriengineering 06 00173 g006
Figure 7. Soil penetration resistance (SPR) for straw amounts and tire types. (A) cone index for p1 VF445/50R22.5; (B) cone index for p2 Radial 600/50R22.5; (C) cone index for p3 Bias Ply 600/50-22.5; all with 0, 15, and 30 Mg ha−1.
Agriengineering 06 00173 g007
Figure 8. Linear correlation for soil penetration resistance (SPR) as a function of the coverage straw to p1 VF445/50R22.5; p2 Radial 600/50R22.5 and p3 Bias Ply 600/50-22.5 with 0, 15, and 30 Mg ha−1.
Agriengineering 06 00173 g008
Table 1. Rigid surface tread mark. Contact Area (m2), Length (m), Width (m), Punctual Area (m2) at Tukey test (p < 0.05); % PA Punctual Area; % of factory width to tires p1 (445/50R22.5); p2 (600/50R22.5) and p3 (600/50-22.5).
Rigid Surface Test TiresCA Contact Area (m2)Length
(m)
Width
(m)
PA Punctual Area (m2)% PA Punctual Area% of Factory Width
p10.069 b0.256 c0.347 b0.039 a56.578.5
p20.117 a0.430 a0.543 a0.040 a34.290.0
p30.070 b0.324 b0.395 b0.038 b54.265.8
Means with different lowercase letters indicate statistical differences for tire type (column) at a 5% probability level in the Tukey test.
Table 2. Tread mark data to Contact Area (m2), Length (m), Width (m), Depth (m) Tukey test (p < 0.05) on different amounts of straw on the soil bin surface (0, 15, and 30 Mg ha−1) for tires p1 (445/50R22.5); p2 (600/50R22.5) and p3 (600/50-22.5).
Contact Area
(m2)
Length
(m)
Width
(m)
Depth
(m)
Straw (Mg ha−1)01530015300153001530
p10.43 Bb0.47 Ba0.54 Ab0.66 Ba0.67 ABa0.70 Aa0.48 Bc0.55 ABc0.59 Ac0.12 Aa0.11 Aa0.10 Aa
p20.50 Ba0.53 Ba0.69 Aa0.66 Ba0.68 ABa0.72 Aa0.67 Ba0.74 Aa0.76 Aa0.09 Aa0.08 Ab0.07 Aa
p30.45 Bb0.48 ABa0.54 Ab0.68 Aa0.72 Aa0.73 Aa0.59 Ab0.64 Ab0.66 Ab0.12 Aa0.10 ABa0.09 Ba
Means with different lowercase letters indicate statistical differences for tire type (column). Capital letters indicate differences between straw soil cover (lines) at a 5% probability level in the Tukey test.
Disclaimer/Publisher’s Note: The statements, opinions and data contained in all publications are solely those of the individual author(s) and contributor(s) and not of MDPI and/or the editor(s). MDPI and/or the editor(s) disclaim responsibility for any injury to people or property resulting from any ideas, methods, instructions or products referred to in the content.

