Article

Development of a Robotic Platform with Autonomous Navigation System for Agriculture

by
Jamil de Almeida Baltazar
,
André Luiz de Freitas Coelho
*,
Domingos Sárvio Magalhães Valente
,
Daniel Marçal de Queiroz
and
Flora Maria de Melo Villar
Department of Agricultural Engineering, Federal University of Viçosa, Viçosa 36570-900, MG, Brazil
*
Author to whom correspondence should be addressed.
AgriEngineering 2024, 6(3), 3362-3374; https://doi.org/10.3390/agriengineering6030192
Submission received: 26 July 2024 / Revised: 5 September 2024 / Accepted: 9 September 2024 / Published: 17 September 2024
(This article belongs to the Section Agricultural Mechanization and Machinery)

Abstract

:
The development of autonomous agricultural robots using a global navigation satellite system aided by real-time kinematics and an inertial measurement unit for position and orientation determination must address the accuracy, reliability, and cost of these components. This study aims to develop and evaluate a robotic platform with autonomous navigation using low-cost components. A navigation algorithm was developed based on the kinematics of a differential vehicle, combined with a proportional and integral steering controller that followed a point-to-point route until the desired route was completed. Two route mapping methods were tested. The performance of the platform control algorithm was evaluated by following a predefined route and calculating metrics such as the maximum cross-track error, mean absolute error, standard deviation of the error, and root mean squared error. The strategy of planning routes with closer waypoints reduces cross-track errors. The results showed that when adopting waypoints every 3 m, better performance was obtained compared to waypoints only at the vertices, with maximum cross-track error being 44.4% lower, MAE 64.1% lower, SD 39.4% lower, and RMSE 52.5% lower. This study demonstrates the feasibility of developing autonomous agricultural robots with low-cost components and highlights the importance of careful route planning to optimize navigation accuracy.

1. Introduction

The growth rate of total factor productivity (TFP) between 2011 and 2021 was only 1.14% per year, which is below the target of 1.91% required by 2050 to guarantee global food supply [1]. TFP measures the growth of the ratio of agricultural production to the amount of input. The greater the TFP, the more efficient agriculture is. Factors that contribute to the nongrowth of TFP include restricted access to technologies, low investments in agricultural research and development (R&D) rates in low-income countries, and the impact of climate change, particularly in hot regions. The global population is expected to reach 9.7 billion by 2050, requiring the doubling of agricultural production from 2010 to 2050 [1].
Precision agriculture (PA) tools can be used to manage agricultural fields by considering the spatial and temporal variability of production factors. PA uses inputs in the optimal quantity, in the correct place, and at an appropriate time [2,3]. The robotization of agriculture as a PA tool is a potential solution for increasing TFP. Thus, the use of agricultural robots can help address problems such as labor shortages, low efficiency of agricultural operations, and the need to increase crop yield and rationalize the use of inputs.
Navigation systems are essential components of agricultural robots. The precision of the position and orientation is fundamentally important, as the robot must follow the desired route without lateral deviations that can harm plant and soil conditions [4,5]. The positioning technology widely used in agricultural robots, as in other agricultural machines, is the Global Navigation Satellite System (GNSS) [3]. Within GNSS, modules with real-time kinematic (RTK) corrections enable greater precision in position determination [3,6].
Even with accurate positioning, the GNSS-RTK alone may be insufficient to guarantee the level of reliability and accuracy needed to obtain the orientation required for an agricultural robotic platform. Therefore, it is necessary to integrate GNSS-RTK with other technologies, such as inertial measurement units (IMU) [7]. However, adopting such integration using high-precision and reliable sensors tends to increase the cost of purchasing robots. It is crucial to consider that part of the overall agricultural production originates from smallholder farmers, who often have limited financial resources to invest in advanced equipment. To serve this class of farmers, affordable, simple, and functional agricultural robots must be developed.
One solution for developing robots for smallholder farmers is to use open-design sensors that have a lower cost than sensors with proprietary technology. However, it must be determined whether the accuracy and reliability of open-design sensors meet the accuracy and reliability requirements for the efficient operation of agricultural robots. Several studies have shown success in using sensors and other open-design and low-cost components such as GNSS-RTK modules, radio frequency modules, Arduino and ESP32 development boards, Beaglebone Black, Raspberry Pi, and Jetson Nano single-board computers. These components are used to develop affordable technologies in the agricultural sector [8,9].
Given the need to use agricultural robots to guarantee food security and the sustainability of agricultural production, developing technologies that are accessible to smallholder farmers is essential. The optimal approach to achieving this goal is to use an open design with low-cost components. Therefore, this study aimed to develop a robotic platform with autonomous navigation using low-cost components and to evaluate navigation errors in relation to a desired route.

2. Materials and Methods

This study was conducted in three stages. First, a robotic platform was designed, its mechanical system was built, and an electrical and electronic system was assembled. In the second stage, a computer program was developed to obtain the position and orientation of the robotic platform and provide direction control and angular speed control of the wheels, which are necessary for autonomous navigation along a pre-established route. In the third and final stage, the autonomous navigation performance of the robotic platform was evaluated by analyzing lateral deviations during the execution of a planned route. During the execution of the three stages, the following requirements were taken into consideration:
  • The robotic platform must have width of 1.2 m to allow movement between rows of tree crops.
  • The robotic platform must have a displacement speed of approximately 0.3 m/s.
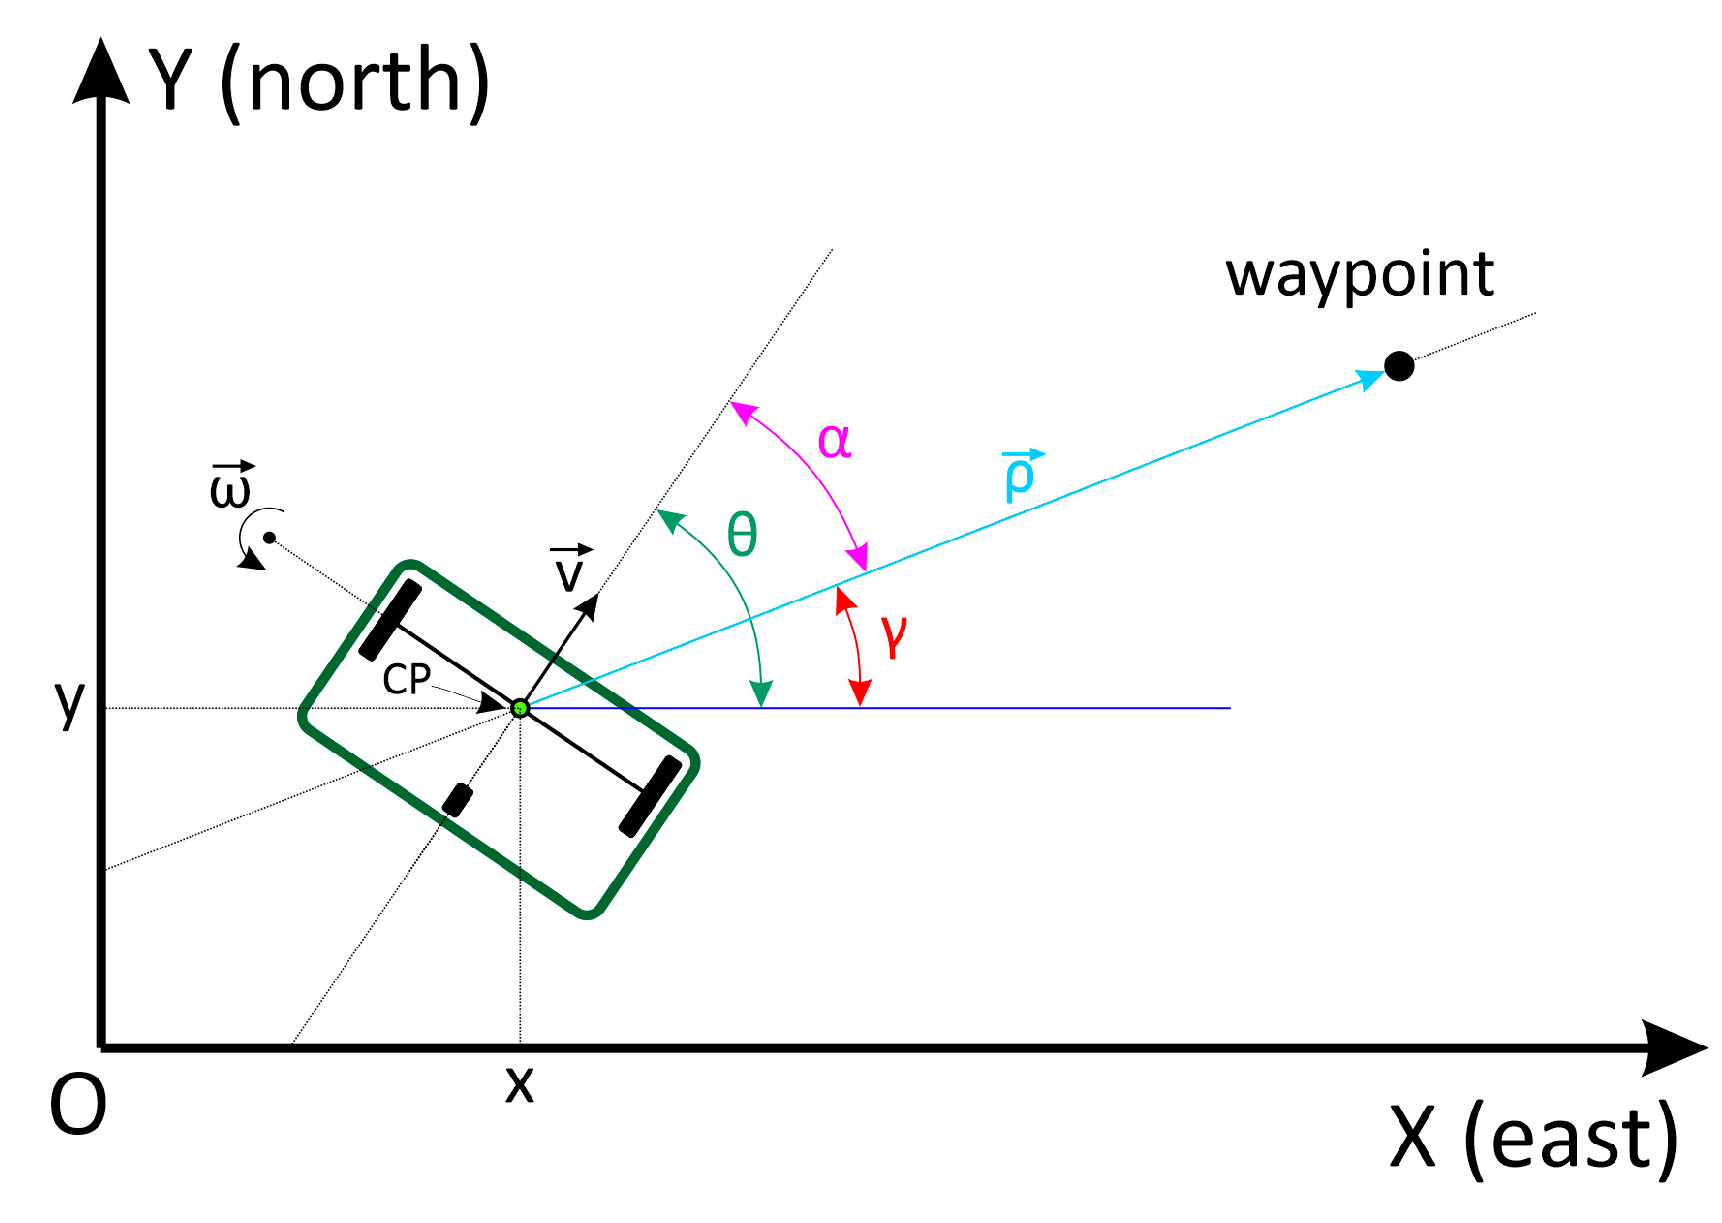
  • The platform must use a differential-drive vehicle model, where the angular velocity of each wheel is independently controlled. The pose of the robotic platform is defined by three independent variables: two for position (x and y) and one for orientation (θ).
  • The position and orientation of the robotic platform must be determined using low-cost GNSS-RTK modules with sub-meter accuracy (±0.3 m) and a low-cost IMU sensor.
  • The IMU must have a sampling rate of 10 Hz, and the GNSS-RTK must operate at a frequency greater than 5 Hz.
  • The navigation algorithm for the robotic platform should be developed based on the Robotic Operating System framework and operate with an execution frequency of 10 Hz.
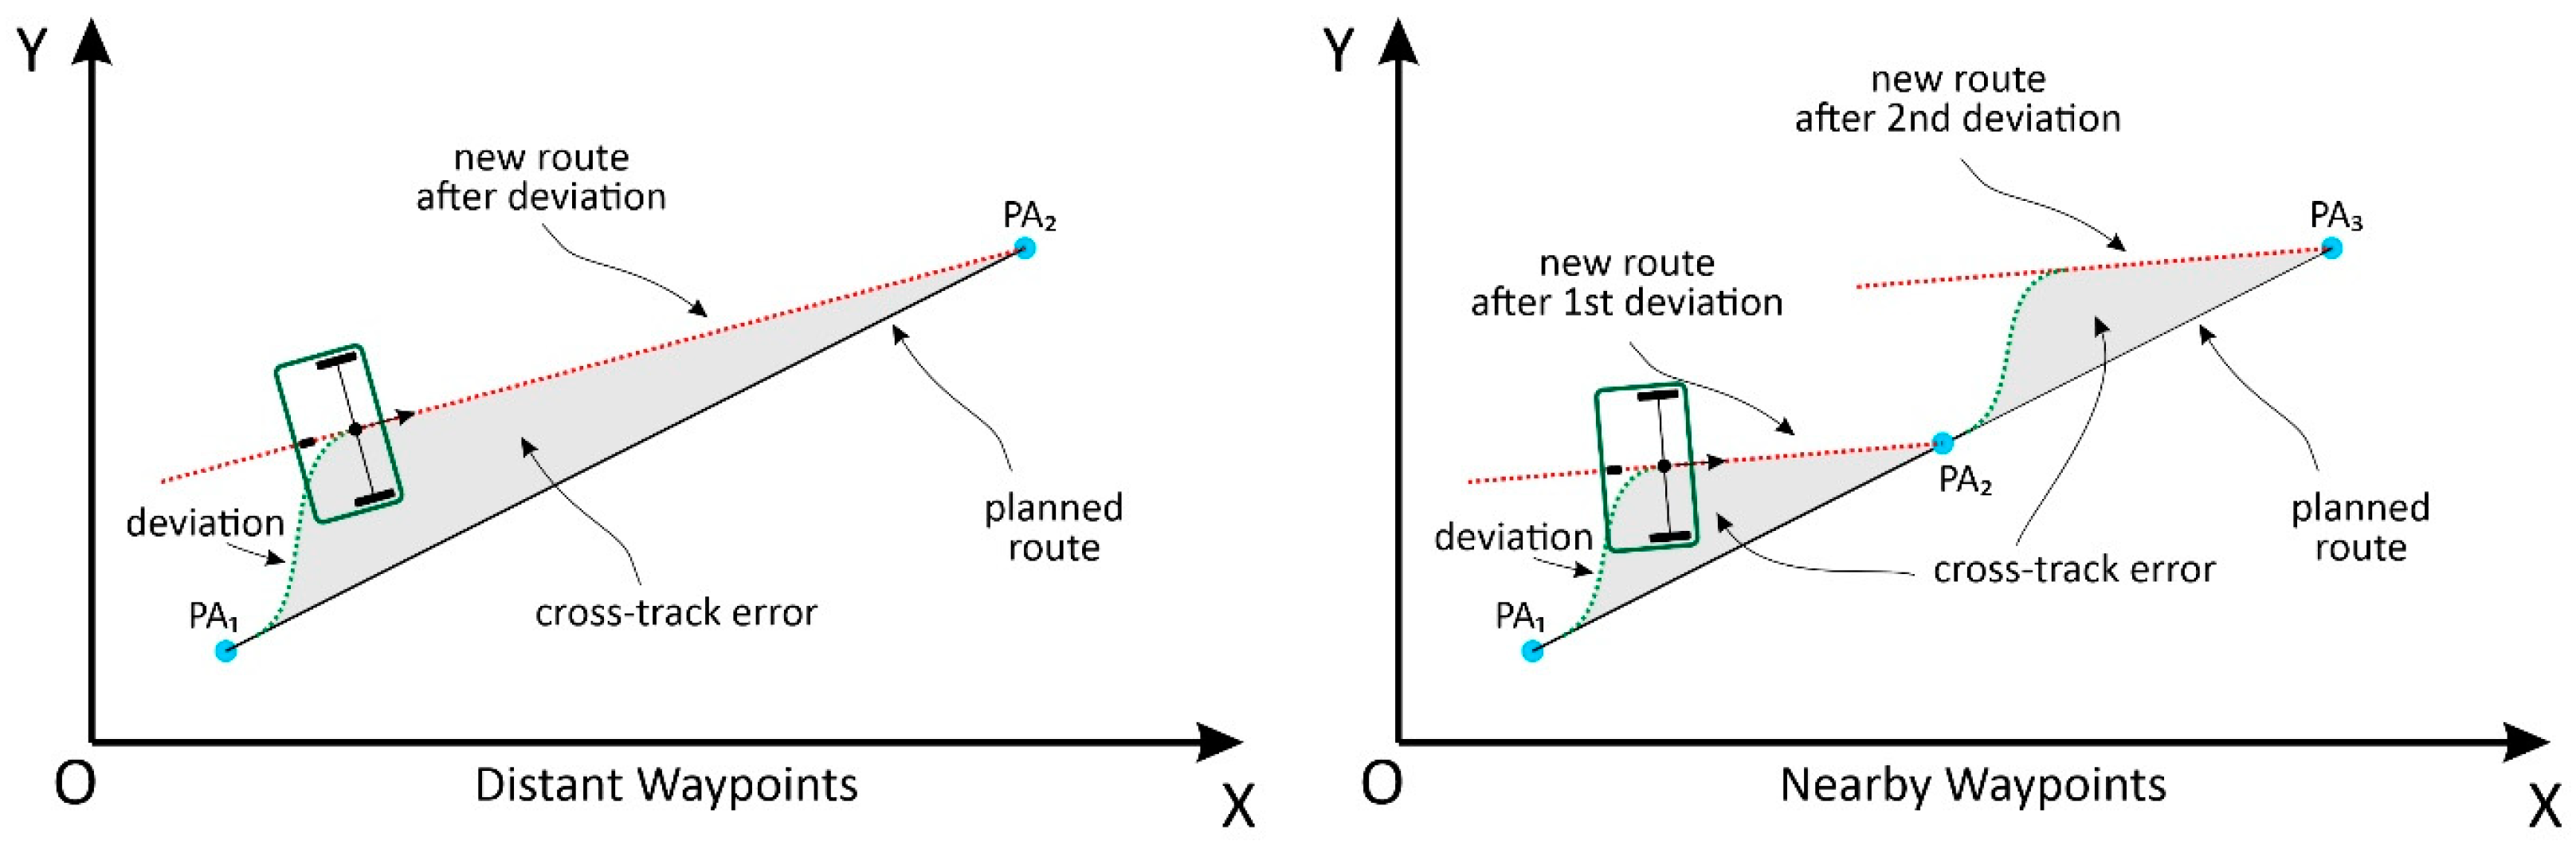
  • The platform must be capable of following predetermined routes defined in a CSV or shapefile format file. This file will contain the sequence of waypoints to be reached, specified in global coordinates using the Universal Transverse Mercator (UTM) coordinate system.
  • The platform must follow the route with a maximum lateral error of 0.5 m and a mean absolute error of less than 0.1 m [3].

2.1. Mechanical, Electrical, and Electronic Systems of the Robotic Platform

The mechanical system of the robotic platform was made using a metal chassis with a width of 1.20 m, length of 0.70 m, and clearance of 0.60 m. This chassis was driven by two wheels, both installed at the front of the platform, with 0.50 m × 0.045 m tires (outer diameter × tread width), a chain transmission, and driven by two 24 Vdc independent electric motors. These motors had a maximum angular velocity of 5.759 rad/s and a maximum torque of 35 N.m. The angular speeds of the motors were reduced by a ratio of 1:3.714 using a 14-tooth pinion with a 52-tooth ring gear. The rear part of the platform was supported by a 0.20 m diameter free-spinning wheel. The electrical and electronic systems of the robotic platform were powered by two 12 V batteries of 18 A h, each connected in series. A 17 V 150 W photovoltaic panel connected to a controller continuously charged the batteries.
The two motors coupled to the wheels were controlled independently using BTS7960 43A H-bridge modules (Infineon Technologies AG, Neubiberg, Germany). The modules were connected to two Arduino UNO R3 development boards (Arduino S.r.l., Monza, Italy). An incremental encoder sensor is installed on the shaft of each motor at a resolution of 100 pulses per revolution in each channel. The pulsed electrical signals generated by the encoders were read by the Arduino boards and used to calculate the actual angular speed of the motors.
The two Arduino UNO R3 boards were connected to an Nvidia Jetson Nano single-board computer (Nvidia Corporation, Santa Clara, CA, USA), with a 1.43 GHz Quad-core ARM Cortex-A57 processor, a Maxwell™ graphics processor with 128 cores, and a 4 GB RAM 64-bit LPDDR4. This computer, using Linux Ubuntu 18.04 LTS operating system, was responsible for the data processing of the robotic platform. As a human-machine interface (HMI) for monitoring and executing commands, a 19″ LCD monitor, keyboard, and mouse were used, all connected to an NVIDIA Jetson Nano single-board computer. An EMLID Reach GNSS-RTK module (Emlid Tech, Budapest, Hungary) configured as a rover and an IMU BNO055 sensor (Adafruit Industries, New York City, NY, USA) were connected to a computer. The second GNSS-RTK EMLID Reach module was configured as a base station, with communication between them occurring via WiFi. The integration schemes of the mechanical, electrical, and electronic system components, as well as the quantities, specifications, and acquisition costs, are presented in Figure 1 and Table 1.

2.2. Robotic Platform Software

The robotic platform embedded software, version 1.0, was developed using the robotic operation system (ROS) framework in its melodic version. The ROS core ran on the Nvidia Jetson Nano, which in turn communicated with two Arduino UNO R3 boards using the Rosserial library (update rate of 10 Hz) with the GNSS-RTK Rover module (update rate of 5 Hz) and the IMU sensor (update rate of 10 Hz). As illustrated in Figure 2, the ROS-based software is organized into nodes (ellipses), topics (rectangles), and services. Arrows represent the flow of data, in which data can leave a node (publisher) and be published on a topic, just as data can leave a topic and be received by a node (subscriber).
The developed robotic platform was of a differential type. The platform motion is produced by the electric motors of the two wheels. The rotation and translation of the platform were performed by varying the angular velocity of the wheels. The control point of the robotic platform was located at the midpoint of the virtual axis connecting the centers of the two wheels, where the antenna on the GNSS module was installed.
The robotic platform software uses the forward and angular velocities of the control point to move to a waypoint. The forward velocity was set to 0.28 m s−1, close to the maximum velocity of the robotic platform (0.30 m s−1). The angular velocity was calculated using the software (described in the Section 2.2.1). Using both datasets, the angular velocities of the left and right wheels were calculated to reach the platform forward. The angular velocities are shown in Equations (1) and (2).
ω l = v ω . l 2 r
ω r = v + ω . l 2 r
where ω l and ω r are the angular velocities of the left and right wheels, respectively, in rad/s, v is the forward velocity of the robotic platform ( v was set to 0.28 m s−1), ω is the angular velocity of the platform in rad/s, l is the distance between wheels ( l was set to 1.05 m), and r is the wheel radius ( r was set to 0.2454 m).
The angular velocity of the robotic platform’s wheels was controlled using software running on Arduino UNO R3 boards. In this software, a proportional-integral-derivative (PID) controller was implemented (Figure 3), which acted on the electric motors by varying their average supply voltages using pulse-width modulation (PWM) and changing their angular velocities. The values of 10, 20, and 0.1 were used for Kp, Ki, and Kd, respectively, and were adopted in the two-wheel controllers. To reach these values, the Ziegler and Nichols method was used, followed by fine-tuning through trial and error.

2.2.1. Steering Control Algorithm

The route executed by the robotic platform was defined based on a set of georeferenced points using Universal Transverse Mercator (UTM) coordinates and the WGS84 datum. The orientation reference of the robotic platform was in the positive direction of the x-axis, which was equivalent to the east cardinal point. The absolute positions (x- and y-coordinates, Figure 4) were obtained using the GNSS-RTK module. The absolute orientation (angle θ) was obtained by the IMU. To complete the planned route, the robotic platform is moved to each waypoint that defines the planned route.
In Figure 4, CP is the control point, located at the average distance from the virtual axis that connects the center of the two wheels, (x, y) is the Cartesian position of the CP, v is the forward velocity, ω is the angular velocity of the robotic platform, ρ is the vector that connects the current location to the waypoint, ρ is the distance between the current location and the waypoint (m), γ is the angle of the vector ρ with respect to the X axis (east), θ is the angle of the robot’s direction of travel with respect to the X axis (east), and α = γ θ , which is the orientation error to the waypoint.
To control the steering of the robotic platform, a proportional and integral (PI) controller was used, operating at 10 Hz, which acted to minimize the angle error α (Figure 5). The values for the Kp and Ki parameters of the PI controller, 0.9 and 0.01, respectively, were obtained by trial and error by simulating a virtual model of the robotic platform developed in Python.
In the preliminary tests, the IMU used in the robotic platform did not maintain calibration during the execution of the planned route. An algorithm was developed to integrate the IMU and GNSS, in which the positioning data (obtained by GNSS-RTK) were used to recalibrate the IMU. This algorithm contained the following logic:
IF (moved in a straight line for 1.0 m AND was more than 1.0 m from the waypoint): use the current position and the previous position to calculate the orientation angle of the platform θ;
  • performed the correction of the angle θ provided by the IMU.
A second steering control algorithm was implemented to act in scenarios of sudden oscillations in the PI controller response, such as those occurring during the execution of maneuvers. The logic implemented was:
IF (α < −10° OR α > 10°):
  • robotic platform rotated around its axis until α approached zero, that is, the wheels rotated in the opposite direction to each other, with the same angular velocity in the module, resulting in zero forward velocity of the platform.
ELSE (α > −10° AND α < 10°):
  • PI controller was responsible for the steering control of the robotic platform.
The robotic platform was considered to reach the waypoint when ρ (Figure 4) was less than 0.5 m. Additionally, the control algorithm was implemented to ensure that, after navigating through all the waypoints on the planned route, the platform would return to the starting point. Figure 6 shows a flowchart of the software developed for the robotic platform.

2.3. Navigation Performance Evaluation of the Robotic Platform

To evaluate the navigation performance of the robotic platform along a predefined route, it was initially necessary to create a route map. A route map is a sequence of waypoints to be covered, free from collisions, in which the software is developed based on algorithms described in a loop navigating to each waypoint [10].
A flat rectangular field measuring approximately 1600 m2 was used. The field is cultivated with lawn grass (Paspalum notatum). The zebra-marking tape was fixed to the ground, simulating lines of a coffee farm with a spacing of 2.5 m and a length of 40.0 m each. The area was mapped using images obtained using a DJI Mavic Air 2 UAV operating at an altitude of 20 m. Images were processed to obtain orthophotos in the field. For correct orthomosaic georeferencing, the geographic coordinates of the five control points were collected using the GNSS-RTK module of the robotic platform (Figure 7a). Point 1 (blue) had its coordinates obtained on average without using the GNSS-RTK base module, owing to the absence of a reference point. To obtain the other four points, the base module was fixed at point 1, with its coordinates as a reference. QGIS software version 3.32.2 was used to trace the route to be followed by the robotic platform (Figure 7b).
The navigation performance assessment was conducted by considering two approaches to allocating waypoints that define the route to be taken. In the first, called “Test 1”, only the points located at the vertices of the route were used as waypoints, totaling 21 waypoints (Figure 8a). In the second, called “Test 2”, the waypoints were distributed approximately every 3.0 m along the lines of the planned route, totaling 149 waypoints (Figure 8b). The routes were executed nine times for each test. During the execution of the tests using the robotic platform, the base GNSS-RTK module was maintained at Blue Point 1 (Figure 7a).
During each test, the platform software stores the main variables related to the steering control algorithm. These variables are the current position and orientation, coordinates of the current waypoint, distance, and angle of the current waypoint, angular velocity required for each wheel, and the actual angular velocity of the left and right wheels. These data were recorded every time there was a change in the position of the platform (approximately 1 data point every 0.2 s or 5 Hz). A text file in CSV (comma-separated values) format was generated for each repetition of each test.
The navigation performance assessment of the robotic platform involved calculating and analyzing the lateral deviation (called the cross-track error) of the platform in relation to the planned route segment. The position data of the robotic platform obtained by the GNSS-RTK module and stored in a CSV format file were used. As illustrated in Figure 9, the parameters of the straight-line equation were analytically calculated for each route segment formed by waypoints PAi and PAi+1. For each position of the robotic platform (Pj), the parameters of the equation for the line perpendicular to P A i P A i + 1 ¯ , which also passes through point Pj, were calculated analytically. Using the two straight-line equations, the intersection point was Ppj, which is the orthogonal projection of the crossed point Pj on the line segment P A i P A i + 1 ¯ . The cross-track error ek corresponds to the distance between Pj and Ppj, which is the orthogonal distance between the position of the robotic platform and planned route segment P A i P A i + 1 ¯ .
For each of the 18 executions of the planned route (nine for Test 1 and nine for Test 2), the cross-track error was calculated for each position data point stored by the software. The mean absolute error (MAE) (Equation (3)), standard deviation (SD) of the error (Equation (4)), and root mean square error (RMSE) (Equation (5)) were calculated from the set of cross-track errors for each route. Although the time interval for sampling the position of the robotic platform was homogeneous, the distances between the sampled points were not constant along the route. Therefore, to calculate the error metrics, the weighted average was considered, with the weights being the distances between the points of projection of the point traveled on the straight line of the planned route.
M A E = n = 1 N e n . d n n = 1 N d n
S D = n = 1 N e n e ¯ 2 . d n n = 1 N d n
R M S E = n = 1 N e n 2 . d n n = 1 N d n
where N is the total number of points covered; en is the cross-track error, that is, the orthogonal distance between the point covered and the straight route; dn is the distance between the projection of the current point covered on the straight route and its equivalent previous route; and e ¯ is the weighted average of the cross-track errors.

3. Results and Discussion

In general, the repetitions of Test 1 presented a higher MAE than those of Test 2, except for repetitions 5 and 8, which presented similar values (Table 2). In Test 1, the MAE was 2.01 to 3.6 times higher than in Test 2. Similar behavior occurred for the SD and RMSE, with values from 1.1 to 2.6 and from 1.5 to 2.9 times lower, respectively. Analyzing the average values of the repetitions, the maximum cross-track error, MAE, SD, and RMSE were 1.8-, 2.8-, 1.6, and 2.1 times greater in Test 1 than in Test 2. Thus, the strategy of building routes using waypoints every 3.0 m resulted in smaller deviations in the robotic platform compared with the planned route. The MAE values of the tests are compatible with the horizontal precision of 0.1 m to 0.3 m specified by reference [3] for operations of pesticide spraying, fertilizer distribution, and harvesting.
The smaller cross-track errors observed in Test 2 were attributed to improved performance of the algorithms when the waypoints that comprised the planned route were close to each other. Algorithms are used to control the displacement of the robotic platform at a certain waypoint. In other words, the algorithms aimed to calculate and control the angular velocity of the wheels to minimize the angle α, that is, to align the robotic platform with the waypoint. Therefore, the angular velocity of the wheels caused a linear displacement of the robotic platform, minimizing ρ , that is, reducing the distance between the robotic platform and waypoint. The algorithms developed did not have cross-track error as a control variable; however, whenever α was close to zero, cross-track error tended to decrease until close to zero. Thus, in Test 2, the greater number of waypoints favored greater occurrences of α close to zero, reducing the values of the cross-track error (Figure 10).
By analyzing the variation in the cross-track error as the robotic platform moved along the planned route, a tendency toward cyclical behavior was observed for the largest cross-track errors in all tests (Figure 11). Positive and negative cross-track errors occurred when the robotic platform deviated to the left and right of the planned route, respectively. The cycles exhibited peaks and valleys, indicating significant lateral deviations to the left and right approximately every 40.0 m. These larger cross-track errors typically occurred when the robotic platform completed the displacement in a route segment of 40.0 m, maneuvered, and then started moving on the adjacent route segment.
For all repetitions of Test 2, it can be stated that the largest cross-track errors always occurred during the execution of the maneuvers. In Test 1, the largest cross-track errors in some repetitions occurred outside the maneuver region. In repetitions with lower MAE and RMSE values (Table 2), a greater concentration of data was observed close to the cross-track error line of zero.
The magnitudes of the cross-track errors observed in the peaks and valleys, occurring during the maneuvers, are explained by the tolerance in the minimum value of ρ adopted (0.5 m), considering that the robotic platform reached the waypoint (Figure 12). The adoption of a minimum value higher than null was necessary because of oscillations in the position determination of the robotic platform by GNSS-RTK, ensuring that the robotic platform did not get stuck around the waypoint when attempting to cancel ρ [10]. Thus, near the maneuvering region, the robotic platform does not need to arrive exactly at the waypoint. The tolerance value can be reduced to reduce the peaks and valleys of the cross-track errors presented in this study. However, this value must exceed the amplitude of the position oscillations obtained using GNSS-RTK.
Because cross-track errors with greater magnitudes tend to occur in the maneuvering regions and the MAE and RMSE errors of Test 2 were low, there is potential for using the robotic platform developed for conducting agricultural operations and crop monitoring. Vehicles with more robust algorithms and/or higher precision sensors tended to have lower cross-track errors. For instance, [3] reported a mean cross-track error of 0.064 m with a standard deviation of 0.013 m, while [7] reported a mean cross-track error of 0.032 m with a standard deviation of 0.02 m. However, the cost of purchasing a vehicle with more robust algorithms and sensors with greater precision tended to be higher. Particularly for smallholder farmers with lower investment capacity, it may be necessary to consider higher cross-track errors as acceptable when using low-cost sensors in autonomous vehicles for precision agriculture [11,12,13].

4. Conclusions

In this study, for the average values obtained in the nine repetitions of each of the two performed tests, the maximum cross-track error had an average of 0.829 m for Test 1 (mapped with points at the vertices) and 0.461 m for Test 2 (mapped with points every 3.0 m), the MAE was 0.167 m and 0.06 m for Test 1 and Test 2, respectively, the SD was 0.137 m and 0.083 m, and the RMSE was 0.217 m and 0.103 m. Test 2 presented lower values than Test 1 for all metrics, with the maximum cross-track error being 44.4% lower, MAE 64.1% lower, SD 39.4% lower, and RMSE 52.5% lower.
The variation in the cross-track error exhibited a cyclical behavior owing to the geometry of the planned route, which was followed by the robotic platform. The largest magnitude of cross-track errors occurred in the maneuvering regions for routes generated with waypoints every 3.0 m. Here, the largest influencer of the cross-track error was the algorithm parameter related to distance tolerance, which defined the arrival at the waypoint. The adopted value (0.5 m) caused the robotic platform to move to the next waypoint before reaching the current waypoint.
The magnitude of the obtained cross-track errors demonstrates the feasibility of developing robotic platforms for small-scale agriculture. The accuracy of the navigation algorithm, optimized for low-cost sensors, was improved by placing the waypoints closer to each other. The fusion of GNSS-RTK and IMU data was efficient in correcting direction errors and ensuring continuous recalibration of the IMU.
This work also highlighted the importance of planning and selecting the optimal strategy for distributing waypoints along the route that an autonomous map-guided agricultural robot will travel.

Author Contributions

Conceptualization, J.d.A.B., A.L.d.F.C. and D.S.M.V.; methodology, J.d.A.B., A.L.d.F.C. and D.S.M.V.; formal analysis, J.d.A.B.; data curation, J.d.A.B.; writing—original draft preparation, J.d.A.B., A.L.d.F.C. and D.S.M.V.; writing—review and editing, J.d.A.B., A.L.d.F.C., D.S.M.V., D.M.d.Q. and F.M.d.M.V.; supervision, A.L.d.F.C. and D.S.M.V.; funding acquisition, D.S.M.V. All authors have read and agreed to the published version of the manuscript.

Funding

This research was funded by the Foundation for Research Support of Minas Gerais State (FAPEMIG) under project APQ-03052-17, titled “Low-cost System for Robotic Guidance in Precision Agriculture.

Data Availability Statement

No new data were created or analyzed in this study. Data sharing is not applicable to this article.

Acknowledgments

We would like to acknowledge the National Council for Research and Development (CNPq), Foundation for Research Support of Minas Gerais State (FAPEMIG), and Coordination for the Improvement of Higher Education Personnel (CAPES, Funding Code 001) for their financial support in conducting this study.

Conflicts of Interest

The authors declare no conflicts of interest.

References

  1. Agnew, J.; Hendery, S. 2023 Global Agricultural Productivity Report: Every Farmer, Every; Virginia Tech College of Agriculture and Life Sciences: Blacksburg, VA, USA, 2023. [Google Scholar]
  2. Cisternas, I.; Velásquez, I.; Caro, A.; Rodríguez, A. Systematic Literature Review of Implementations of Precision Agriculture. Comput. Electron. Agric. 2020, 176, 105626. [Google Scholar]
  3. Pini, M.; Marucco, G.; Falco, G.; Nicola, M.; De Wilde, W. Experimental Testbed and Methodology for the Assessment of RTK GNSS Receivers Used in Precision Agriculture. IEEE Access 2020, 8, 14690–14703. [Google Scholar] [CrossRef]
  4. Gentilini, L.; Rossi, S.; Mengoli, D.; Eusebi, A.; Marconi, L. Trajectory Planning ROS Service for an Autonomous Agricultural Robot. In Proceedings of the 2021 IEEE International Workshop on Metrology for Agriculture and Forestry, MetroAgriFor 2021, Trento-Bolzano, Italy, 3–5 November 2021; pp. 384–389. [Google Scholar]
  5. Rahmadian, R.; Widyartono, M. Autonomous Robotic in Agriculture: A Review. In Proceedings of the 2020 Third International Conference on Vocational Education and Electrical Engineering (ICVEE), Surabaya, Indonesia, 3–4 October 2020; pp. 1–6. [Google Scholar]
  6. Zhang, Q.; Chen, Q.; Xu, Z.; Zhang, T.; Niu, X. Evaluating the Navigation Performance of Multi-Information Integration Based on Low-End Inertial Sensors for Precision Agriculture. Precis. Agric. 2021, 22, 627–646. [Google Scholar] [CrossRef]
  7. Reitbauer, E.; Schmied, C. Bridging Gnss Outages with Imu and Odometry: A Case Study for Agricultural Vehicles. Sensors 2021, 21, 4467. [Google Scholar] [CrossRef] [PubMed]
  8. Takasu, T.; Yasuda, A. Development of the Low-Cost RTK-GPS Receiver with an Open Source Program Package RTKLIB. In Proceedings of the International Symposium on GPS/GNSS, Jeju International Conference Center. Jeju, Republic of Korea, 4–6 November 2009. [Google Scholar]
  9. Bechar, A.; Vigneault, C. Agricultural Robots for Field Operations: Concepts and Components. Biosyst. Eng. 2016, 149, 94–111. [Google Scholar]
  10. Hernanda, T.Y.; Rosa, M.R.; Fuadi, A.Z. Mobile Robot-Ackerman Steering Navigation and Control Using Localization Based on Kalman Filter and PID Controller. In Proceedings of the 2022 5th International Seminar on Research of Information Technology and Intelligent Systems, ISRITI 2022, Yogyakarta, Indonesia, 8–9 December 2022; pp. 154–159. [Google Scholar]
  11. Levoir, S.J.; Farley, P.A.; Sun, T.; Xu, C. High-Accuracy Adaptive Low-Cost Location Sensing Subsystems for Autonomous Rover in Precision Agriculture. IEEE Open J. Ind. Appl. 2020, 1, 74–94. [Google Scholar] [CrossRef]
  12. Yan, Y.; Zhang, B.; Zhou, J.; Zhang, Y.; Liu, X. Real-Time Localization and Mapping Utilizing Multi-Sensor Fusion and Visual–IMU–Wheel Odometry for Agricultural Robots in Unstructured, Dynamic and GPS-Denied Greenhouse Environments. Agronomy 2022, 12, 1740. [Google Scholar] [CrossRef]
  13. Abdelhafid, E.F.; Abdelkader, Y.M.; Ahmed, M.; Doha, E.H.; Oumayma, E.K.; Abdellah, E.A. Localization Based on DGPS for Autonomous Robots in Precision Agriculture. In Proceedings of the 2022 2nd International Conference on Innovative Research in Applied Science, Engineering and Technology, IRASET 2022, Meknes, Morocco, 3–4 March 2022. [Google Scholar]
Figure 1. Robotic platform developed: (a) image of the platform, (b) schematic of the mechanical, electrical, and electronic system.
Agriengineering 06 00192 g001
Figure 2. Organization of nodes and topics of the developed software for the robotic platform using the ROS framework.
Agriengineering 06 00192 g002
Figure 3. PID controller for the angular velocity of the left and right wheels of the robotic platform.
Agriengineering 06 00192 g003
Figure 4. Parameters used to control the angular direction of the robotic platform to reach the waypoint.
Agriengineering 06 00192 g004
Figure 5. PI controller to control the steering of the robotic platform.
Agriengineering 06 00192 g005
Figure 6. Flowchart of the software developed for the robotic platform.
Agriengineering 06 00192 g006
Figure 7. Field used to evaluate the navigation performance of the robotic platform. (a) orthomosaic, (b) planned route.
Agriengineering 06 00192 g007
Figure 8. Strategies for generating routes used to evaluate platform performance. (a) waypoints allocated at the vertices of the route (Test 1). (b) waypoints allocated along route lines every 3 m (Test 2).
Agriengineering 06 00192 g008
Figure 9. Graphical representation of the cross-track error of the robotic platform in relation to the planned route line.
Agriengineering 06 00192 g009
Figure 10. Influence of the distance between waypoints on the cross-track error of the robotic platform, showing that close waypoints tend to reduce cross-track errors.
Agriengineering 06 00192 g010
Figure 11. Variation in cross-track error depends on the distance traveled during the execution of the planned routes. (a) Test 1. (b) Test 2.
Agriengineering 06 00192 g011
Figure 12. Influence of the tolerance to consider arrival at the waypoint on the cross-track error during the displacement of the robotic platform in the maneuvering regions.
Agriengineering 06 00192 g012
Table 1. Components of the mechanical, electrical, and electronic system, with their quantities and unit costs.
QuantitiesComponentTotal Price (USD) *
1Nvidia Jetson Nano224.99
1IMU Adafruit BNO 05534.95
1Router WiFi TP-Link AC175073.00
2Module GNSS-RTK—EMLID Reach1794.00
2Rotary encoder 100 pulses37.98
2DC Motor, 24 V, 35 N.m, 55 RPM158.00
220 × 1.75″ Tire and wheel123.98
18-inch Swivel Caster Wheels20.00
2Sealed Lead Acid Battery 12 V 20 A.h Rechargeable205.72
2Arduino Uno R3 Board27.60
1Metal Chassi100.00
1Cables, screws, chains, pinion and ring gears, etc.100.00
Total2900.22
* Prices obtained in August 2024.
Table 2. Cross-track error calculated from position data collected by GNSS-RTK during route execution.
RepetitionTest 1 - Route with Points at VerticesTest 2 - Route with Points Every 3.0 m
Maximum
Cross-Track Error (m)
MAE (m)SD (m)RMSE (m)Maximum
Cross-Track Error (m)
MAE (m)SD (m)RMSE (m)
11.2690.1570.1040.1880.4430.0600.0840.103
21.0640.1780.1810.2540.4530.0670.0840.107
31.5250.2240.2120.3090.4490.0620.0840.105
40.4640.1460.1110.1830.4520.0540.0790.096
50.4580.1650.1070.1970.4610.0530.0740.091
60.4620.1340.0990.1670.4510.0560.0820.099
70.5120.1410.0980.1720.4620.0620.0850.105
80.4770.1370.0980.1680.4780.0680.0890.112
91.2300.2200.2250.3140.4970.0610.0870.107
Average0.8290.1670.1370.2170.4610.0600.0830.103
MAE: Mean Absolute Error; SD: Standard Deviation; RMSE: Root of Mean Square Error.
Disclaimer/Publisher’s Note: The statements, opinions and data contained in all publications are solely those of the individual author(s) and contributor(s) and not of MDPI and/or the editor(s). MDPI and/or the editor(s) disclaim responsibility for any injury to people or property resulting from any ideas, methods, instructions or products referred to in the content.

