Article

Driveway Detection for Weed Management in Cassava Plantation Fields in Thailand Using Ground Imagery Datasets and Deep Learning Models

by
Ithiphat Opasatian
1 and
Tofael Ahamed
2,*
1
Graduate School of Science and Technology, University of Tsukuba, 1-1-1 Tennodai, Tsukuba 305-8577, Japan
2
Institute of Life and Environmental Science, University of Tsukuba, 1-1-1 Tennodai, Tsukuba 305-8577, Japan
*
Author to whom correspondence should be addressed.
AgriEngineering 2024, 6(3), 3408-3426; https://doi.org/10.3390/agriengineering6030194
Submission received: 24 July 2024 / Revised: 2 September 2024 / Accepted: 10 September 2024 / Published: 18 September 2024
(This article belongs to the Special Issue The Future of Artificial Intelligence in Agriculture)

Abstract

:
Weeds reduce cassava root yields and infest furrow areas quickly. The use of mechanical weeders has been introduced in Thailand; however, manually aligning the weeders with each planting row and at headland turns is still challenging. It is critical to clear weeds on furrow slopes and driveways via mechanical weeders. Automation can support this difficult work for weed management via driveway detection. In this context, deep learning algorithms have the potential to train models to detect driveways through furrow image segmentation. Therefore, the purpose of this research was to develop an image segmentation model for automated weed control operations in cassava plantation fields. To achieve this, image datasets were obtained from various fields to aid weed detection models in automated weed management. Three models—Mask R-CNN, YOLACT, and YOLOv8n-seg—were used to construct the image segmentation model, and they were evaluated according to their precision, recall, and FPS. The results show that YOLOv8n-seg achieved the highest accuracy and FPS (114.94 FPS); however, it experienced issues with frame segmentation during video testing. In contrast, YOLACT had no segmentation issues in the video tests (23.45 FPS), indicating its potential for driveway segmentation in cassava plantations. In summary, image segmentation for detecting driveways can improve weed management in cassava fields, and the further automation of low-cost mechanical weeders in tropical climates can be performed based on the YOLACT algorithm.

1. Introduction

Cassava is an important tropical crop because it provides the third largest amount of carbohydrates among tropical-climate plants, after rice and maize [1]. However, cassava yields suffer from significant weed infestation in tropical climates. These weeds are generally unwanted plants and grow in cultivated fields. This is the main problem for cassava cultivation among farmers conducting tropical agriculture in Southeast Asia, including Thailand, Malaysia, Indonesia, and Vietnam. Weeds reduce the cassava root yield. Cassava root yields are 11–26 tons/hectare at initial weeding [2]. When weeding is not performed, the cassava yield decreases to 4 tons/hectare, a 15% decrease compared with the regular cassava root yield. If there are three rounds of weeding, the possible yield is 22.7–36.6 tons/hectare. In Thailand, cassava is produced mainly for animal feed and as a starch source. The reported cassava yield per hectare was 7510 kg in 2010 [3]. Cassava plantation can benefit low-income households in Thailand because cassava is a drought-resistant crop, whereas other cereal crops do not perform well. The soil moisture content needed to grow cassava is 1–10% below the permanent wilting point [4]. Land preparation should be performed twice before planting because it ensures that moisture is retained within the soil, which allows cassava plants to grow and survive throughout the dry season [5]. Moreover, land preparation helps eradicate weeds in the field before planting. Cassava has a cluster of fleshy, tapered roots (Figure 1). Cassava roots tend to elongate, radiate outward from the base of the stem, and form a cluster of surrounding tubers [6]. Thus, cassava roots can expand into the driveway areas of cassava planting grooves (Figure 1). Weeds disrupt cassava growth by taking water and nutrients from the cassava plant, which reduces the cassava root yield. In Thailand, cassava farmers tend to build ridges and furrows after land preparation because planting cassava on ridges increases the cassava root yield, makes the field more manageable and productive, increases the potential for work-saving mechanization, and increases cassava production compared to planting on flat ground [7].
Three types of weeds are common in cassava fields: grasses, sedges, and broadleaf weeds, as shown in Figure 2. The specific grass-type weeds in Thailand are Mission grass (Pennisetum polystachyon), Bermuda grass (Cynodon dactylon), and Cogon grass (Imperata cylindrica). The specific sedge weed type in Thailand is Java grass (Cyperus rotundus). The specific broadleaf-type weeds in Thailand are Siam weed (Chromolaena odorata), giant sensitive plant (Mimosa invisa), and coatbuttons (Tridax procumbens) [8].

1.1. Related Works

Advances have been made in computer vision technology and deep learning algorithms, which have been applied in many sectors, including agricultural machinery and crop breeding [9]. Both techniques have been applied to driveway detection and segmentation. Computer vision technology and deep learning algorithms have also been implemented in agricultural vehicles to recognize driveways and plants to address crop damage, labor shortages, and operational safety issues in agricultural sectors. Both technologies have the potential to replace conventional methods of manually driving or pushing a vehicle to the desired path, which poses a significant risk to operators. Computer vision and deep learning technologies in agriculture have significantly progressed. An increasing amount of research and development has been conducted on such technologies in recent years, as described below.
Researchers have developed Agronav, an advanced framework for autonomous navigation by agricultural robots and vehicles in the field [10]. This cutting-edge system uses semantic segmentation and semantic line detection to process input images and output the centerline, enabling seamless end-to-end vision-based navigation. Additionally, Agroscapes, a meticulously annotated dataset collected from six different crops at varying heights and angles, has been introduced. This comprehensive dataset enables the Agronav framework to be effectively trained to operate across ground and aerial robotic platforms.
Machine vision-based automatic field navigation technology has been described in previous research [11]. Vision navigation operates primarily on the basis of collected visual information. Field path information is extracted from the image to control the robot’s movement. In modern agriculture, most crops are grown in a rigid pattern. The distance between rows is relatively constant, so vision-based weeding robots usually determine the centerlines between crop rows as a guide. However, because of differences in the crop type, growth stage, lighting conditions, soil color, and other factors, quickly and accurately determining the locations of crop rows is challenging.
Researchers have also developed a vision-based navigation scheme to guide robots through row-crop fields via computer vision and signal processing techniques without manual intervention [12]. This approach uses onboard cameras to accurately follow crop rows and switch between them and it works independently of global localization or mapping. The system is designed to be deployed in fields with different canopy shapes and plants at various growth stages, making it a versatile solution for different types of crops. The system was tested under various illumination conditions on simulated and actual fields, achieving an average navigation accuracy of 3.82 cm with minimal human intervention in a four-wheel experimental robot.
The development of a robot-supervised learning system using convolutional neural networks (CNNs) to automatically generate labels for semantic segmentation for crop row detection in a field was developed in [13]. They used a training robot equipped with an RTK GNSS and an RGB camera to train a neural network, which could be used for vision-based navigation. The researchers tested the system on an agri-robot in a strawberry field and successfully trained it on crop row segmentation without the need for hand-drawn image labels. They reported that the resulting segmentation output of the CNNs was better than the noisy labels on which the system was trained. Furthermore, open-loop field trials with the agri-robot demonstrated that row following on the basis of the segmentation result is likely accurate enough for closed-loop guidance. The automatic generation of noisy segmentation labels has proven to be a promising approach for vision-based row following, as it can quickly and easily adapt to new scenes.

1.2. Objectives

There is great potential to conduct research on and develop cassava weeders to reduce the use of chemical herbicides in Thailand. Most of this technology involves manually operated mechanical machines that use disk or moldboard plows to eliminate weeds in cassava fields. A cassava field contains plants, planting rows, grooves, and headland turns. A mechanical weeder moves along the groove between two opposite rows of cassava plants, and the headland turn gives the vehicle room to turn around. The mechanical weeder moves along individual groove sections to eradicate weeds. However, farmers must manually drag the weeder to make a turn and adjust the vehicle’s position to move to the next planting groove. Therefore, the existing mechanical weeders must be converted to low-cost automated weeders to reduce the manual labor of farmers in weeding. To construct an automated weeding system, the weeder must recognize the headlands and grooves of cassava planting fields. In this regard, driveway detection is necessary for the cassava weeder to navigate inside the driveway to make weeding operations easier. Most research has focused on weed and crop classification-based weed control robots that use computer vision systems. However, to the best of our knowledge, none of the related studies mention driveway segmentation, although dense weed patches occur near driveways in cassava fields.
Ground-based image acquisition is an approach for collecting data remotely to develop datasets [14]. These datasets can be used to train a model via deep learning algorithms. A deep learning model is a neural network with many layers that can learn from large amounts of data to perform specific tasks [15]. Deep learning for driveway detection can be performed by collecting cassava plantation data, preparing the data, selecting the model, adjusting the parameters, training the model, evaluating the model, and making predictions. Ground-based image acquisition is essential because of the potential to gather detailed information about specific features or the locations of weeds and cassava plants from plantation fields and provide insights into the characteristics of each plantation. This is very important for training deep learning models with custom datasets. A deep learning model is essential because of its exceptional accuracy and high-quality results; its multilayer architecture can achieve a high level of abstraction when working with large data samples. Deep learning is increasingly popular in all fields that require information extraction from data, including driveway detection [16]. Therefore, this research aimed to create a system to detect driveways for weed control in cassava plantation grooves on the basis of ground-based image acquisition datasets. After the driveways are detected, the mechanical weeder can be automated to eradicate weeds in the furrows for the effective management of cassava plantations.

2. Materials and Methods

This study focused on detecting drivable areas in cassava fields by developing a vision-based detection system based on the following deep learning algorithms: Mask R-CNN, YOLACT, and YOLOv8n-seg. These three algorithms can be applied to recognize drivable areas in cassava fields, which supports the movement of cassava weeders in cassava planting grooves and headland turn areas. In this research, we specifically used Mask R-CNN, YOLACT, and YOLOv8n-seg because these algorithms have been highly utilized in agricultural applications and have shown high accuracy [17,18]. To achieve the desired results, several procedures are needed. The original picture datasets were extracted from recorded video and manually labeled, as described in the next section. Then, polygonal bounding boxes were used to annotate the drivable area in the cassava field, and the labeled images were split into training and validation datasets. Mask R-CNN, YOLACT, and YOLOv8n-seg were subsequently trained on the training datasets and employed to detect single-class datasets. Finally, model evaluation was performed to test the performance of the detection model (Figure 3).

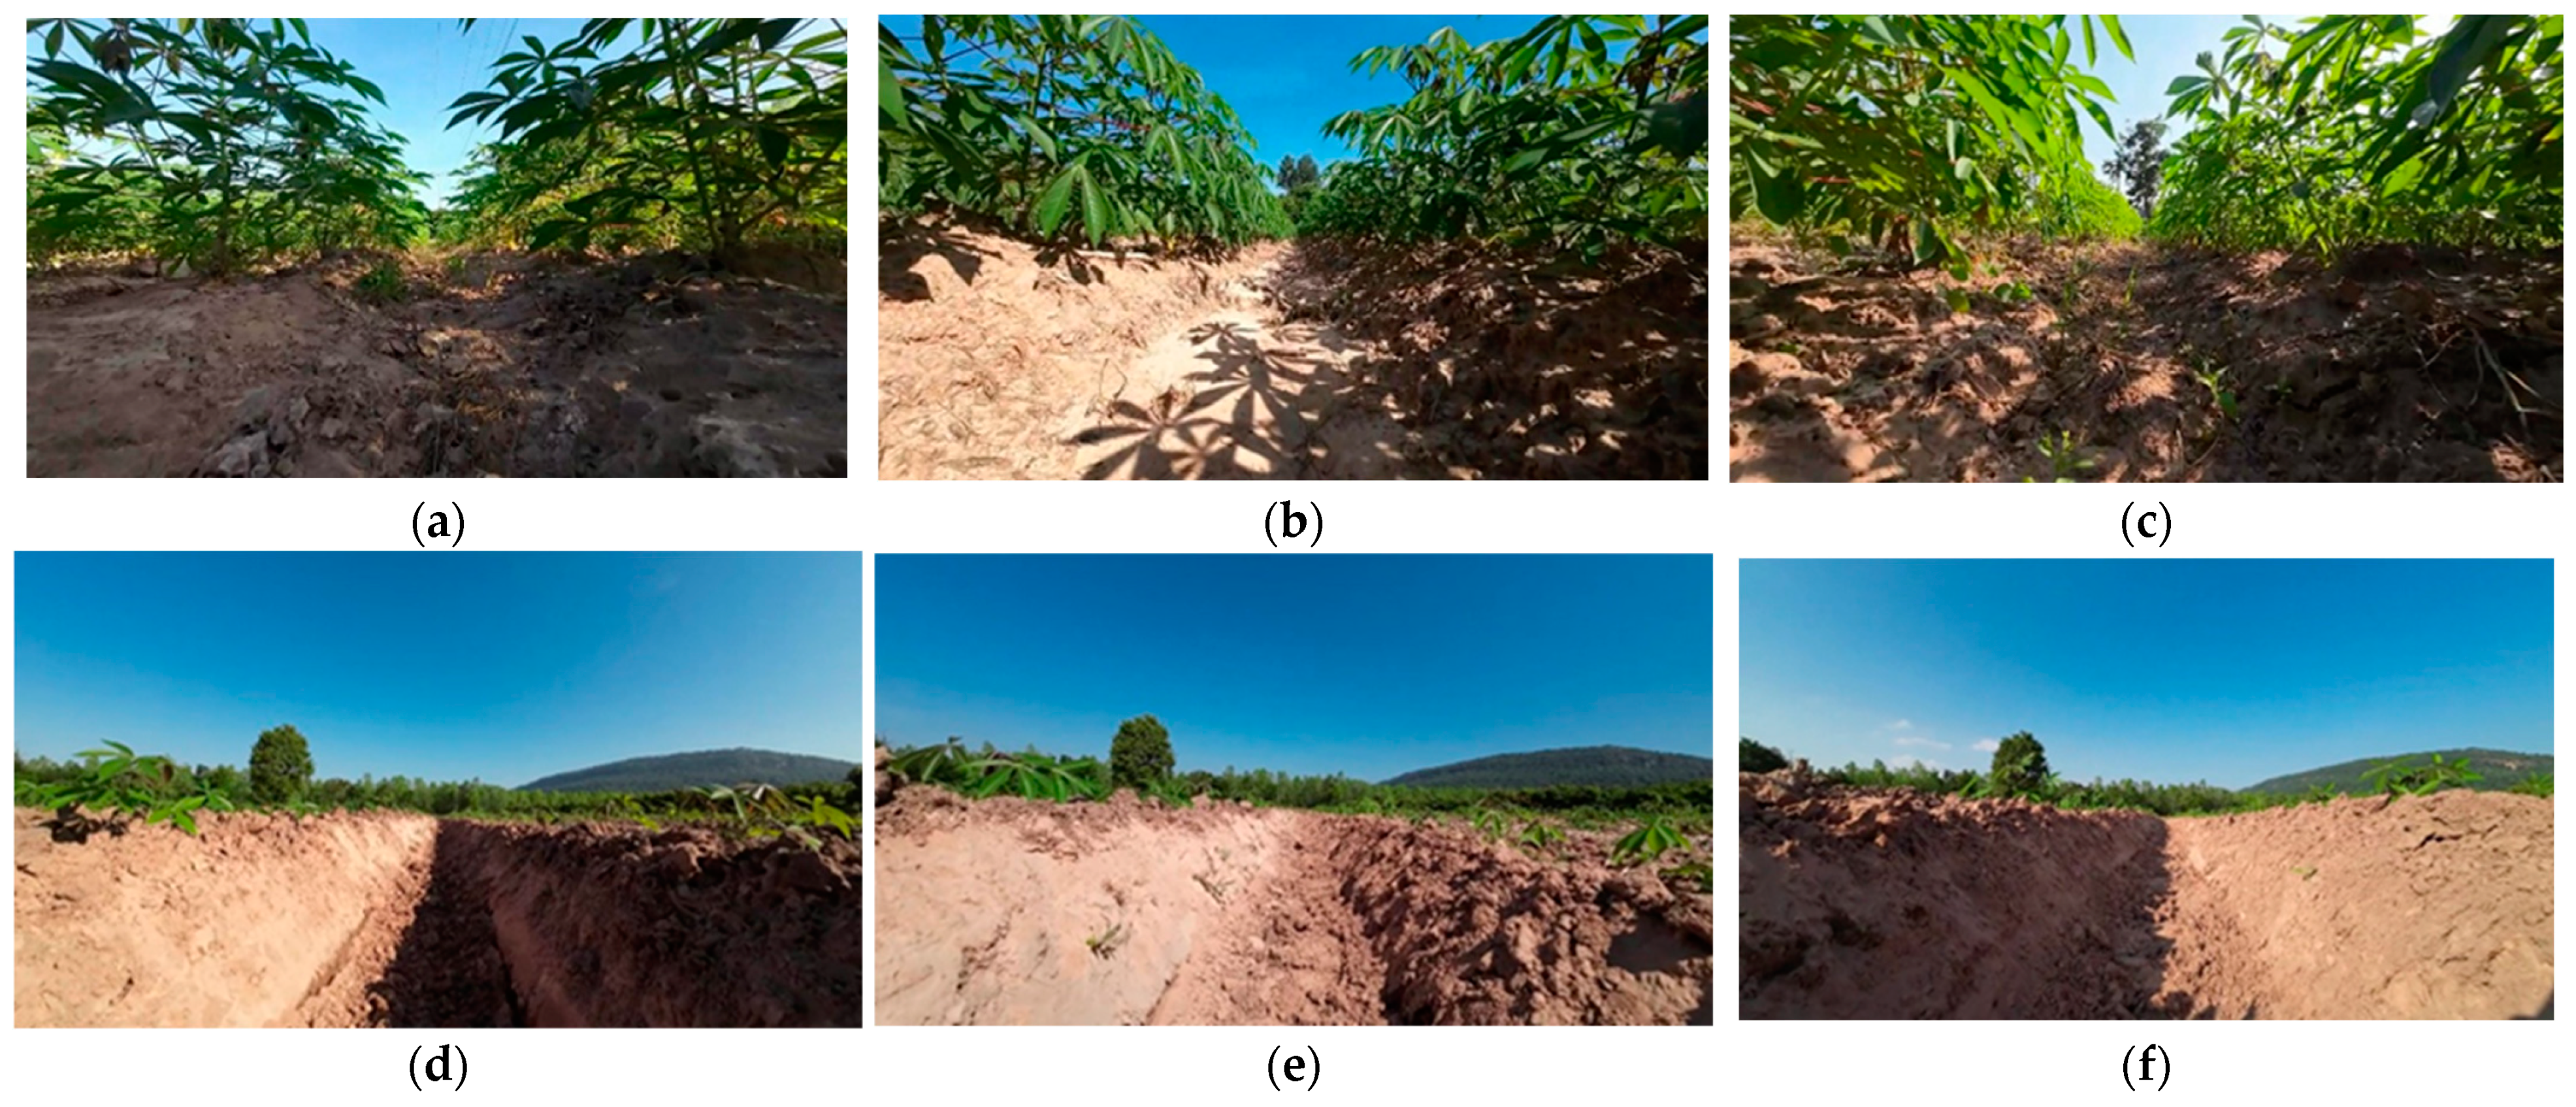
2.1. Remote Sensing-Based Ground Image Acquisition

The remote sensing-based ground image dataset for cassava planting fields was collected in northern Thailand (18.0338° N, 100.0248° E). Five fields were used to record the videos. The plants were 90 days old and 45–55 cm tall in the first field. In the second field, the plants were 110 days old and 60–70 cm tall. In the third, the trees were 60 days old and 25–35 cm tall. In the fourth field, the plants were 30 days old and 15–25 cm tall. In the fifth field, the plants were 30 days old and 15–25 cm tall. The videos were recorded three times in each field, at 8:30, 11:45, and 15:30, from 14 to 17 November 2023, using a GoPro Action camera (GoPro Inc., San Manteo, CA, USA) at a resolution of 1920 × 1080 pixels. The video was recorded from 15 cm above the ground while walking through the cassava planting grooves and headland turn sections. The data collection simulated the viewpoint of a camera attached to a cassava weeder moving along the drivable area. The image dataset, which captured the cassava planting grooves and headland turn areas, was extracted from the video; approximately 3000 pictures were obtained and saved in Joint Photographic Experts Group (JPEG) format. The images show the cassava planting grooves, headland turns, and cassava plants (Figure 4, Figure 5 and Figure 6).

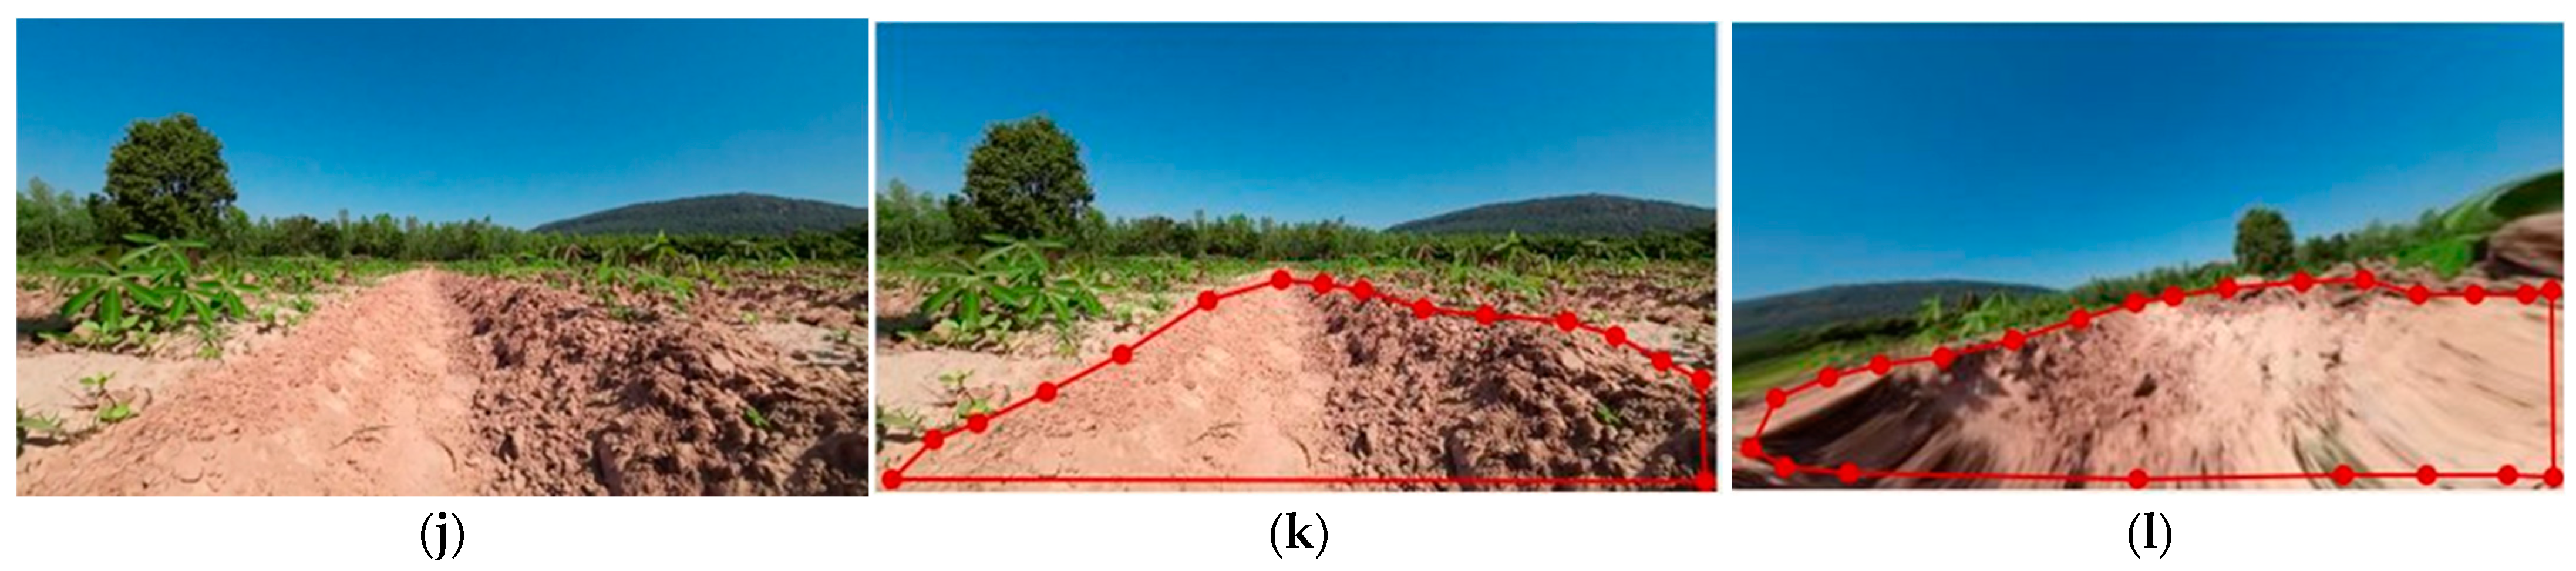
2.2. Image Dataset Development

The 3000 images were randomly selected and augmented via a Python program through flipping, cropping, and contrasting to increase the size of the dataset to 10,000 images. The newly created dataset was resized to 400 × 225 pixels to decrease the computational workload of the deep learning algorithm while training the model. Data augmentation increases the accuracy of model predictions, which is vital for cutting-edge deep learning systems. The labeling process was manually performed via Labelme® [19] (Figure 5b,c,e,f,h,i,k,l). Polygonal bounding boxes were drawn; the objects marked in red are cassava planting grooves and headland turns in the same class (i.e., “MovingPath”) because the cassava weeder moves along these two sections while operating in cassava plantations. Figure 5 and Figure 6 show examples of annotated images obtained by Mask R-CNN, YOLACT, and YOLOv8n-seg instance image segmentation. The annotated image data were saved in a JavaScript object notation (JSON) file and were later converted to different formats: Visual Geometry Group (VGG), Common Object in Context-JavaScript Object Notation (COCO-JSON), and Text File Document (TXT) for Mask R-CNN, YOLACT, and YOLOv8n-seg, respectively. Afterward, the dataset was divided into training and validation datasets with 7000 and 3000 images, respectively. Then, 100 original cassava planting groove images were selected to test the segmentation performances of the algorithms.

2.3. Network Architecture

The efficiencies of three object segmentation algorithms, Mask R-CNN, YOLACT, and YOLOv8n-seg, were compared. All three methods are image segmentation algorithms that can identify and segment individual objects in an image to provide a more detailed understanding of the image content. In the following section, the three deep learning algorithms are introduced.

2.3.1. Mask R-CNN

Mask R-CNN is an image segmentation algorithm developed from Faster R-CNN, a region-based convolutional neural network [20]. In the network structure (Figure 7), the algorithmic process is as follows:
  • The input images of dimensions 800 × 800 are processed and input into ResNet50-FPN to extract the features. ResNet50-FPN, a combination of a ResNet50 backbone and a feature pyramid network (FPN), enhances the feature extraction across multiple scales. In this process, the images are converted into a feature map of 32 × 32 × 2048 pixels;
  • The region proposal network (RPN) uses these feature maps to generate proposals or candidate bounding boxes indicating objects that may be contained in the images. The RPN then proposes potential regions of interest [21]. The ROI pooling layers extract the feature maps from the corresponding region to ensure that the feature representations for all the proposed regions have identical spatial dimensions regardless of the original sizes of the regions [22];
  • The feature map and regions of interest are sent to the ROIAlign layers to ensure that all the proposed regions have identical sizes;
  • Finally, the fixed-size feature maps are fed to two parallel branches. The first branch enters the object classification branch for class probability prediction for each proposed region. The second branch is a bounding box regression branch that refines the coordinates of the proposed bounding boxes to better fit the objects [23]. The algorithm outputs the 1152 × 1152-pixel output picture, which includes segmentation masks and bounding boxes.
Figure 7. The Mask R-CNN algorithm structure depicting the first and second stages of segmentation.
Agriengineering 06 00194 g007

2.3.2. YOLACT

You Only Look At CoefficienTs (YOLACT) is a simple single-stage, real-time image segmentation algorithm [24]. As shown in the network structure (Figure 8), the algorithmic process is as follows:
  • Images with a size of 550 × 550 pixels are input into the ResNet50-FPN backbone to extract features from the images. The YOLACT model size is 97.7 megabytes;
  • A set of prototype masks is generated by applying Protonet over the entire image;
  • A set of coefficients is predicted for each instance in the images, and the bounding boxes are predicted for object instances. Non-maximum suppression (NMS) is applied to remove duplicate or overlapping bounding boxes;
  • The instance masks are assembled by combining the corresponding coefficients and prototype masks. Then, the results are summed by cropping the images on the basis of the predicted bounding boxes, and an image containing the segmentation masks and bounding boxes with a size of 550 × 309 pixels is output [25].
Figure 8. YOLACT algorithm structure using parallel subtasks for prediction.
Agriengineering 06 00194 g008

2.3.3. YOLOv8 Instance Segmentation

YOLOv8 is an object detection model that performs instance segmentation via YOLOv8-seg, which uses the YOLACT principles for image segmentation [26]. YOLOv8-seg consists of four main parts: the input, spine, neck, and head [27]:
  • Input: Images with a size of 640 × 640 pixels are input into the CSPDarknet53 backbone to extract features from the images. The model size is 6.5 megabytes (YOLOv8n-seg) [28];
  • Spine: The spine of YOLOv8-seg extracts features via a cross-stage partial (CSP) layer called the C2f module. This cross-stage bottleneck is faster to implement than convolutional modules and combines high-level features to improve the detection accuracy. Additionally, the spatial pyramid pooling-fast (SPPF) layer and feature convolution layer, which extract features at different levels, significantly improve the model’s generalization ability;
  • Neck: the feature pyramid network (FPN) in YOLOv8-seg allows the model to leverage multiscale features to detect objects of varying sizes accurately;
  • Head: The head consists of a detection head and a segmentation head. The detection head outputs the bounding box and class label. The segmentation head consists of two parts for detection and segmentation and outputs a set of k masks and k detected objects. This head simultaneously produces different segmentation output levels inherited from the neck [29]. The segmentation results are subsequently combined to produce a single output of the segmentation process (Figure 9). The output image is 640 × 360 pixels in size.
Figure 9. The YOLOv8n-seg algorithm structure, which consists of a backbone, a neck, and a head.
Agriengineering 06 00194 g009

2.4. Systems of Network Training and Testing

The Mask R-CNN, YOLACT, and YOLOv8n-seg training networks were built on an open-source Python distribution with the environment manager Conda. Conda was installed on a computer with an Intel Core i7 9th Gen CPU, 48 GB of RAM, and an NVIDIA GeForce GTX 1660 6-GB GPU (1408 CUDA cores) running the Windows 10 64-bit operating system. In accordance with the network frameworks, Mask R-CNN implements Python with TensorFlow for training and evaluation. YOLACT uses PyTorch and Python for training and evaluation. Computer vision frameworks, including CUDA 11.8, OpenCV 4.6.0, and Ultralytics 8.1.14, were used for object segmentation via YOLOv8. YOLOv8n-seg was selected to train the model on the data because this method uses fewer computations than other variants of YOLOv8 instance segmentation. YOLOv8n-seg trains the model without greatly burdening the GPU. Table 1 shows the training configurations of Mask R-CNN, YOLACT, and YOLOv8n-seg, including the input size, batch size, epoch, decay, class number, learning rate, and momentum.

2.5. Building the Cassava Field Driveway Detection Model

The cassava plantation driveway images were divided into training and testing datasets at a 70:30 ratio. The data were manually labeled via the Labelme® program and saved in the JSON file format. For Mask R-CNN, the labeled images were merged into a single file and then converted to VGG format via a Python program to make them compatible with the Mask R-CNN network. The converted data were divided into training and validation folders. The ResNet50 backbone was utilized to train the Mask R-CNN model, producing a driveway segmentation model saved in H5 format. For YOLACT, the labeled image data were merged and converted into COCO-JSON format via Python. The ResNet50 backbone was employed to train the YOLACT model, producing a driveway detection model saved in PyTorch state dictionary (pth) format. For YOLOv8n-seg, the Labelme® format image data were converted into TXT format via Roboflow, an end-to-end computer vision platform. The data were then organized, and a YAML file was created to configure the dataset path. The YOLOv8n-seg model was trained to create the driveway segmentation model in serialized PyTorch state dictionary (pt) format.

2.6. Evaluation Metrics

The three instance segmentation models, Mask R-CNN, YOLACT, and YOLOv8n-seg, were trained and tested on the same dataset and were split into ratios of 70% for training and 30% for validation. The evaluation used AP performance metrics at different IoU thresholds [30]. The evaluation metrics were first considered: The intersection over union (IoU) measures how well the predicted mask or bounding box matches the ground-truth data. It is calculated by dividing the area of the intersection, which is the overlapped area between the predicted data and the ground-truth data, by the area of their union, which is the area enclosed by both the predicted data and ground-truth data. A higher IoU value (closer to 1.0) indicates better agreement between the predicted and ground-truth masks, suggesting a more accurate model. Second, the precision (P) was calculated from the numbers of true positives (TPs) and false positives (FPs) with a specified IoU threshold. Higher IoU values indicate true positives, whereas lower values indicate false positives. Third, the recall (R) reflects how often a machine learning model accurately identifies true positives among all the actual positive samples in a dataset. It is calculated from the numbers of true positives (TPs) and false negatives (FNs). Finally, the average precision (AP) and mean average precision (mAP) are used to evaluate the model’s performance, considering 10 IoU thresholds between 0.50 and 0.95. Precision and recall are essential for bounding boxes and segmentation masks.
To evaluate the image segmentation model, tests were conducted separately on two devices: a desktop computer used for training and a laptop computer equipped with an Intel Core i7 9th-Gen processor and 16 GB of RAM without a GPU. The evaluation compared the speed of the output generation for the video processing of each object segmentation model between the GPU-equipped computer and non-GPU computer, which was measured in terms of FPS (frames per second).

3. Results and Discussion

3.1. Image Dataset Evaluation

The image segmentation models based on Mask R-CNN, YOLACT, and YOLOv8n-seg were trained and evaluated on identical training and validation datasets. Seventy percent of the data were used to train the model, and the rest were used for validation to customize the hyperparameters during training to avoid the overfitting of [email protected] and [email protected]:0.95. The cassava plantation video and image datasets were collected, including various cassava, weed, and field patterns at various times. Obtaining more datasets would be challenging, as it would require much survey time to find suitable cassava plantations for driveway detection. This process involves observing the characteristics of each cassava field. Most cassava plantation datasets are not publicly available because some fields require farmers’ permission to record videos and collect data. Some cassava field plantations have no headland turns, making them unsuitable for use in constructing datasets for this detection system. Additionally, young cassava plants that are identical in size to weeds and grow in the same location as weeds make it difficult to distinguish between weeds and cassava plants in the field.

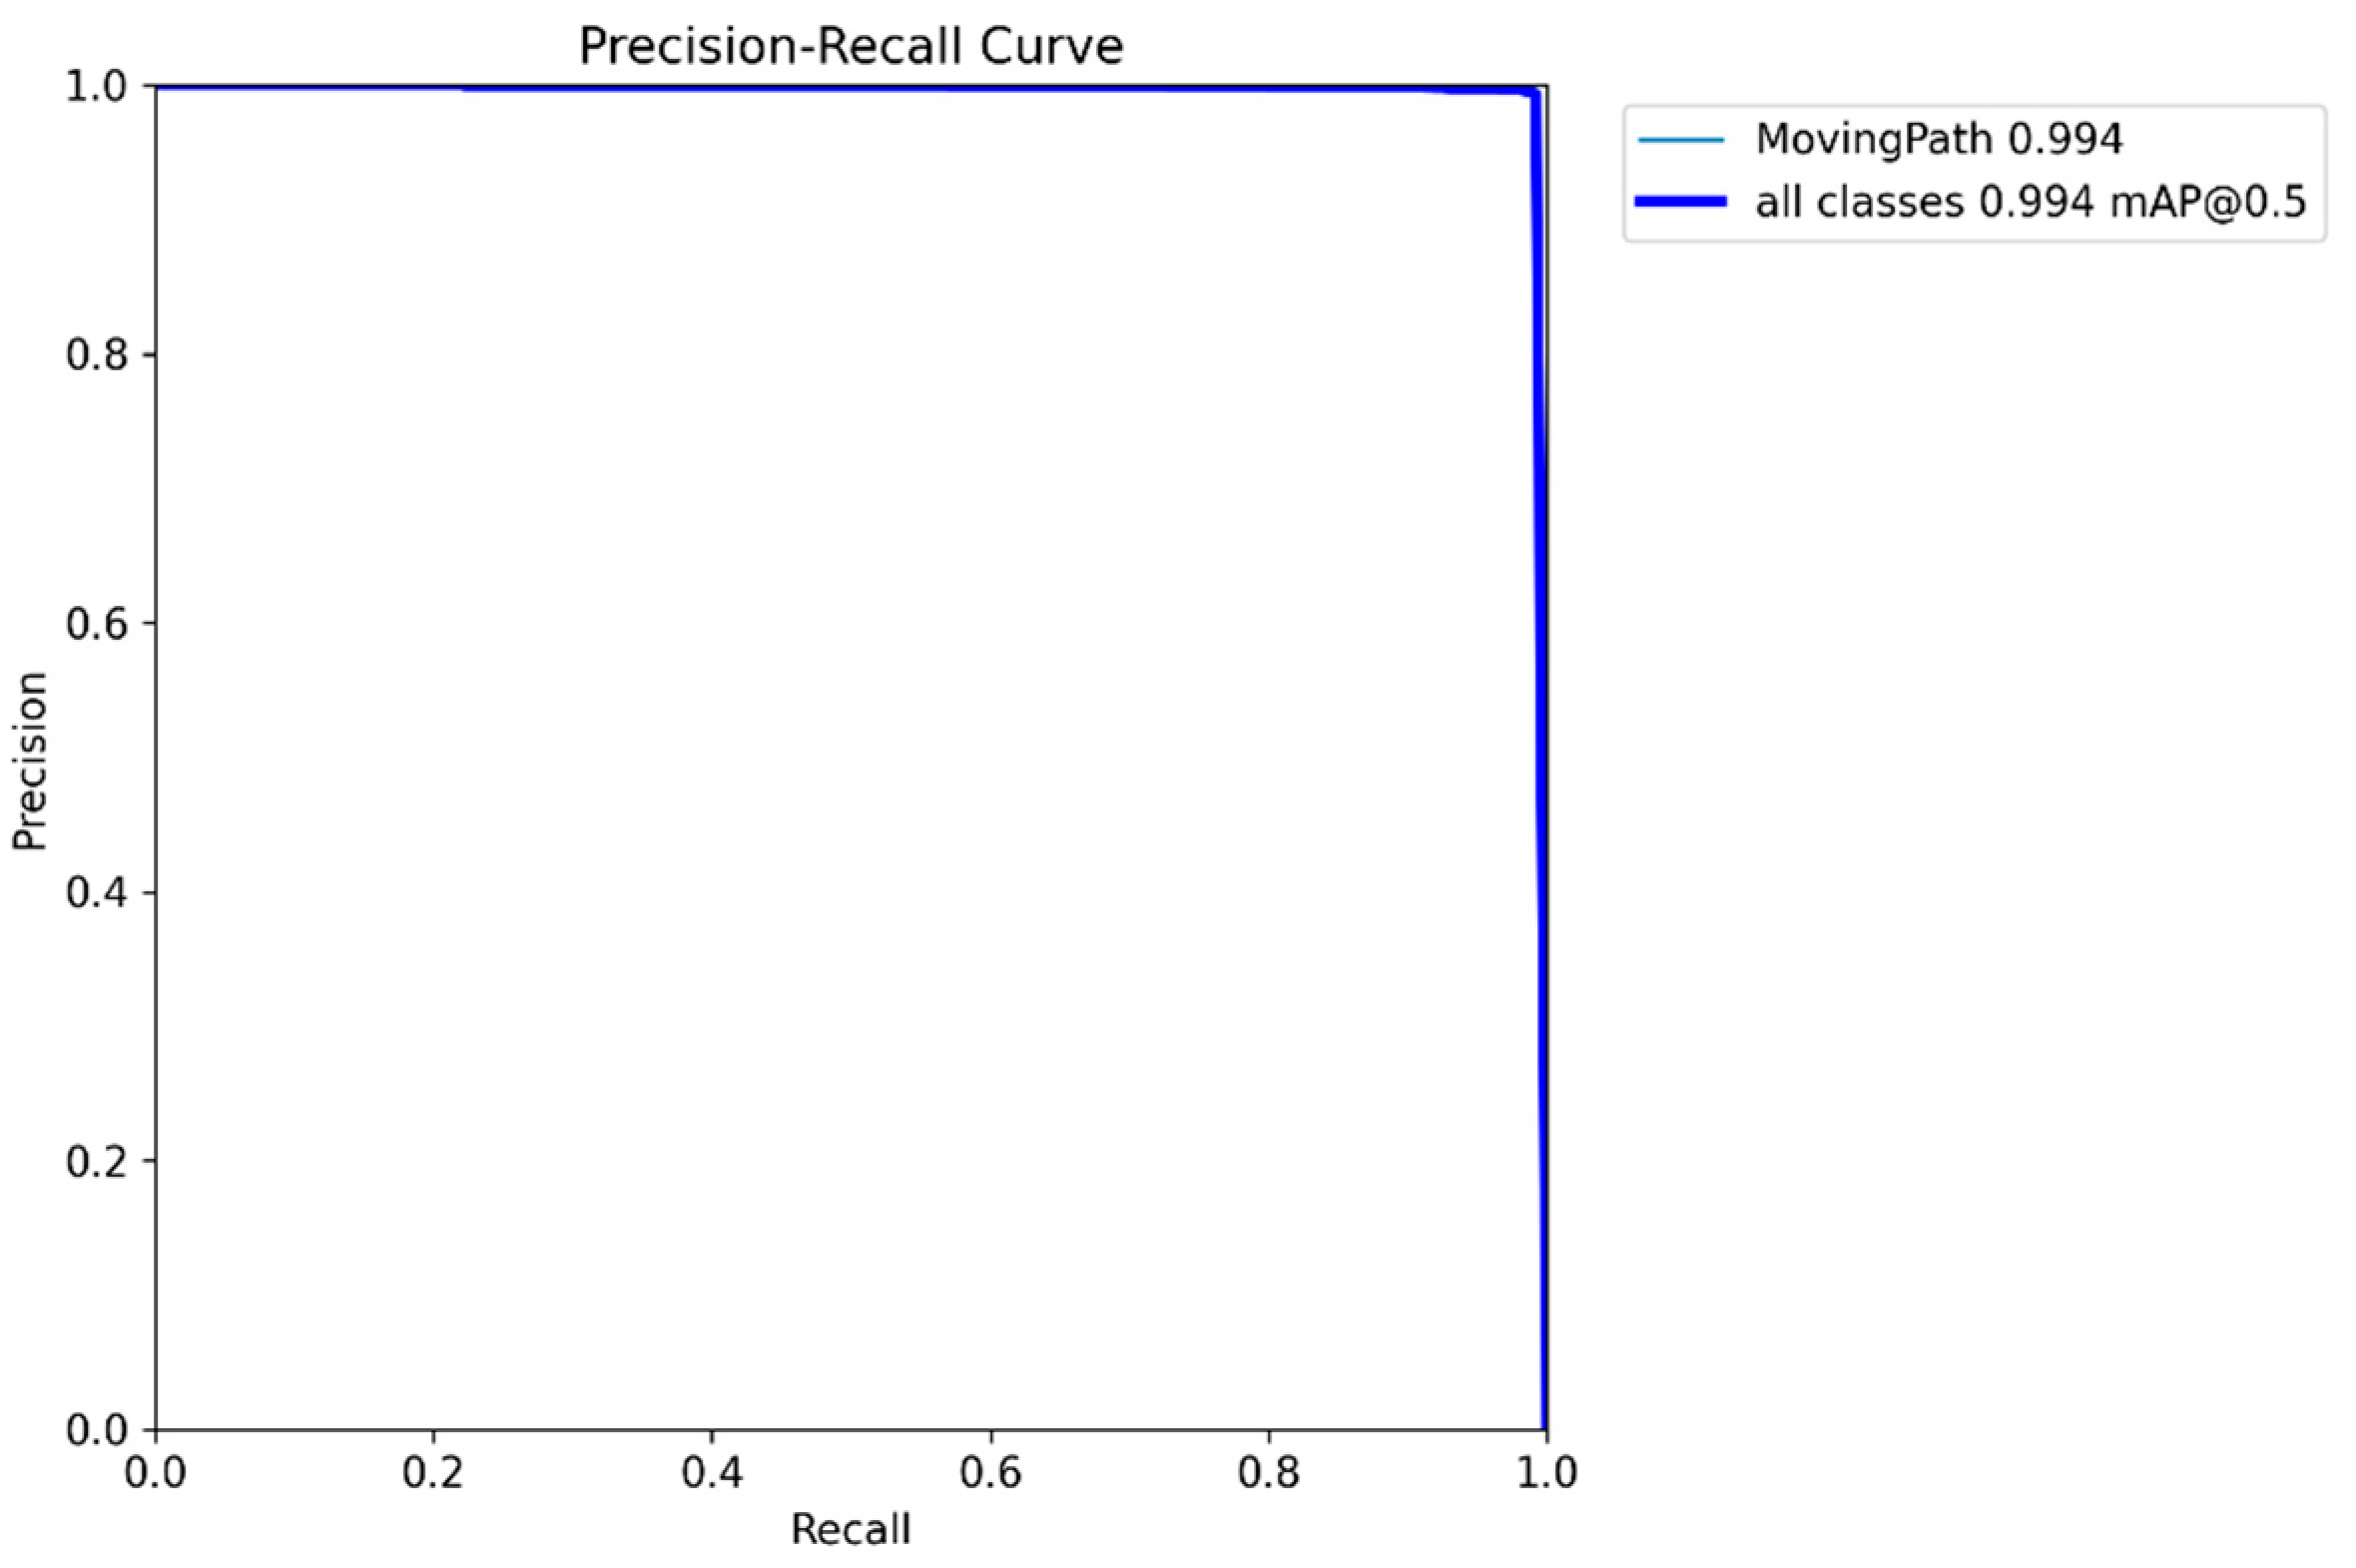
3.2. Training Performance

Overall, all the algorithms achieved good performances in the driveway segmentation tasks. As shown in Table 2, YOLOv8n-seg had the highest segmentation accuracy, followed by YOLACT and Mask R-CNN for [email protected]. For [email protected]:0.95, YOLOv8n-seg had the best results (0.793), followed by YOLACT and Mask R-CNN. These results were subsequently compared with the original mAP values of the weights pretrained on the COCO 2017 dataset as a standard benchmark to evaluate the performance of the computer vision models [31]. The cassava datasets available for public use include the Makerere University cassava image datasets, which contain images of diseased and healthy cassava leaves. However, cassava plantation groove image datasets are still not available to the public. Therefore, the original COCO 2017 mAP values were chosen to evaluate the performance of the driveway segmentation model. Mask R-CNN had slightly worse [email protected]:0.95 results than the original COCO 2017 mAP, whereas the other image segmentation algorithms had better [email protected]:0.95 results than the original COCO 2017 mAP value.
The precision–recall curves of the YOLOv8n-seg cassava driveway segmentation model were generated via [email protected] (Figure 10). These curves show a balance between the precision and recall values for different thresholds. The large area below the blue line in the precision–recall curve indicates high precision and high recall. High precision corresponds to a low false-positive rate, and high recall corresponds to a low false-negative rate [32].
The Mask R-CNN results are illustrated using a loss graph (a smaller value indicates a better model). The model was trained over 30 epochs. According to both graphs, the loss value gradually increased during data training (Figure 11). However, the loss value dropped sharply at the fifth epoch to approximately 0.24 for the bounding box loss and 0.25 for the mask loss. Then, the loss value continued to decrease until the last epoch, which can be attributed to the mask loss being slightly greater than the bounding box loss.
The mAP comparison results for mAPs at different IoU values are shown from [email protected] to [email protected] (Figure 12). According to the graph, all the mAP results for Mask R-CNN, YOLACT, and YOLOv8n-seg gradually decreased from [email protected] to [email protected]. Mask R-CNN had the lowest accuracy, which began at 0.735 at [email protected] and gradually decreased to 0 at [email protected]. YOLOv8n-seg had the highest accuracy for each mAP value among all the IoUs, which ranged from 0.994 at [email protected] to 0.1545 at [email protected]. YOLACT and YOLOv8n-seg had similar accuracy values from [email protected] to [email protected], as the slight downward pattern of the bar graph indicates. However, there was a significant decrease in the [email protected] value of YOLACT from 0.6137 to 0.3578, and the mAP value decreased to 0.042 at [email protected].
All three image segmentation models were successfully trained on a desktop computer with a discrete GPU. YOLOv8n-seg had the best training performance for [email protected] and [email protected]:0.95. The Mask R-CNN training parameters for the Kiwi fruit detection system using the ResNet50 backbone were similar to those of our driveway detection system, which yielded a high accuracy of 0.984 [33]. However, there were limitations for particular image segmentation models. In the training process for Mask R-CNN and YOLACT, the ResNet101 backbone could not be employed because of the computational capacity of the GPU. To address this, the ResNet50 backbone was used. In the case of YOLOv8n-seg, the existing library used to convert the Labelme JSON format to the TXT format could not correctly convert the complex polygonal labeling shape, so YOLOv8n-seg could not train the model. To overcome this, Roboflow web-based frameworks (available online: https://roboflow.com/, accessed on 10 May 2024) were implemented to convert the label format because Roboflow has a prebuilt image data conversion system that is fast and robust.

3.3. Testing Performance

3.3.1. Model Speed Performance

FPS values were selected as a metric to compare the model speed between desktop computers with discrete GPUs and laptop computers without discrete GPUs. The FPS values of Mask R-CNN, YOLACT, and YOLOv8n-seg were obtained by adding Python code to measure the time taken to predict each model. The code was given a 19 s sample video as input and was executed via the Anaconda command prompt to calculate the FPS value. A total of 300 separate original images were also used to evaluate the testing performance in terms of the model inference. Table 3 shows the results.
According to Table 3, YOLOv8n-seg had the highest FPS value when deployed on desktop computers with discrete GPUs and CPUs, followed by YOLACT and Mask R-CNN. Mask R-CNN had the lowest FPS value. The YOLOv8n-seg results were approximately five times and nine times better than those of YOLACT with and without a GPU, respectively. Owing to its high FPS and accuracy, YOLOv8-seg can perform real-time cassava field driveway segmentation.

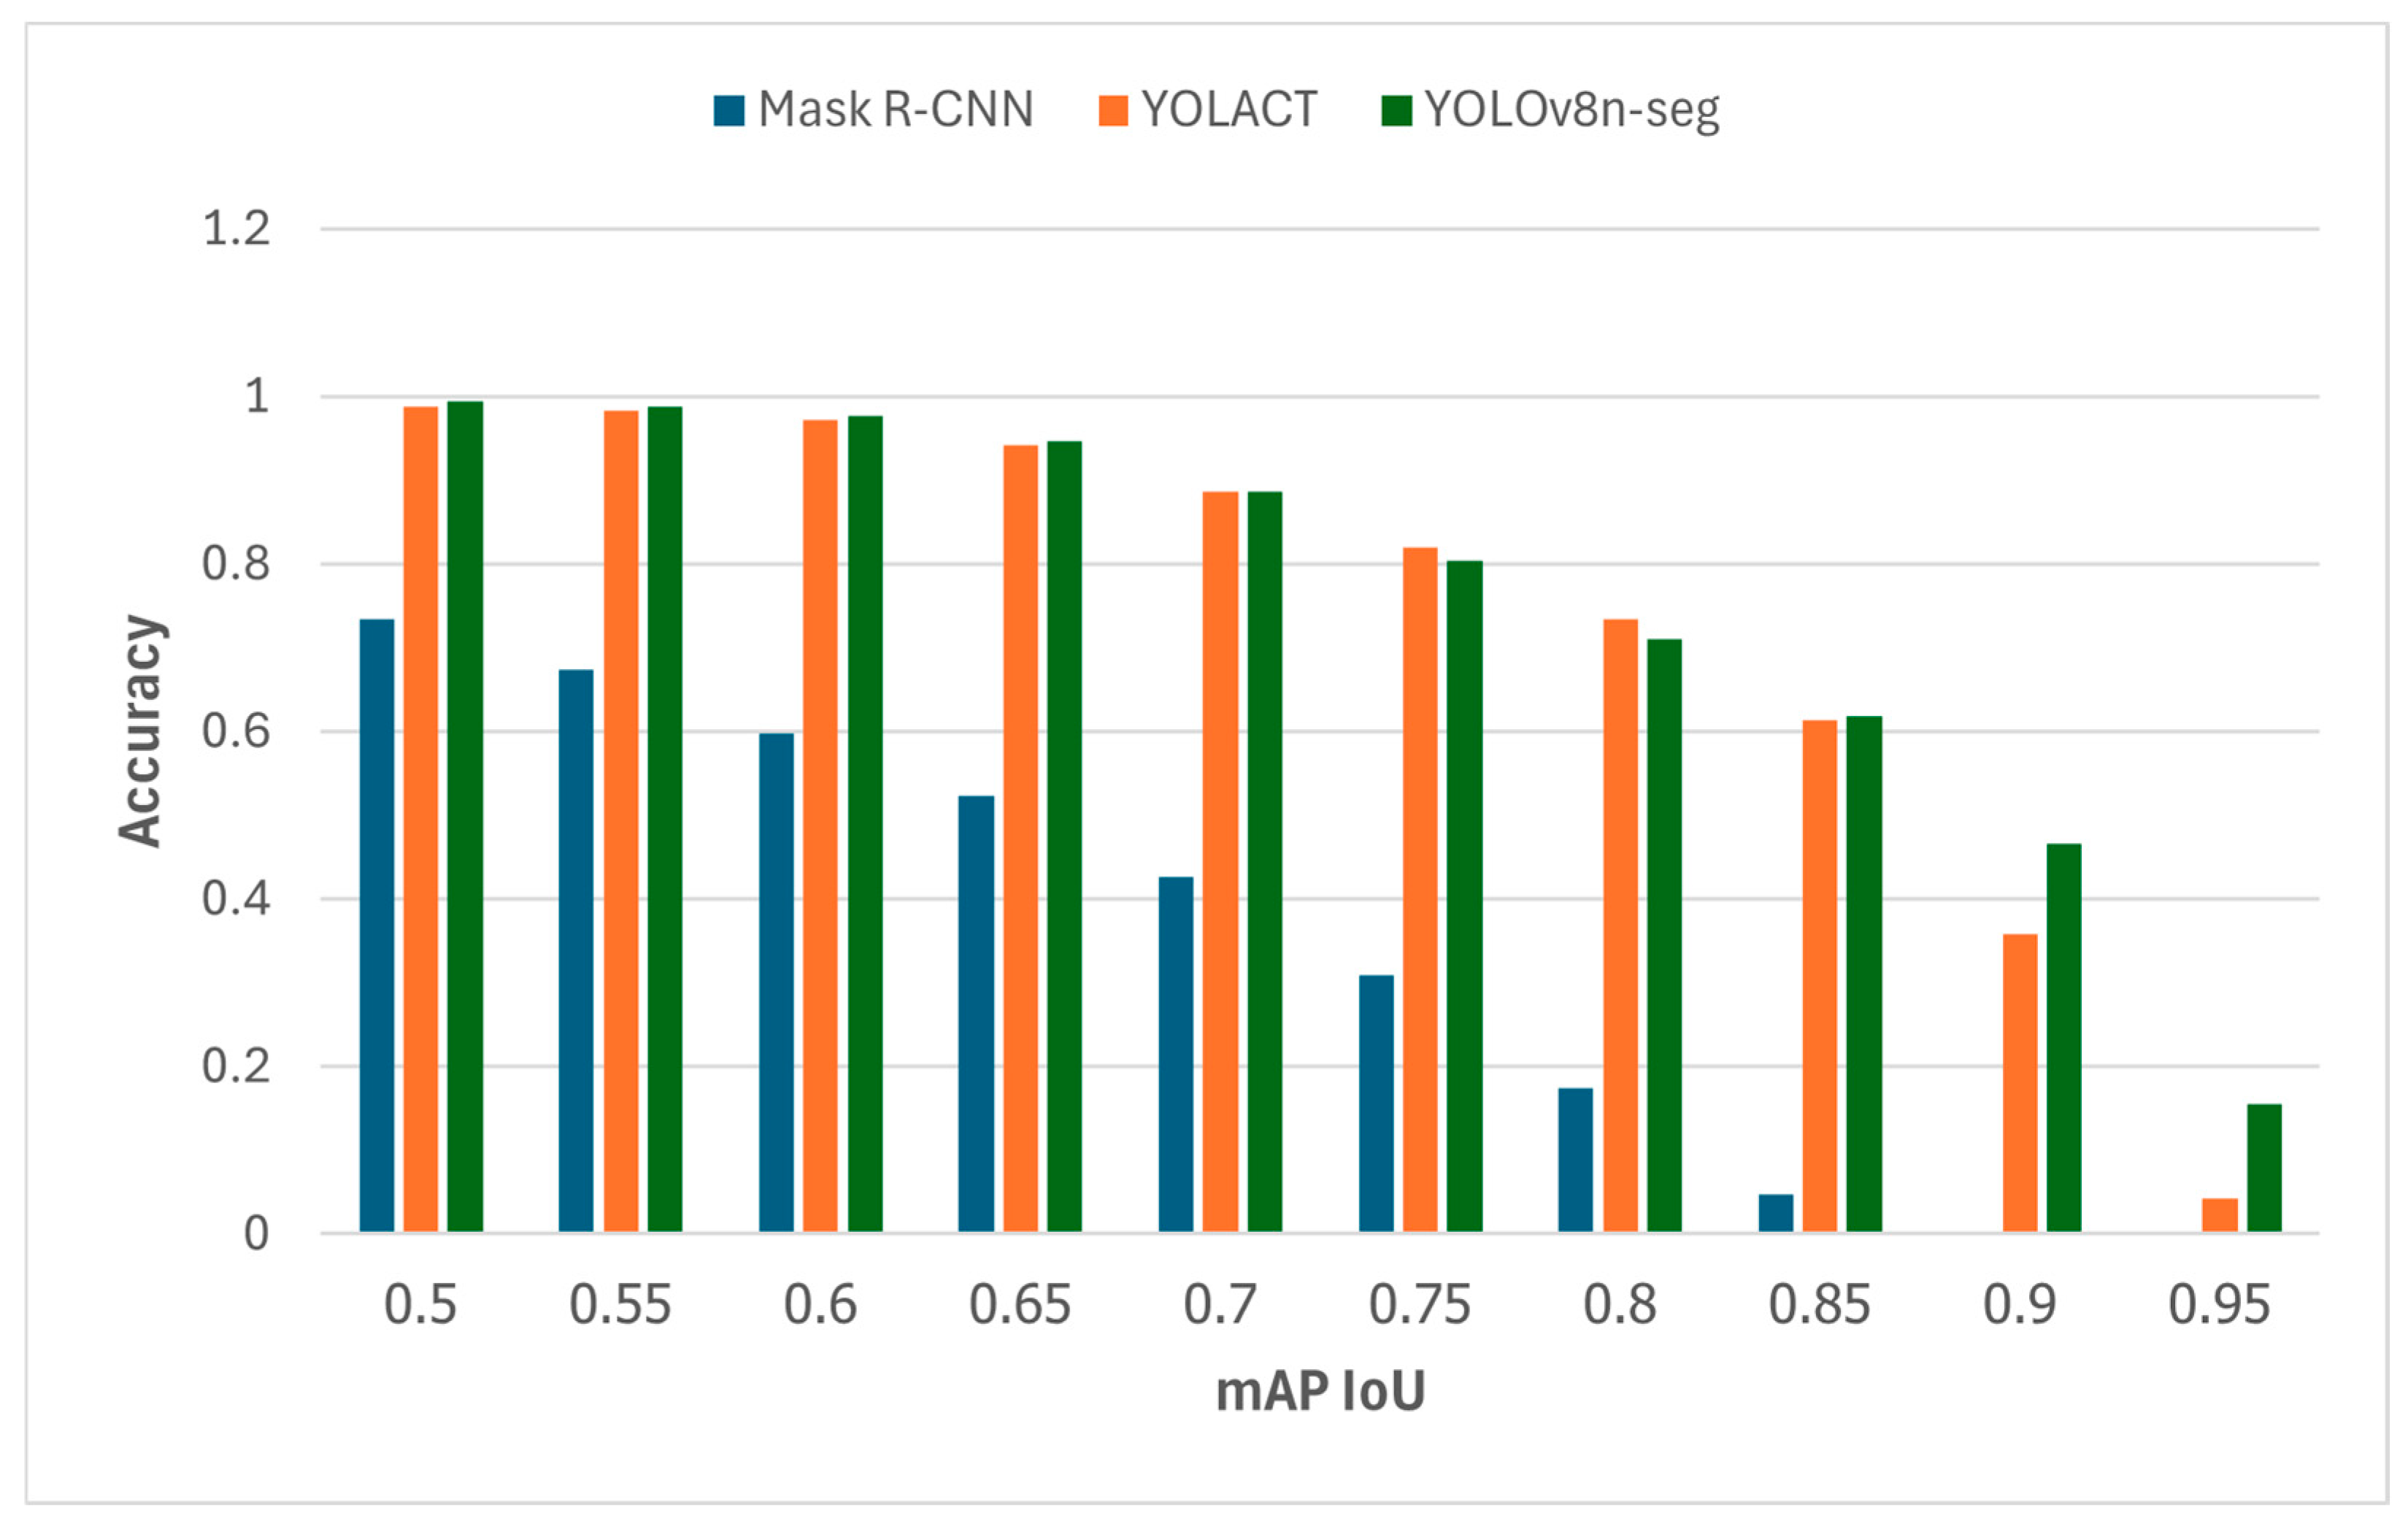
3.3.2. Model Segmentation Performance

All three segmentation models can correctly segment the cassava planting grooves in both weeded and unweeded fields (Figure 13a–i). The Mask R-CNN, YOLACT, and YOLOv8n-seg segmentation results for weeded and ridged furrows, indicated as red instance masks and bounding boxes, were correctly applied to cassava planting grooves with high segmentation probability (Figure 13a–c). Mask R-CNN, YOLACT, and YOLOv8n-seg segmentation resulted in an unweeded field with tall cassava plants, which indicated that the red masks were applied to the weed area in the cassava planting groove (Figure 13d–f). The results indicate that the segmentation accuracies of Mask R-CNN and YOLOv8n-seg were lower than that of YOLACT (Figure 13d,f). Additionally, Mask R-CNN, YOLOv8n-seg, and YOLACT could not segment the weeds on the left side of the planting groove. Figure 13g–i show the Mask R-CNN, YOLACT, and YOLOv8n-seg segmentation results for short cassava plants in a field. The segmentation masks of all the algorithms could accurately cover the cassava planting groove areas. However, the YOLOv8n-seg mask can cover a greater area than the YOLACT and Mask R-CNN masks (Figure 13i). In terms of the inference speed, YOLOv8n-seg achieved the highest FPS results, reaching 114.94 FPS on computers with discrete GPUs and 12.16 FPS on those without, outperforming YOLACT and Mask R-CNN. In a separate study, YOLACT delivered a result of 0.837 for drivable area detection on high-speed roads, which was lower than our result [34].
Mask R-CNN, YOLACT, and YOLOv8n-seg successfully segmented the headland turn section of a cassava plantation (Figure 14). Images of three types of headland turns were used to evaluate the segmentation performance of the driveway detection model: grass (Figure 14a–c), dark-colored soil (Figure 14d–f), and light-colored soil (Figure 14g–i). Figure 14a,d,g, Figure 14b,e,h, and Figure 14 c,f,i show the segmentation results of Mask R-CNN, YOLACT, and YOLOv8n-seg, respectively. Mask R-CNN more accurately segmented dark-colored headland turns than YOLACT and YOLOv8n-seg did (Figure 14d). For the grass headland turn, Mask R-CNN could segment the area more accurately than YOLACT and YOLOv8n-seg could (Figure 14a). For light-colored headland turns, Mask R-CNN and YOLOv8n-seg could apply segmentation masks that covered the area of the headland turn more completely than those of YOLACT (Figure 14g,i). However, each segmentation model has its limitations. The Mask R-CNN model struggled to segment headland turns, which are sometimes covered with grass, as shown in Figure 15a, resulting in no detection. YOLACT detected partial cassava plants and nearby cassava planting grooves, as depicted in Figure 15b. Conversely, the YOLOv8n-seg model detected two areas in a single picture because the NMS failed to eliminate overlapping detections, as shown in Figure 15c. These findings could be applied to segment driveways effectively in cassava plantations to aid weeders in navigating precisely within cassava planting grooves. However, inappropriate detection issues arose with YOLOv8n-seg during the evaluation of the segmentation model. Consequently, the YOLACT image segmentation network was found to be more suitable for weeders in driveway segmentation in cassava plantations.

3.3.3. Implementation of the Detection Results

This research aimed to obtain an automated navigation system for cassava weeders by utilizing a model trained on ground-based image datasets to segment only the drivable areas of the cassava field. Such automation would enable the weeder to move through the cassava planting field, make automatic turns at the headland, and proceed to another planting groove for unmanned weed management. The model is intended to detect cassava planting grooves and driveways and control the steering mechanism (Figure 16). By implementing driveway segmentation for weed management, the model has the potential to significantly reduce the need for manual labor in weeding operations.

4. Conclusions

Weed management, when performed manually or with mechanical weeders, is time-consuming and potentially ineffective. Therefore, a ground-based image segmentation method was developed to automate mechanical weeders to detect driveways for weed management in cassava plantations. In this context, cassava plantation datasets are greatly needed for constructing a driveway detection model. However, detecting driveways in cassava fields is challenging due to the lack of datasets available to the public. To address these challenges, this study presents a driveway segmentation method based on deep learning approaches. In this context, three image segmentation algorithms for segmenting driveways in cassava fields are presented: Mask R-CNN, YOLACT, and YOLOv8n-seg. All three used the same datasets for the training, validation, and testing. All the proposed algorithms can be deployed on a personal computer without a discrete GPU to enable cassava weeder navigation. The following conclusions are drawn from this research:
  • Dataset Construction: Images of cassava plantations were collected at various times and under various conditions. In total, 3000 images were selected from the cassava datasets, which were augmented to 10,000. The datasets were separated into training and validation sets. Afterward, the data were input into the different image segmentation algorithms for training. A separate set of 300 original images was used for evaluating the test performances of the models;
  • Driveway Detection: Drivable areas were successfully detected via the Mask R-CNN, YOLACT, and YOLOv8n-seg image segmentation algorithms. The training and test performances were assessed. YOLOv8n-seg achieved the best training performance in terms of both [email protected] and [email protected]:0.95, which were 0.994 and 0.793, respectively. YOLOv8n-seg achieved the best FPS results on computers with and without discrete GPUs: 114.94 FPS and 12.16 FPS, respectively;
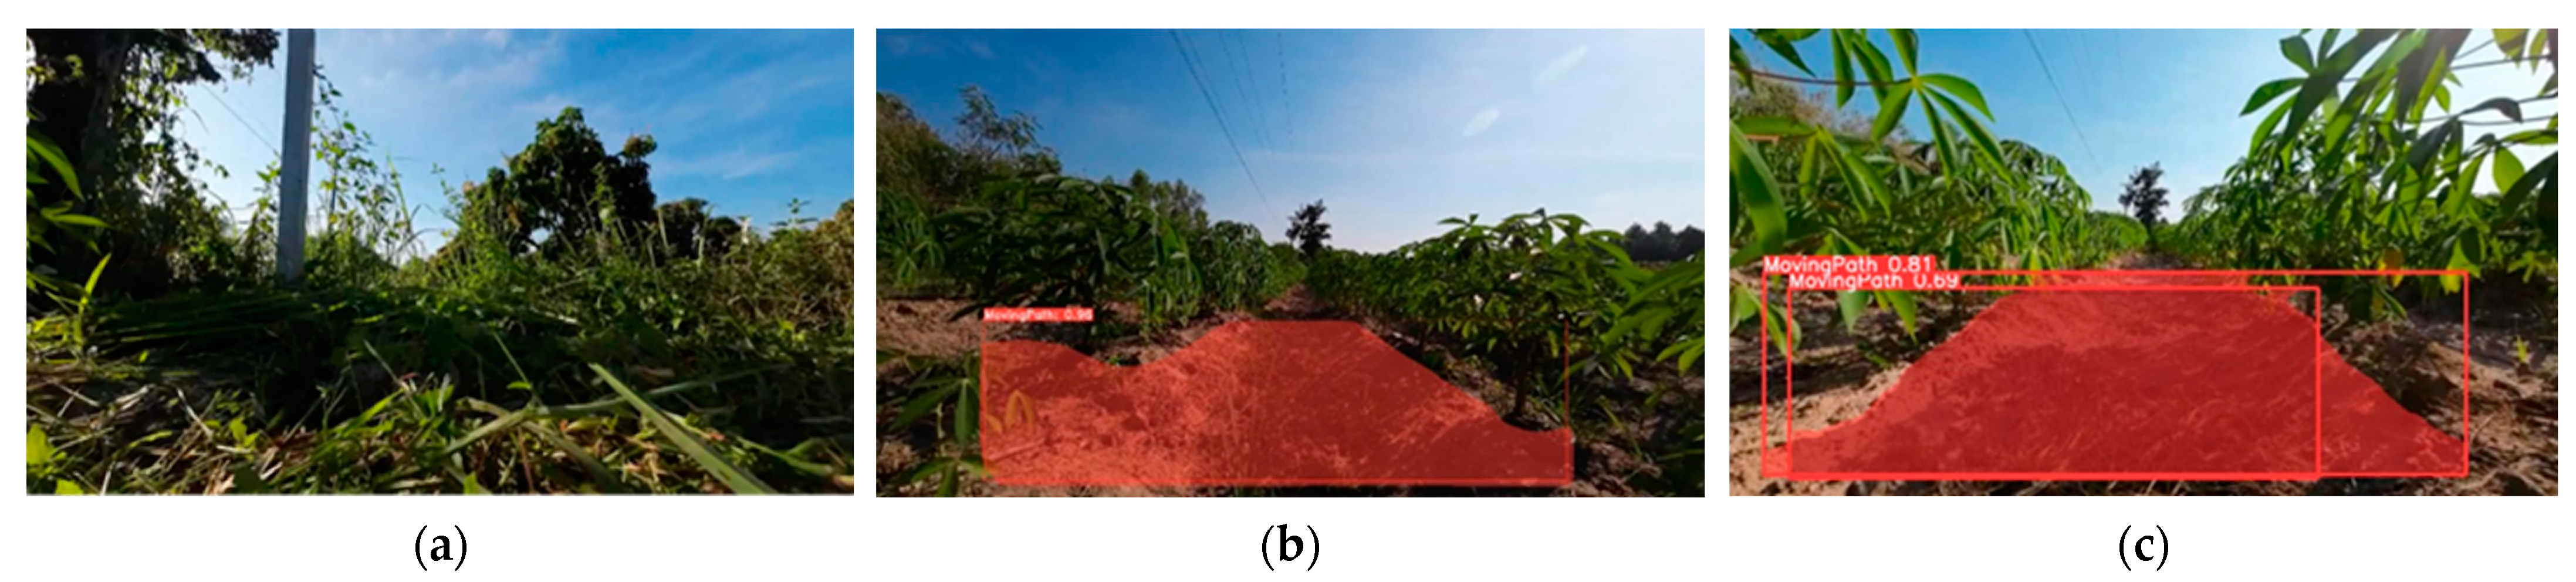
  • Segmentation Results: New results were obtained via Mask R-CNN, which had the lowest accuracy at [email protected] and resulted in inappropriate detections during testing on the video. The FPS results of all three image segmentation networks were obtained. YOLOv8n-seg obtained the best results, followed by YOLACT and Mask R-CNN. However, during testing on the video, YOLOv8n-seg yielded double detection on a single frame because NMS did not eliminate overlapping detections. Therefore, YOLACT can be implemented in driveway detection systems because this issue does not occur with it;
  • Proposed Implementation: Further research will be conducted on a ground-based image dataset with a computer vision system that uses deep learning algorithms to automatically navigate a mechanical weeder in the cassava plantation driveway of a planting groove along a headland turn for unmanned weed management.

Author Contributions

Conceptualization, T.A.; methodology, I.O.; software, I.O.; validation, I.O.; formal analysis, I.O.; investigation, I.O.; resources, T.A.; data curation, I.O.; writing—original draft preparation, I.O.; writing—review and editing, I.O.; visualization, I.O.; supervision, T.A.; project administration, T.A.; funding acquisition, T.A. All authors have read and agreed to the published version of the manuscript.

Funding

This research received no external funding.

Data Availability Statement

The dataset collected and analyzed during this study is available from the corresponding author upon reasonable request, but restrictions apply in terms of data reproduction and commercial applications because of confidentiality issues.

Acknowledgments

The authors would like to thank Chattarin Rodpol from the Computer Science Department of the University of Tsukuba for supporting this research. The authors would also like to sincerely thank Kornchanint Opasatian (Director) and Worapon Sookploy (Head Technician) of Siam Implement Co., Ltd., Thailand, for their support in collecting the initial cassava plantation videos and images from Thailand. Moreover, the authors would like to acknowledge Support for Pioneering Research Initiated by the Next Generation; SPRING (Grant Number JPMJSP2124), Research Support for providing from Japan Science and Technology Agency (JST) to support this research at the University of Tsukuba.

Conflicts of Interest

The authors declare no conflicts of interest.

References

  1. Clifton, P.; Keogh, J. Starch. In Encyclopedia of Food and Health; Elsevier: Amsterdam, The Netherlands, 2016; pp. 146–151. [Google Scholar]
  2. Khanthavong, P. Effect of Weed Biomass on Cassava Yield Related to Weeding Times. Adv. Plants Agric. Res. 2016, 5, 630–632. [Google Scholar] [CrossRef]
  3. Poramacom, N.; Ungsuratana, A.; Ungsuratana, P.; Supavititpattana, P. Cassava Production, Prices and Related Policy in Thailand. SSRN Electron. J. 2012, 3. [Google Scholar] [CrossRef]
  4. Polthanee, A.; Janthajam, C.; Promkhambu, A. Growth, Yield and Starch Content of Cassava Following Rainfed Lowland Rice in Northeast Thailand. Int. J. Agric. Res. 2014, 9, 319–324. [Google Scholar] [CrossRef]
  5. Chalachai, S.; Soni, P.; Chamsing, A.; Salokhe, V.M. A Critical Review of Mechanization in Cassava Harvesting in Thailand. Int. Agric. Eng. J. 2013, 22, 81–93. [Google Scholar]
  6. Siebers, T.; Catarino, B.; Agusti, J. Identification and Expression Analyses of New Potential Regulators of Xylem Development and Cambium Activity in Cassava (Manihot Esculenta). Planta 2016, 245, 539–548. [Google Scholar] [CrossRef] [PubMed]
  7. Ennin, S.; Otoo, E.; Tetteh, F. Ridging, a Mechanized Alternative to Mounding for Yam and Cassava Production. West Afr. J. Appl. Ecol. 2009, 15. [Google Scholar] [CrossRef]
  8. Jiamjunnunja, J.; Sarobol, E.; Vicchukit, V.; Rojanaritpichet, C.; Poolsajuan, P.; Lertmongkol, V.; Duangpatra, P. Weed Management in Cassava Plantation; Department of Agronomy, Faculty of Agriculture, Kasetsart University: Bangkok, Thailand, 1999. [Google Scholar]
  9. Wang, X.; Zeng, H.; Lin, L.; Huang, Y.; Lin, H.; Que, Y. Deep Learning-Empowered Crop Breeding: Intelligent, Efficient and Promising. Front. Plant Sci. 2023, 14, 1260089. [Google Scholar] [CrossRef]
  10. Panda, S.K.; Lee, Y.; Jawed, M.K. Agronav: Autonomous Navigation Framework for Agricultural Robots and Vehicles Using Semantic Segmentation and Semantic Line Detection. In Proceedings of the 2023 IEEE/CVF Conference on Computer Vision and Pattern Recognition Workshops (CVPRW), Vancouver, BC, Canada, 18–22 June 2023. [Google Scholar] [CrossRef]
  11. Li, Y.; Guo, Z.; Shuang, F.; Zhang, M.; Li, X. Key Technologies of Machine Vision for Weeding Robots: A Review and Bench-mark. Comput. Electron. Agric. 2022, 196, 106880. [Google Scholar] [CrossRef]
  12. Ahmadi, A.; Halstead, M.; McCool, C. Towards Autonomous Visual Navigation in Arable Fields. In Proceedings of the 2022 IEEE/RSJ International Conference on Intelligent Robots and Systems (IROS), Kyoto, Japan, 23–27 October 2022. [Google Scholar] [CrossRef]
  13. Bakken, M.; Ponnambalam, V.R.; Moore, R.J.D.; Gjevestad, J.G.O.; From, P.J. Robot-Supervised Learning of Crop Row Seg-mentation. In Proceedings of the 2022 IEEE/RSJ International Conference on Intelligent Robots and Systems (IROS), Kyoto, Japan, 23–27 October 2022. [Google Scholar] [CrossRef]
  14. Casagli, N.; Morelli, S.; Frodella, W.; Intrieri, E.; Tofani, V. TXT-Tool 2.039-3.2 Ground-Based Remote Sensing Techniques for Landslides Mapping, Monitoring and Early Warning. In Landslide Dynamics: ISDR-ICL Landslide Interactive Teaching Tools; Springer: Cham, Switzerland, 2018; pp. 255–274. [Google Scholar]
  15. Martí-Juan, G.; Sanroma-Guell, G.; Piella, G. A Survey on Machine and Statistical Learning for Longitudinal Analysis of Neuroimaging Data in Alzheimer’s Disease. Comput. Methods Programs Biomed. 2020, 189, 105348. [Google Scholar] [CrossRef]
  16. Piccialli, F.; Di Somma, V.; Giampaolo, F.; Cuomo, S.; Fortino, G. A Survey on Deep Learning in Medicine: Why, How and When? Inf. Fusion 2021, 66, 111–137. [Google Scholar] [CrossRef]
  17. Sapkota, R.; Ahmed, D.; Karkee, M. Comparing YOLOv8 and Mask R-CNN for Instance Segmentation in Complex Orchard Environments. Artif. Intell. Agric. 2024, 13, 84–99. [Google Scholar] [CrossRef]
  18. Sharma, J.; Kumar, D.; Chattopadhay, S.; Kukreja, V.; Verma, A. Automated Detection of Wheat Powdery Mildew Using YOLACT Instance Segmentation. In Proceedings of the 2024 11th International Conference on Reliability, Infocom Technologies and Optimization (Trends and Future Directions) (ICRITO), Noida, India, 14–15 March 2024; pp. 1–4. [Google Scholar] [CrossRef]
  19. Wada, K. Image Polygonal Annotation with Python [Computer Software]. Available online: https://zenodo.org/records/5711226 (accessed on 14 June 2024).
  20. He, K.; Gkioxari, G.; Dollar, P.; Girshick, R. Mask R-CNN. In Proceedings of the 2017 IEEE International Conference on Computer Vision (ICCV), Venice, Italy, 22–29 October 2017. [Google Scholar] [CrossRef]
  21. Deng, H.; Ergu, D.; Liu, F.; Ma, B.; Cai, Y. An Embeddable Algorithm for Automatic Garbage Detection Based on Complex Marine Environment. Sensors 2021, 21, 6391. [Google Scholar] [CrossRef] [PubMed]
  22. Ahmed, B.; Gulliver, T.A.; alZahir, S. Image Splicing Detection Using Mask-RCNN. Signal Image Video Process. 2020, 14, 1035–1042. [Google Scholar] [CrossRef]
  23. Wang, S.; Sun, G.; Zheng, B.; Du, Y. A Crop Image Segmentation and Extraction Algorithm Based on Mask RCNN. Entropy 2021, 23, 1160. [Google Scholar] [CrossRef]
  24. Bolya, D.; Zhou, C.; Xiao, F.; Lee, Y.J. YOLACT: Real-Time Instance Segmentation. In Proceedings of the 2019 IEEE/CVF International Conference on Computer Vision (ICCV), Seoul, Republic of Korea, 27 October–2 November 2019. [Google Scholar] [CrossRef]
  25. Zheng, J.; Zheng, J.; Zhang, S.; Yu, H.; Kong, L.; Zhigang, D. Segmentation Method for Whole Vehicle Wood Detection Based on Improved YOLACT Instance Segmentation Model. IEEE Access 2023, 11, 81434–81448. [Google Scholar] [CrossRef]
  26. Zhao, X.; Ding, W.; An, Y.; Du, Y.; Yu, T.; Li, M.; Tang, M.; Wang, J. Fast Segment Anything. arXiv 2023. [Google Scholar] [CrossRef]
  27. Lyu, Z.; Lu, A.; Ma, Y. Improved YOLOV8-SEG Based on Multiscale Feature Fusion and Deformable Convolution for Weed Precision Segmentation. Appl. Sci. 2024, 14, 5002. [Google Scholar] [CrossRef]
  28. Yue, X.; Qi, K.; Na, X.; Zhang, Y.; Liu, Y.; Liu, C. Improved YOLOV8-SEG Network for Instance Segmentation of Healthy and Diseased Tomato Plants in the Growth Stage. Agriculture 2023, 13, 1643. [Google Scholar] [CrossRef]
  29. Sampurno, R.M.; Liu, Z.; Abeyrathna, R.M.R.D.; Ahamed, T. Intrarow Uncut Weed Detection Using You-Only-Look-Once Instance Segmentation for Orchard Plantations. Sensors 2024, 24, 893. [Google Scholar] [CrossRef]
  30. Corrigan, B.C.; Tay, Z.Y.; Konovessis, D. Real-Time Instance Segmentation for Detection of Underwater Litter as a Plastic Source. J. Mar. Sci. Eng. 2023, 11, 1532. [Google Scholar] [CrossRef]
  31. Solawetz, J. An Introduction to the COCO Dataset. Roboflow, 18 October 2020. [Google Scholar]
  32. Fabian, P.; Gaël, V.; Alexandre, G.; Vincent, M.; Bertrand, T.; Olivier, G.; Mathieu, B.; Peter, P.; Ron, W.; Vincent, D.; et al. Scikit-Learn: Machine Learning in Python. J. Mach. Learn. Res. 2011, 12, 2825–2830. [Google Scholar]
  33. Ulutas, E.G.; Altin, C. Kiwi Fruit Detection with Deep Learning Methods. Int. J. Adv. Nat. Sci. Eng. Res. 2023, 7, 39–45. [Google Scholar] [CrossRef]
  34. Wang, G.; Zhang, B.; Wang, H.; Xu, L.; Li, Y.; Liu, Z. Detection of the Drivable Area on High-Speed Road via YOLACT. Signal Image Video Process. 2022, 16, 1623–1630. [Google Scholar] [CrossRef]
Figure 1. Side view of the cassava plantation structure in the intrarow area of the field, with the grooves between two cassava plants shown on the left and right.
Agriengineering 06 00194 g001
Figure 2. Pictures (af) indicate weeds growing on the cassava plantation.
Agriengineering 06 00194 g002
Figure 3. Image acquisition process for driveway identification in cassava fields and development of the segmentation system.
Agriengineering 06 00194 g003
Figure 4. Cassava planting groove images were obtained at different times of the day (times are given in Thailand Standard Time (THA)). (a) Cassava planting groove at 8:30; (b) cassava planting groove at 11:45; (c) cassava planting groove at 15:30; (d) weeded cassava planting groove at 8:30; (e) weeded cassava planting groove at 11:45; (f) weeded cassava planting groove at 15:30.
Agriengineering 06 00194 g004
Figure 5. Examples of cassava plantation groove datasets: (a,d,g,j) original images before augmentation; (b,e,h,k) original images labeled with Labelme; (c,f,i,l) augmented images labeled with Labelme. The area inside the red dotted line is annotated as a moving path.
Agriengineering 06 00194 g005aAgriengineering 06 00194 g005b
Figure 6. Examples of cassava plantation headland turn datasets: (a,d,g,j) original images before augmentation; (b,e,h,k) original images labeled with Labelme; (c,f,i,l) augmented images labeled with Labelme. The area inside the red dotted line is annotated as a moving path.
Agriengineering 06 00194 g006
Figure 10. Precision–recall curve validation graph for YOLOv8n-seg at [email protected].
Agriengineering 06 00194 g010
Figure 11. Bounding box loss (a) and mask loss (b) of Mask R-CNN.
Agriengineering 06 00194 g011
Figure 12. Bar graph comparing the mAP values of Mask R-CNN, YOLACT, and YOLOv8n-seg.
Agriengineering 06 00194 g012
Figure 13. Sample driveway segmentation results of Mask R-CNN (a,d,g), YOLACT (b,e,h), and YOLOv8n-seg (c,f,i) on three types of planting grooves in the cassava plantation.
Agriengineering 06 00194 g013
Figure 14. Driveway segmentation results of Mask R-CNN (a,d,g), YOLACT (b,e,h), and YOLOv8n-seg (c,f,i) for three types of headland turn areas in a cassava plantation.
Agriengineering 06 00194 g014
Figure 15. Limitations of (a) Mask-RCNN, (b) YOLACT, and (c) YOLOv8n-seg in cassava driveway segmentation.
Agriengineering 06 00194 g015
Figure 16. Three-dimensional diagram of the implementation of segmentation models for automatic driveway detection to enable weed management in cassava fields.
Agriengineering 06 00194 g016
Table 1. Training configurations of all image segmentation algorithms.
ModelInput SizeBatch SizeEpochDecayClassLearningMomentum
Mask R-CNN800 × 8002300.000110.0010.9
YOLACT550 × 5508110.000510.0010.9
YOLOv8n-seg640 × 64021090.000510.0010.937
Table 2. Accuracy performances of all the segmentation models when using [email protected] and [email protected]:0.95.
No.ModelBackboneOriginal mAP of Weights Pretrained on COCO 2017[email protected][email protected]:0.95
1Mask R-CNNResNet500.3610.7350.349
2YOLACTResNet500.2980.9880.733
3YOLOv8n-segCSPDarknet530.3670.9940.793
Table 3. FPS results of the segmentation model between the GPU and CPU computers.
DevicesMask R-CNNYOLACTYOLOv8n-seg
GPUs1.92 FPS23.45 FPS114.94 FPS
CPUs0.38 FPS1.49 FPS12.16 FPS
Disclaimer/Publisher’s Note: The statements, opinions and data contained in all publications are solely those of the individual author(s) and contributor(s) and not of MDPI and/or the editor(s). MDPI and/or the editor(s) disclaim responsibility for any injury to people or property resulting from any ideas, methods, instructions or products referred to in the content.

