Article

Development of Pear Pollination System Using Autonomous Drones

1
Nippon Institute of Technology, 1-4 Gakuendai, Miyashiro-cho Sitama 345-8501, Japan
2
Faculty of Science and Engineering, Doshisha University, 1-3 Tataramiyakodani, Kyotanabe-shi, Kyoto 610-0394, Japan
3
Saitama Agricultural Technology Research Center (Kuki Proving Ground), 9-1 Kuki-shi, Sitama 346-0037, Japan
4
Faculty of Agriculture, Tottori University, Minami 4-101, Koyama-cho, Tottori-shi, Tottori 680-8553, Japan
*
Author to whom correspondence should be addressed.
AgriEngineering 2025, 7(3), 68; https://doi.org/10.3390/agriengineering7030068
Submission received: 13 January 2025 / Revised: 26 February 2025 / Accepted: 3 March 2025 / Published: 5 March 2025

Abstract

:
Stable pear cultivation relies on cross-pollination, which typically depends on insects or wind. However, natural pollination is often inconsistent due to environmental factors such as temperature and humidity. To ensure reliable fruit set, artificial pollination methods such as wind-powered pollen sprayers are widely used. While effective, these methods require significant labor and operational costs, highlighting the need for a more efficient alternative. To address this issue, this study aims to develop a fully automated drone-based pollination system that integrates Artificial Intelligence (AI) and Unmanned Aerial Vehicles (UAVs). The system is designed to perform artificial pollination while maintaining conventional pear cultivation practices. Demonstration experiments were conducted to evaluate the system’s effectiveness. Results showed that drone pollination achieved a fruit set rate comparable to conventional methods, confirming its feasibility as a labor-saving alternative. This study establishes a practical drone pollination system that eliminates the need for wind, insects, or human labor. By maintaining traditional cultivation practices while improving efficiency, this technology offers a promising solution for sustainable pear production.

1. Introduction

This paper presents a study of pollination technology in pear cultivation, focusing on pollination methods utilizing Artificial Intelligence (AI) and Unmanned Aerial Vehicles (UAVs, commonly known as drones). Since pollination plays a vital role in reproductive success, maintenance of genetic diversity, and evolutionary adaptation, different plant species use different pollination methods that work best for them. This study developed an artificial pollination system based on conventional methods suitable for pear pollination.
In general, plants are pollinated when pollen from the stamen attaches to the pistil to produce seeds or fruit. Some plants are “self-pollinated”; for example, the typical self-pollinated tomato has a pair of stamens and pistils that vibrate and pollinate when wind or insects (such as bees) stop them [1,2]. In other words, in self-pollination, pollen is transferred within the same plant. Fruit trees, on the other hand, are “cross-pollinated. In other pollination types, pollen from other flowers is necessary for pollination between different individuals. In the case of pears, which were the subject of this study, many varieties are self-incompatible [3,4]; therefore, pollen from the same variety cannot produce fruit. Thus, when natural pollination is used, it is necessary to plant pollinator trees (pollen-providing varieties) near the target pollinator trees to create an environment where pollen is easily carried by the wind and insects such as bees, butterflies, and beetles. However, pear pollen is highly viscous, and stable pollination cannot be achieved using the wind-borne method. Additionally, when insects are used as vectors, pear flowering occurs in early April, which is in the spring, when the temperature is low, and the humidity is unstable due to rainfall and other factors, causing insects to be inactive, resulting in inconsistent pollination and fruiting. These challenges are essential for growers who aim for stable harvests. Therefore, growers rely on artificial pollination as a reliable means of stabilizing fruit sets. Artificial pollination requires the grower to collect and prepare pollen. For example, in collecting pear pollen, a stepladder is used to collect whole branches of pears and their flower clusters at high elevations. Only the flower cluster is collected from the branch, and after drying, pollen is collected from the stamens. Therefore, pollen collection is laborious and time-consuming. The collected pollen is pollinated by hand using a pollen-attached Brahma or writing brush, as shown in Figure 1, or by artificial pollination using a wind pollinator (pollen sprayer) as a reliable means of stabilizing the fruit set [5,6,7]; however, artificial pollination presents two main challenges.
(A)
Pollination labor issues:
Pollination work demands a large workforce and long hours of intensive labor, which, like pollen collection, involves using stepladders to approach and spray flower clusters at high elevations.
(B)
Pollination work period issues:
The best time for pollination is approximately one or two days in early April and must be completed quickly.
(A) requires labor-saving improvements such as shorter working hours and reduced labor to lower operational costs. (B) is related to labor and time reduction in (A) and requires the efficient completion of pollination work within a limited timeframe. Furthermore, it is necessary to obtain highly accurate fruiting results in such a short period. This is because it is challenging to cover domestic production using the amount of pollen collected in Japan [8,9]. As a result, the proportion of imported pollen has increased in recent years. However, imported pollen is expensive, and if a disease outbreak is confirmed in an exporting country, pollen imports are suspended. To solve these problems, efforts are being made to increase the amount of pollen collected and strengthen domestic supply and demand systems. For example, a related study has proposed a method for collecting the maximum amount of pollen by analyzing the distribution of flowers on a branch using AI image identification [10].
Against this background, this study introduces a drone system designed explicitly for pear pollination and conducts a demonstration experiment using the developed drone. The drone automatically flew over a pear field, searched for flowers that could be pollinated, and sprayed pollen onto the flowers using a drone-mounted sprayer. The results of the demonstration experiment showed that the fruiting rate was equivalent to that of the conventional method and that this system is expected to be used as a new pollination system in the future.

2. Challenges in Building a Pollination Drone System

A pollination drone system flies automatically and searches for flowers to pollinate. The goal of this system is to obtain a high fruiting rate by performing precise pollination at the location of the discovered flowers. Three issues must be addressed when constructing a drone pollination system:
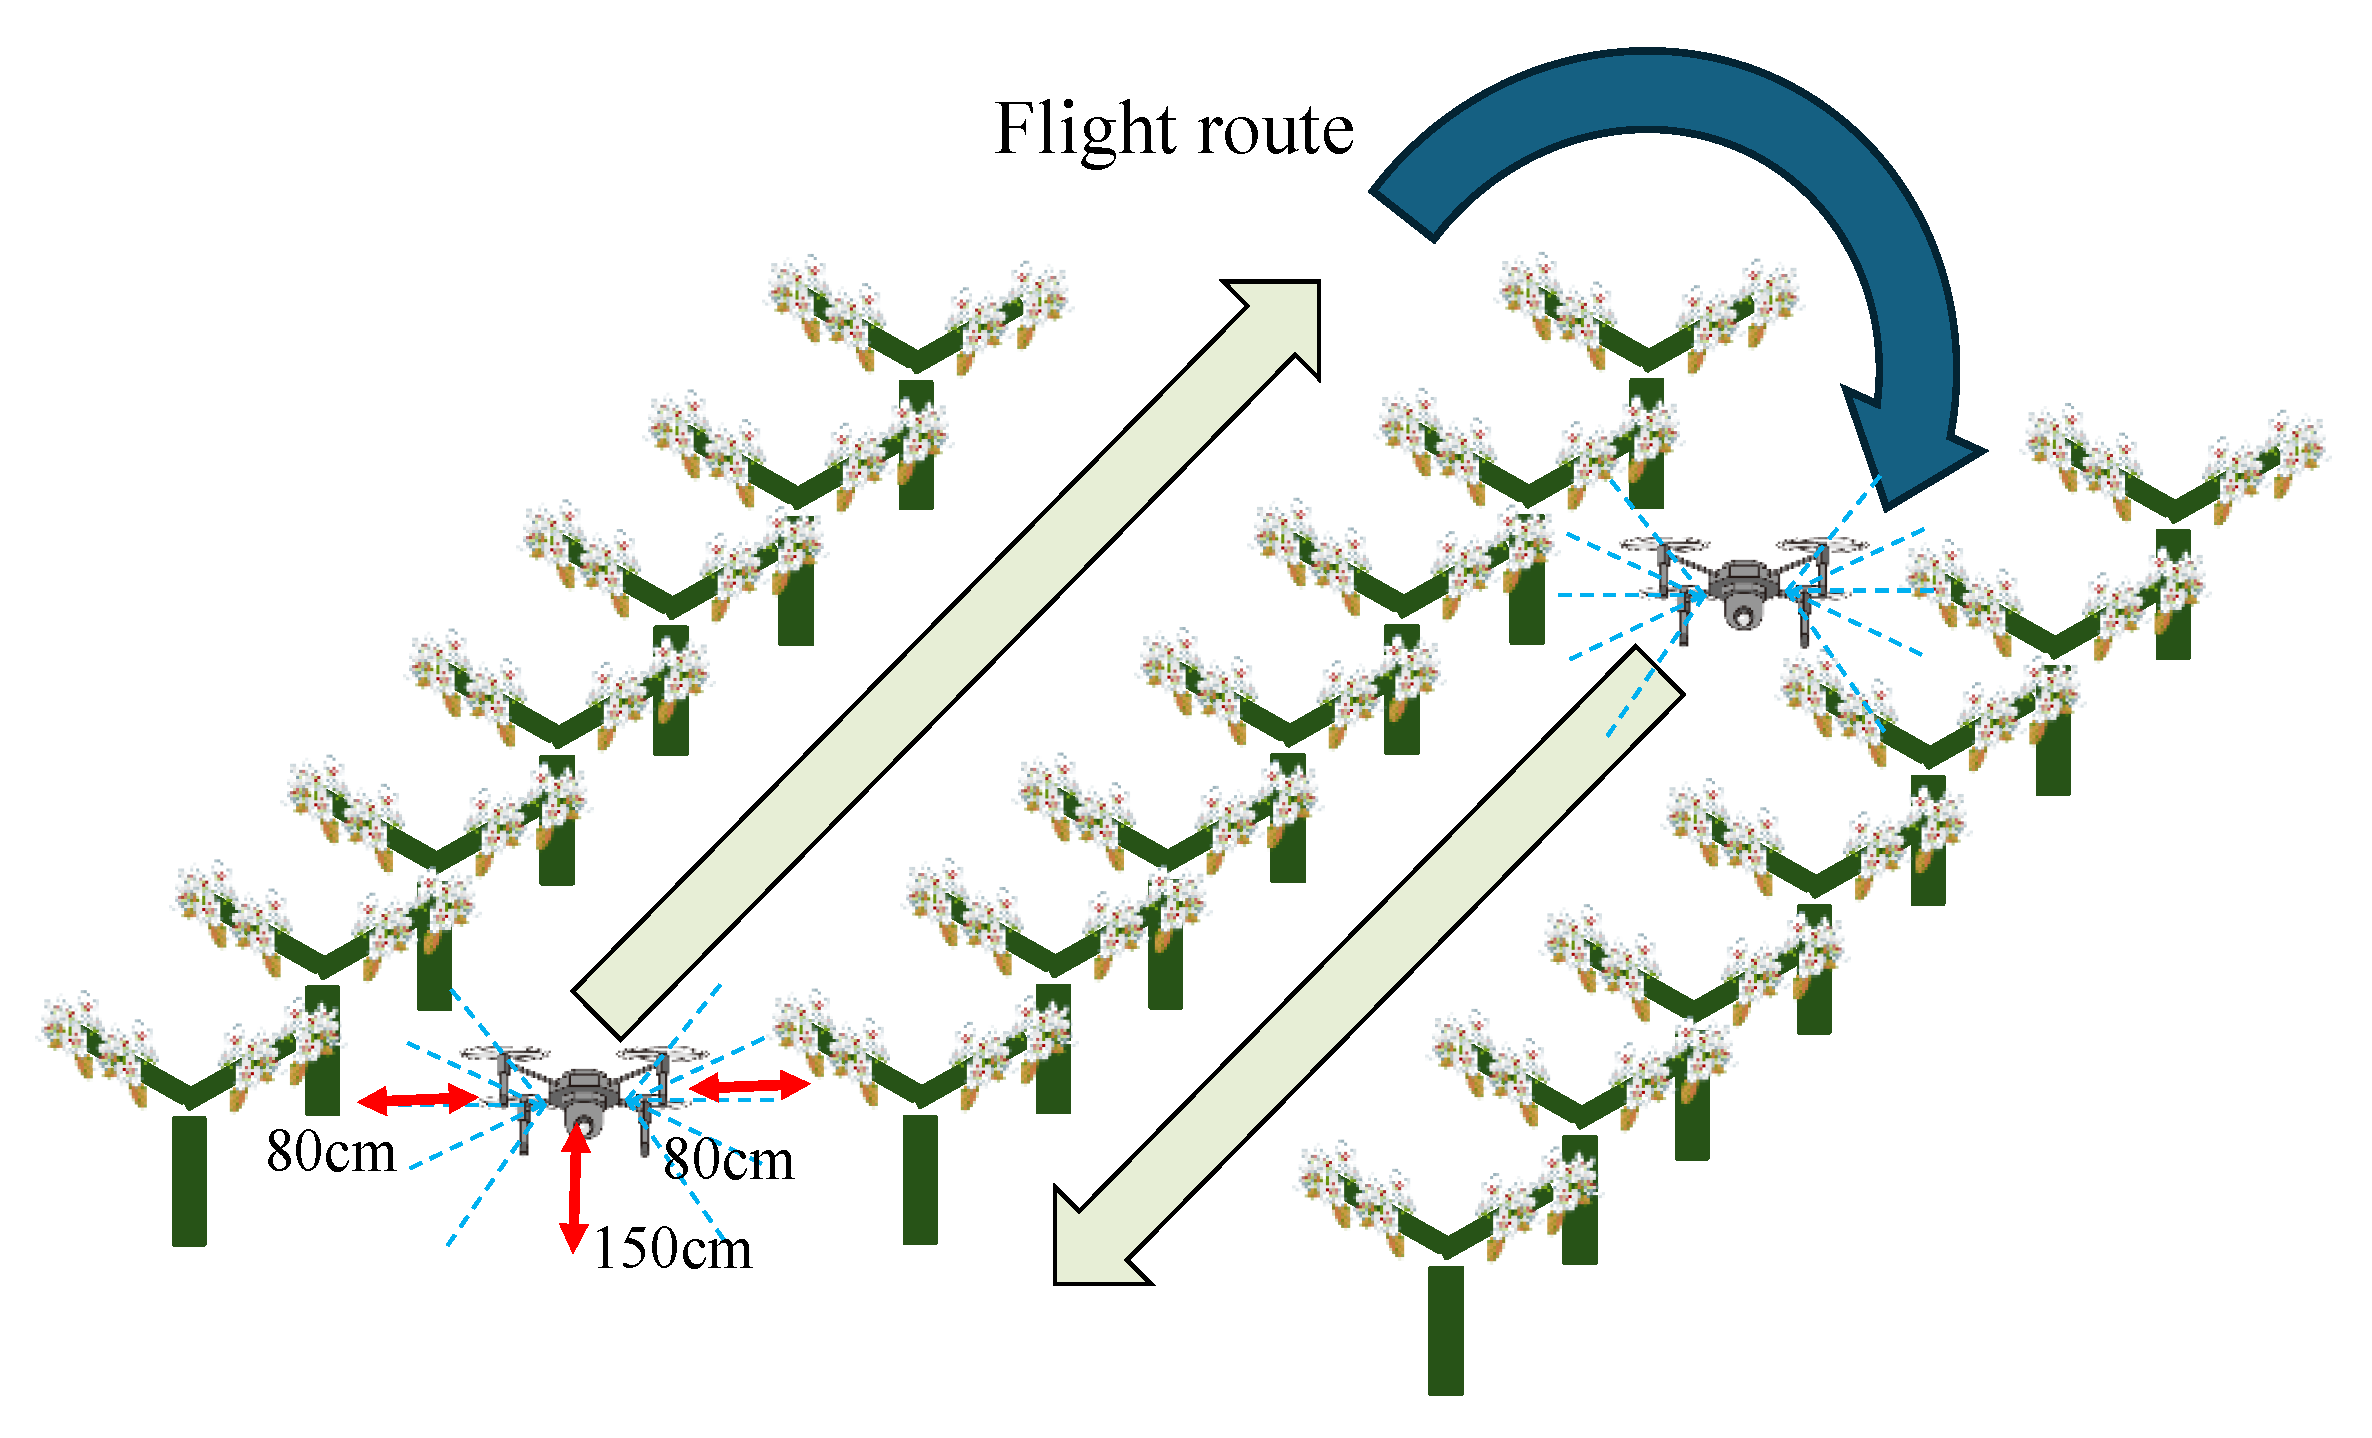
  • Challenge (1): Construction of flight routes in the field
  • Challenge (2): High-precision flight positioning
  • Challenge (3): Establish a scenario to carry out pollination work
In Challenge (1), a flight route must be designed for navigating the pear field, as shown in Figure 2. As the flight route is between pear trees, it is possible to choose a route by extracting flyable areas within the pear field. Therefore, a machine-learning segmentation method was used to extract the flight areas within the field.
Challenge (2) requires highly accurate positioning for navigating narrow spaces between trees, as shown in Figure 2. The positioning requirement was to ensure stable flight within a 160 cm-wide space (80 cm–80 cm) between trees and an altitude of 150 cm to avoid contact with surrounding trees and leaves. To obtain highly accurate positioning, a Real-Time Kinematic Global Navigation Satellite System (RTK-GNSS) with satellite and ground-based reference stations was used.
In Challenge (3), a procedure must be devised for the drones to complete the pollination process autonomously. After the flight area and route are selected using (1), the drone flies along the flight route to search for flowers to pollinate. The positions of the flowers are obtained by applying the positioning technique described in (2). Next, the drone was equipped with a sprayer, and pollen was sprayed at the coordinates of the flowers found during the search flight to complete pollination.
The drone is operated by a Robot Operation System (ROS), and this series of procedures is completed by developing various functions to enable the pollination drone system.

3. Method of Constructing Flight Routes in the Field

In this section, we will discuss a method for designing a flight route in a field before a drone performs pollination work to solve challenge (1) in Section 2.

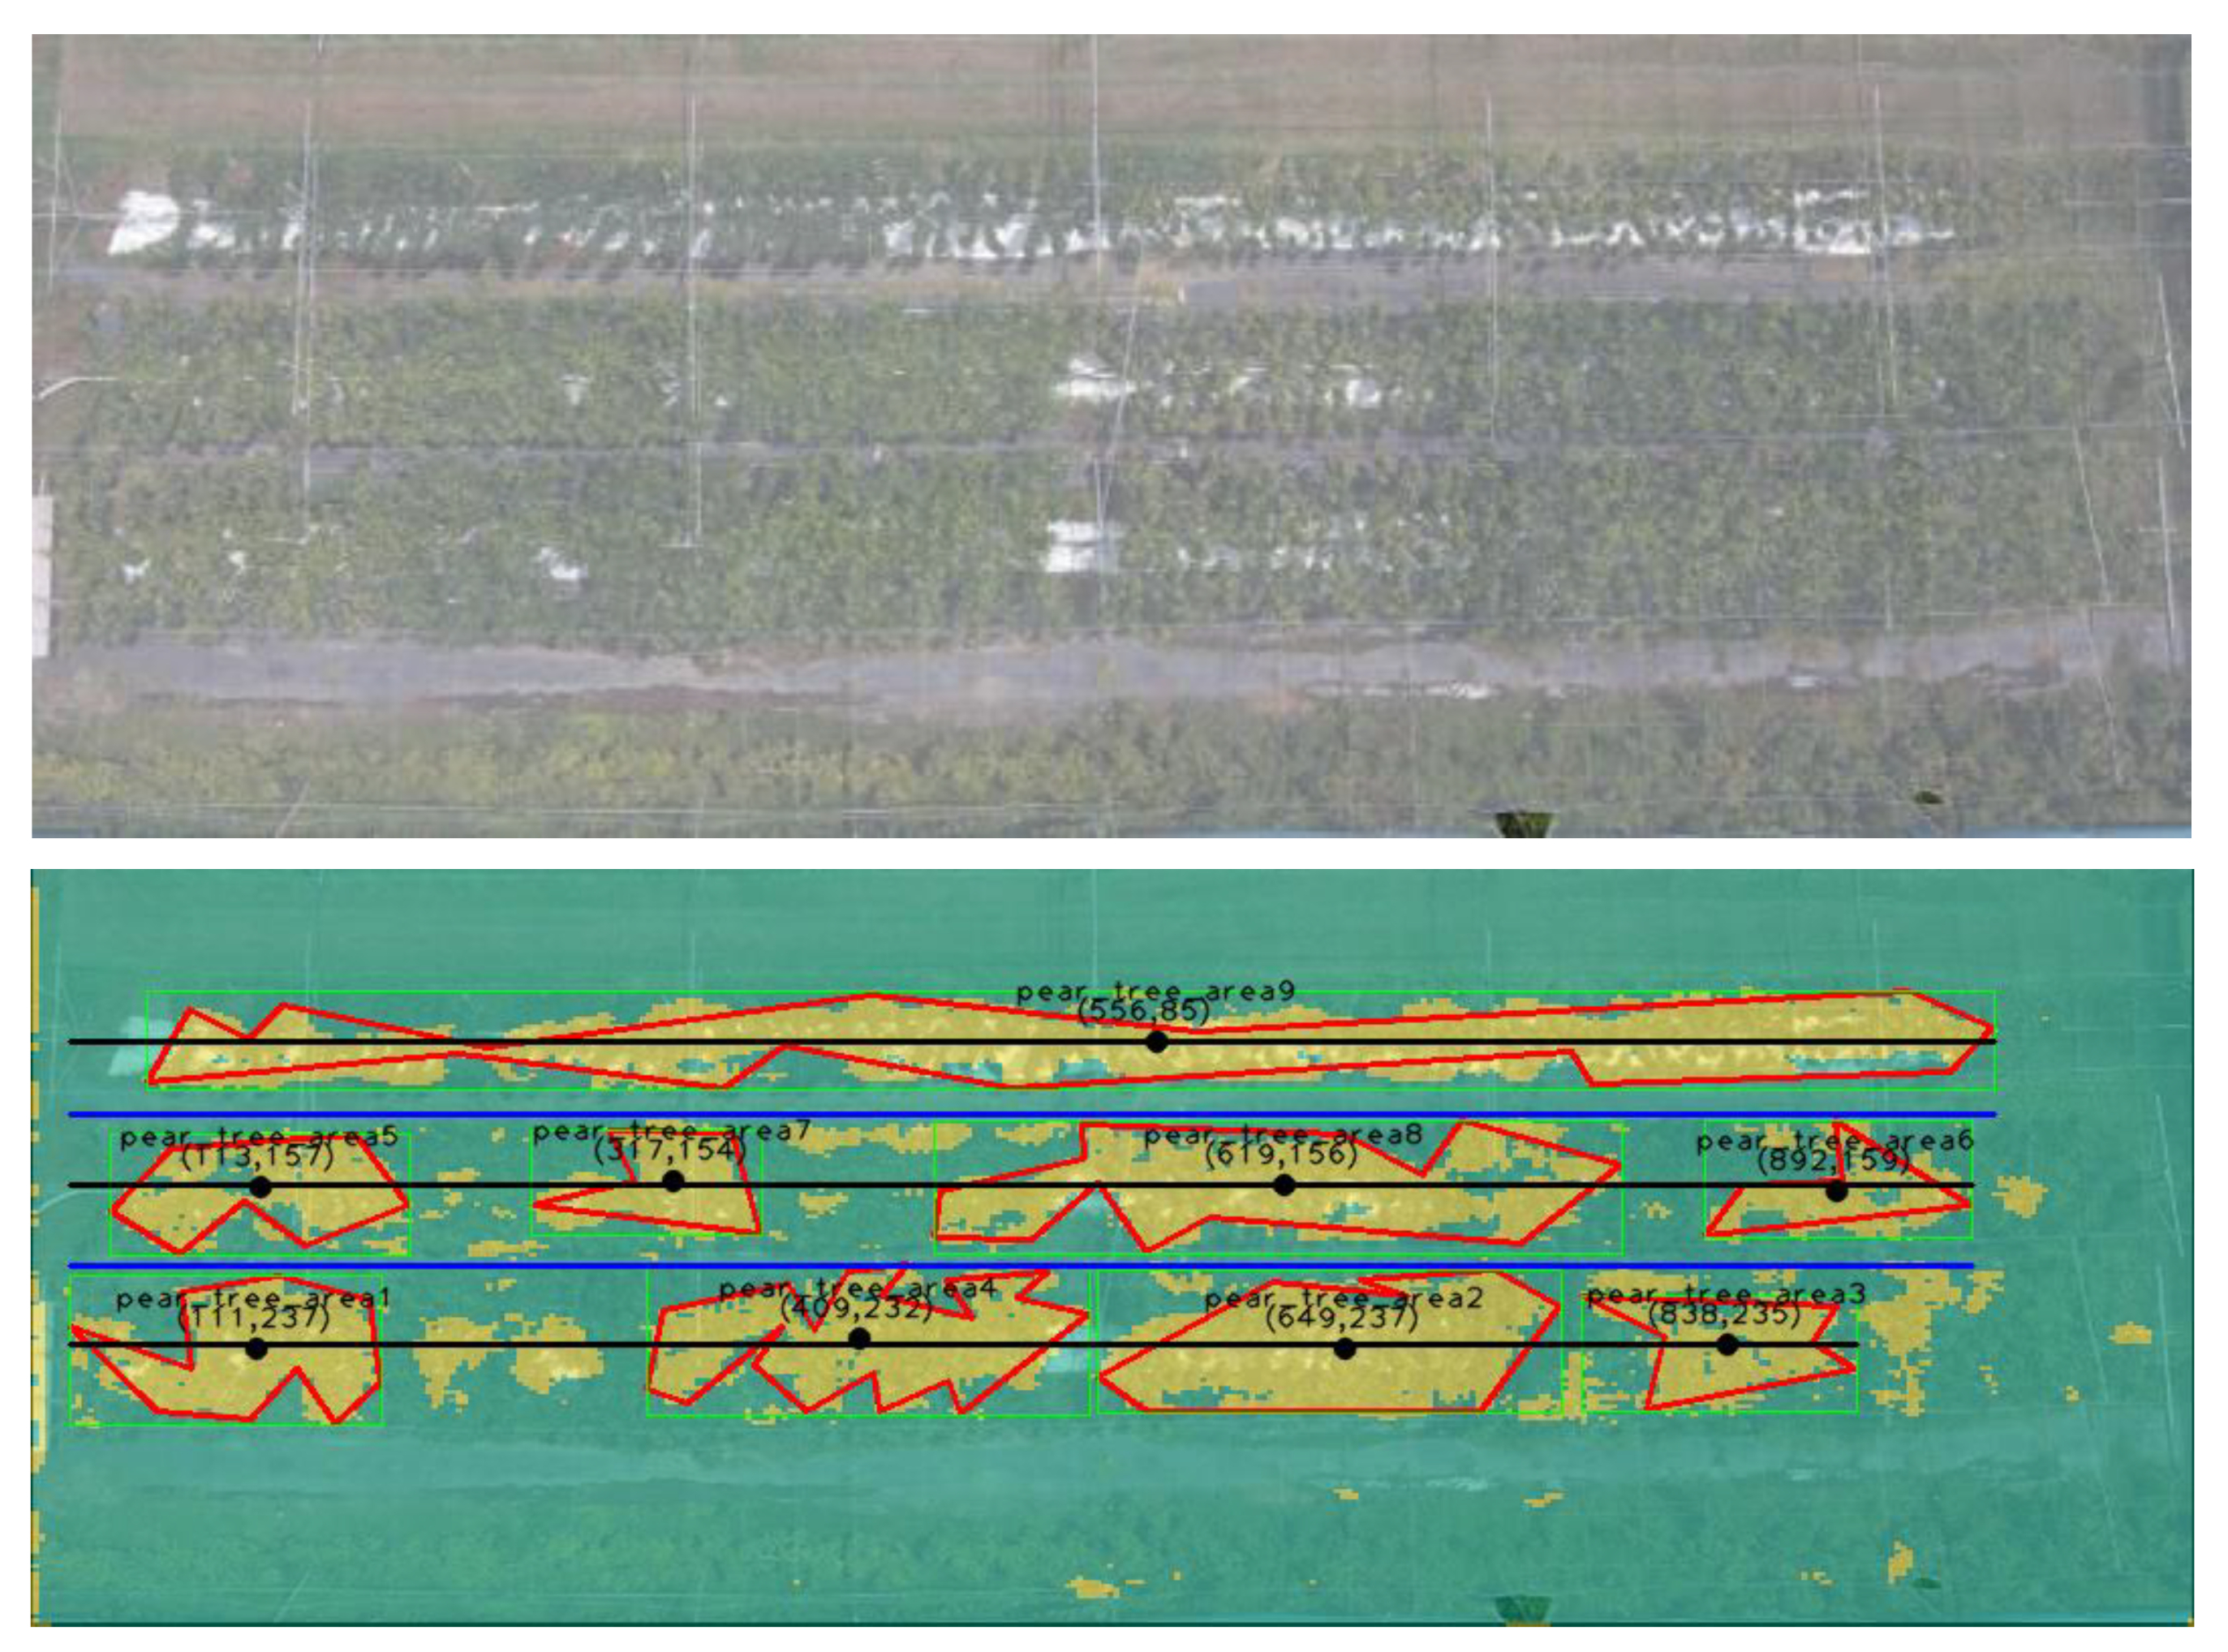
3.1. Area Extraction by Segmentation

An overview of the method for selecting flight routes within the field is shown in Figure 3. First, as shown in Figure 3a, a drone flies over the entire pear field to obtain aerial images. The aerial images are then uploaded to the cloud server. On the cloud server, the area of the pear tree is detected via deep-learning segmentation, as shown in Figure 3b. Based on the detection results, a route is selected that the drone can fly while avoiding obstacles like pear trees, as shown in Figure 3c. The results in Figure 3b,c are the output in coordinates (pixels) on the image, which are converted to latitude and longitude coordinates, as shown in Figure 3d, and the drone is instructed to move.
In Figure 3b, pear tree areas are detected using semantic segmentation, a type of segmentation that uses deep learning. Semantic segmentation has the advantage of being able to detect objects that do not have a fixed shape, such as the sky or roads, because it predicts a class for each pixel in the image [11,12,13]. The training conditions consisted of 20 training images, 10 test images, and 110 epochs, and the architecture was VGG U-Net [14]. The encoder consists of a Convolutional Neural Network (CNN) with all coupling layers removed, and the feature map is gradually reduced for feature extraction. Subsequently, in the decoder, an inverse convolutional layer is used to increase the feature map progressively, which is used as the output result image. Under these experimental conditions, segmentation was performed for two classes: pear trees and other areas. Figure 4 shows the segmented output images. Yellow areas represent areas identified as pear trees. On the other hand, the green areas represent areas navigable by the drone due to the absence of pear trees.

3.2. Flight Route Coordinate Extraction Method

In Figure 3c, the results of Section 3.1 are used to select the flight route. In this study, the case of joint cultivation (V-shaped), in which pear trees are arranged in rows and a straight line, was selected as the focus. Figure 4 shows the results of the flight route selection. First, the yellow area (the area of the pear tree) in the semantic segmentation output image was outlined and enclosed by a red frame. Next, the center of gravity (black point) of each contour was calculated, the average position of the center of gravity for each row was calculated, and a black line was drawn. This gives us the location of the trunk, which is the center of the pear tree. Finally, to fly the drone between the pear trees, a blue line was drawn between the black lines and the position of this blue line was used as the drone’s flight path.
The results of the flight route selection were output as coordinates (pixels) on the image, which were converted to latitude and longitude coordinates to issue movement instructions to the drone. The conversion from a planar coordinate system (meters) to latitude and longitude was performed using Vincenty’s formulae [15,16,17]. The direct method requires the latitude and longitude of the center of the image as input values and the distance and azimuth from the center of the image to the start and end points of the flight route, respectively. The latitude and longitude of the image center are the latitude and longitude of the point where the drone took the image. The distance from the center of the image to the start and end points of the flight path must be calculated by converting the pixels to meters, with the center of the image as the origin. The azimuth must be obtained by transforming the azimuth such that the north is 0°. Figure 5 shows the preparation for Vincenty’s formulae. As shown in Figure 5i, the origin of the image in the upper-left corner shifts toward the center. Next, as shown in Figure 5ii, the distance and azimuth from the origin to the start and end points are calculated using the Pythagorean theorem. The azimuth is calculated considering the fact that north is 0° and the direction from which the drone took the image. Finally, as shown in Figure 5iii, for each height and width of the image, the range of the image (in meters) is R m , the number of pixels of the image is denoted by I p , and the meter per pixel, P m , is calculated using Equation (1):
P m = R m I p
The shooting range (in meters) R m is obtained using Equation (2), where the angle of view of the camera is a and the altitude of the drone is h .
R m = t a n a 2 × h × 2
Using the meters per pixel P m obtained earlier and the distance (pixels) d p obtained in (ii), d m is calculated from the distance obtained in Figure 5ii to meters using Equation (3).
d m = P m × d p
From these results, the input values for Vincenty’s formulae were obtained, and the coordinates on the image were converted to latitude and longitude, making it possible to provide flight instructions to the drone along the selected route.

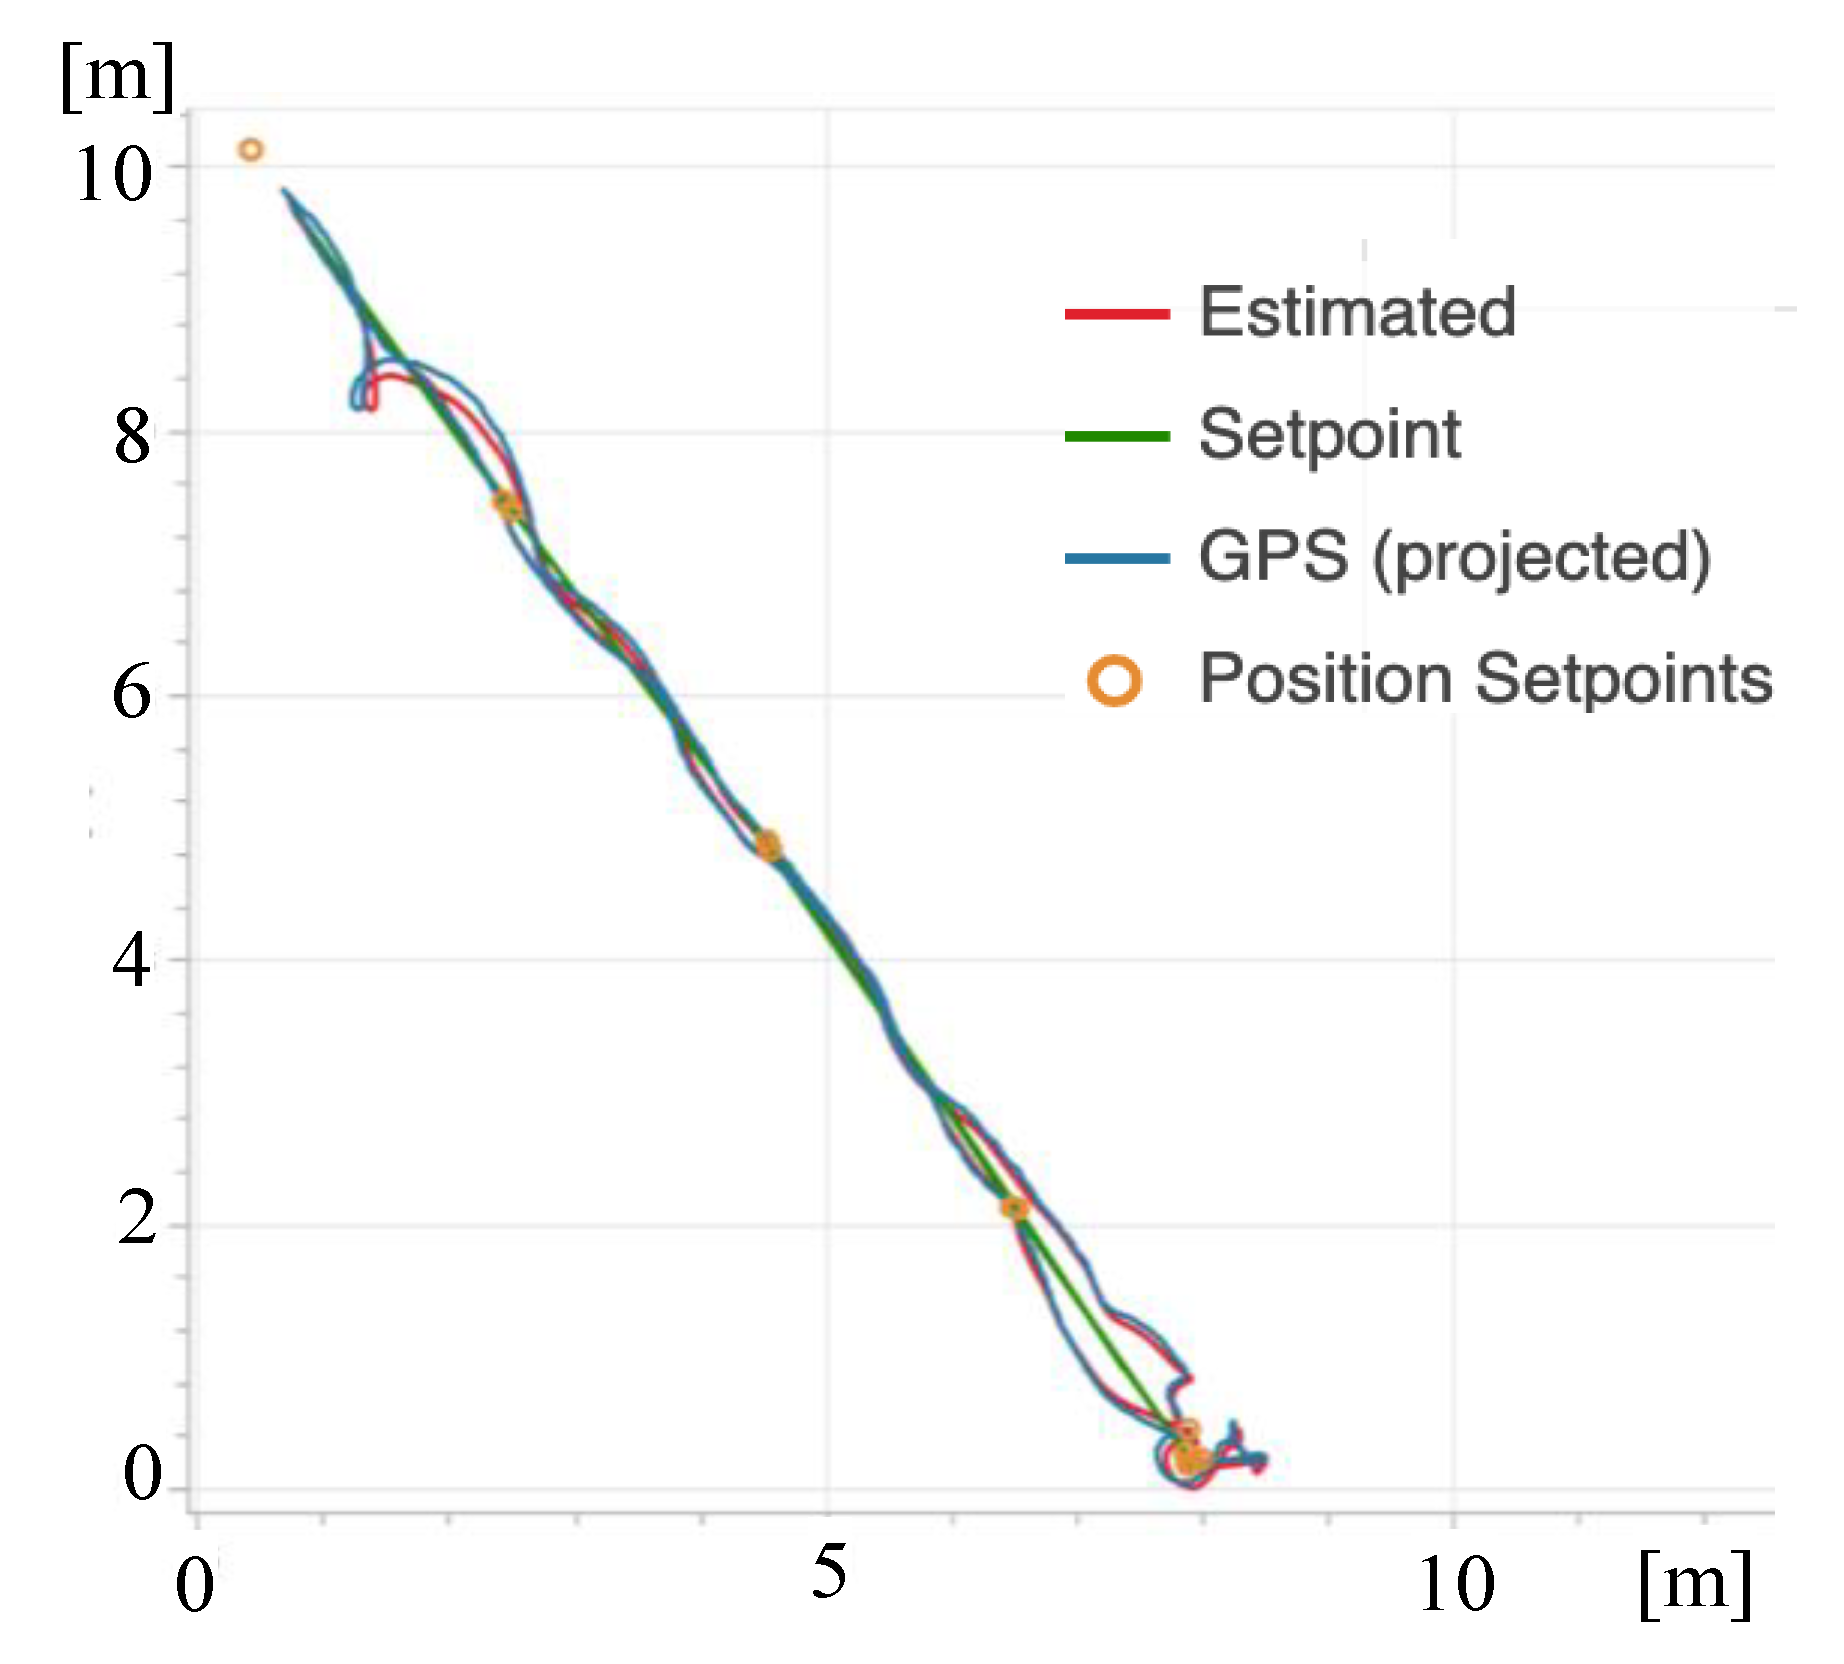
4. Positioning and Flight Accuracy

In this section, we will discuss positioning technology for high-precision flight control of drones and explain design methods to solve challenge (2) in Section 2.

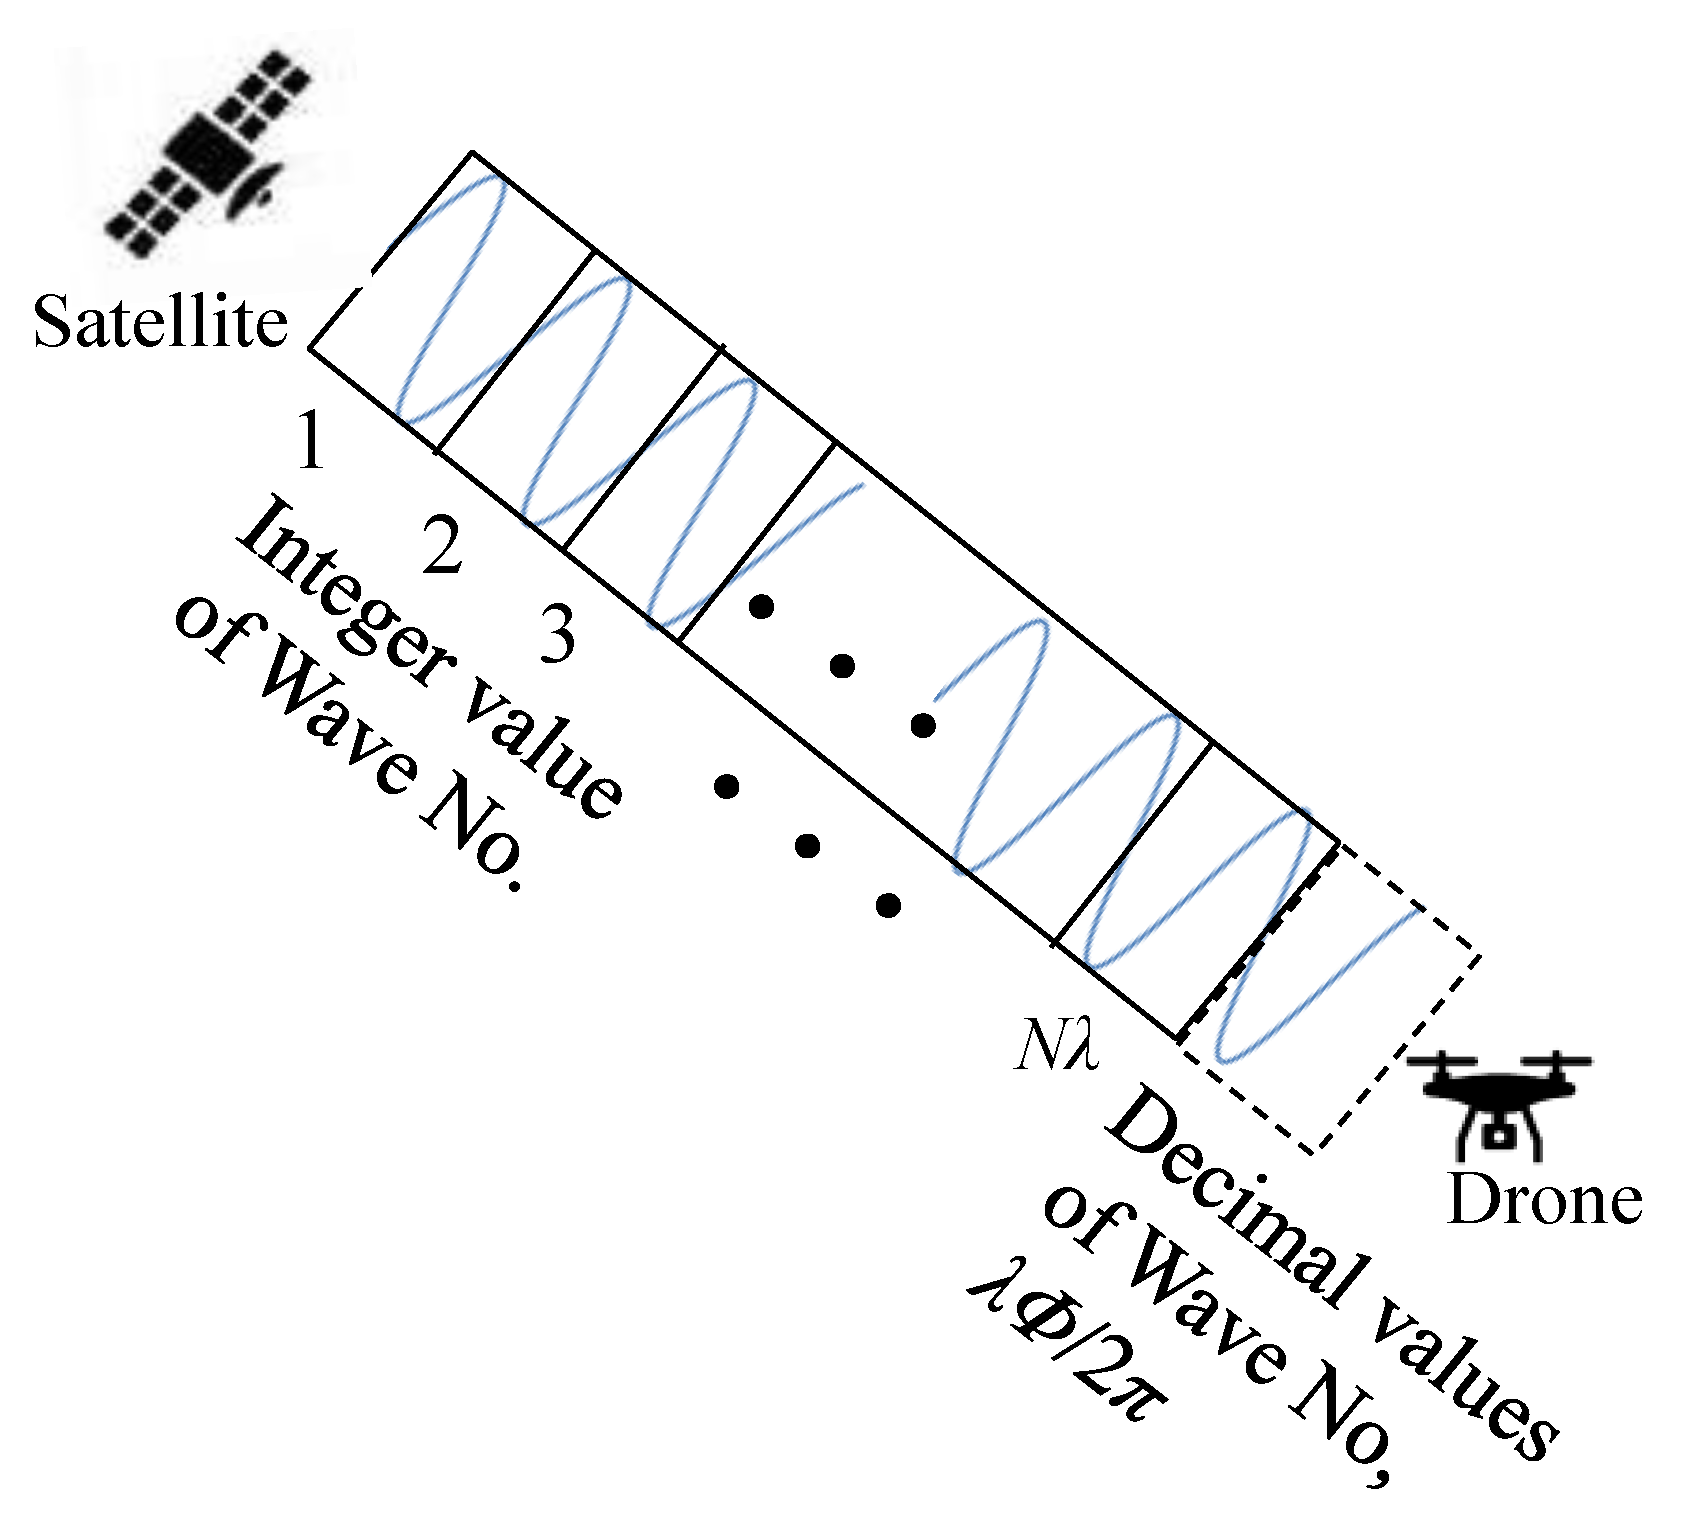
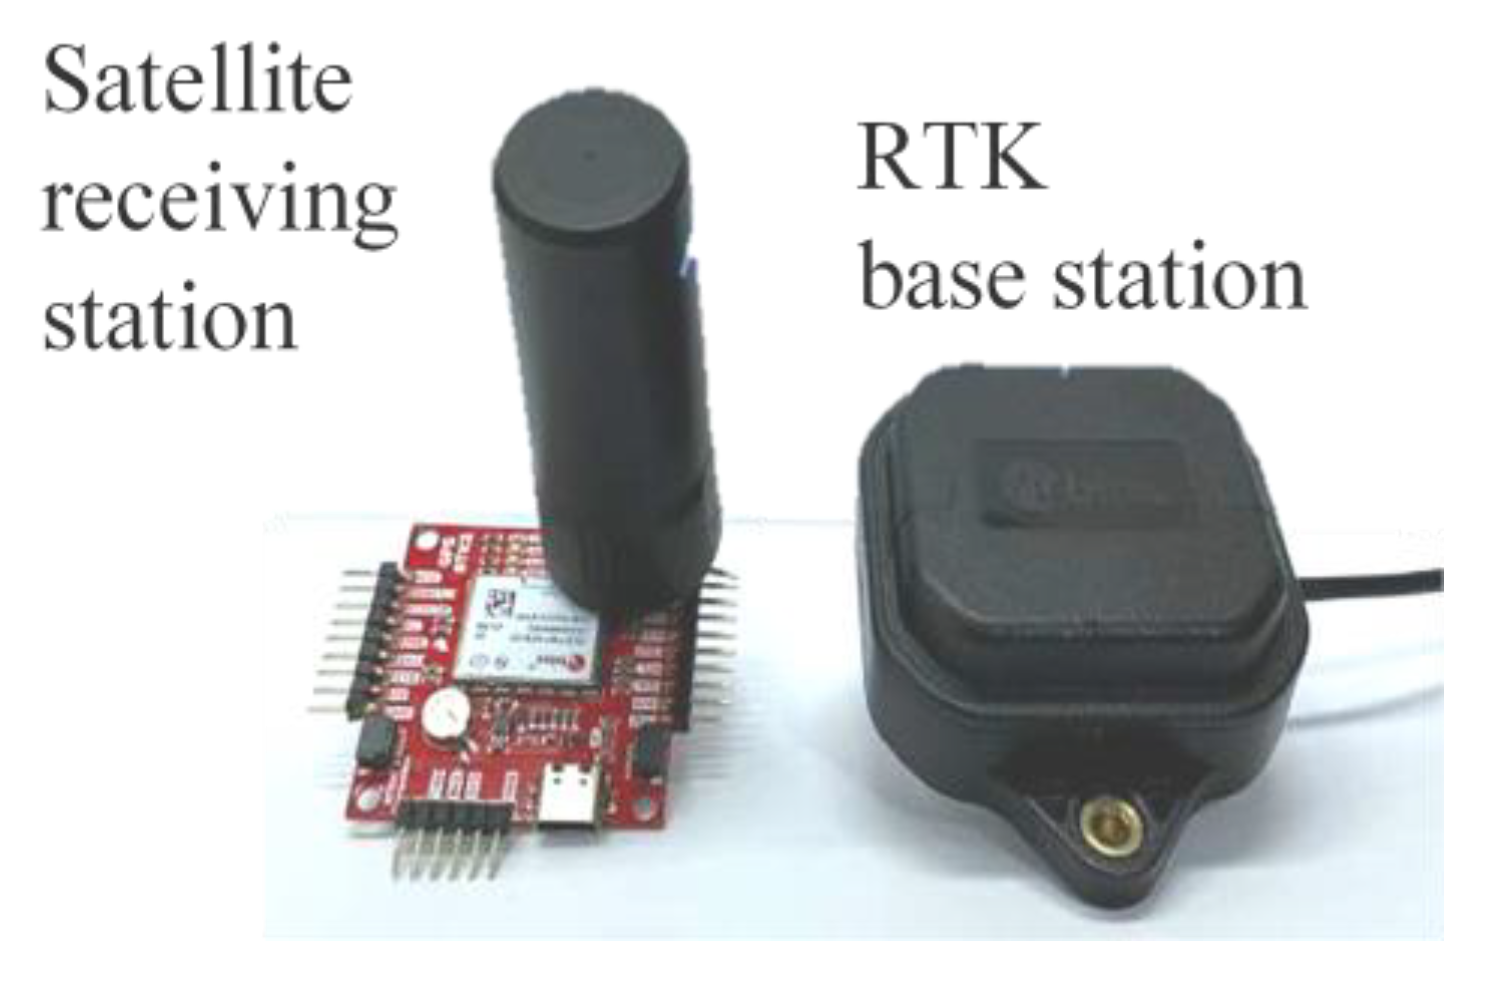
4.1. Overview of RTK-GNSS Positioning Methods

The drone flies through the space between the pear trees, as shown in Figure 6, to search for flowers, and after detecting the location of the flowers, the drone accurately targets the pollen spray. As mentioned previously, the drone must fly stably in a space of 160 cm (80 cm–80 cm) between trees at an altitude of 150 cm. Therefore, the flight is controlled by obtaining the coordinates of the drone using satellite signals for positioning. However, satellite positioning is subject to errors of several meters [18], and in an environment where trees grow thick, it is extremely difficult to achieve highly accurate and stable flight due to signal attenuation and obstructions. In this study, the RTK-GNSS [19] was used to achieve precise positioning.
The RTK-GNSS performs positioning operations using the phase of carrier signals from satellites [20,21]. As shown in Figure 6, a moving receiver station (drone) receives signals from the satellite and uses correction data from a ground-based reference station whose position is known and fixed on the ground, thereby reducing the effects of ionospheric delay, tropospheric delay, and multipath error factors. The carrier phase is a continuous measurement of the carrier-phase angle of the positioning signal, which is demodulated by the receiver. The observation model is shown in Figure 7. λ is the wavelength of the carrier wave (m), ϕ is the carrier phase (cycles), and N is an integer value of the wavelength cycle from the satellite to the receiving station. Furthermore, by measuring a small number of wavelengths ( λ Φ / 2 π ), which are the remaining wavelengths, the precise distance can be calculated.
In other words, measuring a fractional length of one wavelength theoretically allows millimeter-level positioning. Furthermore, to reduce attenuation and interference caused by trees and other obstacles, a correction signal can be sent to the drone from a reference station on the ground to stabilize positioning.

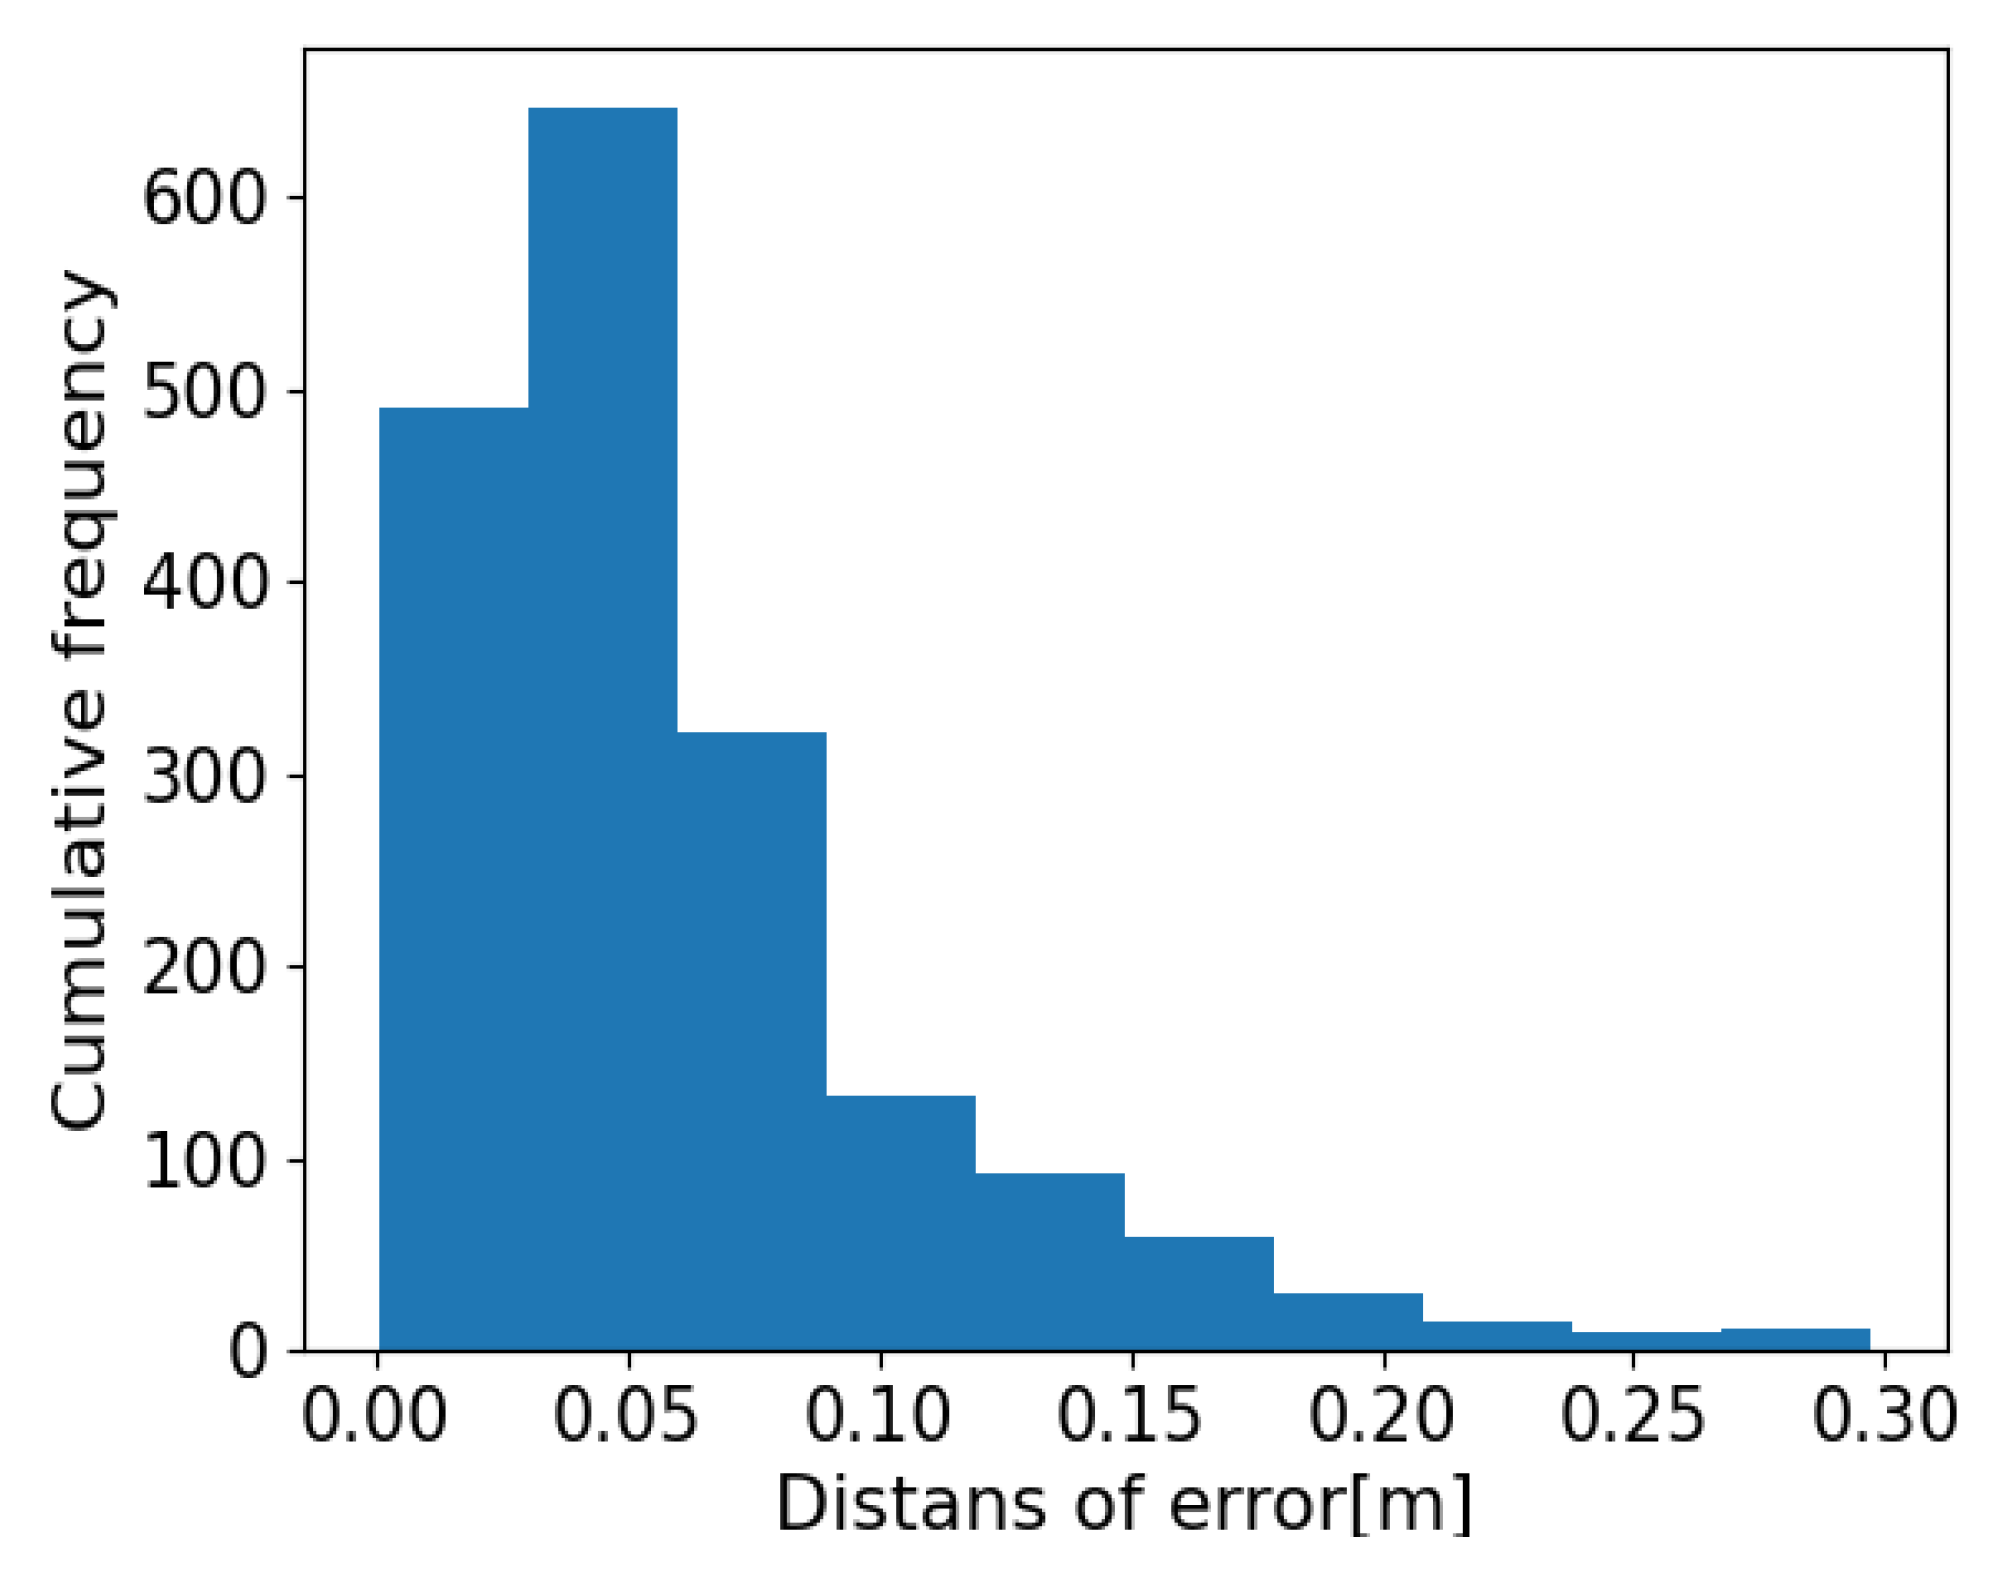
4.2. Verification of Positioning by Experiment

To construct the configuration shown in Figure 6, a satellite receiver was mounted on a drone, and an RTK reference station was installed on the ground to verify the accuracy of the positioning through experiments. The ZED-F9P [22] by u-blox, as shown in Figure 8, was used as the GNSS receiver module. The drone serves as the Wi-Fi Access Point (AP), and a terminal equipped with a Ground Control Station (GCS) connects to the AP as a Wi-Fi station (STA) for controlling the flight route. In other words, the drone flies autonomously while positioning itself using predefined flight route information. In this experiment, QGroundControl (QGC) [23], an open-source software package, was used. The experiments were conducted at the Saitama Prefectural Agricultural Technology Center (Kuki experiment field, Saitama prefecture in Japan). The experimental conditions are listed in Table 1. The drone used in this study was a Holybro X500 V2 [24]. Figure 9 shows a comparison of the satellite positioning route with the set route. Figure 10 shows the cumulative frequency of errors relative to the set route. These measurements were used as pre-test data to assess approximate positioning accuracy and inform drone control design. The orange positions in Figure 9 represent the points along the flight route set by the GCS, and the green line represents the straight line connecting the departure point of the flight route to the destination point. The blue line represents the flight route determined by the Global Positioning System (GPS), and the red line represents the flight route based on the positioning analysis of the drone. These results confirmed that the drone followed the set route. Figure 10 shows the error in the GPS positioning compared to the positioning analyzed on the drone. The main error range is within 0.2 m. Errors of 0.5 m or more were caused by unstable flight conditions at the beginning of the flight. However, the drone’s flight path was unstable and unsafe at 0.5 m. However, the error of around 0.5 m resulted from unstable flight during takeoff and is assumed to have no effect when the drone moves between trees.

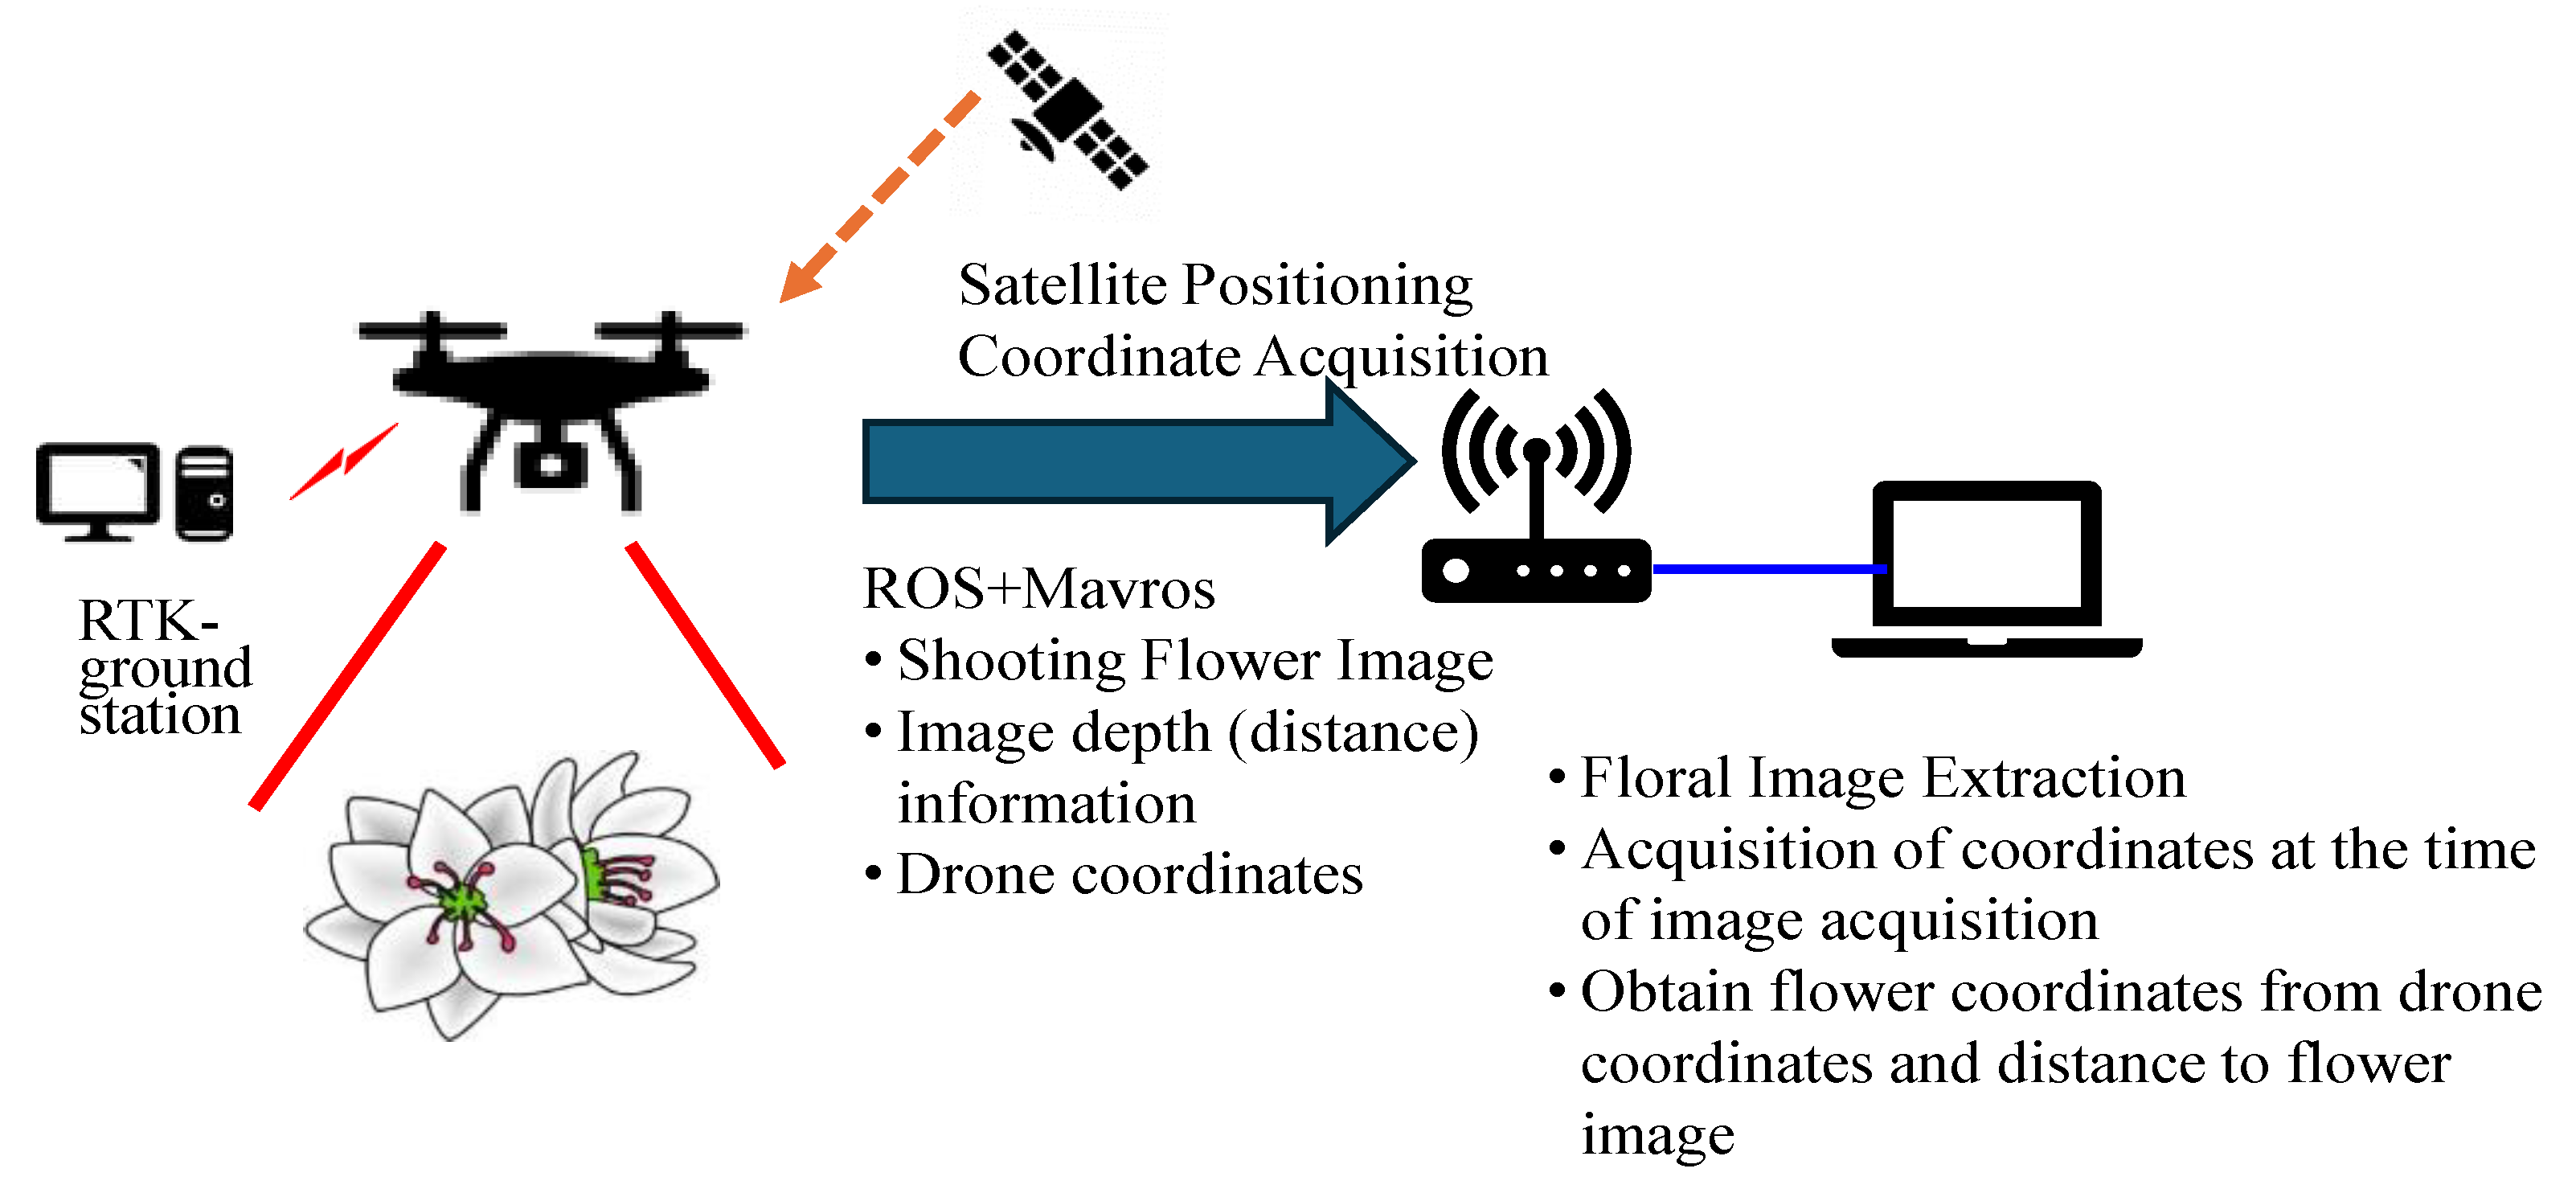
5. Pollination Drone System Configuration

In this section, we will examine the mechanisms for enabling drones to perform polli-nation tasks autonomously in order to solve challenge (3) in Section 2 and explain the implementation methods and the development and specifications of the drone.

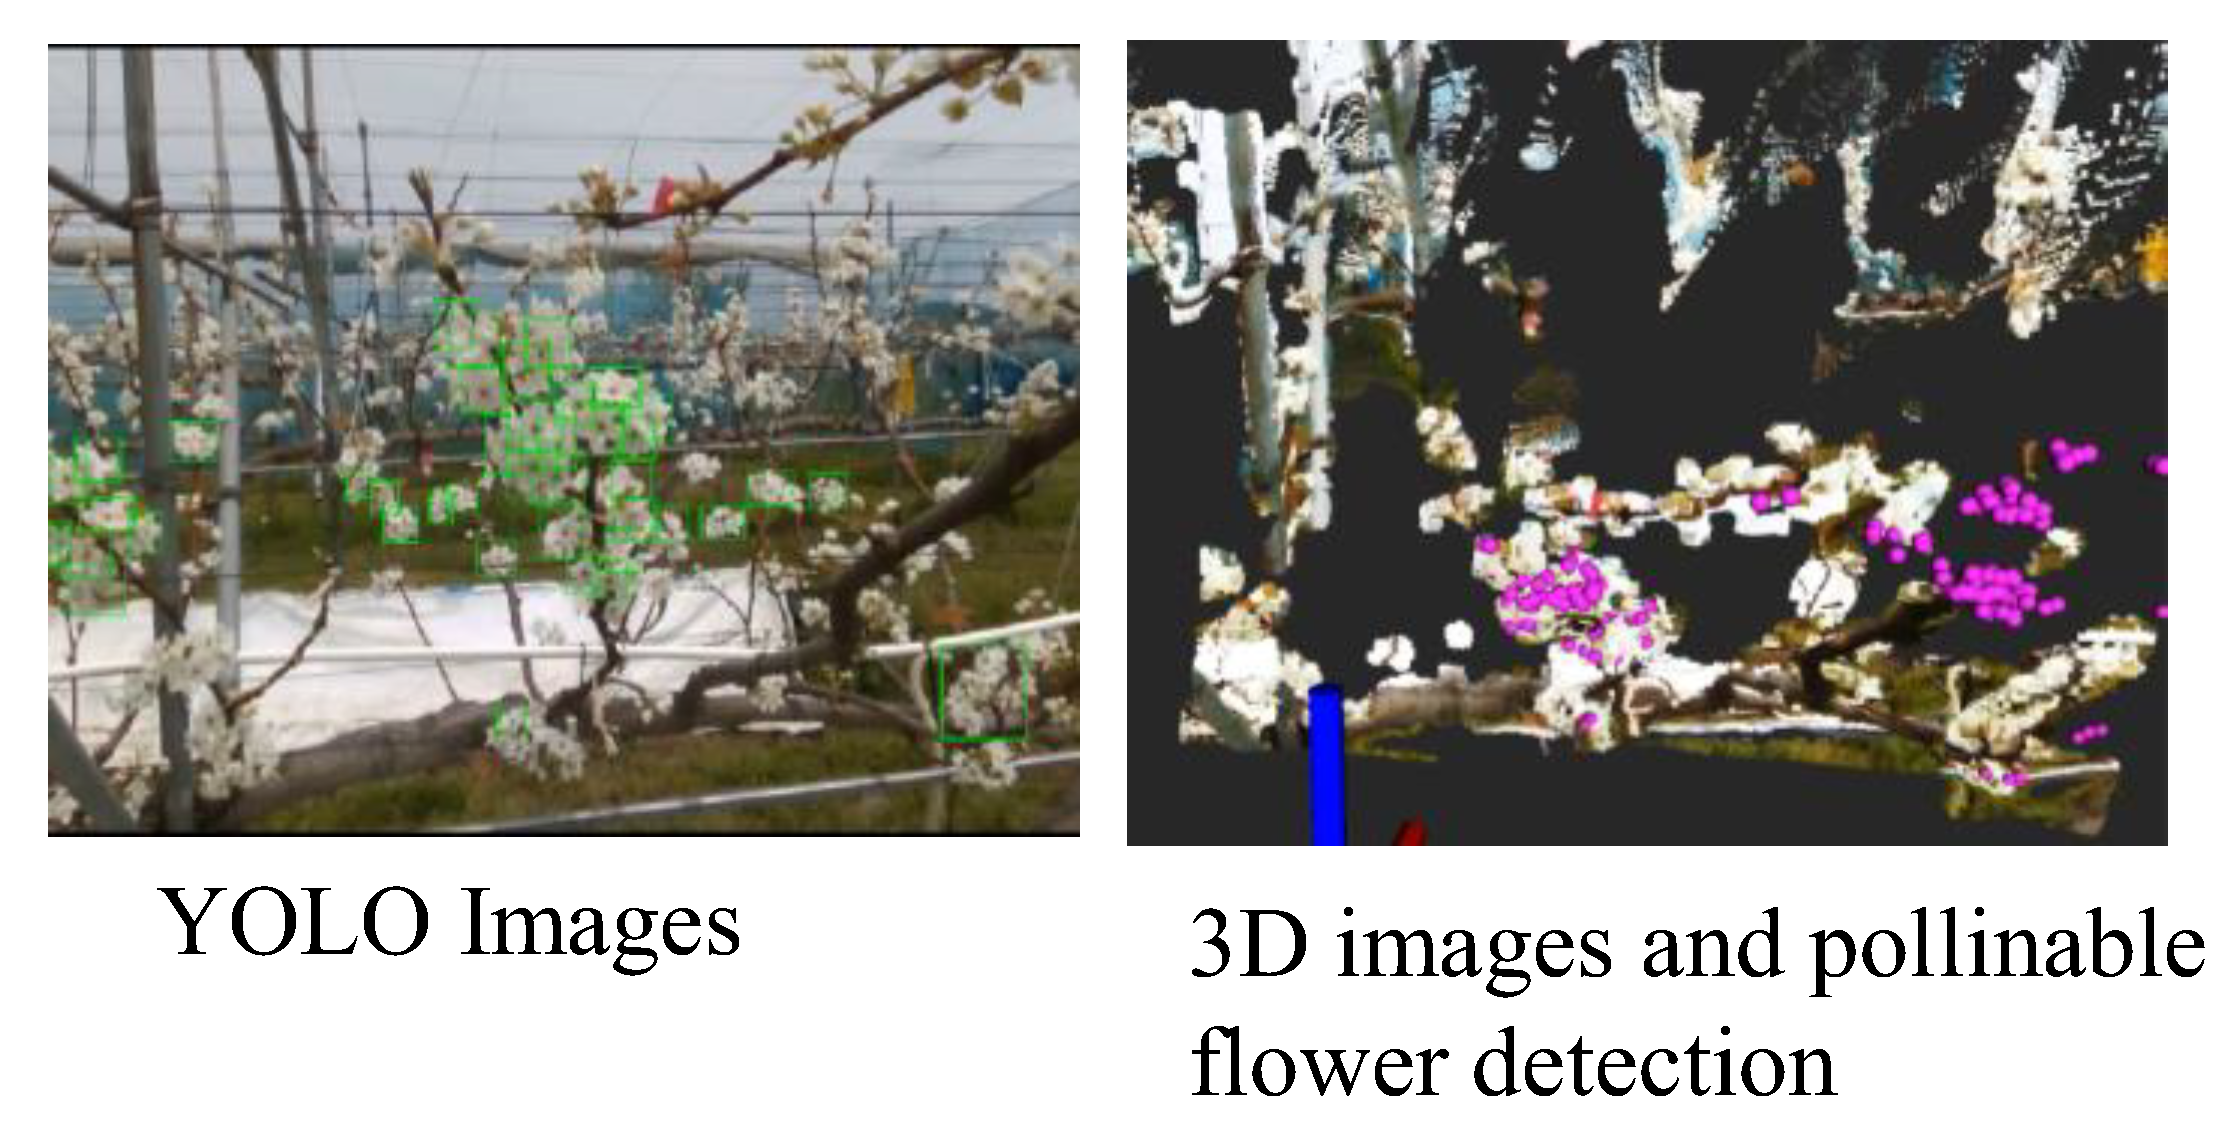
5.1. Flower Search Control

In pollination systems, a drone flies between trees to search for flowers to be pollinated. As shown in Figure 11, the images captured by the drone’s onboard camera were transmitted to an AI image identification server on the ground, where they were analyzed to identify the location of the flowers to be pollinated. The drone is controlled by the ROS in a microcomputer mounted on it, which manages all tasks from flight to image transmission. Messages between the ROS and flight computer were exchanged via MAVLink, with MAVROS handling the internal conversion process. For example, the procedure for transmitting images of flowers is illustrated in Figure 12 [25,26,27]. The data, such as camera and telemetry data captured by the drone, were transmitted according to the communication protocol shown in Figure 12. Drone communication uses the MAVLink protocol, a point-to-point communication system that allows information to be shared between drones and PCs. This protocol contains data such as GPS, radio control channel, altitude, and camera information and is designed specifically for this type of communication. The procedure for transmitting flower images involves initiating RealSense from a companion computer program and storing the specified data. Data were transmitted by determining the depth and color information required for the analysis of flower coordinates from a list of topics flowing from the drone. The depth data were calculated using Equation (4) [28]:
  X = x Z f ,     Y = y Z f
From the acquired image data, the coordinates (x, y) on the screen, and the coordinates (X, Y, Z) of the camera, the focal length of the camera is f and the depth is Z. The focal length of the camera is an intrinsic parameter. The images captured by the drone were transmitted via MAVLink, and the data were stored in the USB memory of the companion computer mounted on the drone. In this study, experiments were conducted using Raspberry Pi (RasPi) [29].
The drone system transmits telemetry data, and the GCS sends commands to ensure proper flight. Flowers were located by capturing images while flying between trees according to the flight routes described in Section 3, and the images were analyzed using an AI image identification server on the ground (external server).
In this case, the flowers are identified using machine learning, You Only Look Once (YOLO) [30,31,32], and the distance from the drone to the flowers is acquired. The distance was obtained by installing a depth camera [33,34] on the drone. The final output was the coordinates of the flower based on the direction and distance within the angle of view of the image. Figure 13 shows a flowchart of the flower search procedure. At the takeoff point, the route selected in Section 3 is configured, and the flight begins. After the flight begins, the image acquisition program automatically starts inside the drone. The drone constantly monitors whether it is flying along the selected route and immediately returns to the takeoff point if it deviates from the route. The drone then searches for flowers while capturing images along its flight route. During the flight, the captured images are transmitted to an external server using Rosbag with the ROS function. Upon completing the route, it returns to the takeoff point. All the operations were preprogrammed for automatic flight control.

5.2. Method for Estimating Video Coordinates Using a Depth Camera

Two image analysis methods were used to search for flowers by using a camera mounted on a drone. The first is to detect the shape of flowers that can be pollinated by the machine learning YOLO. For example, as shown in Figure 14, flowers with anthers on the left side can be pollinated, whereas flowers with all anthers released on the right side cannot be pollinated. The shape of the open petals indicates that the flower on the right is fully open. Detecting flower shapes while flying is one method used to search for flowers.
The coordinates of the flower were estimated by measuring the distance between the flower and the drone within the angle of view detected by YOLO, as shown in Figure 15. The distance between the drone and the flower was measured using a RealSense depth camera [35]. Depth cameras enable sensors to measure infrared light reflections and calculate depth information for objects and terrain in three-dimensional space. They can also create high-resolution depth maps (stereoscopic images) that provide distance data in pixels. Using this depth camera, the video image and distance of the flower were obtained from the depth data, as shown in Figure 16. In this experiment, due to the performance of the depth camera, the maximum effective distance between the drone and the flower was 1–2 m; the drone had to fly close to the flower. Therefore, positioning accuracy for flight is essential.
The flower search method uses YOLO to detect flowers and calculates their coordinates based on the distance information captured within the angle of view and the drone’s coordinates. This is used in the final pollination process when a drone equipped with a sprayer approaches the coordinates of the flower with pinpoint accuracy and sprays the pollen near the coordinates of the flower. The spraying method is explained in Section 6. The detail of YOLO is described in a related study [36]. We utilized YOLO v7, trained on a dataset of 3000 images of pear flowers, containing a total of 36,008 buds and 5355 fully bloomed flowers. The model achieved a recall of 0.90 and a precision of 0.86.

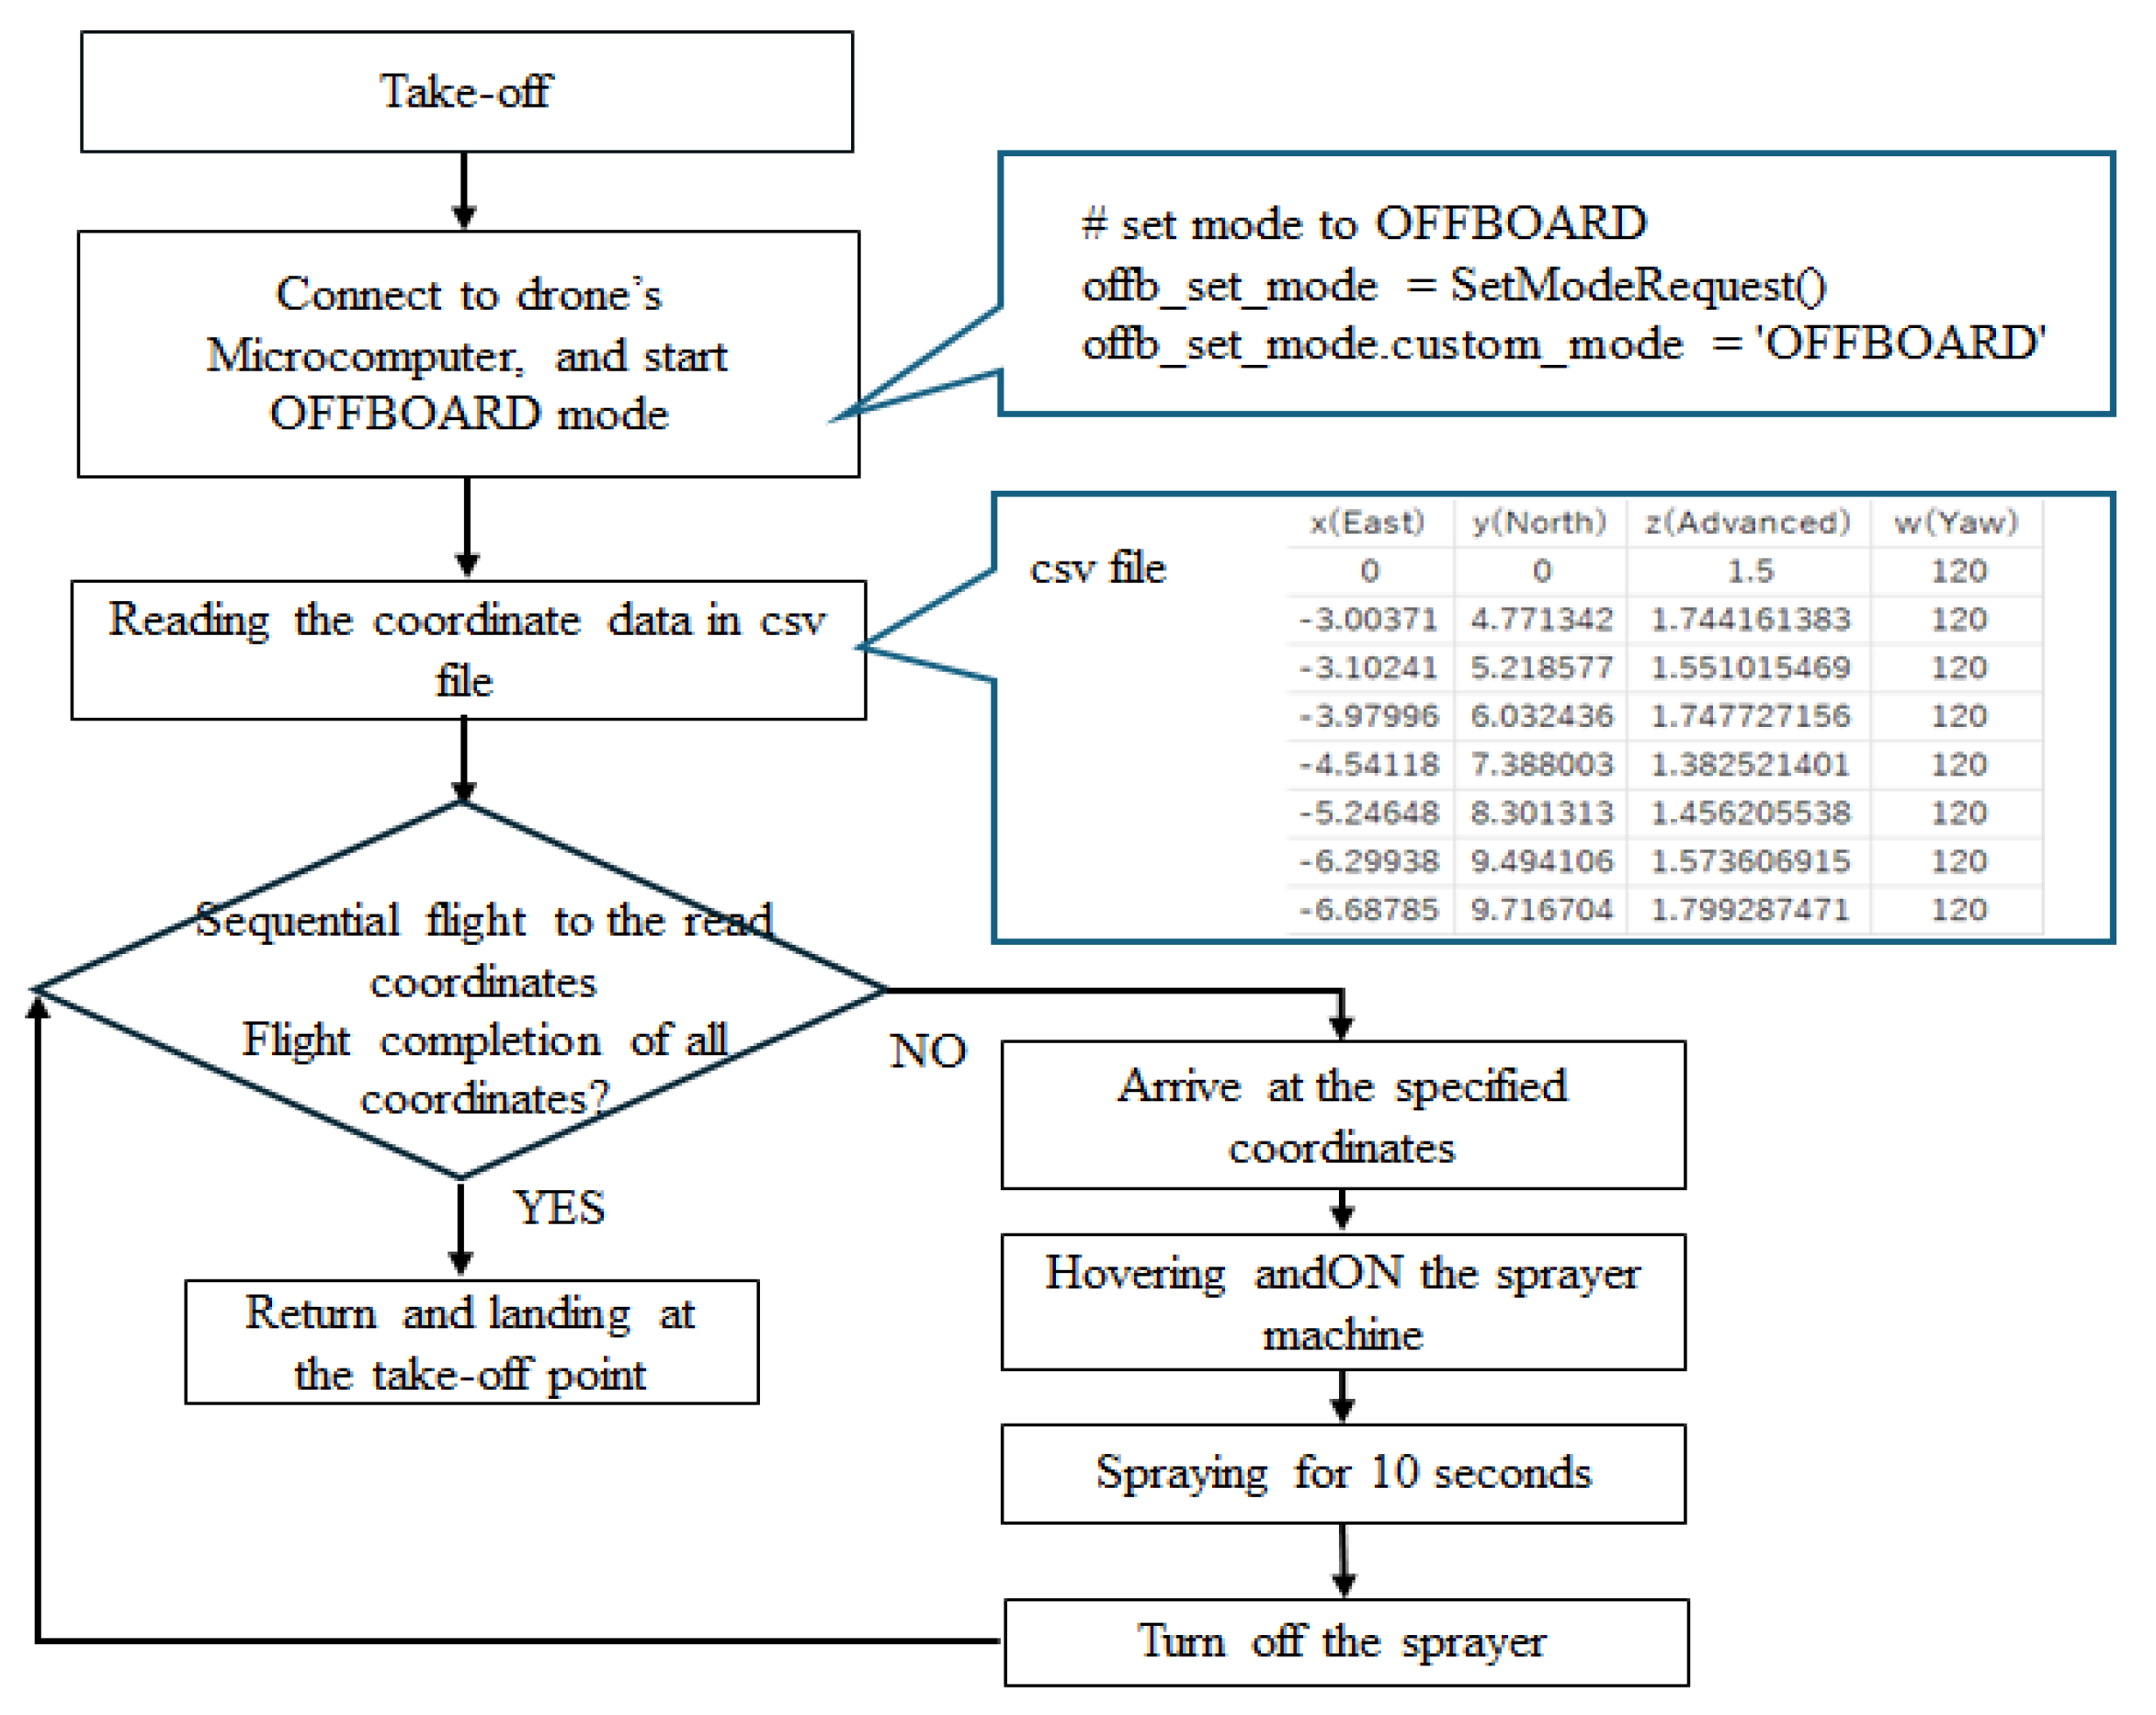
5.3. Pollination Means and Sprayer Operation

In the pollination procedure, a drone equipped with a sprayer flies to the coordinates of the flower, as calculated in Section 5.2, and executes pollination. Figure 17 shows a flowchart of the drone pollination operation. Section 6 describes the on-board sprayer. The coordinates of the drone at the time of spraying were corrected for the direction and distance of the pollen spray based on the calculated flower coordinates and the drone hovering at the optimal position. When the drone reached the coordinates, it was allowed to hover for 10 s before the sprayer was turned on or off. These drone operations were performed by applying the OFFBOARD mode of ROS [37,38,39]. In this mode, the drone operates based on commands sent from an external source instead of relying on the drone’s autonomous functions.

5.4. Drone Airframe Configuration and Pollinator Specifications

The following section describes the configuration of the drone used in the experiment and the specifications of the sprayer installed on the drone. The drone used was a Holybro X500 V2 kit [24], as shown in Figure 18.
Table 2 lists the aircraft specifications. The machine was characterized using X500V2, and the ROS program and other functions were implemented on RasPi. The width of the machine was approximately 60 cm, but the distance between trees was approximately 180 cm; therefore, a flight error of approximately 20 cm using the RTK-GNSS was sufficient to allow flight at a safe distance from trees and leaves. The sprayer weighed 400 g and had a payload capacity of 1000 g.
The specifications of the sprayer are shown in Figure 19. A pump pushes pollen into a reservoir. The air pressure ejects the pollen from the jet through a metal nozzle. A high-voltage power supply applies −12 kV to the metal nozzle, which electrically charges the pollen based on the principle of electrostatic painting [40,41]. The grounding was not provided for the drone, but the tree was designed as the grounding. In electrostatic coating, the electrode on the coating equipment side is the cathode, and the object being coated acts as the ground so that the charged paint is uniformly formed on the object along the lines of electric force generated by the high electric field. For safety reasons, the system is controlled by a microcomputer, so voltage is applied only when the pump is operating.

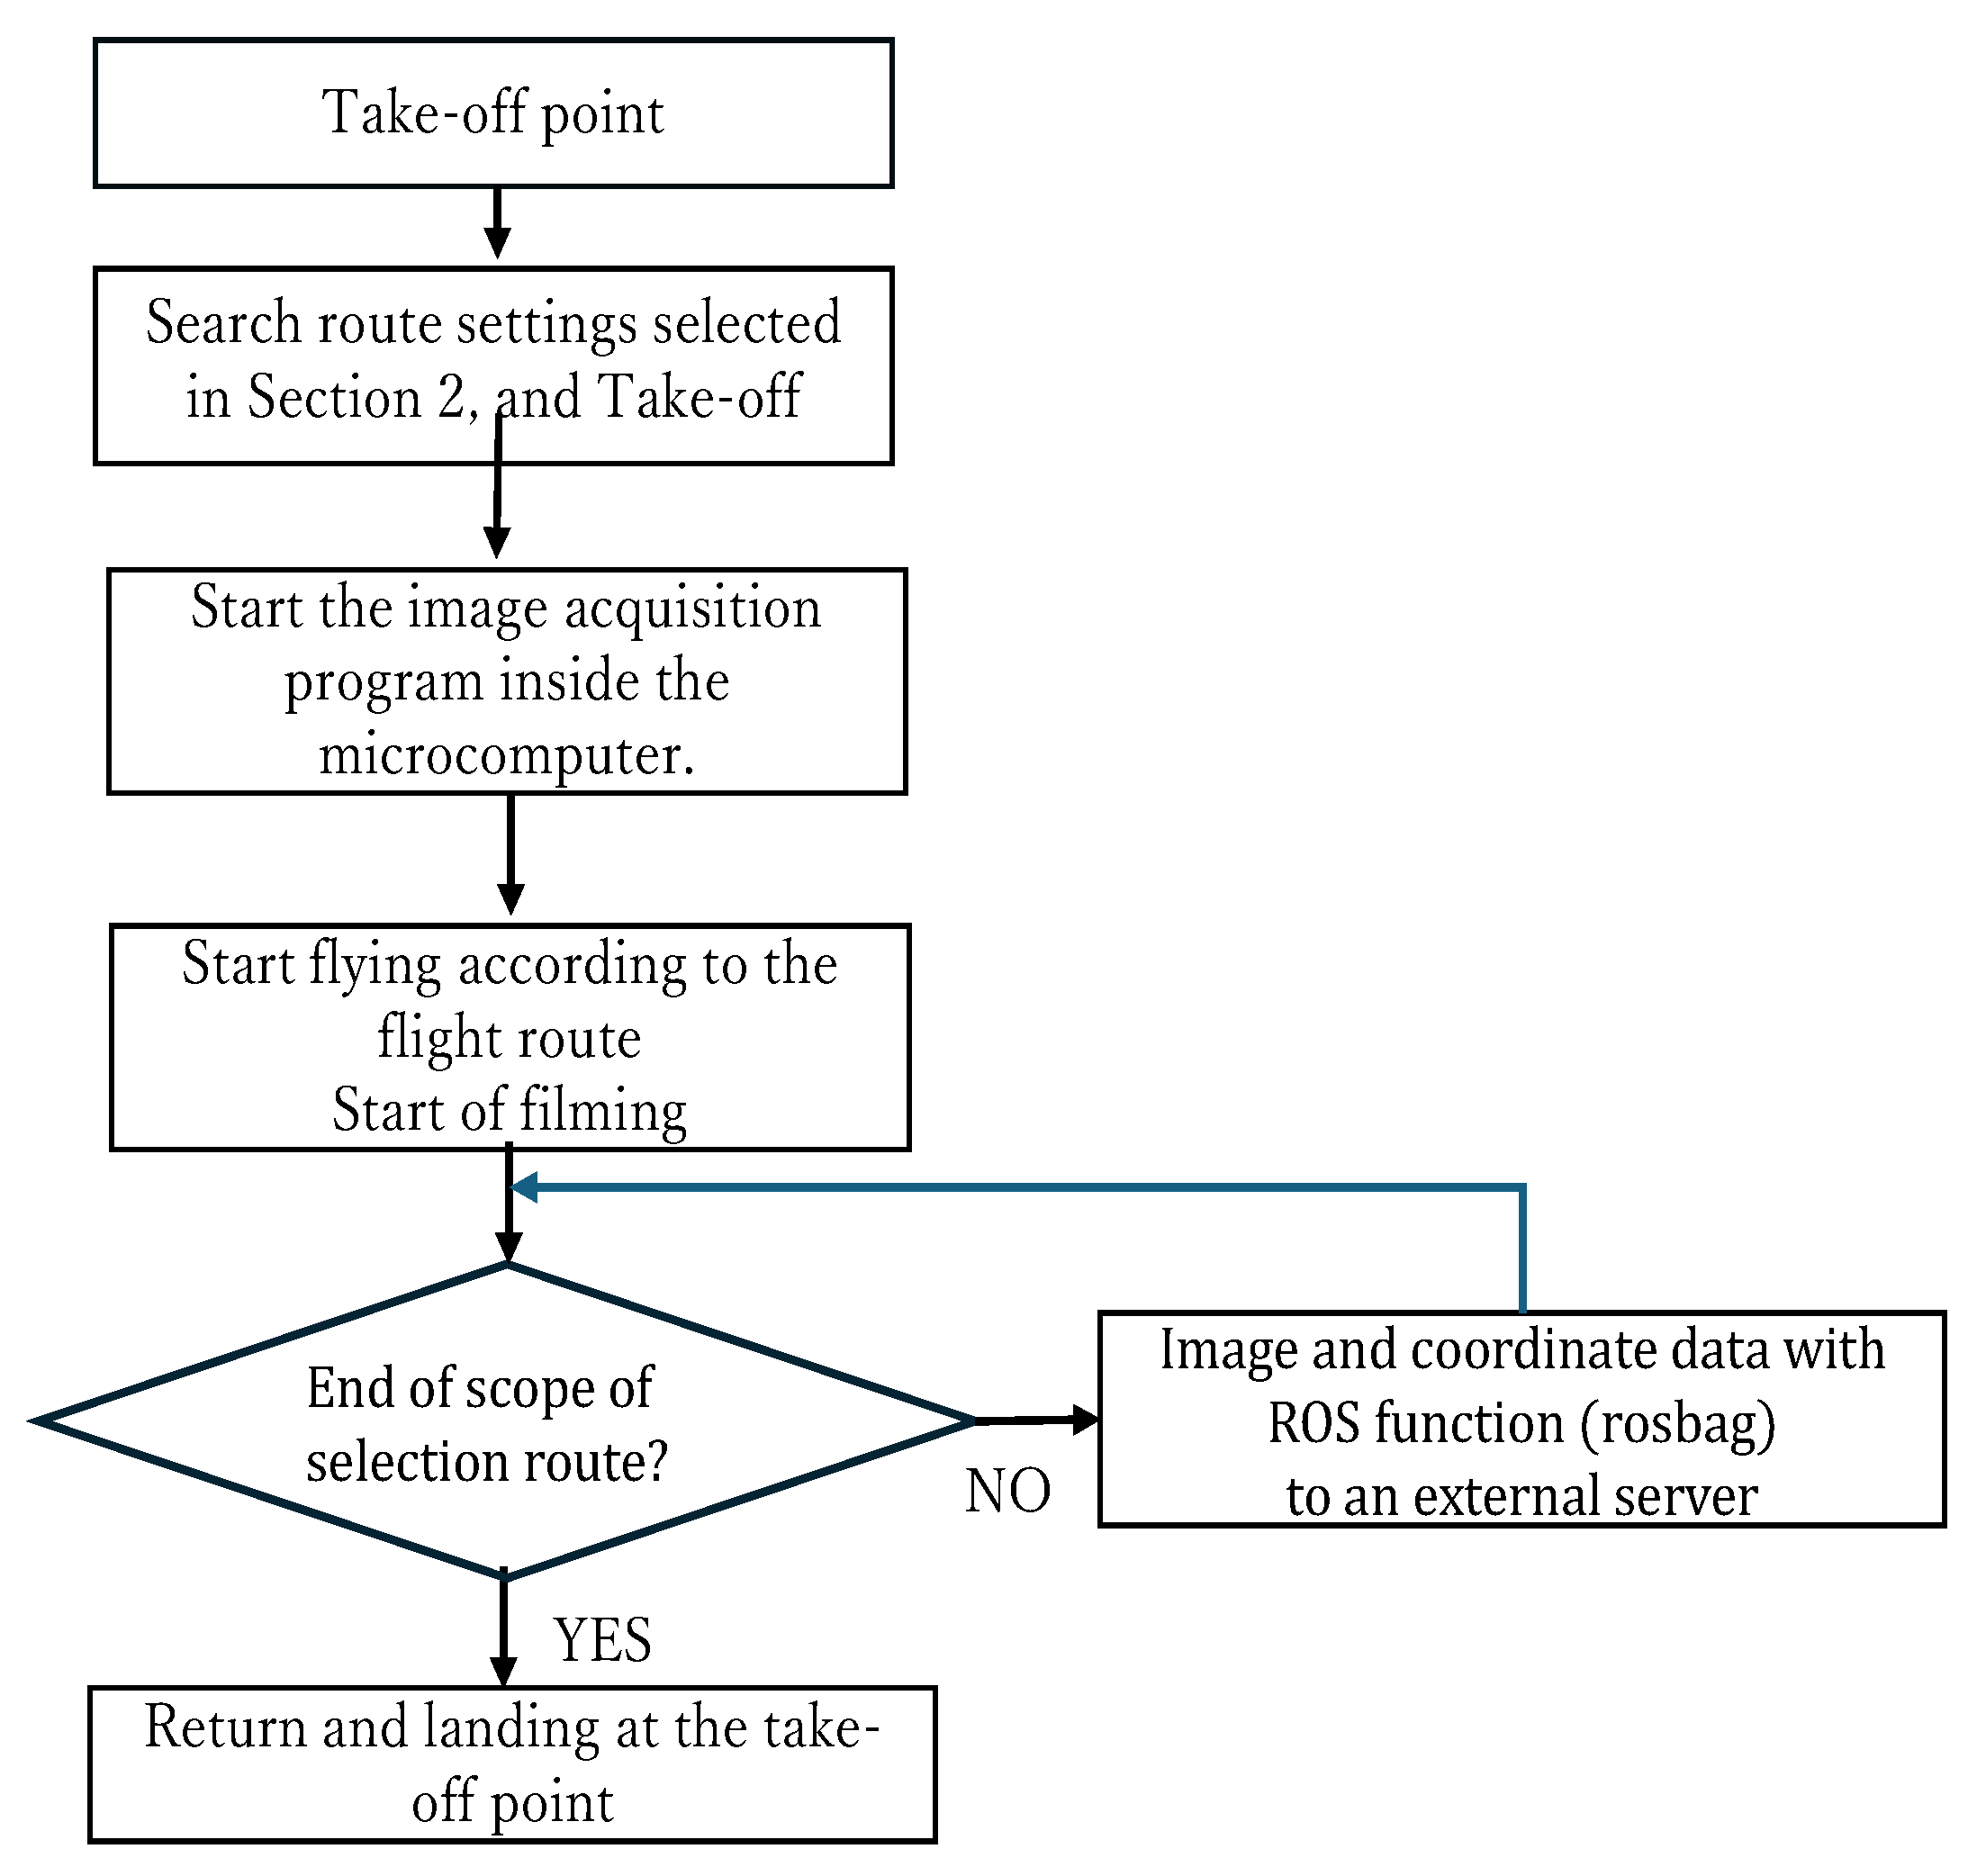
6. Results of Experiments

6.1. Verification of In-Field Flight Experiments

A near-field demonstration experiment was conducted using a drone equipped with these functions. For the flower search flight, the flight path was set to a range of 10 m within the field by the QGC to enable the drone to fly over the selected area. The flight altitude was set to 1.5 m because pear flowers bloom densely at a height of about 1.3 to 1.8 m.
A graph comparing the designed route, actual flight path, and GPS data is shown in Figure 20. Figure 21 shows the cumulative frequency of errors for the error values in the flight paths.
Compared to the error value shown in Figure 10, which was obtained as a preliminary verification, the error range was reduced to within 1.5 m. This may be attributed to the fact that the takeoff time stabilized due to the adjustment of the RTK reference station placement, wind speed on the day of the experiment, and other conditions.
During the search flight, the coordinates of the flowers were analyzed using a depth camera, the coordinates of the drone were analyzed, and the flight points for pollination were exported to a CSV file. The flight control method executes the OFFBOARD mode, and the drone moves by reading the flight point coordinates sequentially from the CSV file. When the flight point coordinates were reached, the ROS program activated the sprayer. When the aircraft began spraying, it hovered for 10 s, and upon completion, it moved to the coordinates of the next flight point. A duration of 10 s was set as the appropriate time for completing the spraying process of drone. When the aircraft reaches the coordinates of all flight points, it returns to the takeoff point and automatically lands. Figure 22 shows the cumulative frequency of errors between the GPS positioning in OFFBOARD mode and the flight point coordinates in the analysis results. The error was not different from the error set by the QGC in Figure 21, indicating that sufficient positioning and flight accuracy were obtained.

6.2. Results of Spraying Experiment

To evaluate pollination effectiveness, a spraying experiment was conducted in a pear field (Kuki Proving Ground, Saitama Agricultural Technology Research Center, Japan). Pollination time and fruiting rates were compared among three pollination methods: puff pollination (manual operation with a pollen-mating brush), solution pollination (manual operation by spraying a pollen suspension solution), and pollination drones. Working time was defined as the pollination time per meter, and the fruiting rate is the number of fruits per floret. Pollen (variety name: Matsushima) collected at the Kuki Proving Ground in 2023 was used in this study. Pollen was diluted 5-fold by weight with lycopodium powder to increase the bulk for puff pollination and 20-fold for pollination drones. For solution pollination, the pollen (1.5 g) was suspended in 500 mL of the solution (333-fold dilution). Domestic farmers commonly use pollen-blending methods. The experimental configuration is shown in Figure 23.
The pollination drone turned its nozzle upward and sprayed pollen once per lateral branch. The flight pattern was as follows: the nozzle moved 200 mm from the coordinates of the pollinate flower, stopped for 3 s, sprayed pollen for 4 s, paused for 3 s, and then moved to the coordinates of the next pollinate flower. The amount of pollen sprayed per second was set at 0.5 to 0.6 mg. To ensure successful pollination, the target was set at 2 mg or more for 4 s.
The drone was flown so that the distance between the nozzle and the flowers was 200mm, so that the nozzle would not collide with the pear branches and the pollen would spread sufficiently. The flowers to be pollinated are clustered together as a bunch, so even if multiple flowers are overlapping, the drone can pollinate them without any problems. Furthermore, the tip of the nozzle is angled upwards, so that the flowers around it can also be pollinated appropriately.
The percentage of fruit set in each test plot is shown in Table 3. The fruiting rate is calculated based on the number of flowers per inflorescence and the number of fruits set per inflorescence. The results showed that the drone pollination treatments were comparable to the conventional Brahma and solution-pollinated treatments. The net pollen consumption per meter of the row was −43% in the Brahma area and −13% in the solution-pollinated area, indicating that the use of pollination drones can significantly contribute to reducing pollen consumption, which was the desired goal. The working hours were −80% in the Brahma area and +26% in the solution-pollinated area but working hours could be further reduced by optimizing the flight pattern.

7. Discussion

Considering the experimental results in Section 6.2, this study developed an automated pollination system for pears using AI and drones, and its effectiveness was validated through field flight experiments. The Holybro X500 V2 drone, utilized in the experiments, achieved stable autonomous flight with an error of approximately 20 cm using RTK-GNSS for flight control, ensuring safe flight while maintaining a proper distance from trees and leaves. Flower detection was performed using a depth camera and YOLO, and by analyzing the drone’s position coordinates, pollination flight points were accurately identified. Additionally, by using OFFBOARD mode for flight control, the sequential reading of flight point coordinates and the automatic operation of the sprayer functioned appropriately. These results indicate that, in addition to the stability of flight control, the accurate detection of flower positions can lead to labor-saving automation, offering the potential to replace manual work.
Moreover, considering of pollination results in Section 6.2 the drone pollination did not show a significant advantage over conventional methods in terms of work time and fruit set rate. However, there was a notable difference in labor requirements, as drone spraying required significantly less human effort compared to solution pollination. This reduction in labor is a key benefit. The fruit set rate for drone pollination was approximately 1–5% lower than that of conventional methods. This may be due to insufficient pollen charging and the greater-than-expected dispersing effect of wind. Improving sprayer performance is an important future task, and enhancements will be implemented by the next flowering season for further verification through re-experiments. Despite the slightly lower fruit set rate, the minimal labor requirements and comparable overall performance confirm that drone pollination is a viable and beneficial technology.

8. Summary

This paper proposes a fully automated drone pollination system that utilizes AI and drones for pollination in pear cultivation and develops a drone that can pollinate pears. The system also has a function that applies high voltage to the nozzle to electrify the pollen, which is adsorbed by an electrostatic charge. However, the quantitative evaluation and improvement of the electrostatic adsorption effect and optimum spraying range depending on wind speed will be the subject of future research. The significant contribution of this study is that an automatic pollination system was developed without altering conventional pear cultivation methods, and the technology was successful in achieving a sufficient production rate in terms of fruiting rate.

Author Contributions

Conceptualization: K.M. and T.H.; Data curation: K.M., S.O. and K.E.; Formal analysis: H.S., K.H. and T.K.; Methodology: K.M, T.H., S.O. and K.E.; Investigation: T.S. and A.S.; Validation: K.M.; Visualization: K.M., S.O. and K.E.; Writing—original draft: K.M. and T.H.; Funding acquisition: Y.T.; Supervision: K.H. and Y.T. All authors have read and agreed to the published version of the manuscript.

Funding

Part of this work is supported by the development and improvement program of strategic smart agricultural technology grants (JPJ011397) from the Project of the Bio-oriented Technology Research Advancement Institution (BRAIN).

Data Availability Statement

Data will be made available upon request.

Acknowledgments

The authors thank Shimon Ajisaka for his technical assistance with research and development.

Conflicts of Interest

The authors declare no conflicts of interest.

References

  1. Cooley, H.; Vallejo-Marín, M. Buzz-Pollinated Crops: A Global Review and Meta-Analysis of the Effects of Supplemental Bee Pollination in Tomato. J. Econ. Entomol. 2021, 114, 505–519. [Google Scholar] [CrossRef] [PubMed]
  2. Vidyadhar, B.; Tomar, B.S.; Singh, B.; Behera, T.K. Effect of Methods and Time of Pollination on Seed Yield and Quality Parameters in Cherry Tomato Grown under Different Protected Conditions. Indian J. Hortic. 2015, 72, 61–66. [Google Scholar] [CrossRef]
  3. Yamashita, K.; Tanimoto, S. Studies on Self-Incompatibility of Hassaku (Citrus hassakuhort. Ex Tanaka). J. Jpn. Soc. Hortic. Sci. 1985, 54, 178–183. [Google Scholar] [CrossRef]
  4. Sassa, H.; Hirano, H.; Ikehashi, H. Identification and Characterization of Stylar Glycoproteins Associated with Self-Incompatibility Genes of Japanese Pear, Pyrus serotina Rehd. Mol. Gen. Genet. 1993, 241, 17–25. [Google Scholar] [CrossRef]
  5. Murakami, S.; Yamane, S.; Hashimoto, N.; Araki, Y. Artificial Pollination of Japanese Pear and Kiwifruit Using Electrostatic Pollen Dusting Machines. Hortic. Res. 2020, 19, 365–372. [Google Scholar] [CrossRef]
  6. Tomita, A.; Shinya, K.; Inomata, M. Comparison of Farm Working Efficiency and Working Load Between Hedge-Row Training and Free Standing Training in the “Satonishiki” Sweet Cherry Production. J. Jpn. Soc. Agric. Technol. Manag. 2011, 17, 125–130. [Google Scholar] [CrossRef]
  7. Kurahashi, T.; Takahashi, K. Comparison of Work Efficiency between “Fuji” Apple Trees Trained to a Y-Trellis and Central Leader System. J. Jpn. Soc. Agric. Technol. Manag. 1995, 2, 15–19. [Google Scholar] [CrossRef]
  8. Lee, H.-J.; Jeong, R.-D. Metatranscriptomic Analysis of Plant Viruses in Imported Pear and Kiwifruit Pollen. Plant Pathol. J. 2022, 38, 220–228. [Google Scholar] [CrossRef]
  9. Shibasaki, A.; Shimada, T.; Kondo, S.; Ohara, H.; Ohkawa, K. Varietal Tolerance of Pear Flower Pollen to Low-Temperatures Treatment During Pollen Development and Damage Inhibition by Coffee Extract. Hortic. J. 2023, 92, 151–161. [Google Scholar] [CrossRef]
  10. Endo, K.; Hiraguri, T.; Kimura, T.; Shimizu, H.; Shimada, T.; Shibasaki, A.; Suzuki, C.; Fujinuma, R.; Takemura, Y. Estimation of the Amount of Pear Pollen Based on Flowering Stage Detection Using Deep Learning. Sci. Rep. 2024, 14, 13163. [Google Scholar] [CrossRef]
  11. Kirillov, A.; He, K.; Girshick, R.; Rother, C.; Dollár, P. Panoptic Segmentation. In Proceedings of the 2019 IEEE/CVF Conference on Computer Vision and Pattern Recognition (CVPR), Long Beach, CA, USA, 15–20 June 2019; pp. 9396–9405. [Google Scholar]
  12. Chen, L.-C.; Papandreou, G.; Kokkinos, I.; Murphy, K.; Yuille, A.L. DeepLab: Semantic Image Segmentation with Deep Convolutional Nets, Atrous Convolution, and Fully Connected CRFs. IEEE Trans. Pattern Anal. Mach. Intell. 2018, 40, 834–848. [Google Scholar] [CrossRef] [PubMed]
  13. Shelhamer, E.; Long, J.; Darrell, T. Fully Convolutional Networks for Semantic Segmentation. IEEE Trans. Pattern Anal. Mach. Intell. 2017, 39, 640–651. [Google Scholar] [CrossRef] [PubMed]
  14. Ronneberger, O.; Fischer, P.; Brox, T. U-Net: Convolutional Networks for Biomedical Image Segmentation. In Proceedings of the Medical Image Computing and Computer-Assisted Intervention—MICCAI 2015, Munich, Germany, 5–9 October 2015; Navab, N., Hornegger, J., Wells, W.M., Frangi, A.F., Eds.; Springer International Publishing: Cham, Switzerland, 2015; pp. 234–241. [Google Scholar]
  15. Vincenty, T. Direct and Inverse Solutions of Geodesics on the Ellipsoid with Application of Nested Equations. Surv. Rev. 1975, 23, 88–93. [Google Scholar] [CrossRef]
  16. Vincenty, T. Geodetic Inverse Solution between Antipodal Points. DMAAC Geod. Surv. Squadron 1975. [Google Scholar] [CrossRef]
  17. Vincenty, T. Correspondence. Surv. Rev. 1976, 23, 294. [Google Scholar]
  18. Radočaj, D.; Plaščak, I.; Jurišić, M. Global Navigation Satellite Systems as State-of-the-Art Solutions in Precision Agriculture: A Review of Studies Indexed in the Web of Science. Agriculture 2023, 13, 1417. [Google Scholar] [CrossRef]
  19. Hofmann-Wellenhof, B.; Lichtenegger, H.; Wasle, E. GNSS-Global Navigation Satellite Systems: GPS, GLONASS, Galileo, and Others; Springer: Vienna, Austria, 2008; ISBN 978-3-211-73012-6. [Google Scholar]
  20. Boquet, G.; Vilajosana, X.; Martinez, B. Feasibility of Providing High-Precision GNSS Correction Data Through Non-Terrestrial Networks. IEEE Trans. Instrum. Meas. 2024, 73, 1–15. [Google Scholar] [CrossRef]
  21. Miwa, M.; Ushiroda, T. Precision Flight Drones with RTK-GNSS. J. Robot. Mechatron. 2021, 33, 371–378. [Google Scholar] [CrossRef]
  22. ZED-F9P. Available online: https://qzss.go.jp/usage/products/ublox_200709.html (accessed on 19 December 2024).
  23. QGroundControl. Available online: https://qgroundcontrol.com/ (accessed on 19 December 2024).
  24. X500 V2 Kits. Available online: https://holybro.com/collections/x500-kits (accessed on 19 December 2024).
  25. Gebrehiwet, L.; Negussie, Y.; Tesfaye, E. A Review on Drone Ground Control Station, Configurations, Types and the Communication Systems. IJISEA 2024, 5, 1–16. [Google Scholar]
  26. Starov, D.; Koryakova, V.; Kwabena, P.; Gladyshev, M. Control Method for an Autonomous Group of Multi-Rotor Aircraft. In Proceedings of the 2023 7th International Conference on Information, Control, and Communication Technologies (ICCT), Astrakhan, Russia, 2–6 October 2023; pp. 1–4. [Google Scholar]
  27. Cañas, J.M.; Martín-Martín, D.; Arias, P.; Vega, J.; Roldán-Álvarez, D.; García-Pérez, L.; Fernández-Conde, J. Open-Source Drone Programming Course for Distance Engineering Education. Electronics 2020, 9, 2163. [Google Scholar] [CrossRef]
  28. Yanase, N.; Murasaki, K.; Shimada, Y.; Taniguchi, Y. Estimating Object Size from a Single Image Using Estimated Depth and Geometric Constraints. Proc. Ite Annu. Conv. 2017, 2017, 33B-2. [Google Scholar] [CrossRef]
  29. Raspberry Pi4 Model B. Available online: https://www.raspberrypi.com/products/raspberry-pi-4-model-b/ (accessed on 19 December 2024).
  30. Redmon, J.; Divvala, S.; Girshick, R.; Farhadi, A. You Only Look Once: Unified, Real-Time Object Detection. In Proceedings of the 2016 IEEE Conference on Computer Vision and Pattern Recognition (CVPR), Las Vegas, NV, USA, 27–30 June 2016; pp. 779–788. [Google Scholar]
  31. Redmon, J.; Farhadi, A. YOLO9000: Better, Faster, Stronger. In Proceedings of the 2017 IEEE Conference on Computer Vision and Pattern Recognition (CVPR), Honolulu, HI, USA, 21–26 July 2017; pp. 6517–6525. [Google Scholar]
  32. Redmon, J.; Farhadi, A. YOLOv3: An Incremental Improvement. arXiv 2018, arXiv:1804.02767. [Google Scholar] [CrossRef]
  33. Li, Y.; Ibanez-Guzman, J. Lidar for Autonomous Driving: The Principles, Challenges, and Trends for Automotive Lidar and Perception Systems. IEEE Signal Process. Mag. 2020, 37, 50–61. [Google Scholar] [CrossRef]
  34. Li, Y.; Ma, L.; Zhong, Z.; Liu, F.; Chapman, M.A.; Cao, D.; Li, J. Deep Learning for LiDAR Point Clouds in Autonomous Driving: A Review. IEEE Trans. Neural Netw. Learn. Syst. 2021, 32, 3412–3432. [Google Scholar] [CrossRef] [PubMed]
  35. RealSense LiDAR Camera D435i. Available online: https://www.physical-computing.jp/product/2098 (accessed on 19 December 2024).
  36. Sota, O.; Kohei, T.; Tomotaka, K.; Hiroyuki, S.; Takefumi, H.; Akane, S.; Tomohito, S.; Yoshihiro, T. Pear Blossom Counting System with Drones Using YOLO and Deep SORT. In Proceedings of the 2024 International Conference on Image Processing and Robotics (ICIPRoB), Colombo, Sri Lanka, 9–10 March 2024; pp. 1–4. [Google Scholar]
  37. Zhang, J.; Rivera, C.E.O.; Tyni, K.; Nguyen, S. AirPilot: Interpretable PPO-Based DRL Auto-Tuned Nonlinear PID Drone Controller for Robust Autonomous Flights. arXiv 2025, arXiv:2404.00204. [Google Scholar] [CrossRef]
  38. Xu, B.; Gao, F.; Yu, C.; Zhang, R.; Wu, Y.; Wang, Y. OmniDrones: An Efficient and Flexible Platform for Reinforcement Learning in Drone Control. IEEE Robot. Autom. Lett. 2024, 9, 2838–2844. [Google Scholar] [CrossRef]
  39. Caballero-Martin, D.; Lopez-Guede, J.M.; Estevez, J.; Graña, M. Artificial Intelligence Applied to Drone Control: A State of the Art. Drones 2024, 8, 296. [Google Scholar] [CrossRef]
  40. Bailey, A.G. The Science and Technology of Electrostatic Powder Spraying, Transport and Coating. J. Electrost. 1998, 45, 85–120. [Google Scholar] [CrossRef]
  41. Scholl, M.; Vogel, N.; Lang, S. Electrostatic Powder Coating as a Novel Process for High-Voltage Insulation Applications. Adv. Eng. Mater. 2023, 25, 2300465. [Google Scholar] [CrossRef]
Figure 1. Manual pollination by Brahma.
Agriengineering 07 00068 g001
Figure 2. Flight Route Selection and Flight Accuracy.
Agriengineering 07 00068 g002
Figure 3. Methodology for selecting flight routes within a pear field.
Agriengineering 07 00068 g003
Figure 4. Results of flight route selection. Upper: Original image, Lower: Selection result.
Agriengineering 07 00068 g004
Figure 5. Preparation for conversion to latitude and longitude.
Agriengineering 07 00068 g005
Figure 6. Acquisition of drone flight coordinates by satellite positioning method.
Agriengineering 07 00068 g006
Figure 7. Method of obtaining carrier phase.
Agriengineering 07 00068 g007
Figure 8. Satellite receiver and RTK receiver.
Agriengineering 07 00068 g008
Figure 9. Comparison of satellite positioning and set routes.
Agriengineering 07 00068 g009
Figure 10. Accumulated frequency of errors relative to the set route.
Agriengineering 07 00068 g010
Figure 11. Search route flight procedure and image transmission method.
Agriengineering 07 00068 g011
Figure 12. Procedures for transmitting images of flowers.
Agriengineering 07 00068 g012
Figure 13. Search flight flowchart.
Agriengineering 07 00068 g013
Figure 14. Pollinable flower shape. Right: pollinable, Left: non-pollinable.
Agriengineering 07 00068 g014
Figure 15. Flower detection by YOLO and calculation of flower coordinates by the depth camera.
Agriengineering 07 00068 g015
Figure 16. Image analysis of pollinable flowers and coordinate acquisition.
Agriengineering 07 00068 g016
Figure 17. Flowchart of pollination operation.
Agriengineering 07 00068 g017
Figure 18. Appearance of pollination drones.
Agriengineering 07 00068 g018
Figure 19. Sprayer Specifications.
Agriengineering 07 00068 g019
Figure 20. Comparison of satellite positioning for set routes in the field.
Agriengineering 07 00068 g020
Figure 21. Accumulated frequency of errors for QGC.
Agriengineering 07 00068 g021
Figure 22. Accumulated frequency of errors for OFFBOARD-set routes.
Agriengineering 07 00068 g022
Figure 23. Experimental configuration with pollination drone.
Agriengineering 07 00068 g023
Table 1. Equipment and conditions used.
Positioning Calculation SoftwareQGrandControl
Receiveru-Blox ZED-F9P
Satellite systemGPS, GLONASS, Galileo, QZSS
Observation pointsNippon Institute of Technology
Campas Ground
Table 2. Aircraft Specifications.
Size of the Aircraft61 × 61 × 31 (cm)
load1500 g (Excludes battery)
Flight time18 min hovering
Camera TypeIntel Realsense Depth camera D435i
Satellite system usedGPS, GLONASS, Galoleo, QZSS
Table 3. Comparison of fruiting rate in each test plot.
Pollination
Method
Rows of Trees per 1 mNumber of Flowers per Inflorescence (Count)Number of Fruits Set per Inflorescence (Count)Fruiting Rate
(%)
Pure Pollen
Usage (mg)
Powdering Operations
Time (s)
Puff pollination 39.71967.05.578.9
Solution pollination25.9256.95.681.8
Drone pollination22.5396.85.277.4
Disclaimer/Publisher’s Note: The statements, opinions and data contained in all publications are solely those of the individual author(s) and contributor(s) and not of MDPI and/or the editor(s). MDPI and/or the editor(s) disclaim responsibility for any injury to people or property resulting from any ideas, methods, instructions or products referred to in the content.

