Article

Development and Evaluation of a Multiaxial Modular Ground Robot for Estimating Soybean Phenotypic Traits Using an RGB-Depth Sensor

by
James Kemeshi
1,
Young Chang
1,*,
Pappu Kumar Yadav
1,
Maitiniyazi Maimaitijiang
2 and
Graig Reicks
3
1
Department of Agricultural and Biosystems Engineering, South Dakota State University, Brookings, SD 57007, USA
2
Geospatial Sciences Center of Excellence, Department of Geography and Geospatial Sciences, South Dakota State University, Brookings, SD 57007, USA
3
Department of Agronomy, Horticulture and Plant Science, South Dakota State University, Brookings, SD 57007, USA
*
Author to whom correspondence should be addressed.
AgriEngineering 2025, 7(3), 76; https://doi.org/10.3390/agriengineering7030076
Submission received: 14 January 2025 / Revised: 23 February 2025 / Accepted: 4 March 2025 / Published: 11 March 2025

Abstract

:
Achieving global sustainable agriculture requires farmers worldwide to adopt smart agricultural technologies, such as autonomous ground robots. However, most ground robots are either task- or crop-specific and expensive for small-scale farmers and smallholders. Therefore, there is a need for cost-effective robotic platforms that are modular by design and can be easily adapted to varying tasks and crops. This paper describes the hardware design of a unique, low-cost multiaxial modular agricultural robot (ModagRobot), and its field evaluation for soybean phenotyping. The ModagRobot’s chassis was designed without any welded components, making it easy to adjust trackwidth, height, ground clearance, and length. For this experiment, the ModagRobot was equipped with an RGB-Depth (RGB-D) sensor and adapted to safely navigate over soybean rows to collect RGB-D images for estimating soybean phenotypic traits. RGB images were processed using the Excess Green Index to estimate the percent canopy ground coverage area. 3D point clouds generated from RGB-D images were used to estimate canopy height (CH) and the 3D Profile Index of sample plots using linear regression. Aboveground biomass (AGB) was estimated using extracted phenotypic traits. Results showed an R2, RMSE, and RRMSE of 0.786, 0.0181 m, and 2.47%, respectively, between estimated CH and measured CH. AGB estimated using all extracted traits showed an R2, RMSE, and RRMSE of 0.59, 0.0742 kg/m2, and 8.05%, respectively, compared to the measured AGB. The results demonstrate the effectiveness of the ModagRobot for in-row crop phenotyping.

1. Introduction

The increasing food demand driven by global population growth and limited agricultural resources necessitates the adoption of smart agriculture to improve agricultural productivity. The adoption of smart agriculture is particularly vital among small-scale farms, which constitute 85% of farms in the United States [1]. Domains of smart agriculture, such as monitoring, prediction, logistics, and control, rely on ground robots for efficient operation [2].
Crop phenotyping is an important task in modern agriculture due to its relevance in crop breeding programs and precision agriculture [3]. Traditional methods of measuring crop phenotypic traits, such as the use of rulers or measuring tapes for measuring traits like plant height and leaf area, as well as reliance on visual scoring by experts, are laborious, time-consuming, and prone to error due to direct human involvement [4,5]. Additionally, traits such as crop biomass and chlorophyll content were measured using destructive methods [6,7]. To mitigate these shortcomings, non-invasive approaches have been adopted, such as using optical sensors mounted on drones or ground robots [8,9].
In recent years, several agricultural ground robots have been developed for specific tasks such as plant phenotyping and harvesting of specific crops [9,10]. However, the functionality of these ground robots in smart agriculture is constrained by their design, which may contribute to the low adoption rate of ground robot technology among small-scale farmers. These ground robots often lack the characteristics of modularity due to their rigid chassis. Furthermore, mechanisms such as suspension systems that aid stable motion are often left out in the design of their drivetrain, as evident in the design of the Robotanist and TERRA-MEPP [11,12]. A typical smart farm contains different types of crops with varying characteristics like canopy height and row spacing at different stages of crop development. Therefore, a ground robot designed for use on such a farm must have modular features to adapt its frame for specific tasks and to navigate between and over crops without causing damage to itself and the crops.
Agricultural ground robots with varying levels of modularity have been developed over the past decade. The BoniRob (V2) platform, introduced by Bangert et al. [13], is a uniaxial modular ground robot. It is recognized as one of the pioneers in the design of modular agricultural ground robots and has the capability of adjusting its chassis width. Bawden et al. [14] developed the AgBotII, a uniaxial modular ground robot designed with an adjustable chassis width to suit various tasks. The Armadillo Scout and MARS X platforms developed by Nielsen et al. [15] and Xu and Li [16], respectively, are biaxial modular ground robots with adjustable chassis height and width, enhancing their functionality. The Flex-Ro and Thorvald II ground robots introduced by Murman [17] and Grimstad and From [18], respectively, are the first designs of multiaxial modular ground robots, with the ability to reconfigure their chassis to vary the width, height, and ground clearance. More recently, Hefty was introduced by Guri et al. [19] and was adapted from the Farm-ng robot (Amiga). Hefty is also a multiaxial modular ground robot for versatile applications in smart agriculture. The Hefty platform outperforms the Flex-Ro and Thorvald II platforms with its user-friendly design, which simplifies the reconfiguration of its chassis to meet the specific requirements of various tasks. However, a suspension system was not included in its design. Except for the AgBotII, MARS X, and Thorvald II platforms, other modular platforms mentioned above did not incorporate suspension systems in their design to minimize mechanical complexity at the expense of stability.
The potential of multiaxial modular ground robots to improve agricultural productivity is substantial. However, the high initial cost of these robots poses a significant barrier to adoption by most small-scale farmers. Therefore, in this study, we developed the ModagRobot—a low-cost multiaxial modular agricultural robot that can be easily reconfigured using simple tools to meet the requirements of smart agriculture tasks. The ModagRobot’s design was motivated by the need for a cost-effective robot that can be used for different agricultural applications, including intra-row and over-canopy applications. Before commencement of the robot’s design, a set of functional requirements were considered based on recommendations from literature and practical experiments performed on previous platforms. The functional requirements covered these considerations:
  • Modularity: Most ground robots developed for agricultural research have restricted functionality due to their chassis designs [16]. To solve this problem and enable functionality across different agricultural applications and a wide range of crops, it was necessary for the robot’s chassis dimensions to be easily adjustable and replaceable to ensure modularity.
  • Payload capacity: To facilitate the incorporation of various sensors, manipulators, and tanks required for precision agriculture applications, including phenotyping, spot spraying, and harvesting, a significant payload capacity was necessary.
  • Environmental considerations: Gonzalez-de-Santos et al. [20] recommended the use of lighter vehicles on the farm to reduce the effect of soil compaction on soil microorganisms. To this end, the robot’s chassis material needed to be lightweight, sturdy, and rigid.
  • Material cost: Recent surveys highlighted economic and financial-related issues as a major barrier to the adoption of ground robot technology by farmers [21,22]. To promote the adoption of ground robot technology while ensuring cost-effectiveness and efficiency, materials and components were optimally selected.
  • Safety: Ensuring the safety of both humans and crops on the farm is crucial for the successful integration of ground robots. To achieve this, it was necessary for safety features to be included in the navigation algorithm of the vehicle.
Previously, several mobile platforms have been equipped with sensors like ultrasonic rangefinders, RGB and depth cameras, 2D or 3D LiDAR, and spectrometers to facilitate the high-throughput phenotyping (HTP) for various crops. For instance, the Flex-Ro platform was equipped with an ultrasonic sensor and deployed for HTP of soybean canopy height [17]. Jimenez-Berni et al. [9] integrated a 2D LiDAR on the Phenomobile Lite for HTP of wheat, enabling the estimation of plant traits such as canopy height, canopy ground cover, and aboveground biomass (AGB). Cai et al. [23] utilized a 3D LiDAR installed on a mobile platform for extracting individual plant height and crown width for various lettuce species. An RGB-Depth (RGB-D) camera was used by Song et al. [24] to estimate phenotypic traits such as plant height, leaf area, and projected area for various crops, including cotton and maize.
In the context of soybean AGB estimation, researchers have also explored the use of satellite data and Uncrewed Aircraft System (UAS)-based imaging. Kross et al. [25] and Mandal et al. [26] used RapidEye imagery and C-band polarimetric Synthetic Aperture Radar (SAR) data, respectively, to estimate crop biomass. Maimaitijiang et al. [8] utilized RGB imagery obtained from a UAS platform and achieved an R2 of 0.893 and an RMSE of 0.194 kg/m2 using a vegetation index-weighted canopy volume model (CVMVI). Similarly, Okada et al. [27] employed UAS-acquired RGB imagery with deep learning models, achieving accuracy scores between 0.935 and 0.94. Despite these advancements, ground mobile platforms equipped with RGB-D cameras remain underexplored for soybean AGB estimation, and this study aims to bridge this gap. Therefore, the objective of this study was to present the hardware design of the ModagRobot, including the suspension and drivetrain modules, and evaluate its data acquisition capability for estimating soybean phenotypic traits, such as canopy height, percent canopy ground coverage area, and AGB, using an RGB-D camera. The outcome of this study is expected to promote sustainable agriculture by stimulating the adoption of ground robots by small-scale farmers.

2. Materials and Methods

2.1. Phenotyping System Overview

The proposed platform, which is adaptable to a wide range of agricultural applications, was adapted to obtain phenotypic traits of soybean crops. The phenotyping system consisted of the ModagRobot shown in Figure 1, with an RGB-D camera mounted at a height of 1.77 m. The robot’s chassis was reconfigured to have a ground clearance of 0.9 m, a width of 1 m, and a height of 1.77 m, enabling it to navigate safely over the rows without causing crop damage.

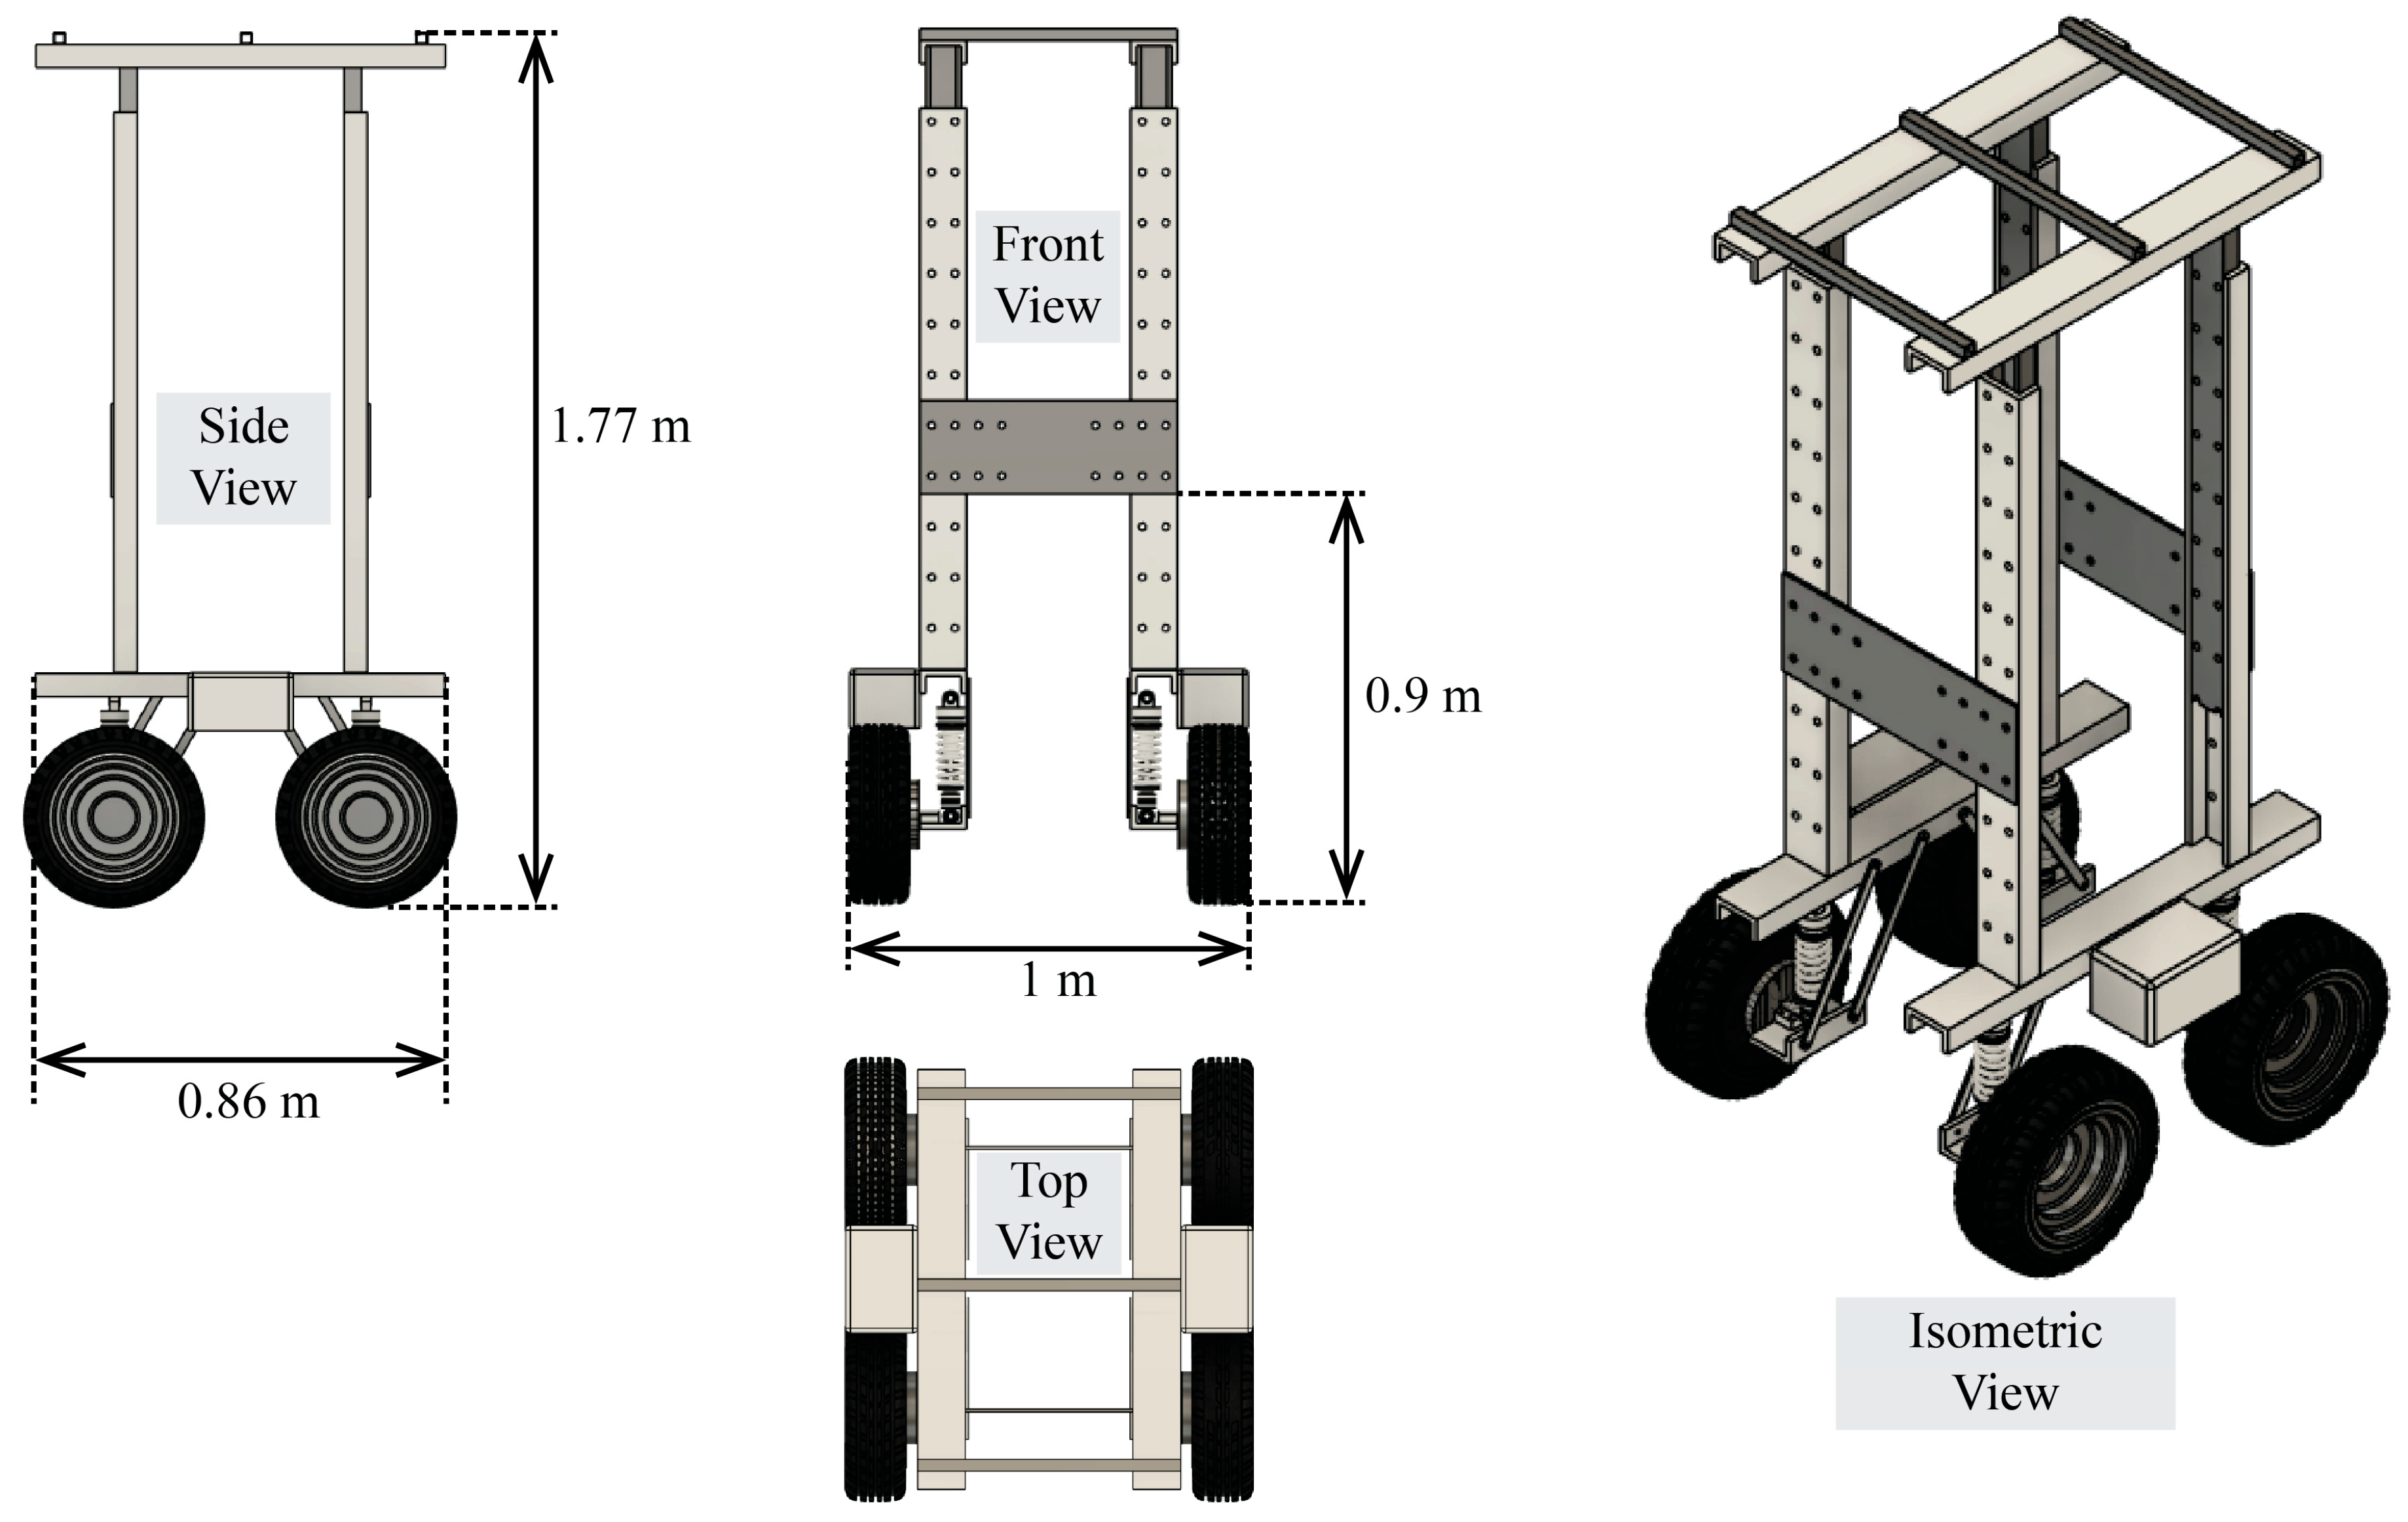
2.2. Platform Design

To offer a solution to the state-of-the-art agricultural ground robots, which show limitations, such as high cost, functional versatility, and modularity, a custom multiaxial modular robot was designed and developed, such that it can be adapted to a wide range of crops, including row, orchard, and horticultural crops. The robot’s frame consisted of separate individual modules that are fastened together using only bolts and nuts. These modules can be easily changed or replaced to modify the structure of the robot. The modular robot prototype was a 4-wheel drive, skid steer robot that is capable of stable navigation on all terrains due to independent suspension systems incorporated on all 4 wheels of the vehicle. Table 1 highlights the specifications of the ModagRobot.

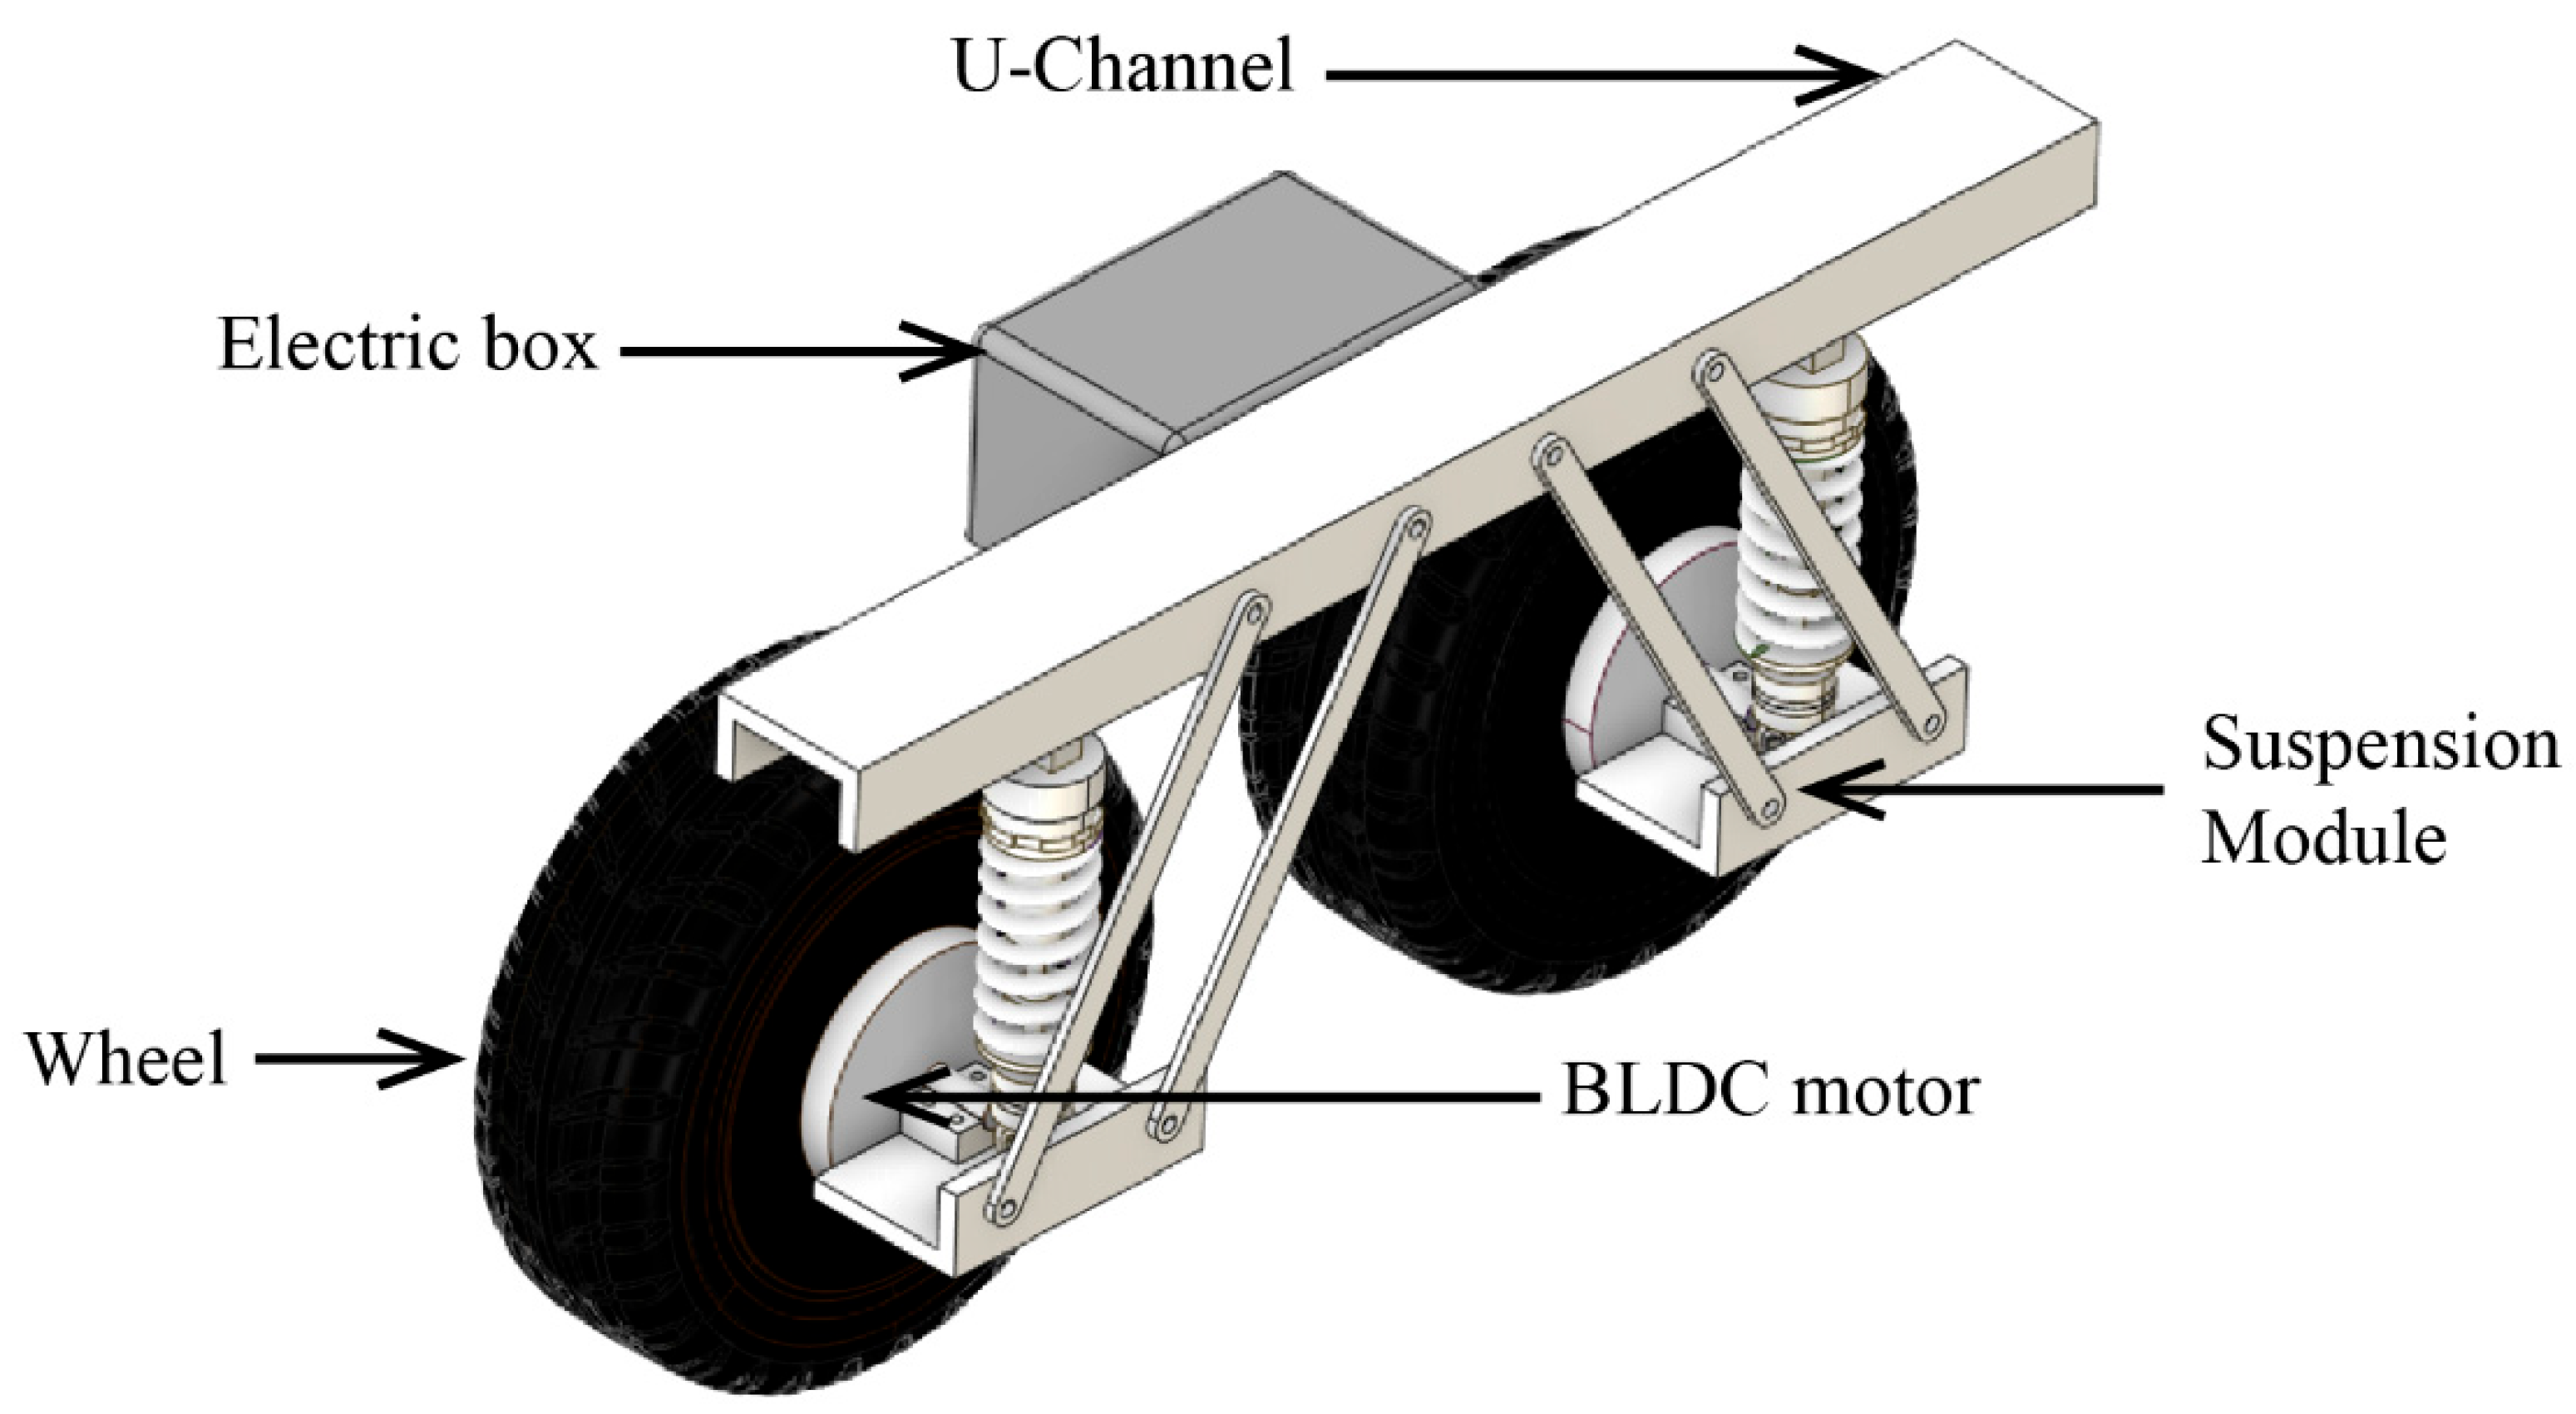
2.2.1. Independent Suspension Module

Building on the study of Kemeshi et al. [28], a suspension module was designed to improve the stability of the modular robot on uneven terrain. The suspension module consists of two aluminum bar linkages (0.038 × 0.0095 × 0.33 m), an angle bar (0.1016 × 0.00635 × 0.508 m), a shock absorber (maximum load of 158 kg), and a wheel shaft mount, as illustrated in Figure 2.

2.2.2. Drivetrain

The vehicle’s drivetrain consists of two separate modules connected by extruded aluminum channels. Each module was designed such that two active wheels, with independent suspension systems (Figure 3), are fastened to an aluminum U-channel. Each wheel in a module is actuated by a brushless direct current (BLDC) motor that was adapted from a hoverboard (model: HY-RM-ULTRA, DGL Group, Edison, NJ, USA) and has proven to be cost-effective and reliable over the years. In compliance with the IEC 60,529 standard, an ABS plastic enclosure (IP65) houses all electrical components, such as 350 W DC motor controllers (model: KJL-01, RioRand) for each motor and a microcontroller (model: Arduino Uno, Arduino, Somerville, MA, USA). These components are powered by a 36 V battery (Shenzhen Longting Technology Co. Ltd., Guangdong, China). The separate modules communicate through two HC-05 Bluetooth serial modules (HiLetgo, Guangdong, China) configured in a master-slave relationship. The costs of these components are shown in Table 2.

2.3. Evaluation of the ModagRobot in Soybean Phenotyping

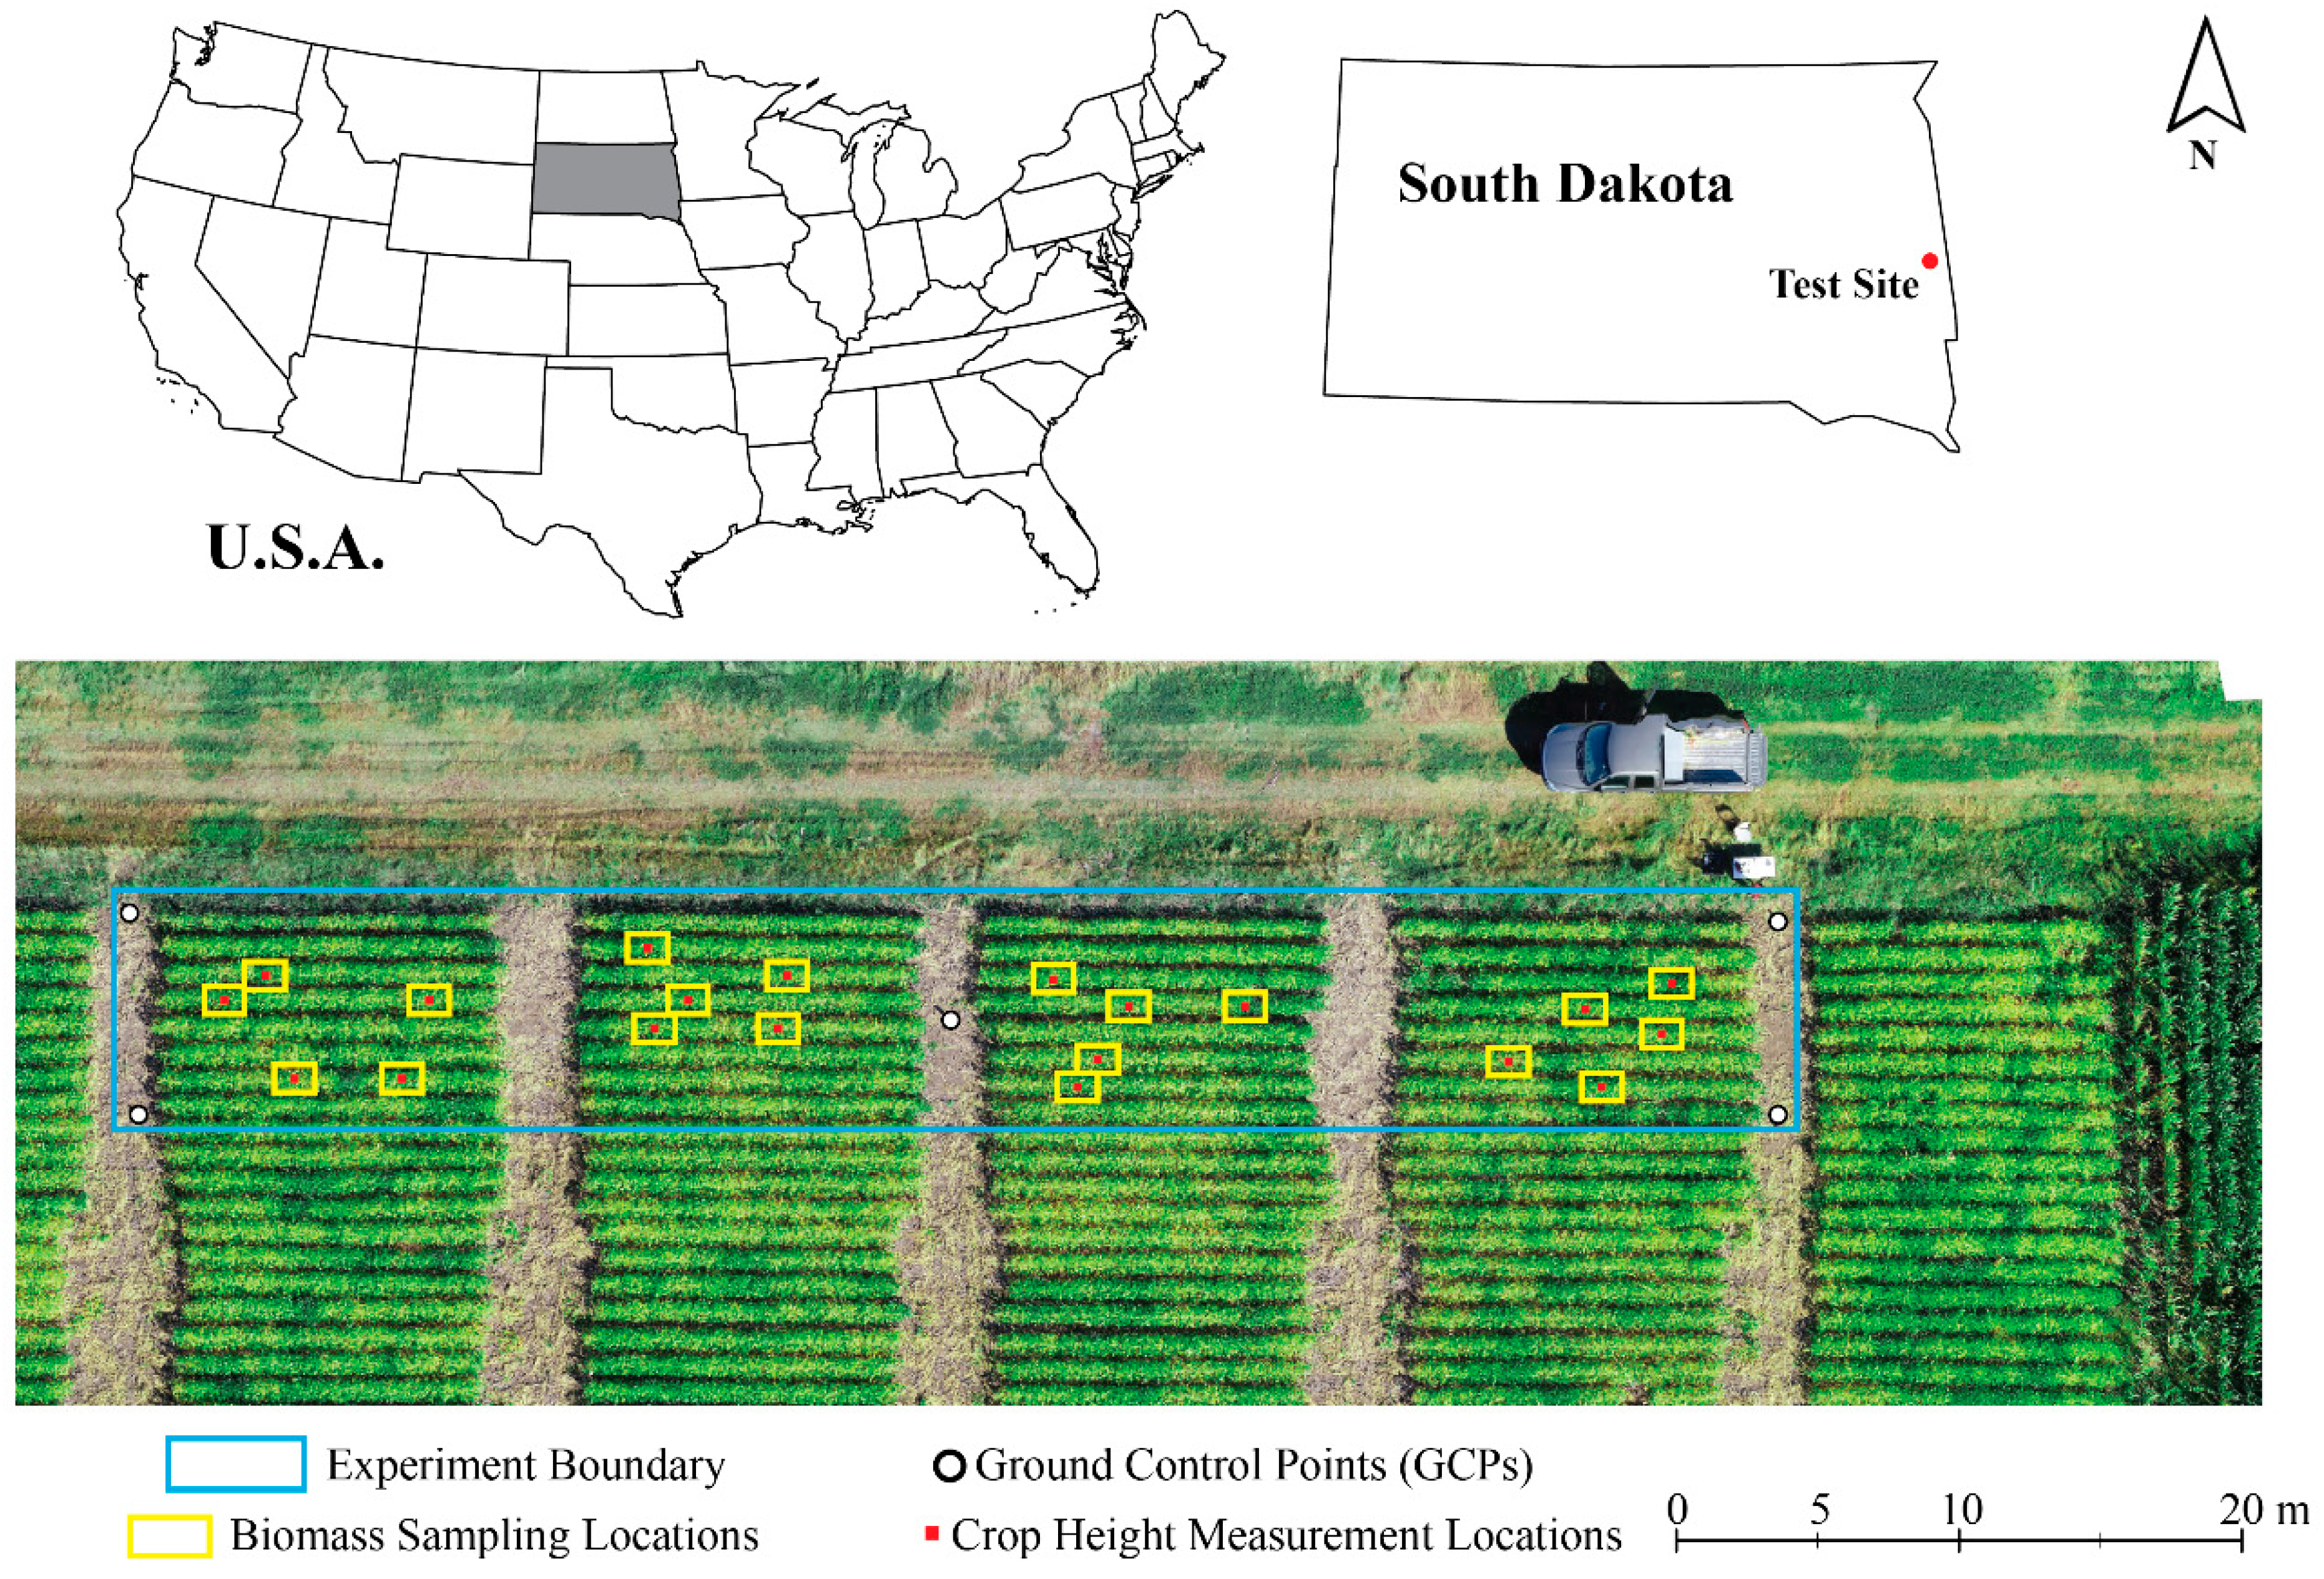
2.3.1. Study Area and Data

Test Site and Experimental Setup

The experiment was carried out at the South Dakota State University’s Agricultural Experiment Center, Aurora, Brookings, South Dakota, USA (44.3096 N, 96.6701 W). Soybean (variety: AG14XF4, Asgrow, Kalamazoo, MI, USA) was planted on an untilled, Brandt silty clay loam, at a row spacing and planting density of 0.76 m and 40 seeds per m2, respectively, on 3 June 2024. The experiment plot was rainfed and composed of 4 smaller plots, each having 8 rows, of which 20 sampling locations were randomly selected, as illustrated in Figure 4.

Ground Truth Data Acquisition

Prior to data collection, each sampling location (1 m × 0.762 m = 0.762 m2) was flagged for easy detection of the area. On 13 September 2024, canopy height for all 20 sampling locations was obtained by measuring the height of 3 randomly selected plants in each location and taking the average. Immediately after collecting RGB-D images of each sampling location, AGB samples were collected by cutting the stems of crops within 1 m of row length approximately 2 cm above the soil surface. The wet weight of the samples was measured immediately, and then the samples were oven dried at 37 °C until a constant weight was achieved. The dry weight of the samples was then measured, and area-wise dry AGB was computed as shown in Equation (1).
Above Ground   Biomass   ,   AGB   kg m 2 = Dry   weight   kg Sampling   area   m 2  

ModagRobot Data Acquisition

In addition to collecting canopy height and AGB data, RGB and depth images were captured automatically between 12 PM and 3 PM at each sampling location. This was performed by manually controlling the ModagRobot with a telemetry transmitter to navigate over the soybean rows to each sampling location. These RGB and depth images were acquired at a resolution of 640 × 480 and a frequency of 1 Hz by an Intel RealSense RGB-D sensor (D435, Intel Corporation, Santa Clara, CA, USA) installed on the ModagRobot and connected to a DELL computer (DELL Technologies, Round Rock, TX, USA) running a Python (V 3.9.19) script, with a 2.80-GHz Intel i5 processor (Intel Corporation, Santa Clara, CA, USA), 8 GB RAM, and a 106 GB storage drive. The computer was powered by a 110 V, 200 W battery pack (Rockman 200A, Rockpals, Chino, CA, USA). The RGB-D sensor was installed at a height of 1.77 m, which falls within the recommended range (0.3–3 m) to obtain quality depth images. This setup is illustrated in Figure 5.

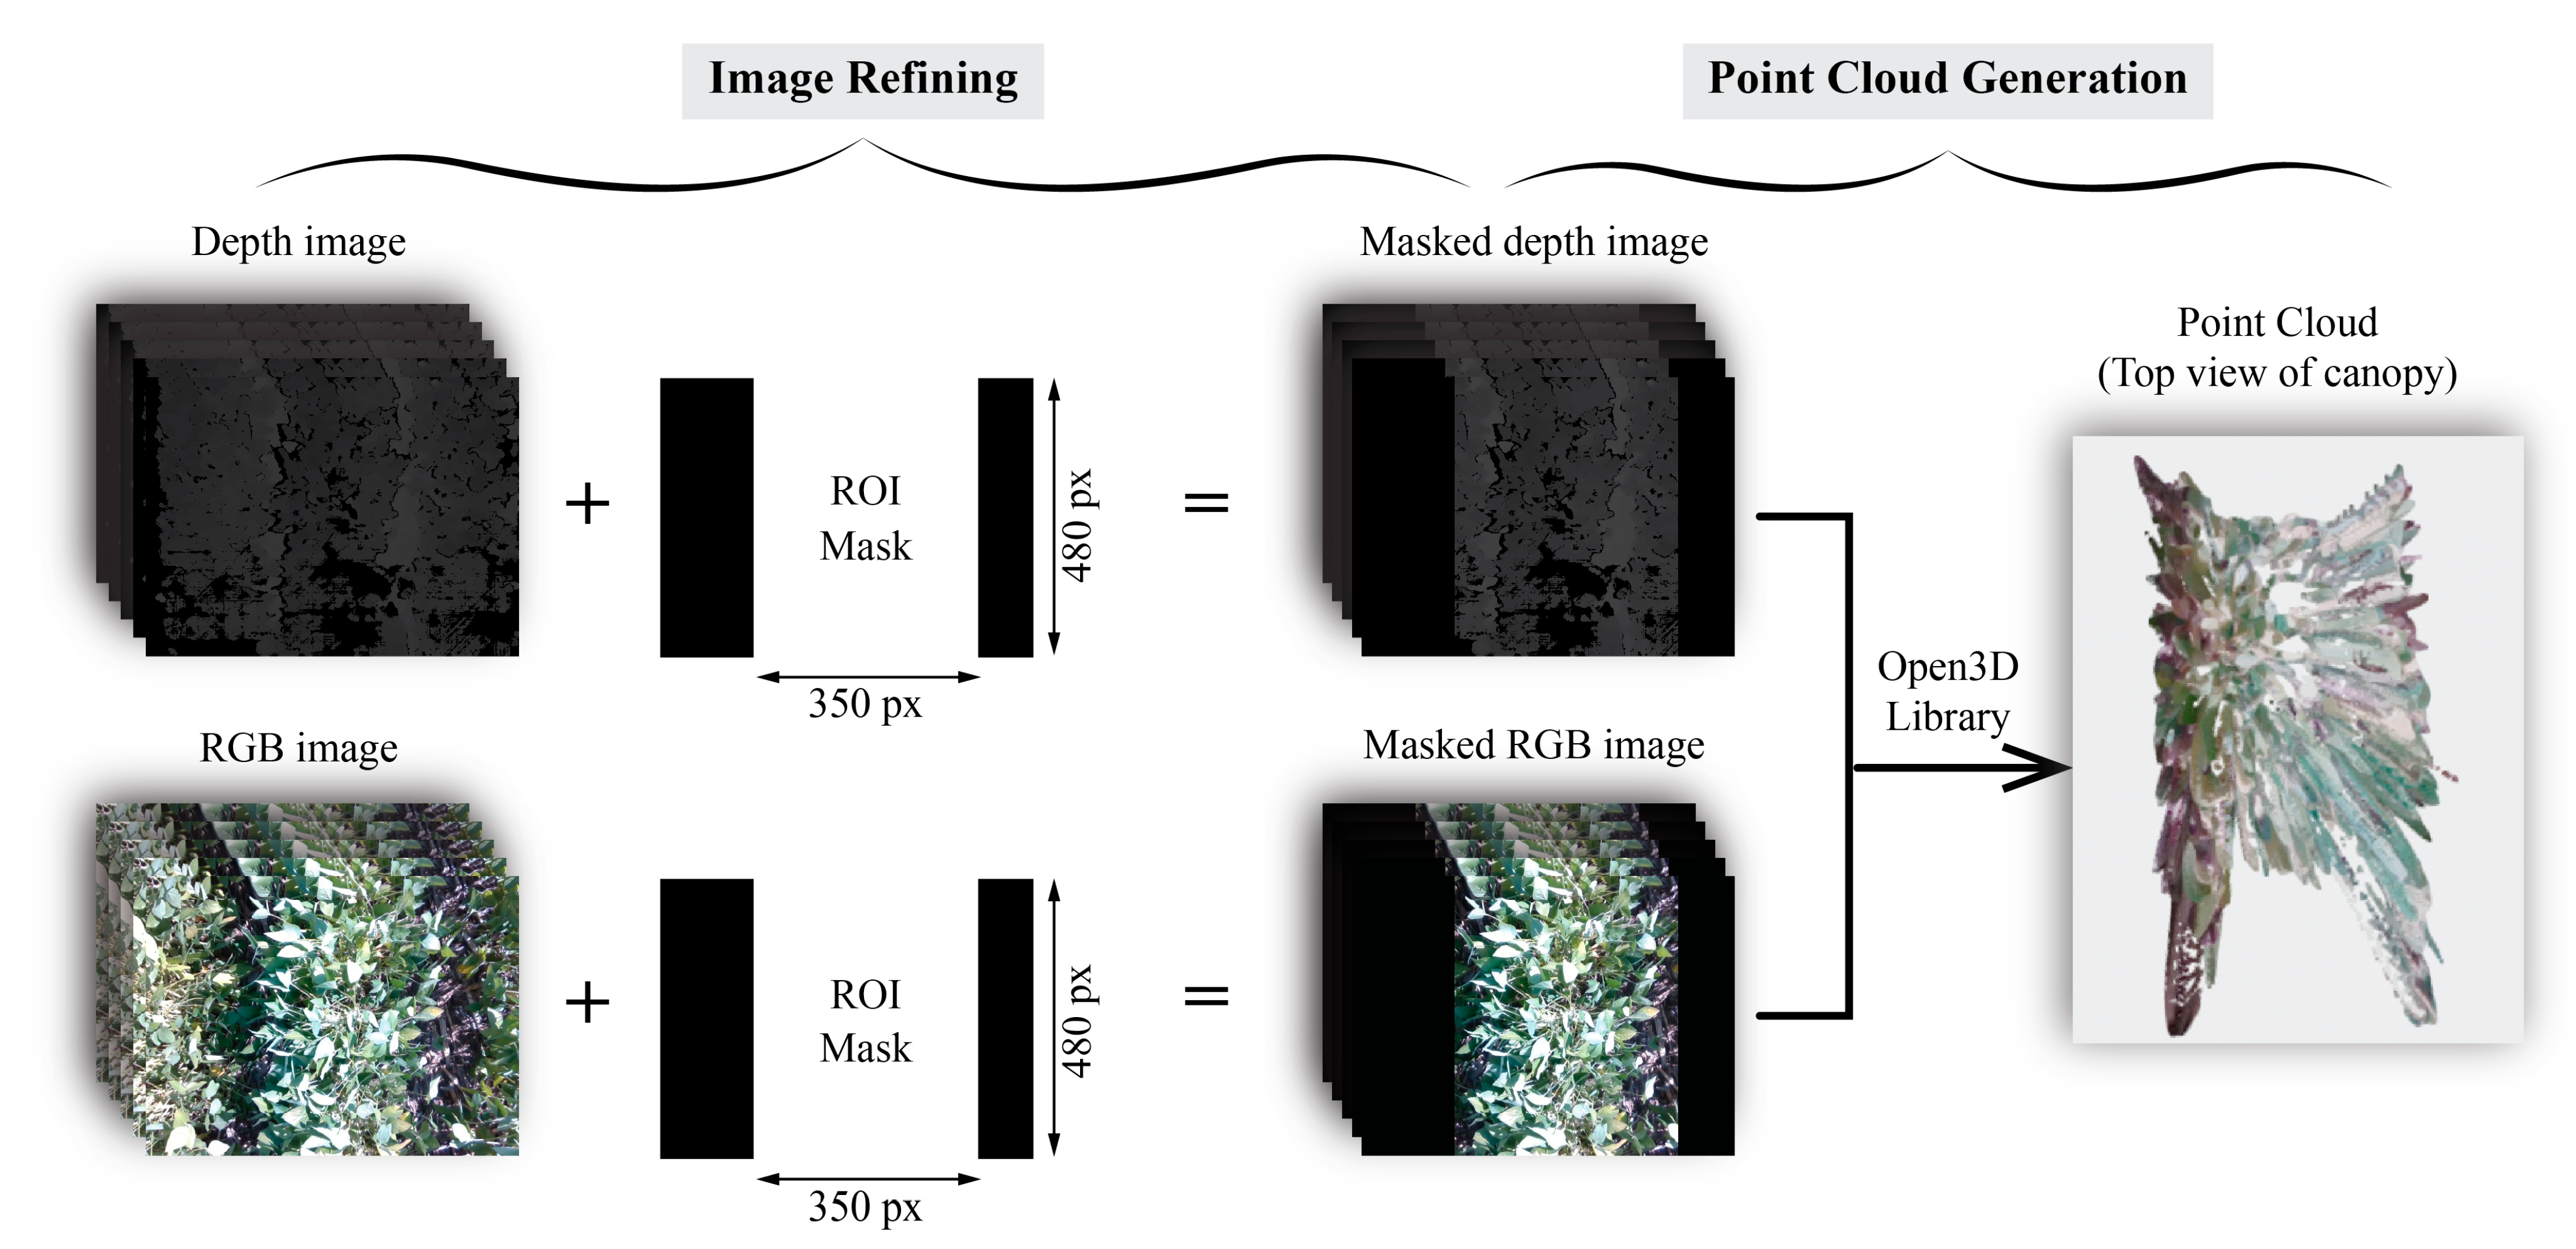
Data Preprocessing and Point Cloud Generation

The RGB and depth images collected also included vegetation from unwanted rows on both the left and right sides of the row of interest. The imagery refining process was conducted by applying an 8-bit mask with a value of 0 and dimensions of 640 × 480 px. The mask included a rectangular area with a value of 255 and dimensions of 350 × 480 px, which identified the region of interest (ROI), as illustrated in Figure 6. Using Open3D, an open-source library for 3D data processing and visualization developed by Zhou et al. [26], the preprocessed RGB and depth images were fed into a pipeline that incorporated the camera’s intrinsic parameters (width = 640, height = 480, focal length, fx = 384.588, focal length, fy = 384.588, principal point, ppx = 319.994, and principal point, ppy = 236.740). This process generated point clouds for each sampling location. Subsequently, the point clouds were processed to extract the canopy height and 3D profile index for each location. Phenotypic trait extraction processes are explained in the next section.

2.3.2. Phenotypic Trait Extraction

Canopy Height Extraction

To derive canopy height from the generated point clouds, it was necessary to first estimate the ground distance, that is, the distance between the ground and the RGB-D sensor [9]. This was achieved by averaging the z-values at the 1st percentile of the dataset, which represents the furthest points from the depth sensor. Since the depth sensor was positioned at a fixed height of 1.77 m above the ground, the average of these 1st percentile z-values closely aligned with the measured distance between the depth sensor and the ground, providing a reliable estimate for the ground points.
Canopy height, hereafter referred to as estimated canopy height (ECH), was calculated for each sampling location by first averaging the z-values of the canopy points and then subtracting this average from the estimated ground distance, as shown in Equation (2). Prior to this, the optimum percentile of the z-values for determining the top-of-canopy points was identified as the most accurate threshold through the minimization of root mean square error (RMSE) between the ECH and the measured canopy height.
ECH   m =   h g 1 n   c = 1 n h c
where hg represents the average z-value for ground points, hc represents the z-values of top-of-canopy points, and n is the total number of top-of-canopy points.

Canopy Ground Coverage Area

Percent canopy ground coverage area (%CGCA) was estimated as described in Equation (3). First, masked RGB images (Figure 5) obtained for each sampling area corresponding to a digital area of 350 × 480 px were further processed to obtain the number of vegetation pixels in the images. This was achieved by segmentation using the Excess Green Index (ExG) proposed by Woebbecke et al. [29] and applying a threshold of 0.9 to distinguish soybean vegetation from bare soil and corn residue. Furthermore, the vegetation pixels in the images for each sampling area were counted and used to compute the %CGCA.
% CGCA = Number   of   vegetation   pixels Total   pixels   in   a   sampling   area   × 100

Soybean Aboveground Biomass Estimation

Along with ECH and %CGCA, AGB was estimated by using the 3D profile index (3DPI) method developed by Jimenez-Berni et al. [9]. Equation (4) describes this method. As will be seen in the Results and Discussion section, this method was developed for high-density point clouds, such as those produced by LiDAR sensors.
3 DPI = i = 0 i = n   p i p t × e k p cs p t  
As detailed in Jimenez-Berni et al. [9], i represents a specific 10 mm vertical layer, with 0 corresponding to the ground layer and n denoting the topmost layer; k is a correction factor that was varied incrementally from −4 to 12 in steps of 0.03; p i is the number of points within a given 50 mm layer; p t is the total number of points across all layers; and p cs is the cumulative sum of points intercepted above a specific 50 mm layer. A linear regression was performed between the 3DPI values obtained for each sampling location, and the biomass was calculated using the dry weight of the samples to derive the biomass prediction model. Prior to this, the optimum correction factor (k) was determined by optimization of RMSE and the coefficient of determination (R2), respectively, between the measured biomass and 3DPI values associated with each sampling location.

2.3.3. Model Evaluation

The accuracy and robustness of linear regression models created by fitting the extracted phenotypic traits individually and combined were evaluated using R2, RMSE, and relative RMSE (RRMSE). They are expressed as follows:
R 2 = 1 i = 1 n y i y ^ i 2 i = 1 n y i y ¯ 2
RMSE = i = 1 n y i y ^ i 2 n
RRMSE   % = RMSE y ¯ × 100
where y i and y ^ i represent the measured and predicted AGB, respectively; y ¯ is the mean of the measured AGB; and n is the total number of samples.
All regression modeling was performed in MATLAB R2023b on Microsoft Windows and ran on a desktop computer with a 2.10-GHz Intel i7 processor, 32 GB RAM, and a 476 GB storage drive.

3. Results and Discussion

3.1. Canopy Height

Canopy height is one of the key traits for estimating AGB of crops [9], including soybean [8]. To identify the optimal percentile for determining canopy points, percentile values in the z-coordinate were systematically evaluated in 0.1 increments within the 96th to 100th percentile range. The optimization process, which identified the 99.9th percentile as the optimum, involved the minimization of RMSE between the ECH and the measured canopy height, as shown in Figure 7a. Results showed a strong positive linear correlation (R2 = 0.786) between the ECH and the measured canopy height. Furthermore, a low RMSE (0.0181m) and RRMSE (2.47%) were achieved across all 20 samples, suggesting a strong correlation between the ECH and measured canopy height, as shown in Figure 7b.
The low RMSE (0.0181 m) obtained between the RGB-D estimated CH and the field-measured CH is comparable to other reported RMSE values. Song et al. [24] reported an RMSE of 0.23 m in maize using a similar sensor, and Jimenez-Berni et al. [9] demonstrated an RMSE of 0.017 m in wheat using a LiDAR sensor. Furthermore, the R2 (0.786) is comparable to that of Maimaitijiang et al. [8] (0.898) in soybean.

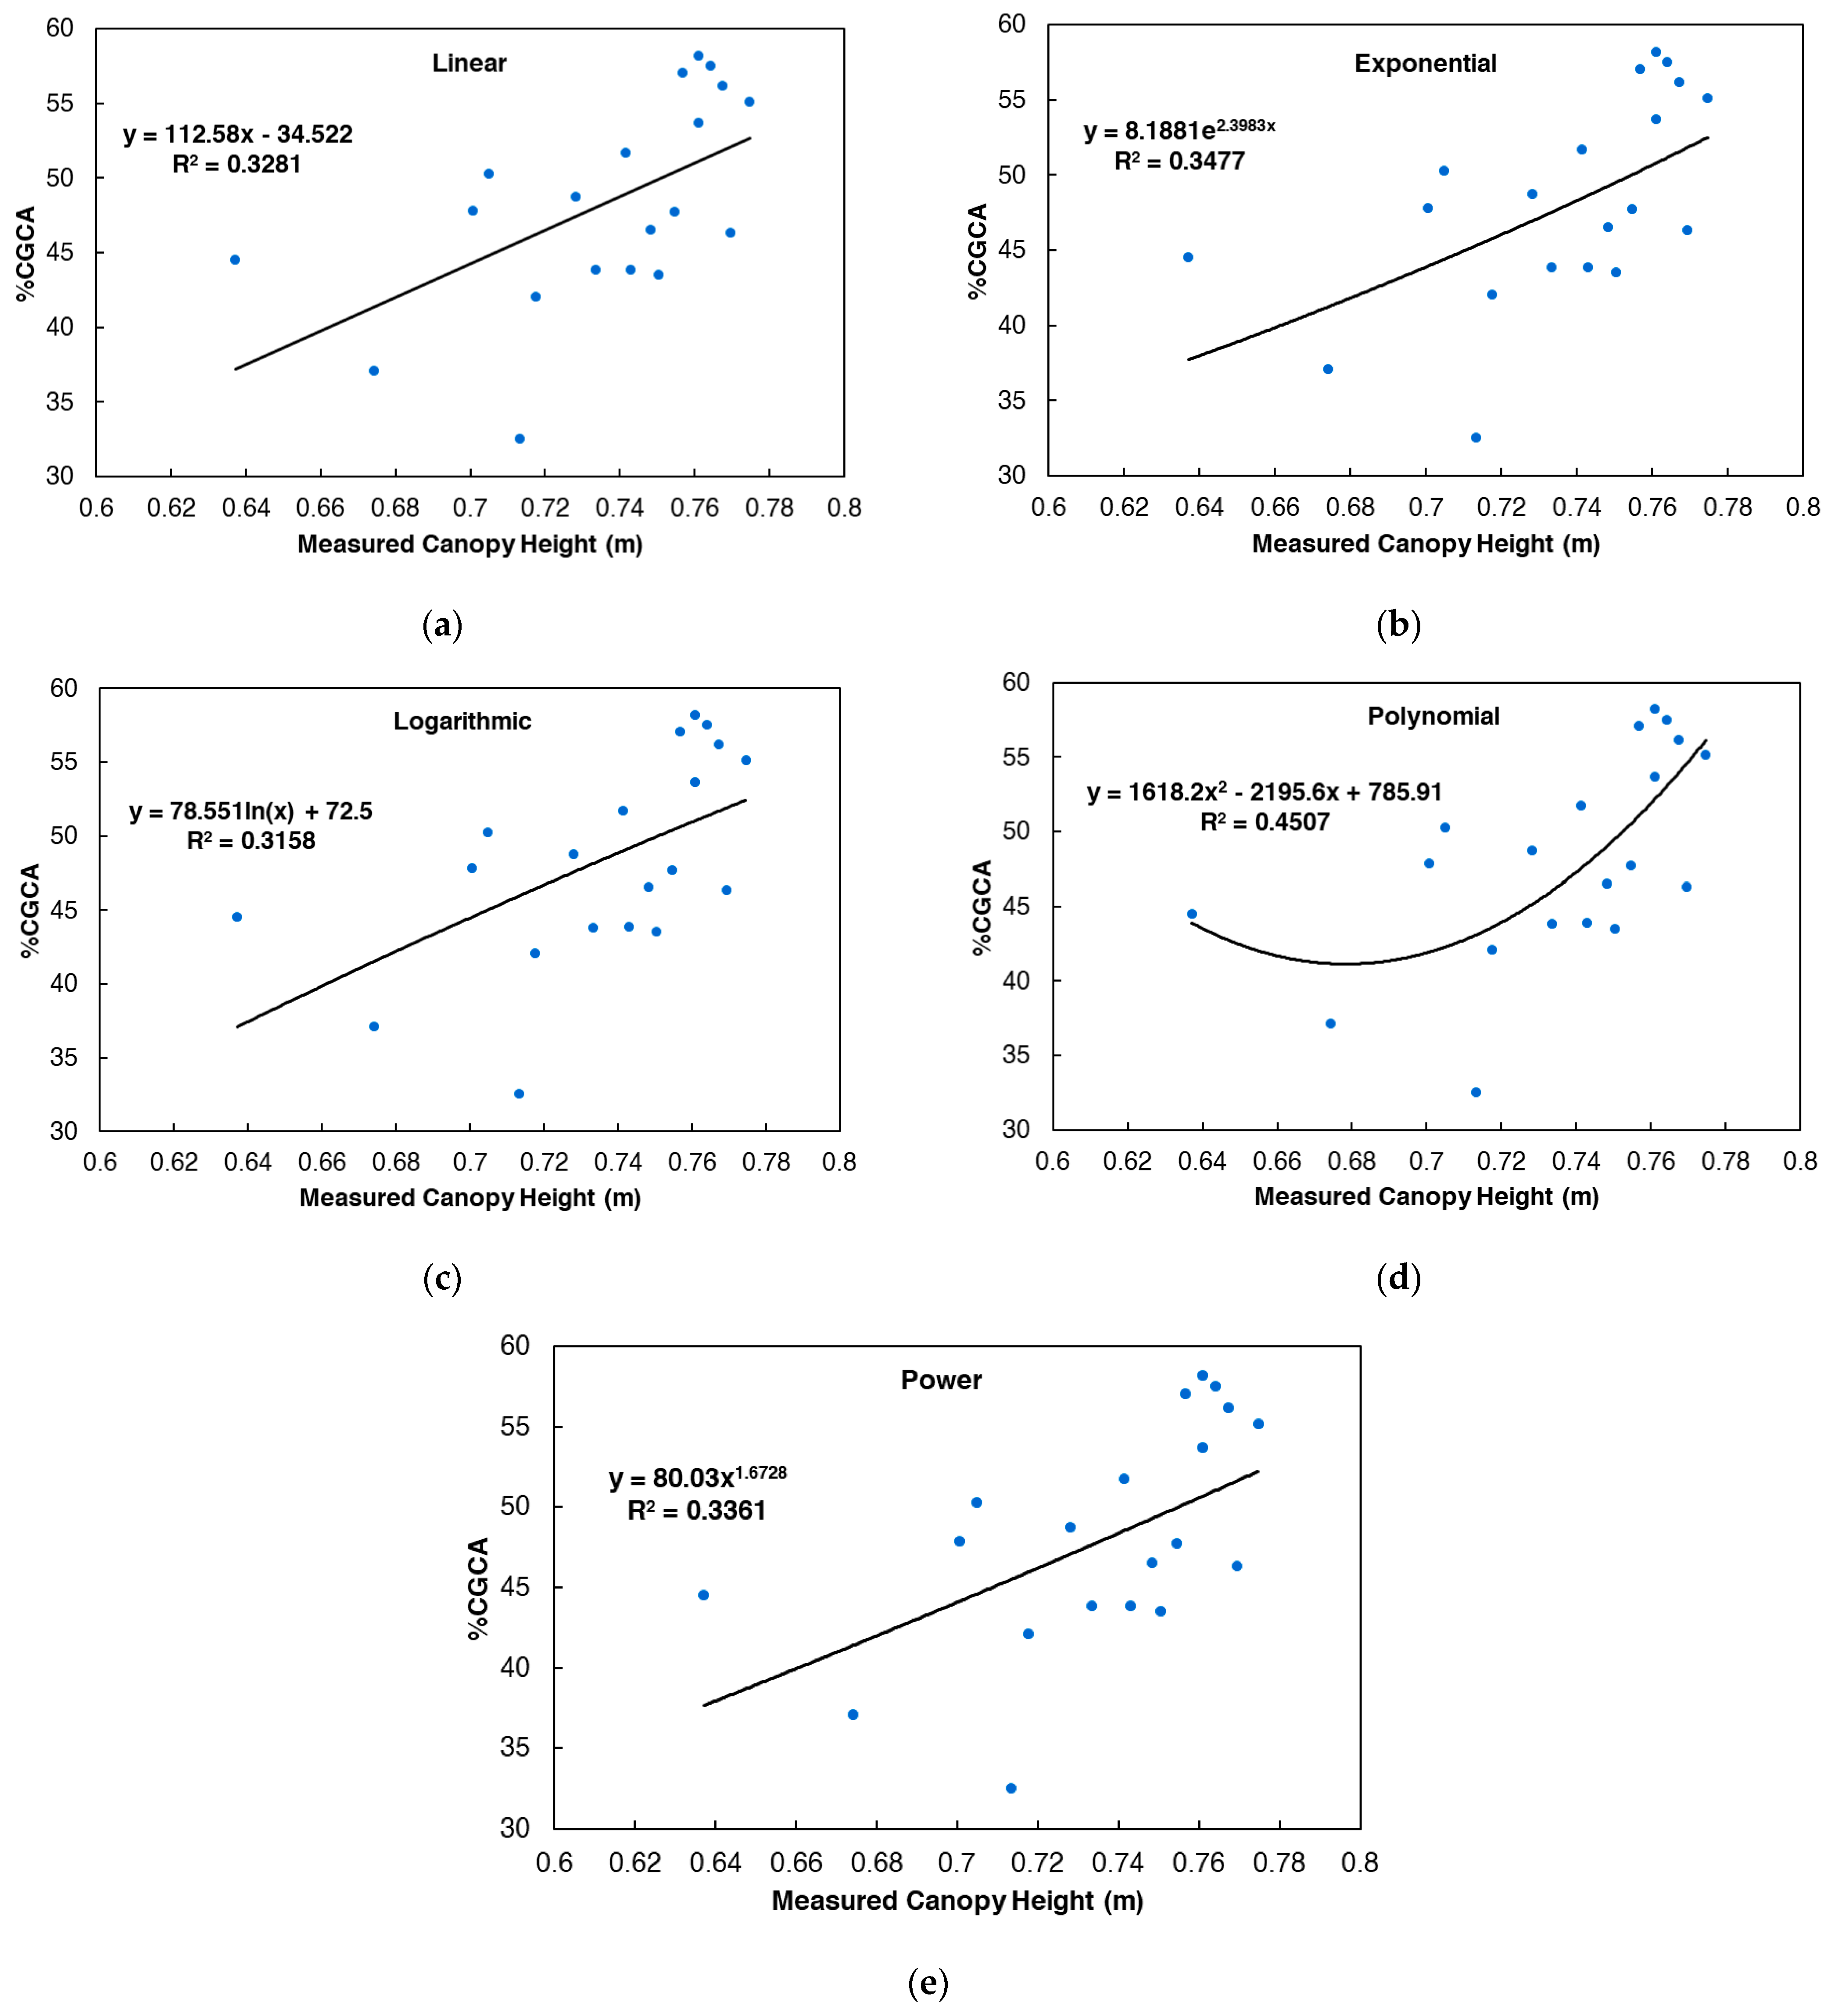
3.2. Relationship Between Canopy Ground Coverage Area and Canopy Height

In the absence of suitable sensors to accurately measure leaf area index (LAI), an important phenotypic trait for predicting plant growth and biomass, it becomes necessary to estimate it using other phenotypic traits such as canopy height and canopy ground coverage area (%CGCA). Prior research has demonstrated a strong positive relationship between LAI and %CGCA [30,31]. With this in mind, Figure 8 shows the result of a regression analysis conducted between %CGCA and measured canopy height across all sampling locations, which revealed an R2 of 0.3281, 0.3477, 0.3158, 0.4507, and 0.3361 for linear, exponential, logarithmic, polynomial, and power models, respectively. The R2 of the linear model (0.3281) is comparable to the result presented in [31], where an R2 of 0.32 was obtained between LAI and height. This suggests a positive relationship between %CGCA and canopy height. Yuan et al. [32] also demonstrated a positive relationship between canopy height and LAI, further corroborating the relationship between %CGCA and canopy height. However, the polynomial and exponential regression models from this study had higher R2 values. This is contrary to the suggestion of Yuan et al. [32], which indicated the power function and exponential function as the best and worst models, respectively.
Generally, the correlation between canopy height and %CGCA suggests that LAI could be estimated using canopy height because of the strong positive relationship between canopy ground cover and LAI in soybeans. However, more extensive experiments are necessary to validate the best function that most accurately describes the relationship between LAI and canopy height.

3.3. Aboveground Biomass Estimation

3.3.1. Optimization of Correction Factor, k for Biomass Estimation Using 3D Profile Index

To estimate soybean AGB using the 3D profile index, the best correction factor (k) was obtained as 8.90 through the minimization and maximization of RMSE and R2, respectively, between the estimated AGB and the measured AGB (Figure 9).

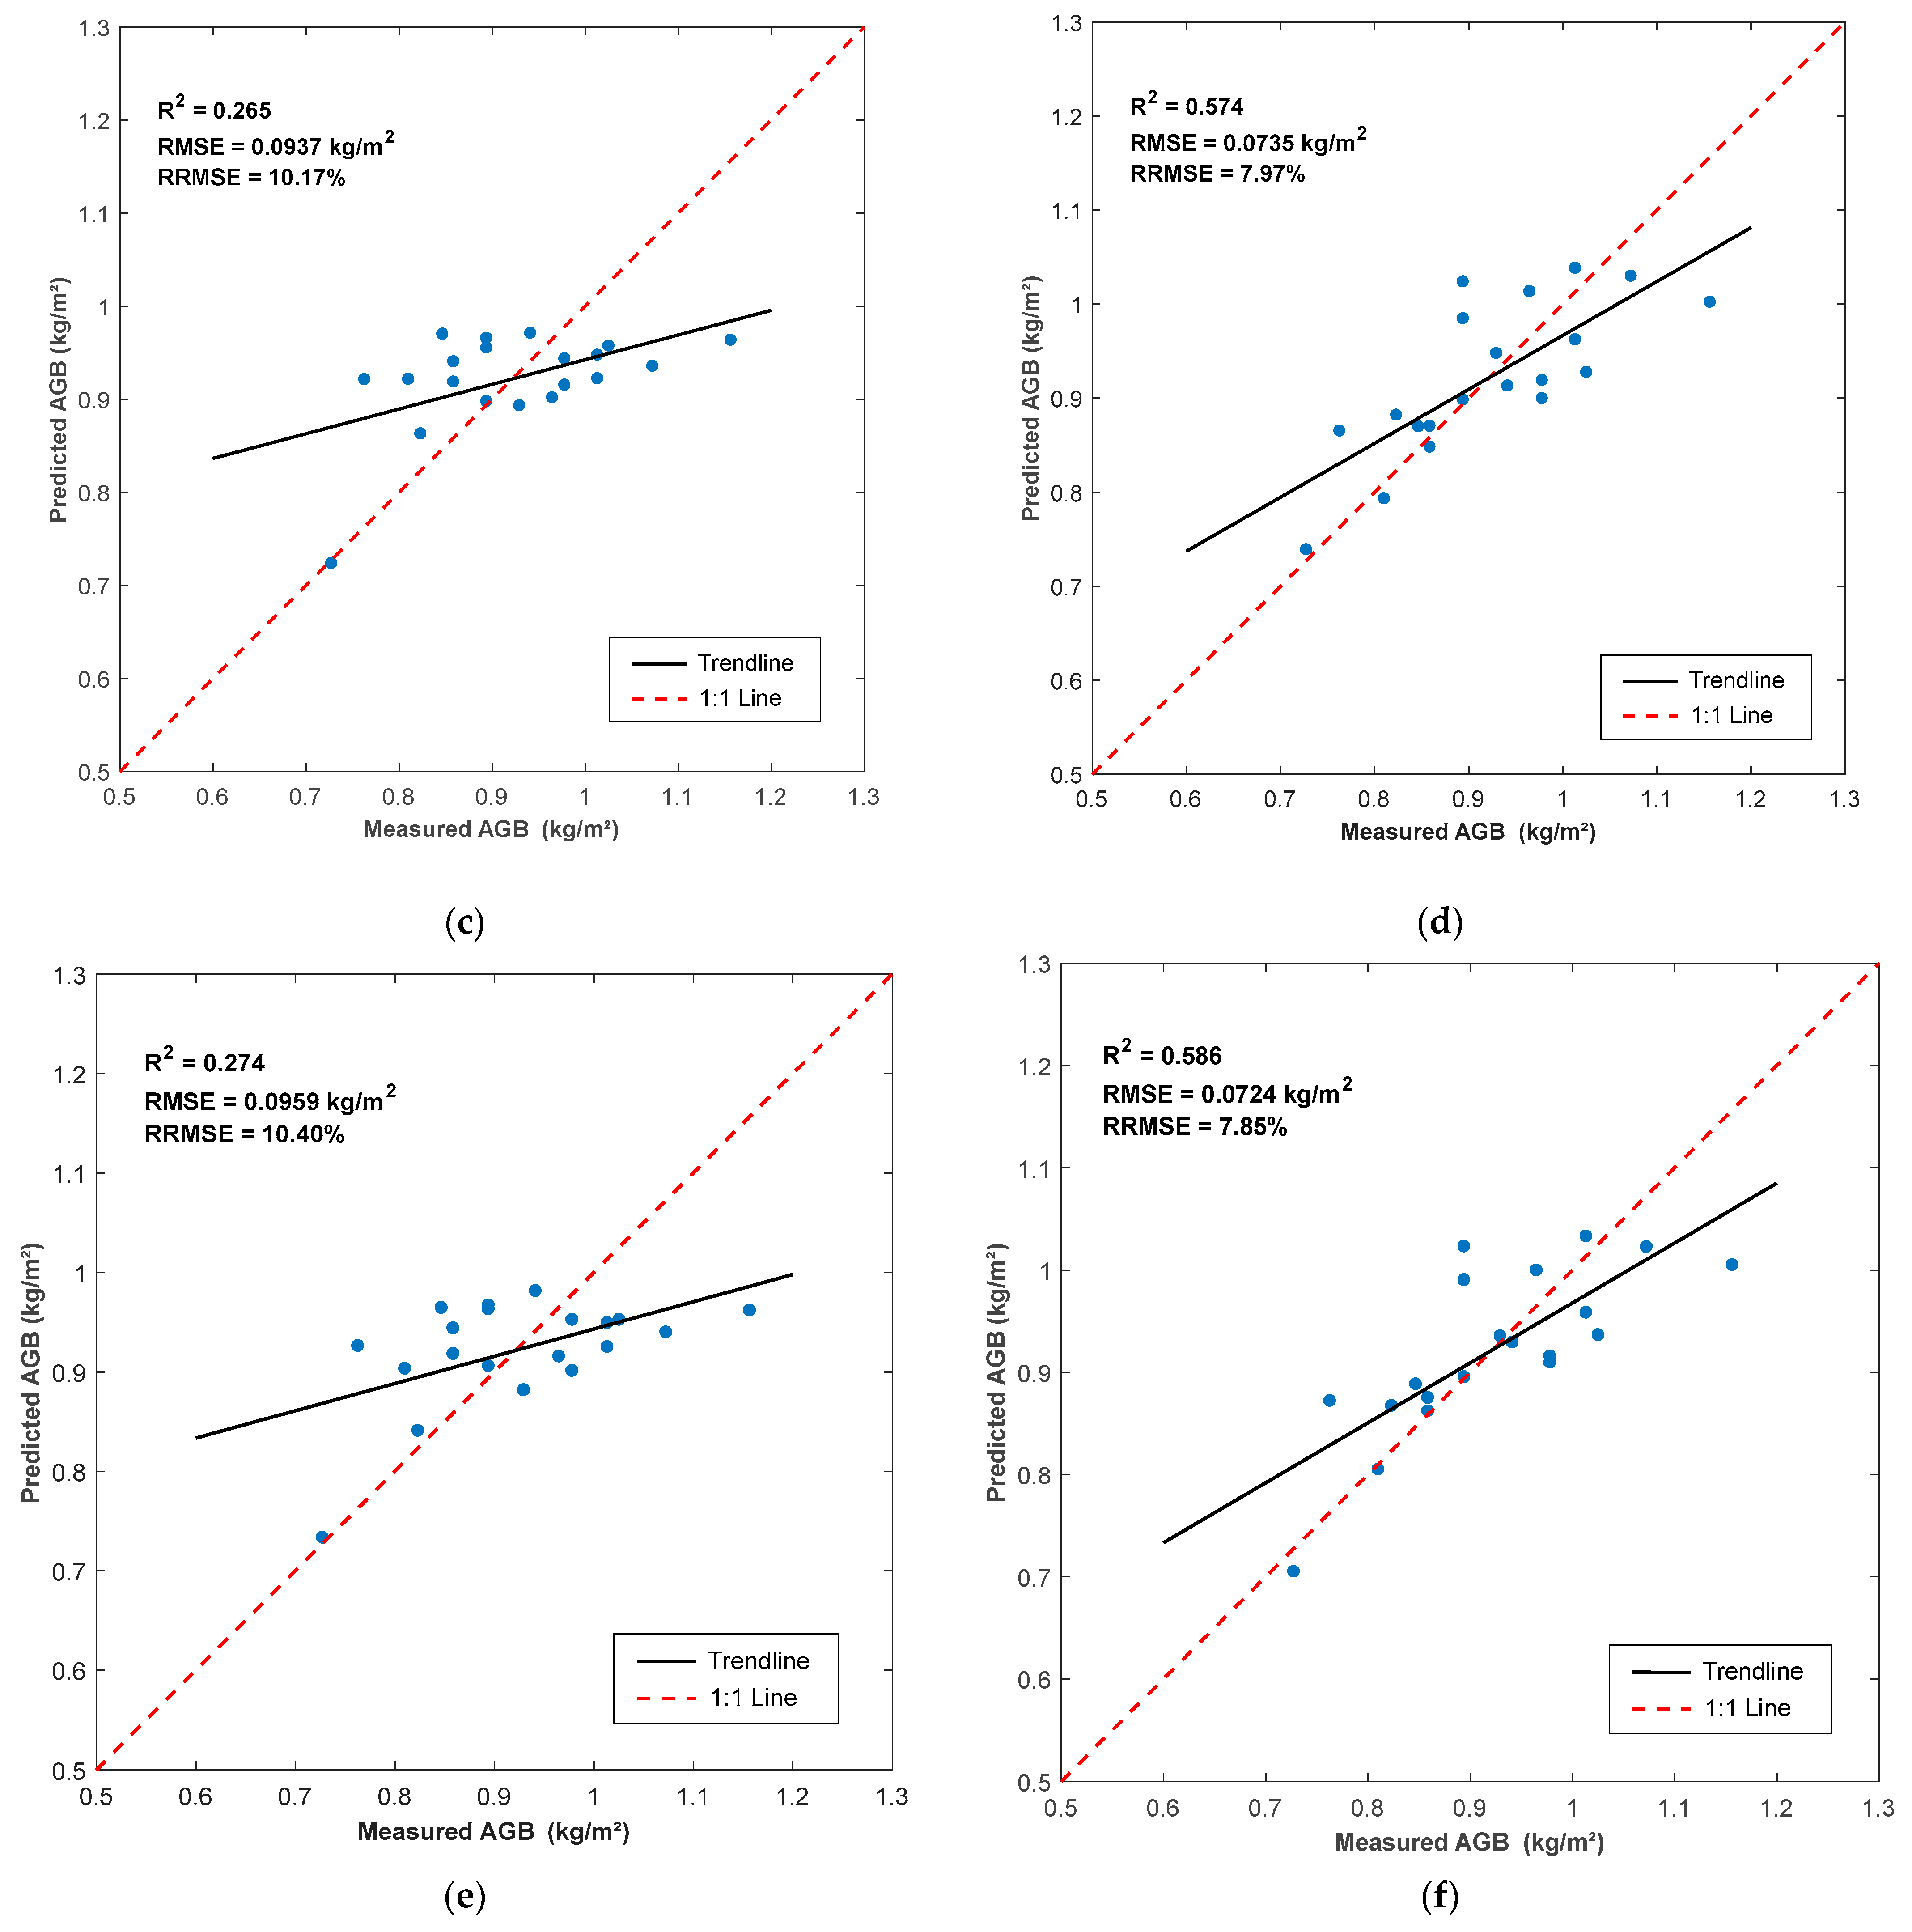
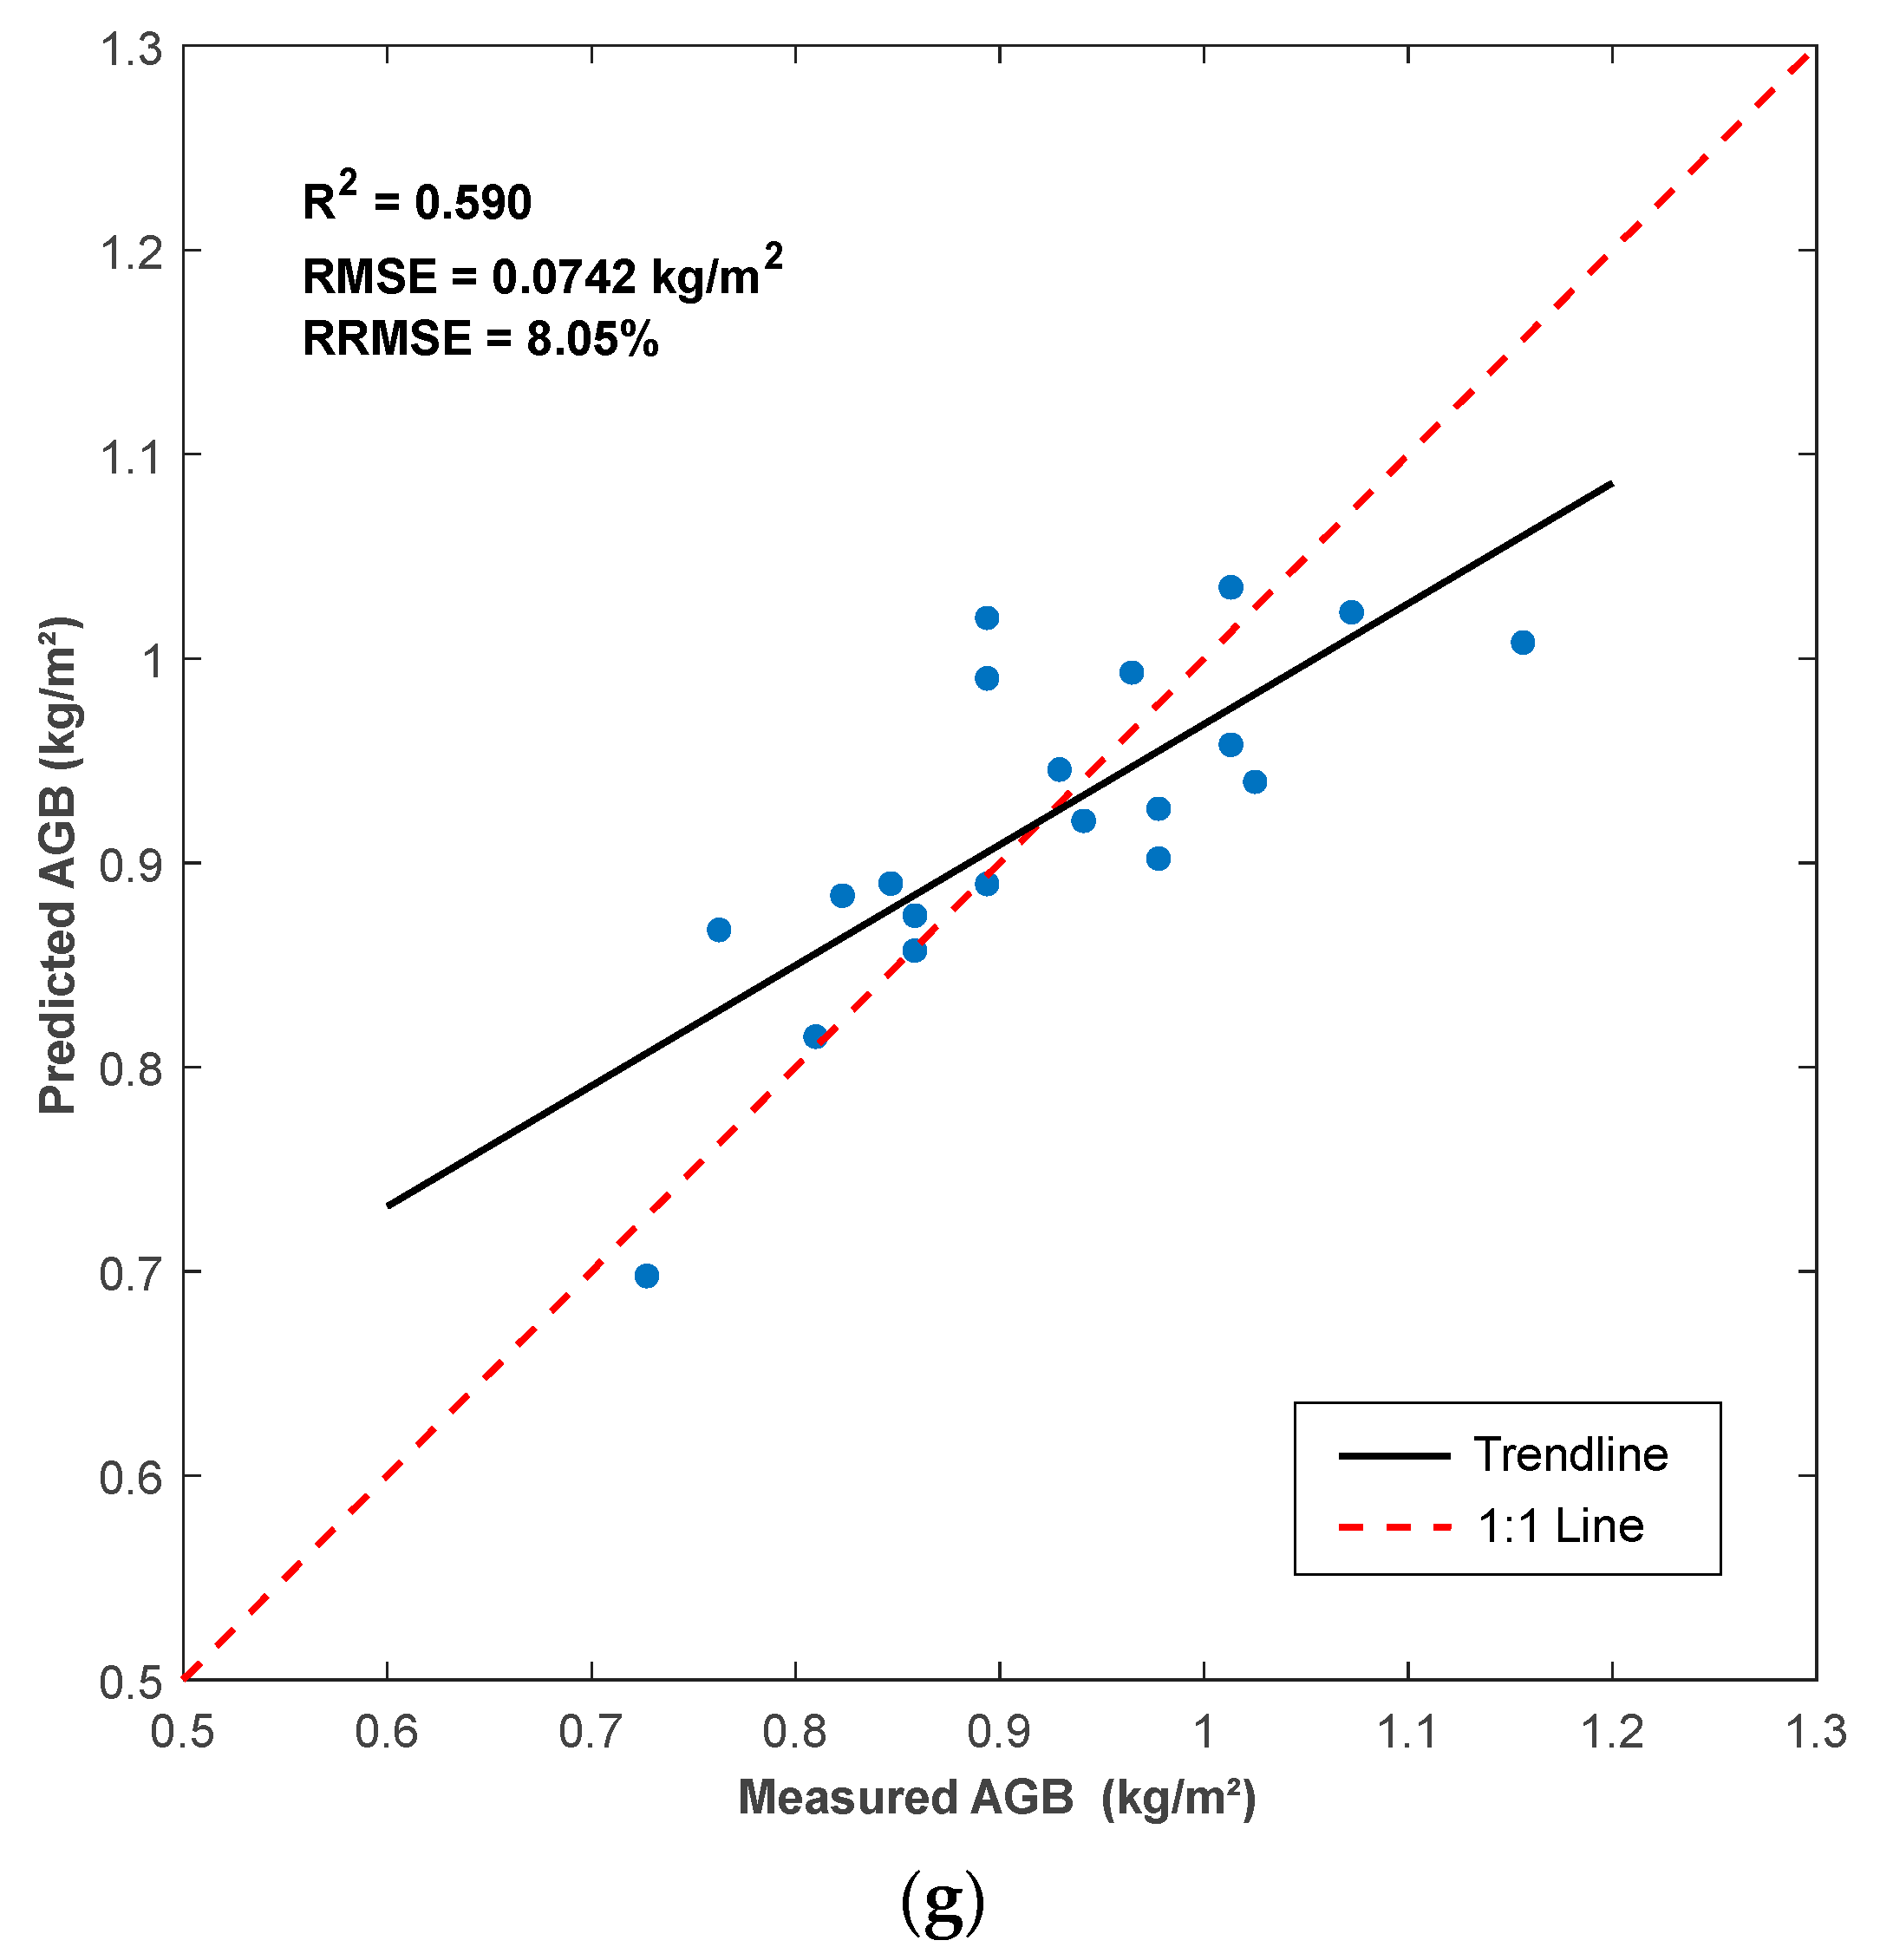
3.3.2. Aboveground Biomass Estimation Using Extracted Phenotypic Traits

The AGB of soybean plots was estimated by using linear regression models that considered individual and different combinations of extracted phenotypic traits, resulting in a total of seven models. Estimated AGB using the various models were compared to the measured AGB in 1:1 scatterplots, and they all showed positive correlations with the measured AGB. As demonstrated in Figure 10a–c, when a single phenotypic trait was used as sole predictor, the linear regression model that considered only canopy ground coverage area (%CGCA: R2 = 0.573, RMSE = 0.0714 kg/m2, and RRMSE = 7.75%) evidently outperformed the models that considered estimated canopy height (ECH: R2 = 0.140, RMSE = 0.1014 kg/m2, and RRMSE = 11%) and 3D profile index (3DPI: R2 = 0.265, RMSE = 0.0937 kg/m2, and RRMSE = 10.17%) as individual predictors. The results highlight the importance of %CGCA as a key trait for soybean biomass estimation. Although 3DPI as a predictor did not perform as well as %CGCA in this study, the findings indicate that it captures more canopy 3D structural information for biomass prediction than just canopy height, and this makes sense because 3DPI is derived using the density of different layers of the point cloud data. The lower R2 of 3DPI as a predictor may be attributed to the effect of outdoor lighting conditions, which can degrade the performance of RGB-D sensors under high-intensity light [33]. Additionally, the orientation of the RGB-D sensor during data acquisition may have negatively impacted the quality of depth information, as occlusion of subcanopy regions by the upper canopy could reduce the quality of depth information of the subcanopy.
As shown in Figure 10d–f, when comparing models that considered any two phenotypic traits as combined predictors, the model that considered %CGCA and 3DPI yielded the highest R2 (0.586) and lowest prediction errors (RMSE = 0.0724 kg/m2 and RRMSE = 7.85%), closely seconded by the model that considered ECH and %CGCA with an R2, RMSE, and RRMSE of 0.574, 0.0735 kg/m2, and 7.97%, respectively, while the model that considered a combination of ECH and 3DPI yielded the least favorable result amongst the three (R2 = 0.274, RMSE = 0.0959 kg/m2, and RRMSE = 10.40%). Figure 10g demonstrates that AGB predicted using all extracted phenotypic traits as combined predictors yielded the highest R2 value (0.590), although it had lower RMSE (0.0742 kg/m2) and RRMSE (8.05%) compared to some of the other models. This is logical because the model considered both the vertical and horizontal dimensions of the canopy, which are both essential characteristics of AGB. In summary, the results show the capacity of the system to non-destructively estimate soybean AGB in the field. These results are in line with previous studies estimating AGB using UAS-based RGB imagery-derived canopy height and coverage area and a canopy volume model on soybean with RMSE = 0.225 kg/m2 [8] or using LiDAR-derived variables such as canopy height and canopy coverage on maize with RMSE = 0.374 kg/m2 [34]. Although lower error scores were observed in this study, it should be noted that the coefficient of determination, R2, obtained in this study is lower than those achieved in the compared studies, namely, 0.893 [8] and 0.835 [34].
To the best of the authors’ knowledge, this is the first time soybean AGB is estimated by using an RGB-D sensor mounted on a ground robot. It is recommended that more experiments be performed and compared with this study.

3.4. Limitations

A major drawback of this study was the small size of the experimental plot, which hindered the ability to collect aboveground biomass samples across various growth stages of soybeans. This issue was further compounded by the small number of biomass sampling sites (20), which probably weakened the reliability of the models and led to the comparatively low R2 values noted in the research. This limitation can be addressed in future experiments by utilizing a larger experimental plot and collecting data at different stages of the development of soybean. This will result in more data samples that could be split into training and test sets, with which advanced machine learning models could be trained. This will inevitably result in improved AGB estimation models.
Outdoor lighting (high-intensity light) had a negative impact on the RGB-D sensor, which resulted in degraded depth images. This limitation can be addressed in future biomass estimation experiments by shielding the RGB-D sensor from direct sunlight during data acquisition by using an umbrella-like housing, thereby ensuring more depth information is captured. Furthermore, to improve the quality of canopy depth information, the orientation of the camera should be at an angle so that it captures both the top and side views of the canopy.

3.5. Practical Applications

The design of ModagRobot offers significant practical applications that can improve the attitude of small-scale farmers towards adopting ground robot technology. Beyond soybean phenotyping, its adaptable chassis allows it to phenotype a wide range of crops, including row crops, horticultural crops, and orchard crops. This flexibility eliminates the need for multiple specialized robots, thereby maximizing return on investment for farmers. Additionally, the high payload capacity of the ModagRobot enables it to carry heavy sensors and attachments such as spray booms, tanks, and manipulators, expanding its functionality to include spraying and harvesting applications.
Soybean phenotyping using ground robots equipped with depth sensors presents a cost-effective solution for crop monitoring, leading to improved resource management and agricultural productivity. Key phenotypic traits, such as canopy ground coverage area, canopy height, and aboveground biomass, serve as critical indicators of crop development. Monitoring these traits can support site-specific management strategies for optimized irrigation and fertilizer application.

4. Conclusions

This study presents the design and development of the ModagRobot—a cost-effective modular agricultural robot—and its field evaluation for soybean phenotyping. The ModagRobot, although still in its developmental stage, boasts of chassis modularity in multiple axes. The main advantage of the ModagRobot over other modular agricultural robots mentioned earlier lies in its frame, which is constructed entirely from readily available aluminum parts on the market, as well as a drivetrain module built with cost-effective and efficient components. Additionally, no welding was used to join any frame components, making its hardware completely modular so that every frame component can be easily replaced or reconfigured as needed. This study demonstrated the potential of the ModagRobot for accurate and non-destructive estimation of soybean phenotypic traits such as canopy height (CH), % canopy ground coverage area (%CGCA), and AGB using an RGB-D sensor. RGB and depth images of the soybean canopy were obtained from different sampling locations and used to generate point clouds. The RGB images were preprocessed to estimate the %CGCA of the sampling locations. A positive correlation was found between %CGCA and measured CH. Generated point clouds were further processed and used to estimate CH and AGB. A strong positive correlation was found between the measured and estimated canopy heights across all sampling locations. A combination of estimated CH, %CGCA, and 3D profile index as predictors yielded the highest R2, highlighting the importance of these soybean phenotypic traits for in-field non-destructive AGB estimation.

Future Studies

The development of the ModagRobot is ongoing and will include developing an autonomous navigation system that will incorporate adaptive terrain selection to enhance stability during navigation on various terrains. Additionally, the functionality of the ModagRobot will be evaluated on other smart agriculture applications, such as in-row herbicide spraying, weed and disease detection, and harvesting.
Future studies will include equipping the ModagRobot with a microscopic camera for the estimation of stomatal traits to ascertain the drought resistance of different crop species.

Author Contributions

Conceptualization, J.K. and Y.C.; methodology, J.K., P.K.Y. and M.M.; software, J.K. and Y.C.; validation, J.K., P.K.Y. and Y.C.; formal analysis, J.K. and P.K.Y.; investigation, J.K. and P.K.Y.; resources, Y.C. and G.R.; data curation, J.K. and Y.C.; writing—original draft preparation, J.K.; writing—review and editing, J.K., P.K.Y., M.M. and Y.C.; visualization, J.K.; supervision, Y.C., P.K.Y. and G.R.; project administration, Y.C.; funding acquisition, Y.C. All authors have read and agreed to the published version of the manuscript.

Funding

This research was funded by the USDA National Institute of Food and Agriculture Hatch (SD00H777-23) and Hatch-Multistate (SD00R730-23) through the South Dakota Agricultural Experimental Station at South Dakota State University.

Data Availability Statement

The data presented in this study are available on request from the corresponding author.

Acknowledgments

The authors extend their gratitude to Sainath Reddy Gummi and Mohammad Ashik Alahe for their assistance during data collection and Inayat Rasool for his invaluable assistance in improving the 3D modeling of the ModagRobot.

Conflicts of Interest

The authors declare no conflicts of interest.

References

  1. USDA. Benefits and Evolution of Precision Agriculture; USDA: Washington, DC, USA, 2020. Available online: https://www.ars.usda.gov/oc/utm/benefits-and-evolution-of-precision-agriculture/ (accessed on 5 March 2025).
  2. Javaid, M.; Haleem, A.; Singh, R.P.; Suman, R. Enhancing Smart Farming through the Applications of Agriculture 4.0 Technologies. Int. J. Intell. Netw. 2022, 3, 150–164. [Google Scholar] [CrossRef]
  3. Cobb, J.N.; DeClerck, G.; Greenberg, A.; Clark, R.; McCouch, S. Next-Generation Phenotyping: Requirements and Strategies for Enhancing Our Understanding of Genotype-Phenotype Relationships and Its Relevance to Crop Improvement. In Theoretical and Applied Genetics; Springer: Berlin/Heidelberg, Germany, 2013; pp. 867–887. [Google Scholar] [CrossRef]
  4. Awika, H.O.; Bedre, R.; Yeom, J.; Marconi, T.G.; Enciso, J.; Mandadi, K.K.; Jung, J.; Avila, C.A. Developing Growth-Associated Molecular Markers Via High-Throughput Phenotyping in Spinach. Plant Genome 2019, 12, 190027. [Google Scholar] [CrossRef]
  5. Xiao, Q.; Bai, X.; Zhang, C.; He, Y. Advanced High-Throughput Plant Phenotyping Techniques for Genome-Wide Association Studies: A Review. J. Adv. Res. 2022, 35, 215–230. [Google Scholar] [CrossRef] [PubMed]
  6. Chen, D.; Neumann, K.; Friedel, S.; Kilian, B.; Chen, M.; Altmann, T.; Klukas, C. Dissecting the Phenotypic Components of Crop Plant Growth and Drought Responses Based on High-Throughput Image Analysis. Plant Cell 2014, 26, 4636–4655. [Google Scholar] [CrossRef]
  7. Liang, Y.; Urano, D.; Liao, K.-L.; Hedrick, T.L.; Gao, Y.; Jones, A.M. A Nondestructive Method to Estimate the Chlorophyll Content of Arabidopsis Seedlings. Plant Methods 2017, 13, 26. [Google Scholar] [CrossRef]
  8. Maimaitijiang, M.; Sagan, V.; Sidike, P.; Maimaitiyiming, M.; Hartling, S.; Peterson, K.T.; Maw, M.J.W.; Shakoor, N.; Mockler, T.; Fritschi, F.B. Vegetation Index Weighted Canopy Volume Model (CVMVI) for Soybean Biomass Estimation from Unmanned Aerial System-Based RGB Imagery. ISPRS J. Photogramm. Remote Sens. 2019, 151, 27–41. [Google Scholar] [CrossRef]
  9. Jimenez-Berni, J.A.; Deery, D.M.; Rozas-Larraondo, P.; Condon, A.T.G.; Rebetzke, G.J.; James, R.A.; Bovill, W.D.; Furbank, R.T.; Sirault, X.R.R. High Throughput Determination of Plant Height, Ground Cover, and above-Ground Biomass in Wheat with LiDAR. Front. Plant Sci. 2018, 9, 237. [Google Scholar] [CrossRef]
  10. Qingchun, F.; Wang, X.; Wang, G.; Li, Z. Design and Test of Tomatoes Harvesting Robot. In Proceedings of the 2015 IEEE International Conference on Information and Automation, Lijiang, China, 8–10 August 2015; IEEE: Piscataway, NJ, USA, 2015. [Google Scholar] [CrossRef]
  11. Mueller-Sim, T.; Jenkins, M.; Abel, J.; Kantor, G. The Robotanist: A Ground-Based Agricultural Robot for High-Throughput Crop Phenotyping. In Proceedings of the 2017 IEEE International Conference on Robotics and Automation (ICRA), Singapore, 29 May–3 June 2017; IEEE: Piscataway, NJ, USA, 2017; pp. 3634–3639. [Google Scholar] [CrossRef]
  12. Young, S.N.; Kayacan, E.; Peschel, J.M. Design and Field Evaluation of a Ground Robot for High-Throughput Phenotyping of Energy Sorghum. Precis. Agric. 2019, 20, 697–722. [Google Scholar] [CrossRef]
  13. Bangert, W.; Kielhorn, A.; Rahe, F.; Albert, A.; Biber, P.; Grzonka, S.; Hänsel, M.; Haug, S.; Michaels, A.; Mentrup, D.; et al. Field-Robot-Based Agriculture: “RemoteFarming.1” and “BoniRob-Apps”. VDI-Berichte 2013, 2193, 439–446. [Google Scholar]
  14. Bawden, O.; Kulk, J.; Russell, R.; McCool, C.; English, A.; Dayoub, F.; Lehnert, C.; Perez, T. Robot for Weed Species Plant-specific Management. J. Field Robot. 2017, 34, 1179–1199. [Google Scholar] [CrossRef]
  15. Nielsen, S.H.; Jensen, K.; Bøgild, A.; Jørgensen, O.J.; Jacobsen, N.J.; Jaeger, C.; Lund, D.; Jørgensen, R.N. A Low Cost, Modular Robotics Tool Carrier for Precision Agriculture Research. In Proceedings of the 11th International Conference on Precision Agriculture, Indianapolis, IN, USA, 15–18 July 2020; International Society of Precision Agriculture: Monticello, IL, USA, ; 2012; Volume 16. [Google Scholar]
  16. Xu, R.; Li, C. A Modular Agricultural Robotic System (MARS) for Precision Farming: Concept and Implementation. J. Field Robot. 2022, 39, 387–409. [Google Scholar] [CrossRef]
  17. Murman, J.N. Flex-Ro: A Robotic High Throughput Field Phenotyping System. Master’s Thesis, University of Nebraska-Lincoln, Lincoln, NE, USA, 2019. Available online: https://digitalcommons.unl.edu/biosysengdiss/99 (accessed on 5 March 2025).
  18. Grimstad, L.; From, P.J. The Thorvald II Agricultural Robotic System. Robotics 2017, 6, 24. [Google Scholar] [CrossRef]
  19. Guri, D.; Lee, M.; Kroemer, O.; Kantor, G. Hefty: A Modular Reconfigurable Robot for Advancing Robot Manipulation in Agriculture. arXiv 2024, arXiv:2402.18710. [Google Scholar]
  20. Gonzalez-de-Santos, P.; Fernandez, R.; Sepúlveda, D.; Navas, E.; Armada, M. Unmanned Ground Vehicles for Smart Farms. In Agronomy Climate Change & Food Security; IntechOpen: London, UK, 2020. [Google Scholar] [CrossRef]
  21. Dibbern, T.; Romani, L.A.S.; Massruhá, S.M.F.S. Main Drivers and Barriers to the Adoption of Digital Agriculture Technologies. Smart Agric. Technol. 2024, 8, 100459. [Google Scholar] [CrossRef]
  22. Schimmelpfennig, D. Farm Profits and Adoption of Precision Agriculture; United States Department of Agriculture: Washington, DC, USA, 2016. Available online: www.ers.usda.gov/sites/default/files/_laserfiche/publications/80326/ERR-217.pdf?v=88942 (accessed on 5 March 2025).
  23. Cai, S.; Gou, W.; Wen, W.; Lu, X.; Fan, J.; Guo, X. Design and Development of a Low-Cost UGV 3D Phenotyping Platform with Integrated LiDAR and Electric Slide Rail. Plants 2023, 12, 483. [Google Scholar] [CrossRef] [PubMed]
  24. Song, P.; Li, Z.; Yang, M.; Shao, Y.; Pu, Z.; Yang, W.; Zhai, R. Dynamic Detection of Three-Dimensional Crop Phenotypes Based on a Consumer-Grade RGB-D Camera. Front. Plant Sci. 2023, 14, 1097725. [Google Scholar] [CrossRef]
  25. Kross, A.; McNairn, H.; Lapen, D.; Sunohara, M.; Champagne, C. Assessment of RapidEye Vegetation Indices for Estimation of Leaf Area Index and Biomass in Corn and Soybean Crops. Int. J. Appl. Earth Obs. Geoinf. 2015, 34, 235–248. [Google Scholar] [CrossRef]
  26. Mandal, D.; Kumar, V.; McNairn, H.; Bhattacharya, A.; Rao, Y.S. Joint Estimation of Plant Area Index (PAI) and Wet Biomass in Wheat and Soybean from C-Band Polarimetric SAR Data. Int. J. Appl. Earth Obs. Geoinf. 2019, 79, 24–34. [Google Scholar] [CrossRef]
  27. Okada, M.; Barras, C.; Toda, Y.; Hamazaki, K.; Yamasaki, Y.; Takahashi, H.; Takanashi, H.; Tsuda, M.; Hirai, Y.; Tsujimoto, H.; et al. High-Throughput Phenotyping of Soybean Biomass: Conventional Trait Estimation and 5 Novel Latent Feature Extraction Using UAV Remote Sensing and Deep Learning Models. Plant Phenomics 2024, 6, 0244. [Google Scholar] [CrossRef]
  28. Kemeshi, J.; Gummi, S.R.; Chang, Y. R2B2 Project: Design and Construction of a Low-Cost and Efficient Semi-Autonomous UGV for Row Crop Monitoring. In Proceedings of the 16th International Conference on Precision Agriculture, Manhattan, NY, USA, 21–24 July 2024; International Society of Precision Agriculture: Manhattan, KS, USA, 2024. [Google Scholar]
  29. Woebbecke, D.M.; Meyer, G.E.; Von Bargen, K.; Mortensen, D.A. Color Indices for Weed Identification Under Various Soil, Residue, and Lighting Conditions. Trans. ASAE 1995, 38, 259–269. [Google Scholar] [CrossRef]
  30. Nielsen, D.C.; Miceli-Garcia, J.J.; Lyon, D.J. Canopy Cover and Leaf Area Index Relationships for Wheat, Triticale, and Corn. Agron. J. 2012, 104, 1569–1573. [Google Scholar] [CrossRef]
  31. Parker, G.G. Tamm Review: Leaf Area Index (LAI) Is Both a Determinant and a Consequence of Important Processes in Vegetation Canopies. For. Ecol. Manag. 2020, 477, 118496. [Google Scholar] [CrossRef]
  32. Yuan, Y.; Wang, X.; Yin, F.; Zhan, J. Examination of the Quantitative Relationship between Vegetation Canopy Height and LAI. Adv. Meteorol. 2013, 2013, 964323. [Google Scholar] [CrossRef]
  33. Ma, X.; Wei, B.; Guan, H.; Yu, S. A Method of Calculating Phenotypic Traits for Soybean Canopies Based on Three-Dimensional Point Cloud. Ecol. Inf. 2022, 68, 101524. [Google Scholar] [CrossRef]
  34. Wang, C.; Nie, S.; Xi, X.; Luo, S.; Sun, X. Estimating the Biomass of Maize with Hyperspectral and LiDAR Data. Remote Sens. 2017, 9, 11. [Google Scholar] [CrossRef]
Figure 1. Rendering of the ModagRobot.
Agriengineering 07 00076 g001
Figure 2. Rendering of the suspension module attached to each wheel.
Agriengineering 07 00076 g002
Figure 3. Rendering of a single drivetrain module of the ModagRobot.
Agriengineering 07 00076 g003
Figure 4. Test site: yellow rectangles are aboveground biomass sampling locations, red dots are sampling spots for canopy height, and white circles with black boundaries are ground control points (GCPs).
Agriengineering 07 00076 g004
Figure 5. Phenotyping system setup. “A” denotes a sampling area.
Agriengineering 07 00076 g005
Figure 6. Process of preprocessing RGB and depth images for generating point clouds. Image Refining: Using a Python (V 3.9.19) script, RGB and depth images collected with the ModagRobot underwent preprocessing by overlaying an 8-bit mask on the raw images to remove unwanted vegetation. Point cloud generation: Point clouds were generated by feeding the refined RGB and depth images into a pipeline that utilizes the Open3D library.
Agriengineering 07 00076 g006
Figure 7. Validation of canopy height: (a) minimization of RMSE between ECH and measured canopy height for the determination of canopy points and (b) relationship between estimated canopy height and the measured canopy height for all sampling locations.
Agriengineering 07 00076 g007
Figure 8. Relationship between canopy ground coverage area (%CGCA) and measured canopy height using regression models: (a) linear, (b) exponential, (c) logarithmic, (d) polynomial, and (e) power.
Agriengineering 07 00076 g008
Figure 9. Optimization of correction factor, k for estimating aboveground biomass using 3D profile index: (a) minimization of RMSE and (b) maximization of R2 for k ranging between −4 and 12.
Agriengineering 07 00076 g009
Figure 10. Relationship between RGB-D predicted AGB and measured AGB: (a) AGB prediction using estimated canopy height (ECH) as the sole predictor, (b) AGB prediction using canopy ground coverage area (%CGCA) as the sole predictor, (c) AGB prediction using 3D profile index (3DPI) as the sole predictor, (d) AGB prediction using a combination of ECH and %CGCA as predictors, (e) AGB prediction using a combination of ECH and 3DPI as predictors, (f) AGB prediction using a combination of %CGCA and 3DPI as predictors, and (g) AGB prediction using ECH, %CGCA, and 3DPI combined predictors.
Agriengineering 07 00076 g010aAgriengineering 07 00076 g010bAgriengineering 07 00076 g010c
Table 1. Specifications of the ModagRobot.
Vehicle SpecificationsValueUnit
Vehicle mass64kg
Payload capacity60kg
Rated speed2m/s
Maximum speed4m/s
Width0.584–1m
Length0.86m
Ground clearance0.9–1.77m
Height1.77–2.38m
Operating time8h
Charge time4.25h
Table 2. Material cost of the ModagRobot.
MaterialQuantityUnit Price (USD)Total Price (USD)
DC hub motor444176
Wheel473292
Motor controller41976
Microcontrollers22550
Bluetooth module21122
Batteries24590
Shock absorber440160
Frame (aluminum)N/A 400
Electric box (IP65)21326
Total cost 1292
Disclaimer/Publisher’s Note: The statements, opinions and data contained in all publications are solely those of the individual author(s) and contributor(s) and not of MDPI and/or the editor(s). MDPI and/or the editor(s) disclaim responsibility for any injury to people or property resulting from any ideas, methods, instructions or products referred to in the content.

