Article

Harvester Maintenance Prediction Tool: Machine Learning Model Based on Mechanical Features

by
Rodrigo Oliveira Almeida
1,2,
Richardson Barbosa Gomes da Silva
1 and
Danilo Simões
1,*
1
Department of Forest Science, Soils and Environment, School of Agriculture, São Paulo State University (UNESP), Botucatu 18610-034, Brazil
2
Federal Institute of Education, Science and Technology—Southeast of Minas Gerais (IFET), Muriaé 36884-036, Brazil
*
Author to whom correspondence should be addressed.
AgriEngineering 2025, 7(4), 97; https://doi.org/10.3390/agriengineering7040097
Submission received: 29 January 2025 / Revised: 11 March 2025 / Accepted: 20 March 2025 / Published: 1 April 2025
(This article belongs to the Special Issue The Future of Artificial Intelligence in Agriculture)

Abstract

:
One important element influencing the efficiency of automated timber harvesting is harvester maintenance. However, the understanding of this effect is limited, which can lead to more frequent harvest interruptions and consequently higher production costs. Data modeling can be used to evaluate how mechanical aspects affect harvester maintenance in plantation forests, which can help with forest planning. This study aimed to ascertain if mechanical harvester characteristics may be utilized to develop a high-performance model capable of properly forecasting harvester maintenance using machine learning. A free web application to help forest managers implement the approach was also developed as part of the study. For the modeling, we considered eight mechanical features and the mechanical status as the target feature. In default mode, we ran 25 popular algorithms through the database and compared them based on accuracy and error metrics. Although the combination models performed well, the Random Forest model performed better in the default mode with an accuracy of 0.933. In addition, the generated model makes it possible to create a harvester maintenance prediction tool that provides a quick visualization of the mechanical status feature and can help forest managers make informed decisions. Along with the data from the experimental research, we will make available the complete file containing the predictive model, as well as the software, both developed in the Python language.

1. Introduction

In several countries, planted forests play a crucial role in both the socio-economic and environmental spheres, and their management ranges from planting seedlings to harvesting timber. To avoid delays in timber delivery, it is essential that the machines used in harvesting have a proper mechanical maintenance plan. In this sense, the time and cost of developing mechanical maintenance plans can be reduced by applying machine learning techniques to large amounts of data.
To meet the growing demand of the forest industry, 7.0% of the world’s total forest area is made up of planted forests [1]. They occupy 9.7 million hectares in Brazil, most of which, 78.1%, are planted with genus Eucalyptus, totaling 7.6 million hectares [2]. These trees are known for their rapid growth and high productivity, which are mainly attributable to the advantageous environment and the use of genetic and silvicultural methodologies and the high mechanization of harvesting [3].
Timber harvesting in planted forests refers to a number of tasks, including branch removal, pruning, tracing, loading, transport, and supplying raw materials to the forest industry. Cut to length is one of the main harvesting methods for the genus Eucalyptus in Brazil and is often performed by self-propelled forestry equipment in forestry companies [4,5,6,7].
In the cut-to-length technique, planted forests are often harvested using a forestry harvester capable of falling, delimbing, debarking, and bucking. The machine can be equipped with a rigid track system and a rotary head consisting of a cutting bar, delimbing knives, feed rollers, and sensors to quantify the diameter and length of the timber [8,9,10].
Modern forest harvesters have the ability to generate and record a great deal of data about the mechanized harvesting operation using on-board sensors and computers. This provides a navigation tool to assist the machine operator and creates opportunities for maintenance reports and machine productivity. These reports may be utilized to modify forest management and attain higher yields [11,12,13].
The proper implementation of a mechanical maintenance plan results in high machine availability, which is fundamental to reducing costs and increasing efficiency in the production process, avoiding the need to correct machine defects during shift work, and also avoiding damage to the entire supply chain [14,15].
It is common practice to base the maintenance intervals only on the estimate provided by the manufacturer or maintenance manager. Since this increases the cost of operating the machine—too short maintenance intervals increase maintenance costs, and excessively long maintenance intervals raise expenses since the production equipment is in poor technical condition—it is critical to find out how to better reduce these costs [16].
Over the past few decades, the conception of maintenance has undergone a tremendous change, transitioning from a corrective approach, which entailed repairing failures after they occurred, to a preventive strategy that anticipates failures through proactive maintenance. With the rapid expansion of computing, predictive maintenance has replaced preventative maintenance in maintenance methods, i.e., those that use sensors to track the actual condition of the machine to alert the system in advance and assess whether corrective maintenance is needed [17,18,19].
Predictive maintenance has not yet been applied in Brazil’s planted forests, despite the fact that many scientists have recognized its importance and impact. The main reason for this could be the inability of the process to evaluate the huge amount of data collected by the equipment itself.
Although harvester data are readily available and easily accessible to users, they are still large and underutilized in many regions. Therefore, large data analysis is an area that warrants continued development and testing of various methodologies (e.g., data mining, machine learning, predictive modeling, etc.) [20]. To date, it has been most commonly used in productivity studies, particularly with a focus on regression analysis [21,22,23,24,25].
Managing these data is made possible by machine learning, which is defined as the ability to apply supervised or unsupervised learning algorithms to a dataset to extract knowledge without the need for rigorous programming, enabling analytics such as anomaly detection [26,27].
Detection identifies data that do not conform to expected notions of the set’s behavior, known as anomalies. Quantifying these patterns can prevent anomalies from occurring and reduce the costs associated with downtime. When applied to the detection of mechanical failures, it allows for better management of spare part inventory and periodicity of maintenance [28,29,30], as well as maximizing the productivity of the harvester. However, a major obstacle to advancement in this crucial field of study is the paucity of papers on the application of machine learning methods to automated harvesting.
Unlike traditional approaches, such as corrective maintenance, often used in studies of mechanized timber harvesting, which are based on repairing after a failure, predictive maintenance is an innovative technique that represents a novelty in the scientific literature because it aims to use sensors to monitor the state of the machine to be able to notify the system in advance and help management make more precise decisions, that is, to determine the best time to perform preventive maintenance on harvesters through an application based on machine learning and capable of providing rapid responses.
The goal of this research is to ascertain whether mechanical harvester features can be used to develop a powerful model that uses machine learning to precisely predict harvester maintenance. This research also intends to offer a free web application to help forest managers use the approach.

2. Materials and Methods

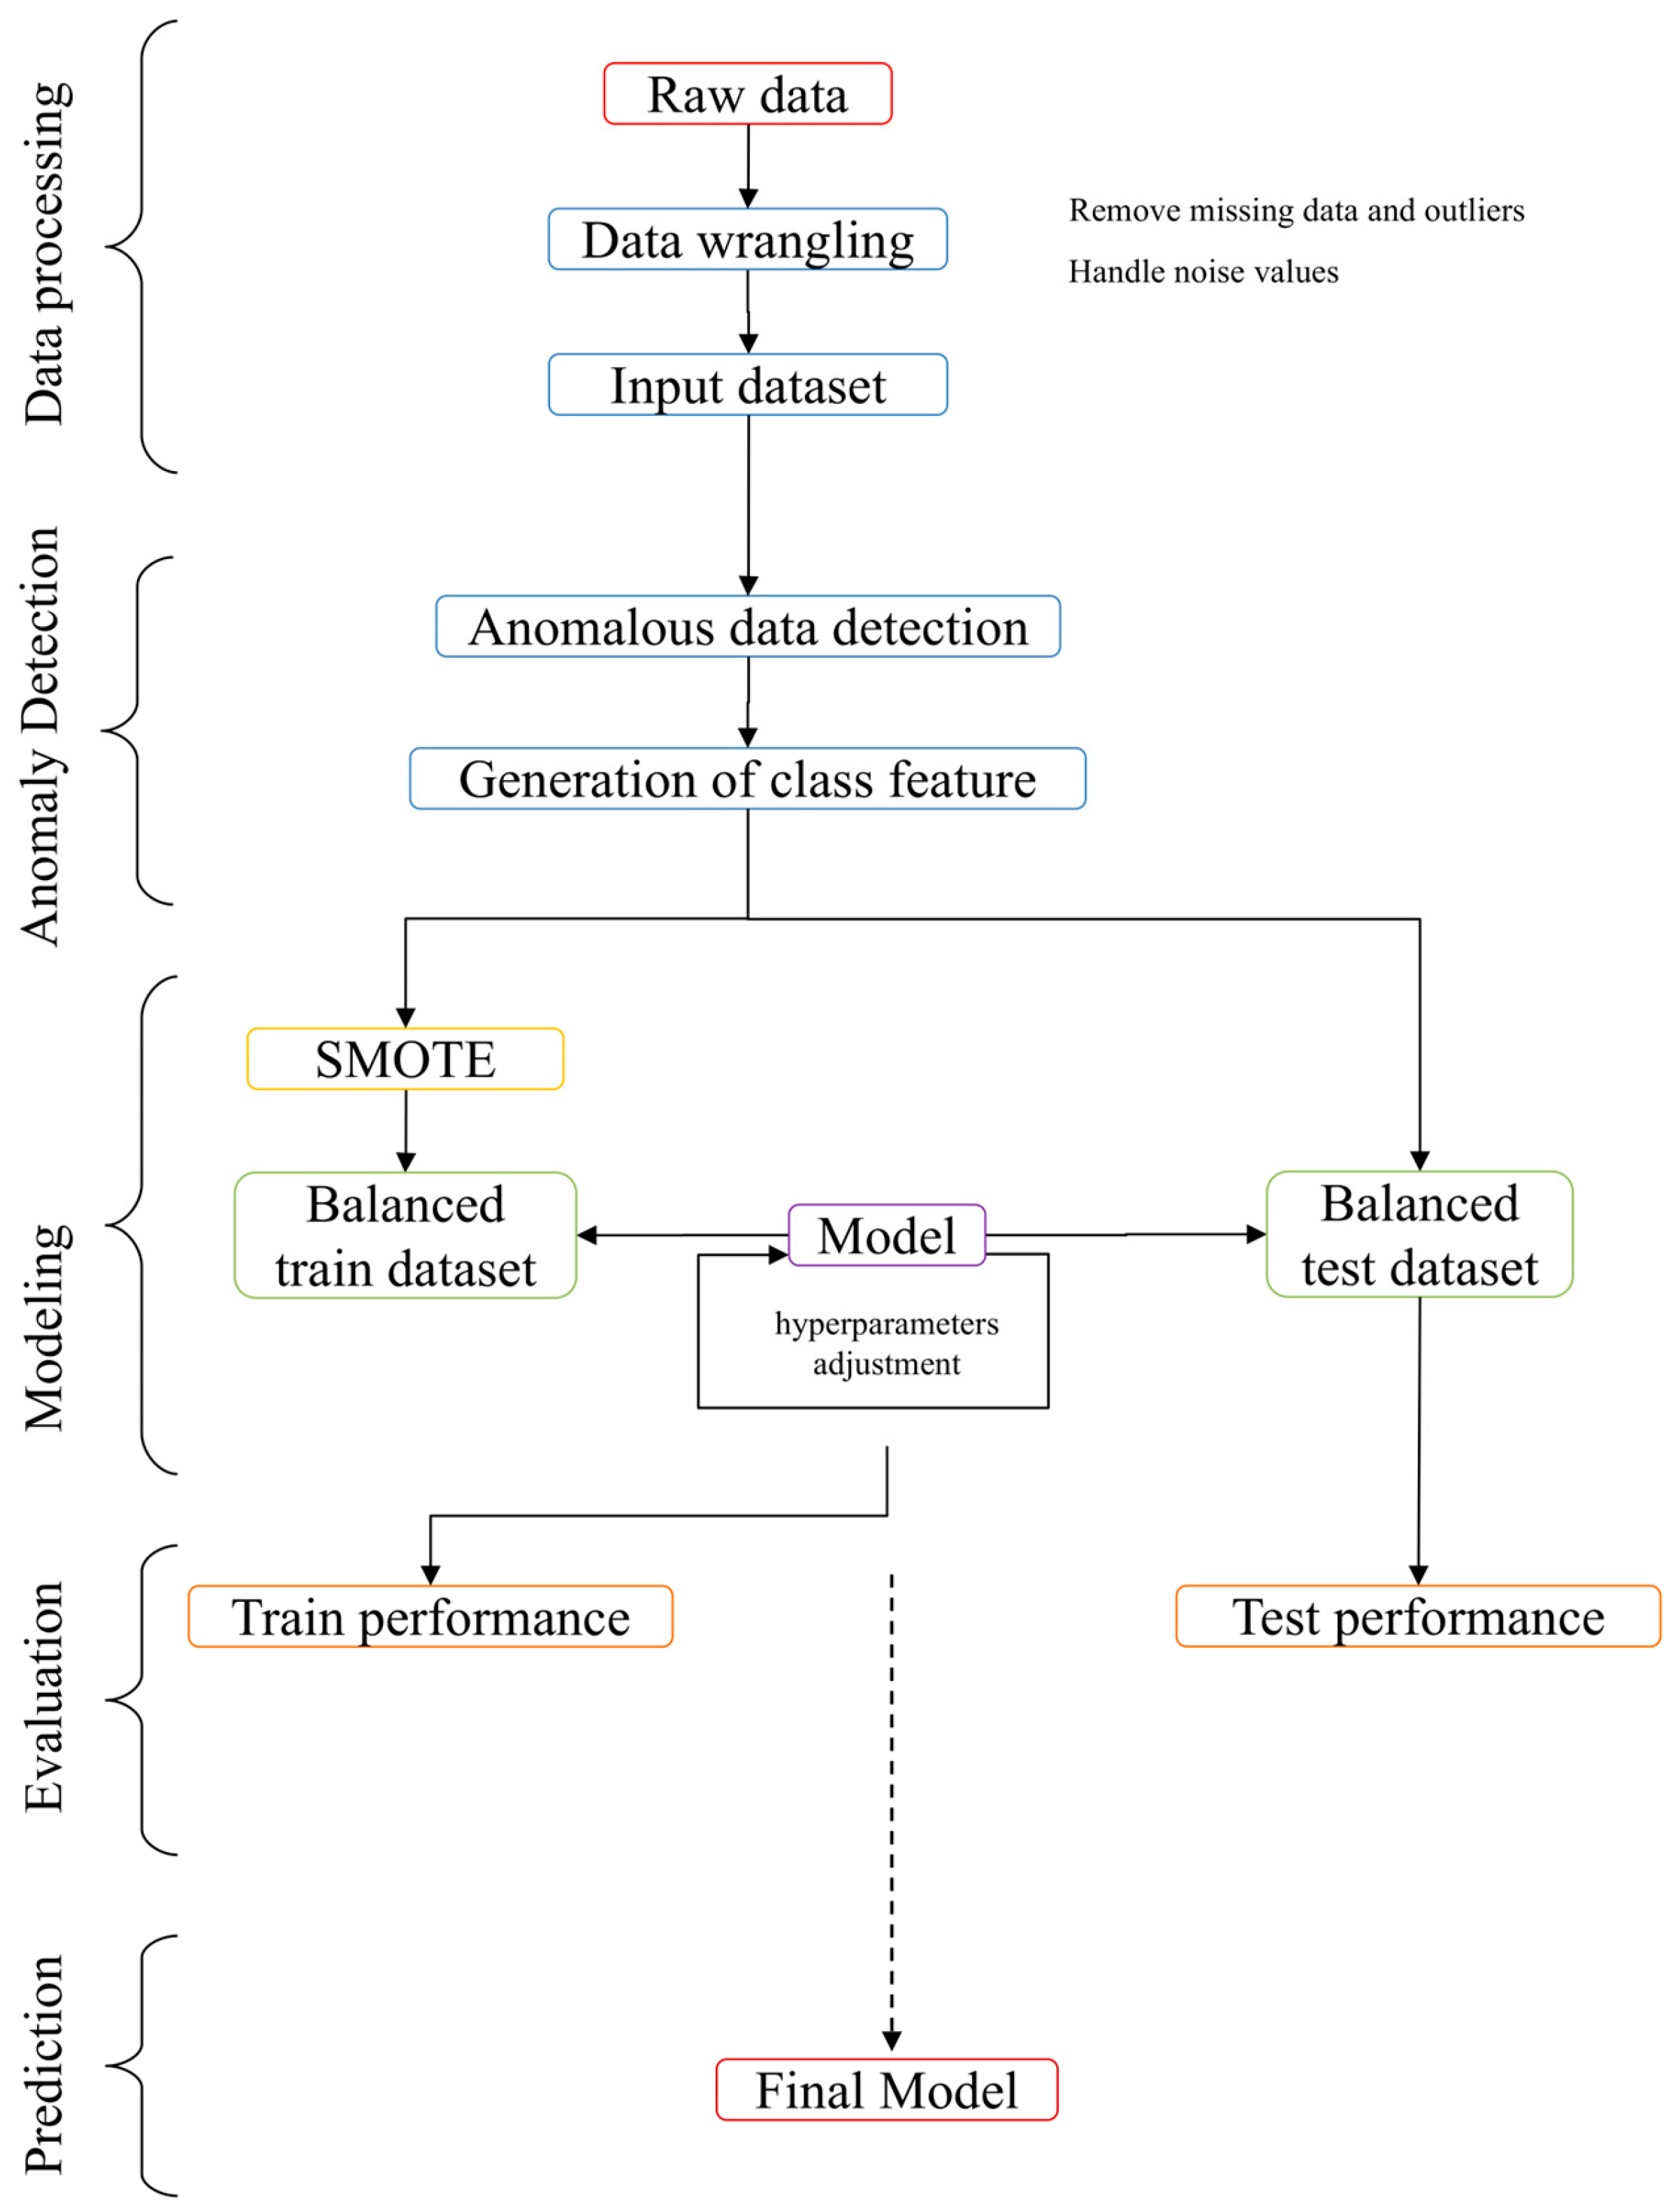
2.1. Data Processing

The data used in this study were provided by a pulp and paper company located in the state of São Paulo, Brazil. The company uses mechanized harvesting in Eucalyptus forests planted with 3 m × 2 m spacing. The relief in this region was characterized as flat and gently rolling, with slopes ranging from 0.0% to 5.0% [31].
The Köppen–Geiger classification for the region was Cfa, humid subtropical zone, with an oceanic climate, dry winter, and hot summer. This region saw an average yearly temperature of 19.7 °C, with winter temperatures ranging from 16.5 °C to 22.6 °C. The annual rainfall reached about 1372.7 mm [32,33,34].
Over the course of two months, the timber was harvested using a cut-to-length (CTL) technique. This included a number of operations such as bucking, debarking, topping, delimbing, and felling, which were performed by four self-propelled forest harvesters (model Komatsu PC200F-8, Tokyo, Japan) equipped with a rigid track system, an engine with 116 kW of rated power, a mass of around 23,260 kg, an overall length of 9400 mm, and an hour meter with 1056 accumulated hours of operation. They had a rotary head (model Komatsu 370E, Tokyo, Japan), an 82.5 cm guide bar, three pairs of delimbing knives, and two infeed rollers with a maximum saw motor velocity of 40 m s−1 and felling diameter of 700 mm.
There were 102 mechanical characteristics and 232,914 occurrences in the original dataset. To eliminate missing values, insufficient information, unusual characters, characteristics without variation, and outliers, we used the data wrangling technique. The main process for reducing the attributes of the initial dataset was the criterion of features without variation. Then, in order to determine the distribution of the data and to eliminate inaccurate data, we used an exploratory data analysis. The dataset now exhibits 12,212 instances and 8 attributes: amber warning lamp (yes/no), battery potential (V), ECU temperature (°C), fuel rate (L h−1), intake manifold pressure (bar), oil temperature (°C), oil pressure (bar), and red stop lamp (yes/no).

2.2. Unsupervised Machine Learning for the Identification of Data Anomalies

In the initial stage of our study, we used five algorithms commonly applied in anomaly detection analysis (Table 1) for an input dataset obtained from the harvester’s Controller Area Network (CAN). Instances identified as anomalous were those in which at least three algorithms were subsequently classified as anomalous (Supplementary MaterialsTable S1).

2.3. Modeling, Evaluation, and Prediction

In the second phase of this investigation, the output of the previous step was used to generate the mechanical status feature, which is referred to as Class A, B, and C (Table 2), and incorporated into the input dataset. We used exploratory data analysis and feature importance (FI) to observe the distribution of instances and features (Supplementary MaterialsFigure S1 and Tables S2 and S3).
Due to the significant discrepancy in the number of instances between categories within the feature class, we decided to construct a small balanced test set, resulting in a ratio of training to test datasets of 9.9:0.1 (Supplementary MaterialsTable S4). We balanced the instances from the training dataset by oversampling using the SMOTE technique, resulting in 8498 instances for each feature class.
Once the necessary test and training datasets were obtained and appropriately balanced, eight supervised learning classification algorithm groups (Table 3) served as the basis for this investigation.
The database had to be subjected to 25 popular predictive analysis algorithms in their default configuration in the Python v. 3.8 programming language [35] to determine the best models for each group, as it is impossible to predict how well the algorithms will perform (Supplementary MaterialsTable S5).
According to Pedregosa et al. (2011) [36], these algorithms are mainly based on the scikit-learning library, namely: linear methods, discriminant analysis, SVM, K nearest neighbors, naive Bayes, decision trees, ensembled methods, and artificial neural networks. From the group of linear methods, the following algorithms were used: logistic regression, passive aggressive classifier, perceptron, ridge, and stochastic gradient descent. This group has an equation with a typical linear combination of characteristics as a target value, according to mathematical logic. In the second group, discriminant analysis, the linear discriminant analysis and quadratic discriminant analysis algorithms were used to identify a criterion that discriminates between data classes.
From the third group, SVM, the SVM linear kernel, and SVM rbf kernel algorithms were used to find a decision boundary (or hyperplane) capable of effectively separating the different data classes. In the fourth group, K nearest neighbors, the idea is to forecast the outcome based on the outcomes of a predefined number of training samples that are closest to the new data point. In this paper, the nearest centroid and K nearest neighbors algorithms were used.
In the fifth group, naive Bayes was used, making it a group of classification algorithms based on Bayes’ theorem with the simplifying assumption that the predictor variables (features) are independent of each other. In this paper, the Bernoulli naive Bayes, complement naive Bayes, Gaussian naive Bayes, and multinomial naive Bayes algorithms were used. For the group of decision tree methods, the CART algorithm was used, which applies nonparametric learning for both regression and classification, using simple decision rules and inferring values for the target variable.
From the seventh group, ensemble methods, AdaBoost, CatBoost, light gradient boosting, extreme gradient boosting, histogram-based gradient boosting, gradient boosting, and Random Forest were used. In this method, different algorithms are used to combine the results of different predictions to improve the generalizability and reduce the variance of the model. For the artificial neural network method group, the algorithms of multilayer perceptron with 1 layer and multilayer perceptron with 2 layers were used, which are inspired by how the human brain works and are made up of layers of units called neurons.
To create the tuned model (Supplementary MaterialsTable S6), we selected models with a Matthews Correlation Coefficient (MCC) greater than 0.85 and adjusted the hyperparameters using the Optuna framework [37]. Voting and stacking ensemble approaches (using meta-learning logistic regression, nearest neighbors, and Random Forest) were used to combine the selected models.
Using the test and training datasets, the following metrics were used to assess the models’ performance: F1-score (F1), recall (Rec), precision (Prec), accuracy (Acc), and MCC. To provide a thorough overview of the predictions, we applied the finished model to the test dataset (Supplementary MaterialsTable S7). To explore how the model features affected the prediction results, we used the Shapley Additive exPlanations (SHAP) approach [38].
Figure 1 shows the general framework of the procedure.

3. Results

3.1. Modeling in Default Mode

The ensemble and decision tree groups of algorithms produced the best results for the mean between the training and test datasets (Table 4). The Random Forest and CART models showed the best performance, with a higher value for MCC, Acc, Prec, Rec, and F1 (Table 5).

3.2. Tuned Model and Combined Models

The best default models (Random Forest and CART) were used to generate the tuned models after the hyperparameter adjustment process, but the performance of the models did not improve.
The voting and stacking method paired with the default models produced results that were comparable to those of the model based on Random Forest, as evidenced by the higher values of the metrics MCC, Acc, Prec, Rec, and F1 (Table 6).

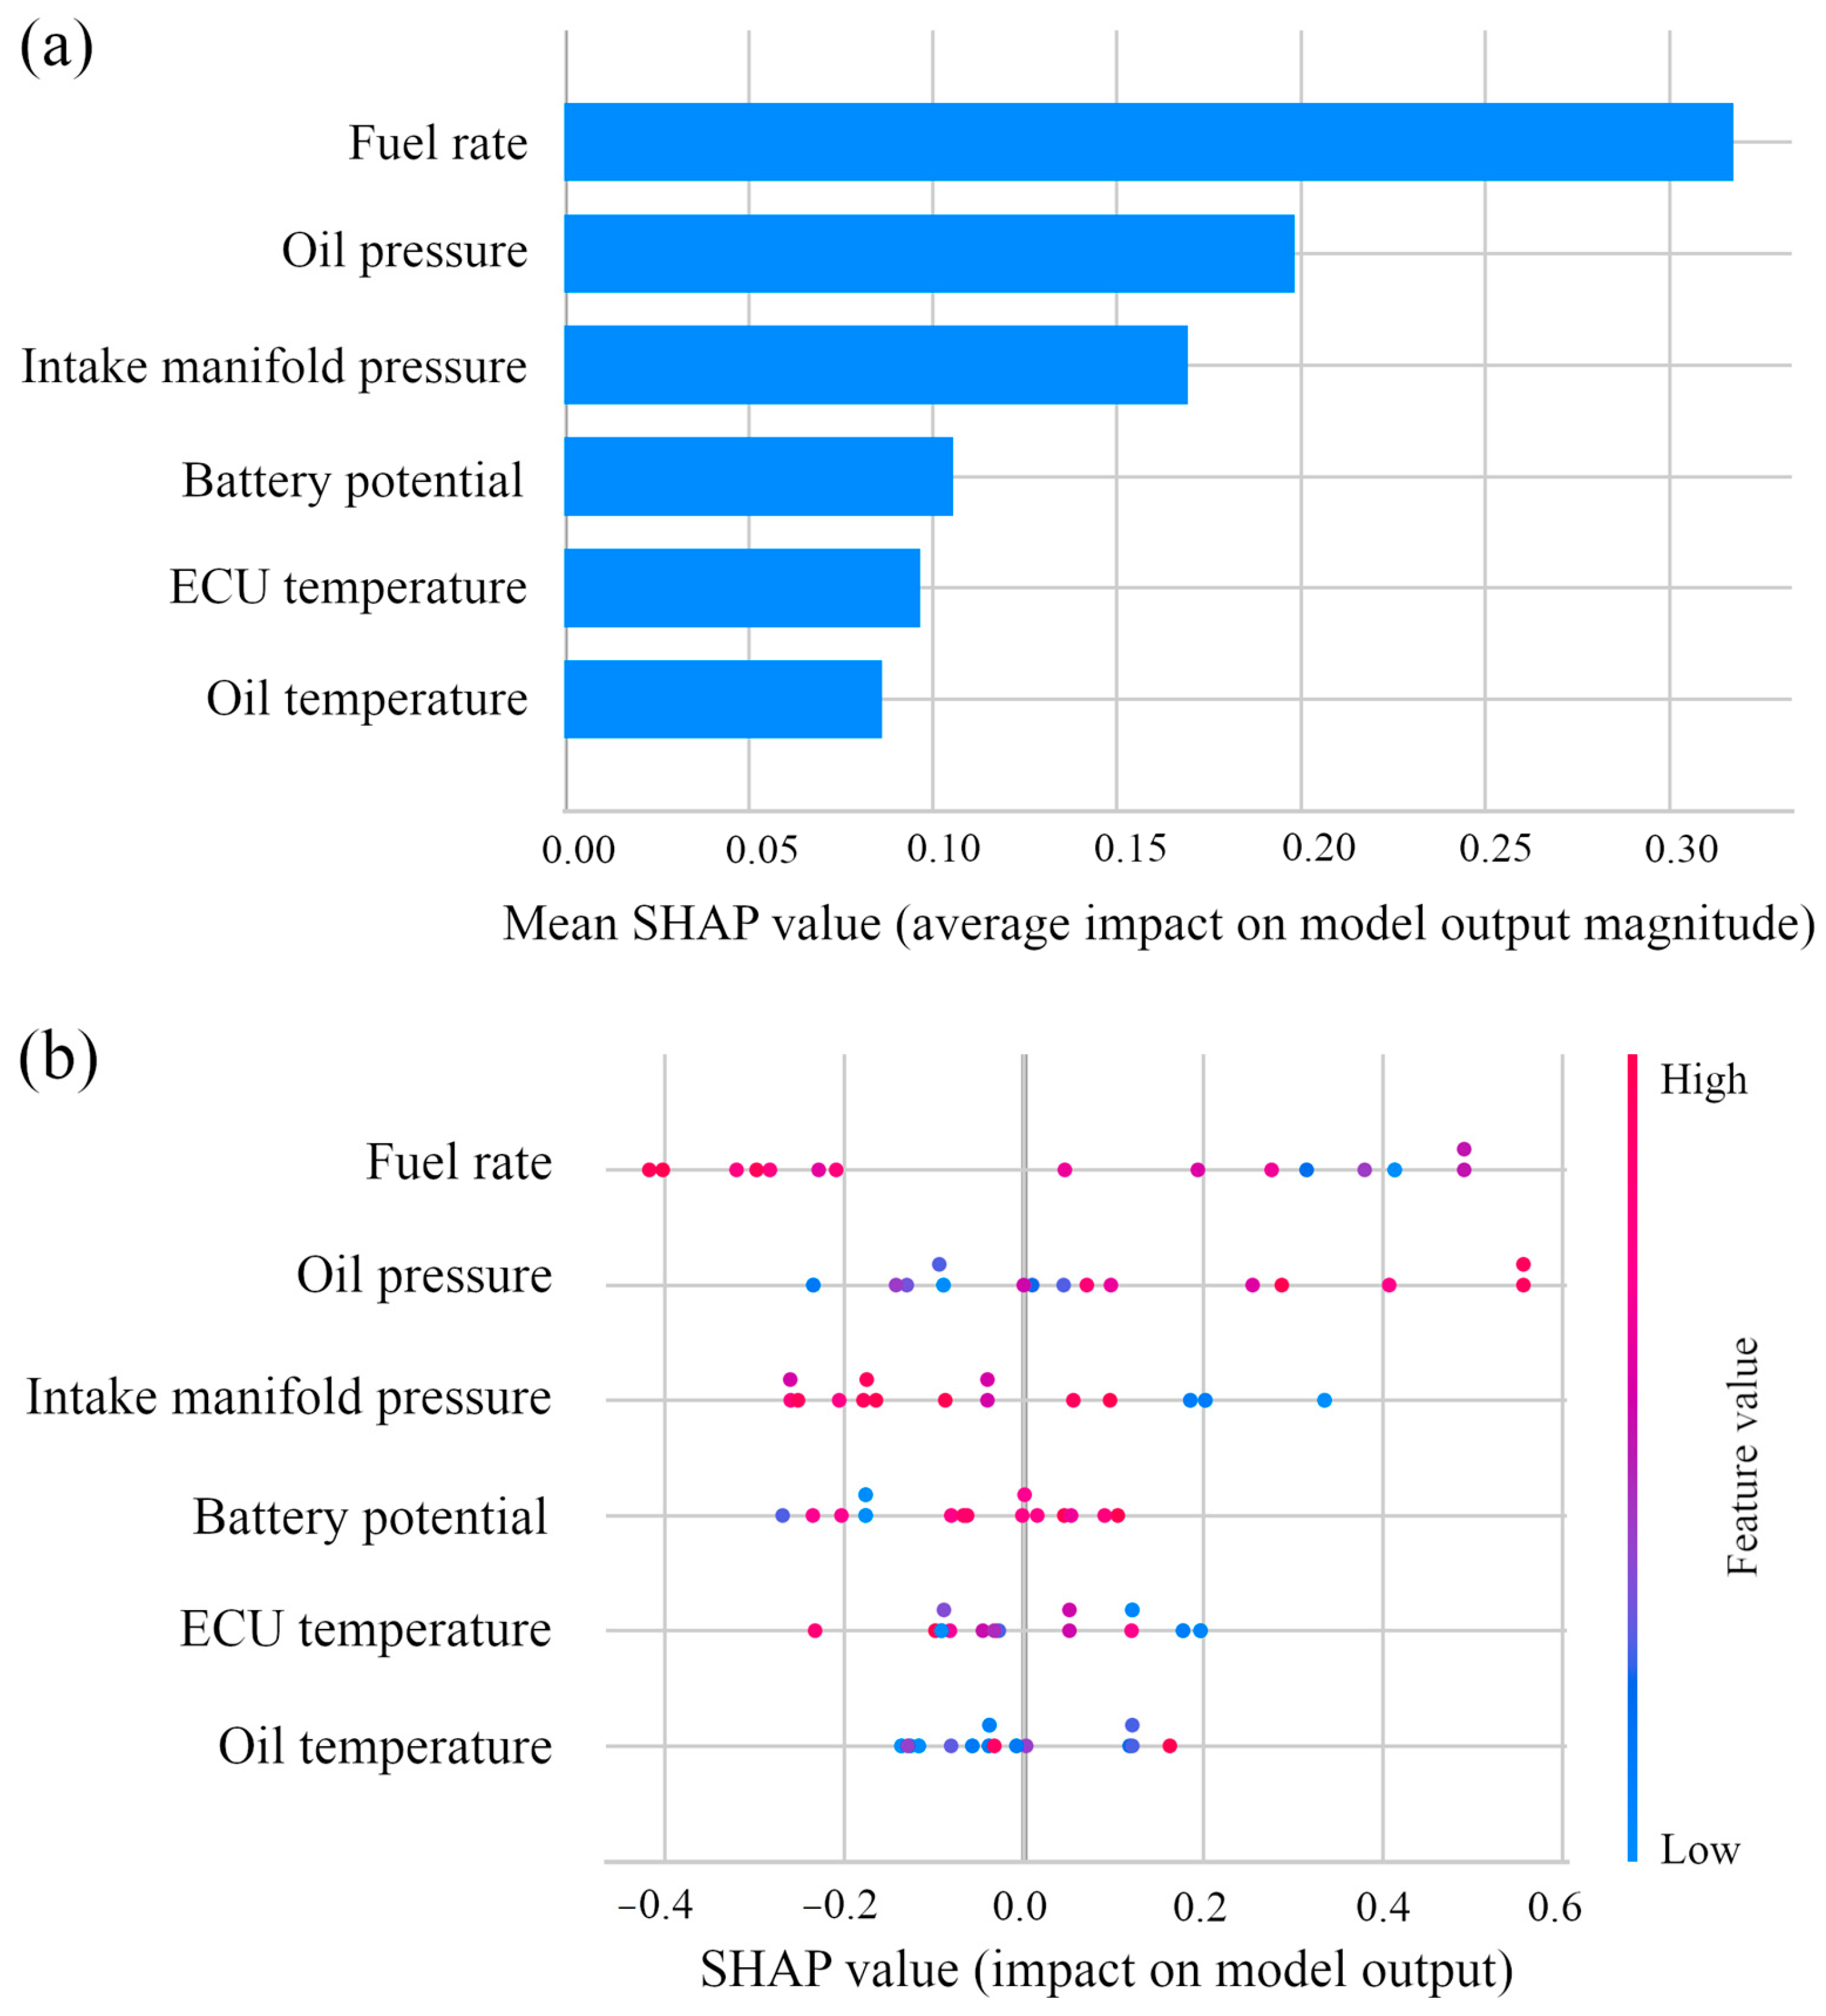
3.3. SHAP Dependence Analysis

To show the influence of the features in the best model (Random Forest, in default mode), SHAP dependency analysis was used. The features that had the most influence on the model creation were found to be fuel rate, oil pressure, and intake manifold pressure (Figure 2).

4. Discussion

4.1. Predictive Models

The results of this investigation showed that the decision tree and ensemble algorithms performed better than the others. As shown in Table 5, this finding was particularly pronounced for the Random Forest and CART algorithms. These algorithms have been used effectively in many research projects, such as the study of variables affecting eucalyptus growth and the identification of forest plantation species [39,40]. In addition, the Random Forest algorithm continues to be improved [41].
Random Forest and CART algorithms are known to perform well in a wide range of machine learning tasks. The CART algorithm generates a decision tree that is easy to visualize and interpret, where each decision node attempts to partition the data based on the attributes that maximize data separation. The process of splitting the data into more homogeneous nodes allows the model to be highly adaptive and capture nonlinear relationships in the data, and it does not require normalization of the attributes. Using random selections of data and attributes, the Random Forest method merges many decision trees, improving the generalizability of the model and overcoming many of the limitations of individual trees, such as overfitting and increased variance. Because of its ensemble nature, Random Forest is also more robust to outliers, preventing irrelevant attributes from dominating the process.
After hyperparameter adjustments through the Optuna framework, it was found that the tuned process did not show the best performance for either model. Therefore, the default models were selected for the combined model process. The performance of the combined models, either by voting or stacking ensemble, did not outperform the default Random Forest model, as shown in Table 6. Finally, the default Random Forest model was selected as the final model because it had the highest values for all the metrics used.
Two prerequisites for developing a strong machine learning model that ensures high prediction performance were met in our study: access to a cloud and web infrastructure for installing software solutions and trained models, and a large experimental dataset for training [42].

4.2. Features and Their Effect on the Predictive Model

Predicting the mechanical status of the harvester was significantly aided by each feature included in the data (fuel rate, oil pressure, intake manifold pressure, battery potential, ECU temperature, and oil temperature). Figure 2a illustrates how these features affected the final model using the SHAP approach.
Looking at the features of fuel rate and manifold pressure, it is evident that high values have a significant negative impact on the predictive model, while oil pressure has a positive impact on the predictive model, as shown in Figure 2b.
There is a direct correlation between the energy required and the resulting fuel consumption, as reported by ref. [43]. Therefore, by monitoring the fuel consumption rate, we can determine the efficiency of the machines in different operations [44].
Engine oil pressure is often one of the most important factors in engine functioning, as low pressure can cause engine damage [45]. In addition, high engine speeds cause an increase in the amount of oil pumped into the engine, and if the pressure in the system exceeds a nominal value, there is a pressure limitation in the pump, which can lead to instability of the engine oil pressure and fuel rate consumption [46,47].
Intake manifold pressure is directly related to several categories of engine operating conditions. Within the engine, intake manifold pressure is crucial and works in tandem with the Engine Management System (EMS). The EMS, in turn, modifies the air–fuel mixture based on engine speed according to feedback from the oxygen sensor. Intake manifold pressure failures have been shown to result in a decrease in engine efficiency, accompanied by changes in power and fuel consumption [48,49]. In addition, the use of intake manifold turbulence with different vane angles has a significant effect on engine performance, which can result in losses of 22% or gains of 12% [50].
Although oil temperature has a small effect on model output, as shown in Figure 2b, it has a direct effect on fuel consumption by minimizing friction in engine components when kept within an optimal and controlled temperature range [51].
Using these six features, battery potential, ECU temperature, fuel rate, intake manifold pressure, oil temperature, and oil pressure, the models presented in Table 4 were able to achieve high predictive performance, demonstrating that these features are a good option for generating a maintenance prediction model.
By providing local and global explanations of the attributes studied, SHAP analysis has been used in various research areas, providing important considerations for its use and demonstrating the effects of various attributes on predictive models [52,53]. Therefore, the SHAP values show that all of the attributes used contribute significantly to the modeling result, with a greater emphasis on the attributes of fuel rate, oil pressure, and intake manifold pressure. Like Basu et al. (2022) [54], our study used SHAP analysis to make complex and nonlinear “black box” machine learning models interpretable, discover the most important attributes, and thus increase the reliability of the generated models. SHAP analysis is based on game theory and uses additive feature imputation, which is a linear addition of input attributes and satisfies the requirements of local precision, absence, and consistency [55].
It can be concluded that the most sensitive features in this context are fuel rate, intake manifold pressure, and oil pressure. Any significant change in these features will have a noticeable effect on the prediction result. Conversely, the features ECU temperature, battery potential, and oil temperature are less sensitive, resulting in small changes in the predicted class.
In practice, one of the primary elements affecting harvesters’ productivity in planted forests is mechanical availability, which is directly related to maintenance, whether predictive, preventive, or corrective. This maintenance consists of the use of techniques to replace or repair parts in order to allow the continuity of the forestry activity [56,57].
Unplanned downtime caused by inadequate maintenance scheduling reduces production capacity and can increase costs. Similarly, models that produce significant false positives can lead the forest manager to schedule excessive and unnecessary preventive maintenance, reducing the mechanical availability and productivity of the harvester [58,59]. For example, research by ref. [60] using an automated CTL system in Russia showed that improper harvester maintenance can result in significant operational and financial losses. These authors showed that prompt replacement of worn-out rollers may reduce fuel use by 5% and increase output by 2%, while better maintenance of harvester delimbing knives can reduce the rejection rate of industrial round-wood by 5%.
On the other hand, ref. [61] showed that the use of diagnostic software in predictive maintenance reduced machine repair time by 88% and maintenance costs by 93%. It also reduced downtime, allowing for greater machine availability in the field. The greatest way to reduce malfunctions and downtime expenses is to optimize the preventive maintenance schedule. In the study by ref. [62], they optimized preventive maintenance based on a fault tree–Bayesian network algorithm. The method proved to be a helpful tool; for an unstable machine, it reduced the operating time by about 31%, although it increased the white sugar losses by 11.85%.
In order to broaden this discussion, it is important to emphasize that the subject of “maintenance of forestry machines” in mechanized timber harvesting has been studied in the literature from several angles, such as productivity, operating time, operational efficiency, total cost, machine availability, and machine replacement models, as we discuss in the following paragraphs.
Lopes et al. (2014) [63] studied the impact of different wheel types on the productivity and cost of Pinus taeda timber extraction, highlighting the significant machine downtime due to preventive and corrective maintenance, movement between stands, and refueling. This resulted in an average operating efficiency of 61.6%. Santos et al. (2017) [64] found that maintenance and repairs accounted for the highest cost (60.21%) of logging and wood processing activities performed by harvesters in Eucalyptus plantations. Leite et al. (2013) [65] reported that maintenance and repairs accounted for 40.0% of the total costs, while Fernandes et al. (2013) [66] found that maintenance and component costs accounted for 49.0% of the total costs.
Fiedler et al. (2017) [67] conducted an analysis of harvesting operations in a Eucalyptus plantation. They focused on the distribution of operating time, productivity, efficiency, and machine availability. The study showed that the most significant unproductive time was due to waiting for missing components, with the highest concentration of maintenance activities observed in the machines. In addition, the forwarder showed higher mechanical availability (82.31%) and productivity (51.33 m3 h−1), while the harvester performed better in terms of utilization (85.01%) and operational efficiency (66.41%).
Diniz et al. (2019) [68] and Diniz et al. (2020) [69] investigated the implementation of World-Class Maintenance (WCM) in forestry machines used to harvest Eucalyptus grandis and Pinus taeda, with the aim of reducing production costs. The studies showed improvements of a 60% decrease in hydraulic oil usage and an increase in the mechanical availability of cutting and skidding equipment. The average time between failures increased from 31.59 h in the implementation phase to 37.01 h in the stabilization phase. Although the mean time to repair for the skidder and the harvester increased by 25.9% and 18.9%, respectively, this demonstrated that the quality of the maintenance service had improved. In addition, the proactive index of the machines increased by 31%, resulting in a 9% decrease in maintenance expenses between the stabilization and deployment stages.
Cantú et al. (2017) [70] examined machine replacement models for forest harvesting in remote areas of eastern Canada and discovered that the inclusion of precise cost estimates, uncertainty, scheduled inspections, and preventative maintenance techniques might enhance these models. However, they found that many companies do not use even basic models, such as those based on cost analysis. The authors suggested that replacing a particular component or the machine at the suggested time may be the best course of action (such as the undercarriage or processing head) to extend the life of the machine, which would raise the average age at which machines need to be replaced to 6.6 years.
Bassoli et al. (2020) [71] evaluated the optimal replacement time for forestry harvesting machines using the Equivalent Annual Cost (EAC) method and found that the optimal replacement time begins in the fourth year of the machine’s life. The expenses of component replacement and maintenance were the primary determinants of this outcome. Rodrigues et al. (2024) [72] also studied optimal replacement methods for harvesters and recommended the use of both the EAC and the chain replacement method, which considers machine cost and revenue variables. According to this approach, the ideal replacement period is seven to eight years, which is in line with what companies in the forest industry do.

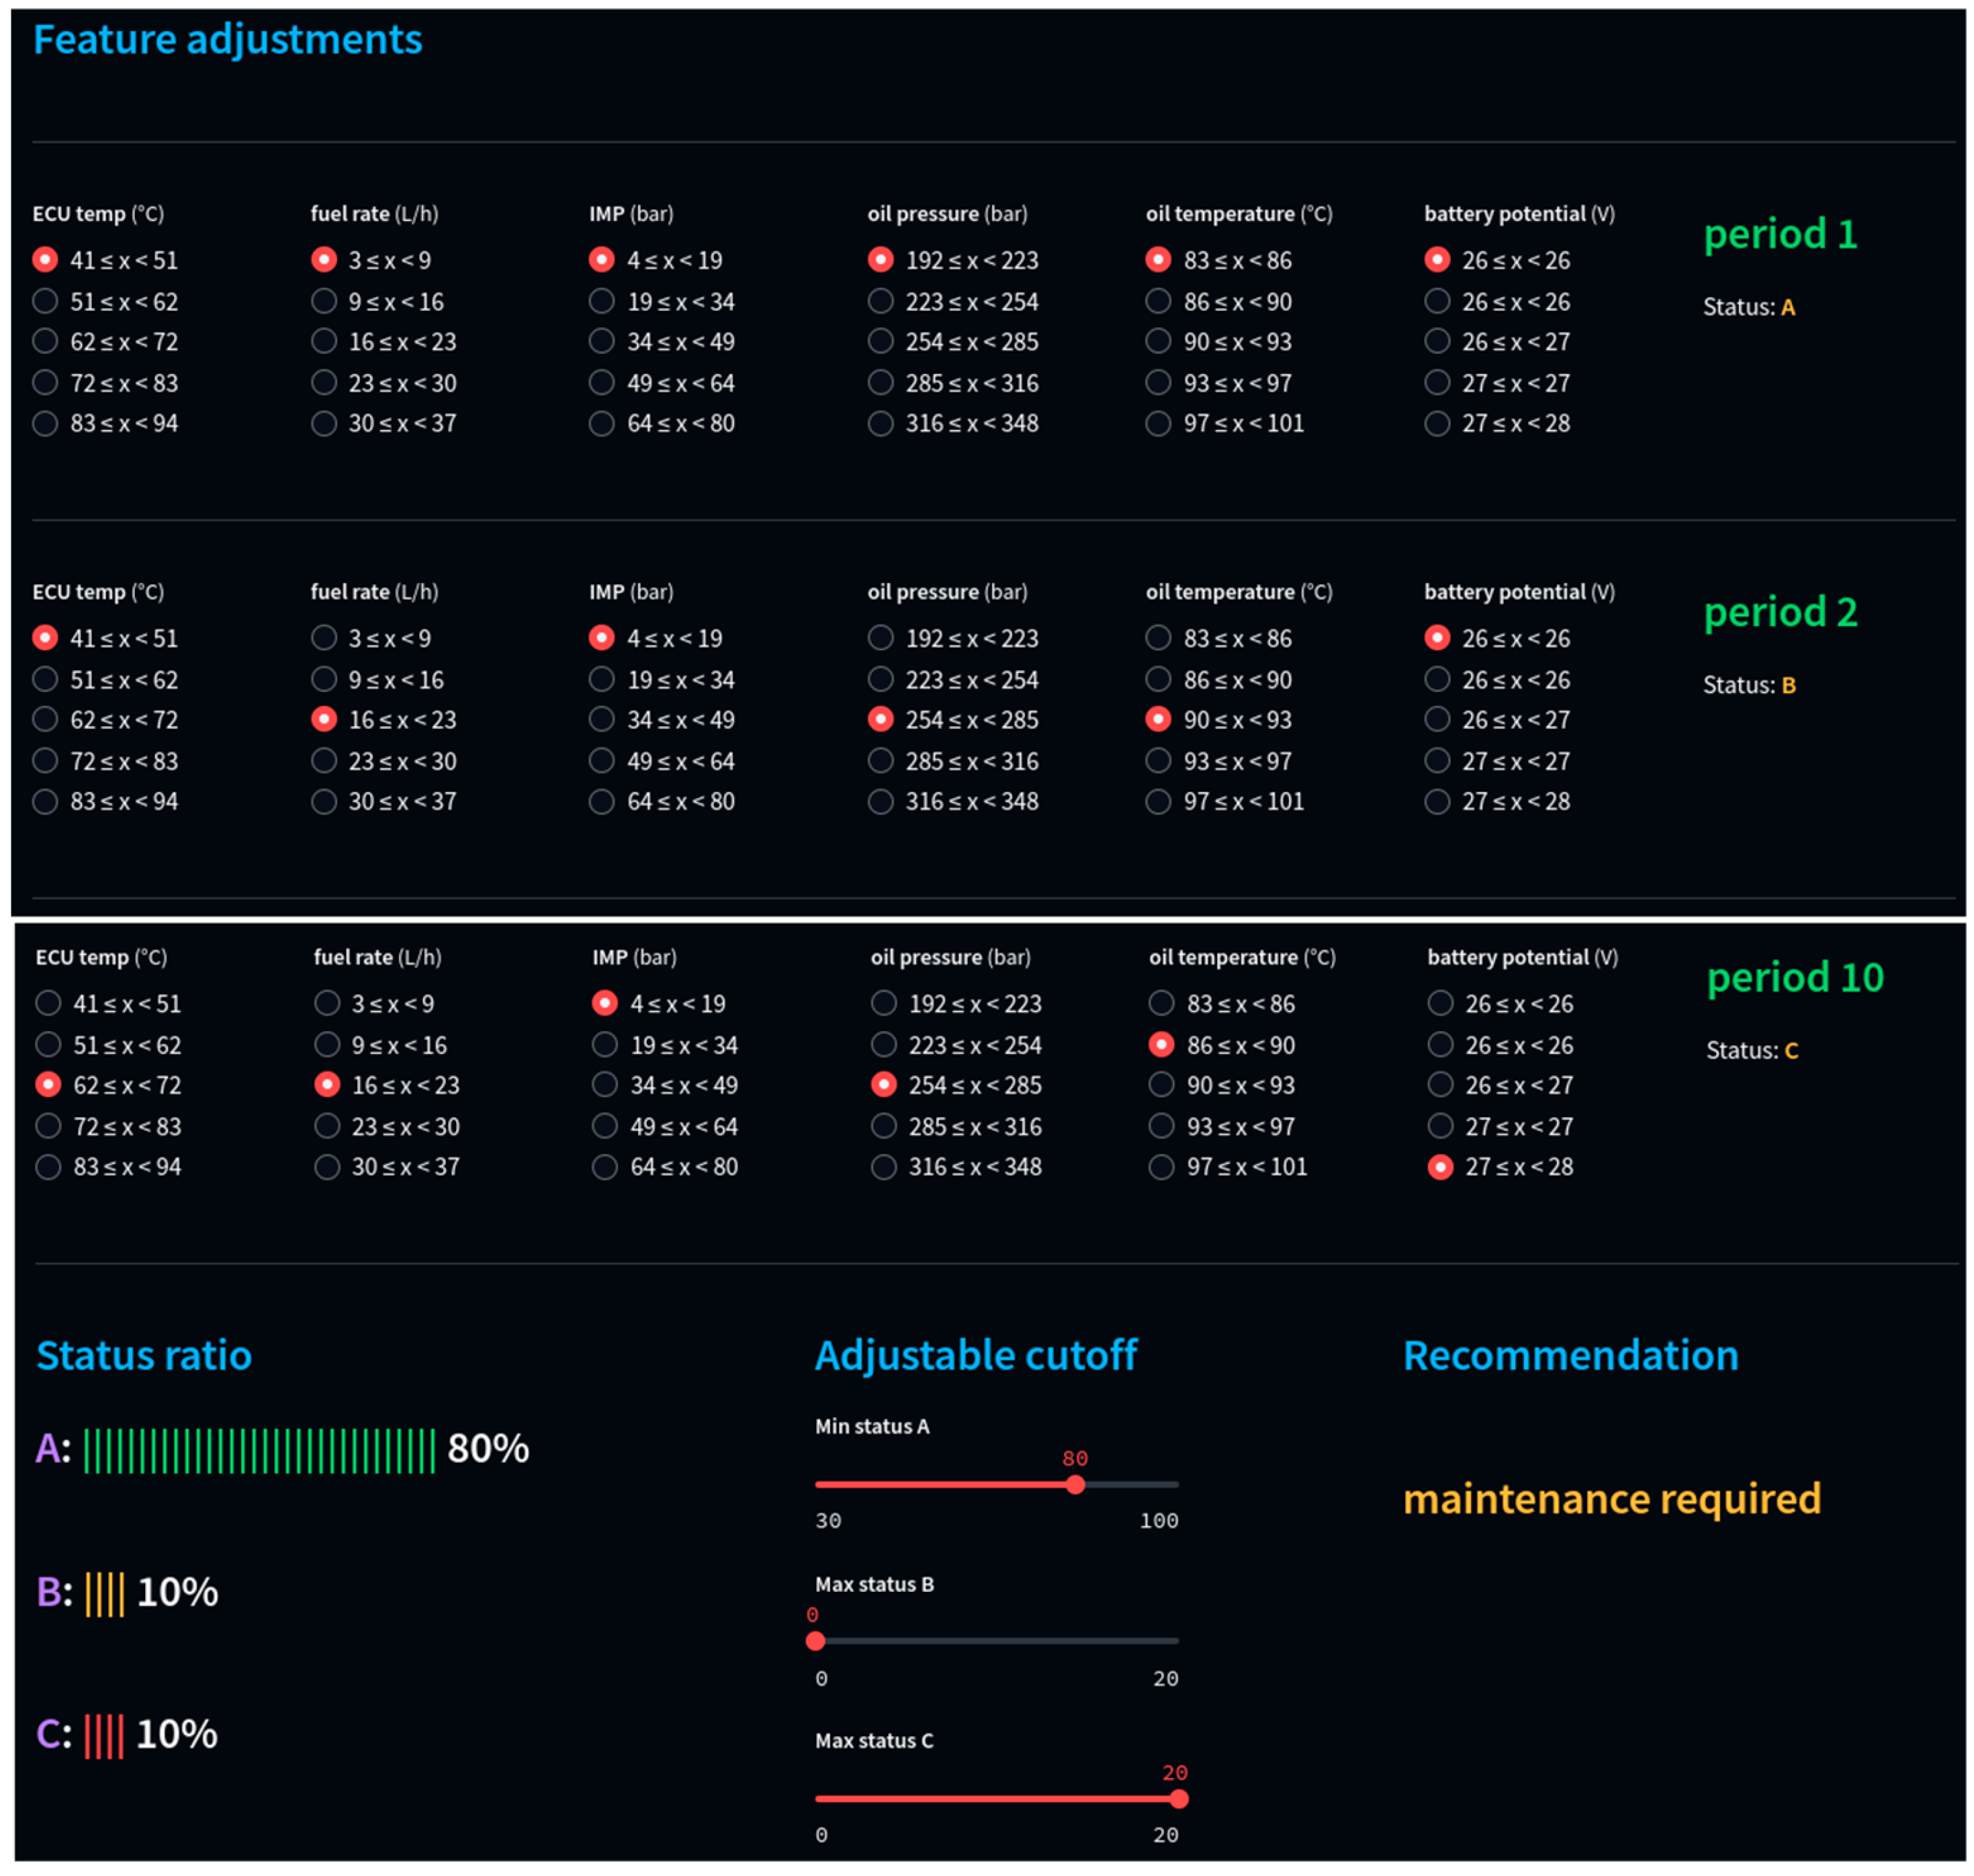
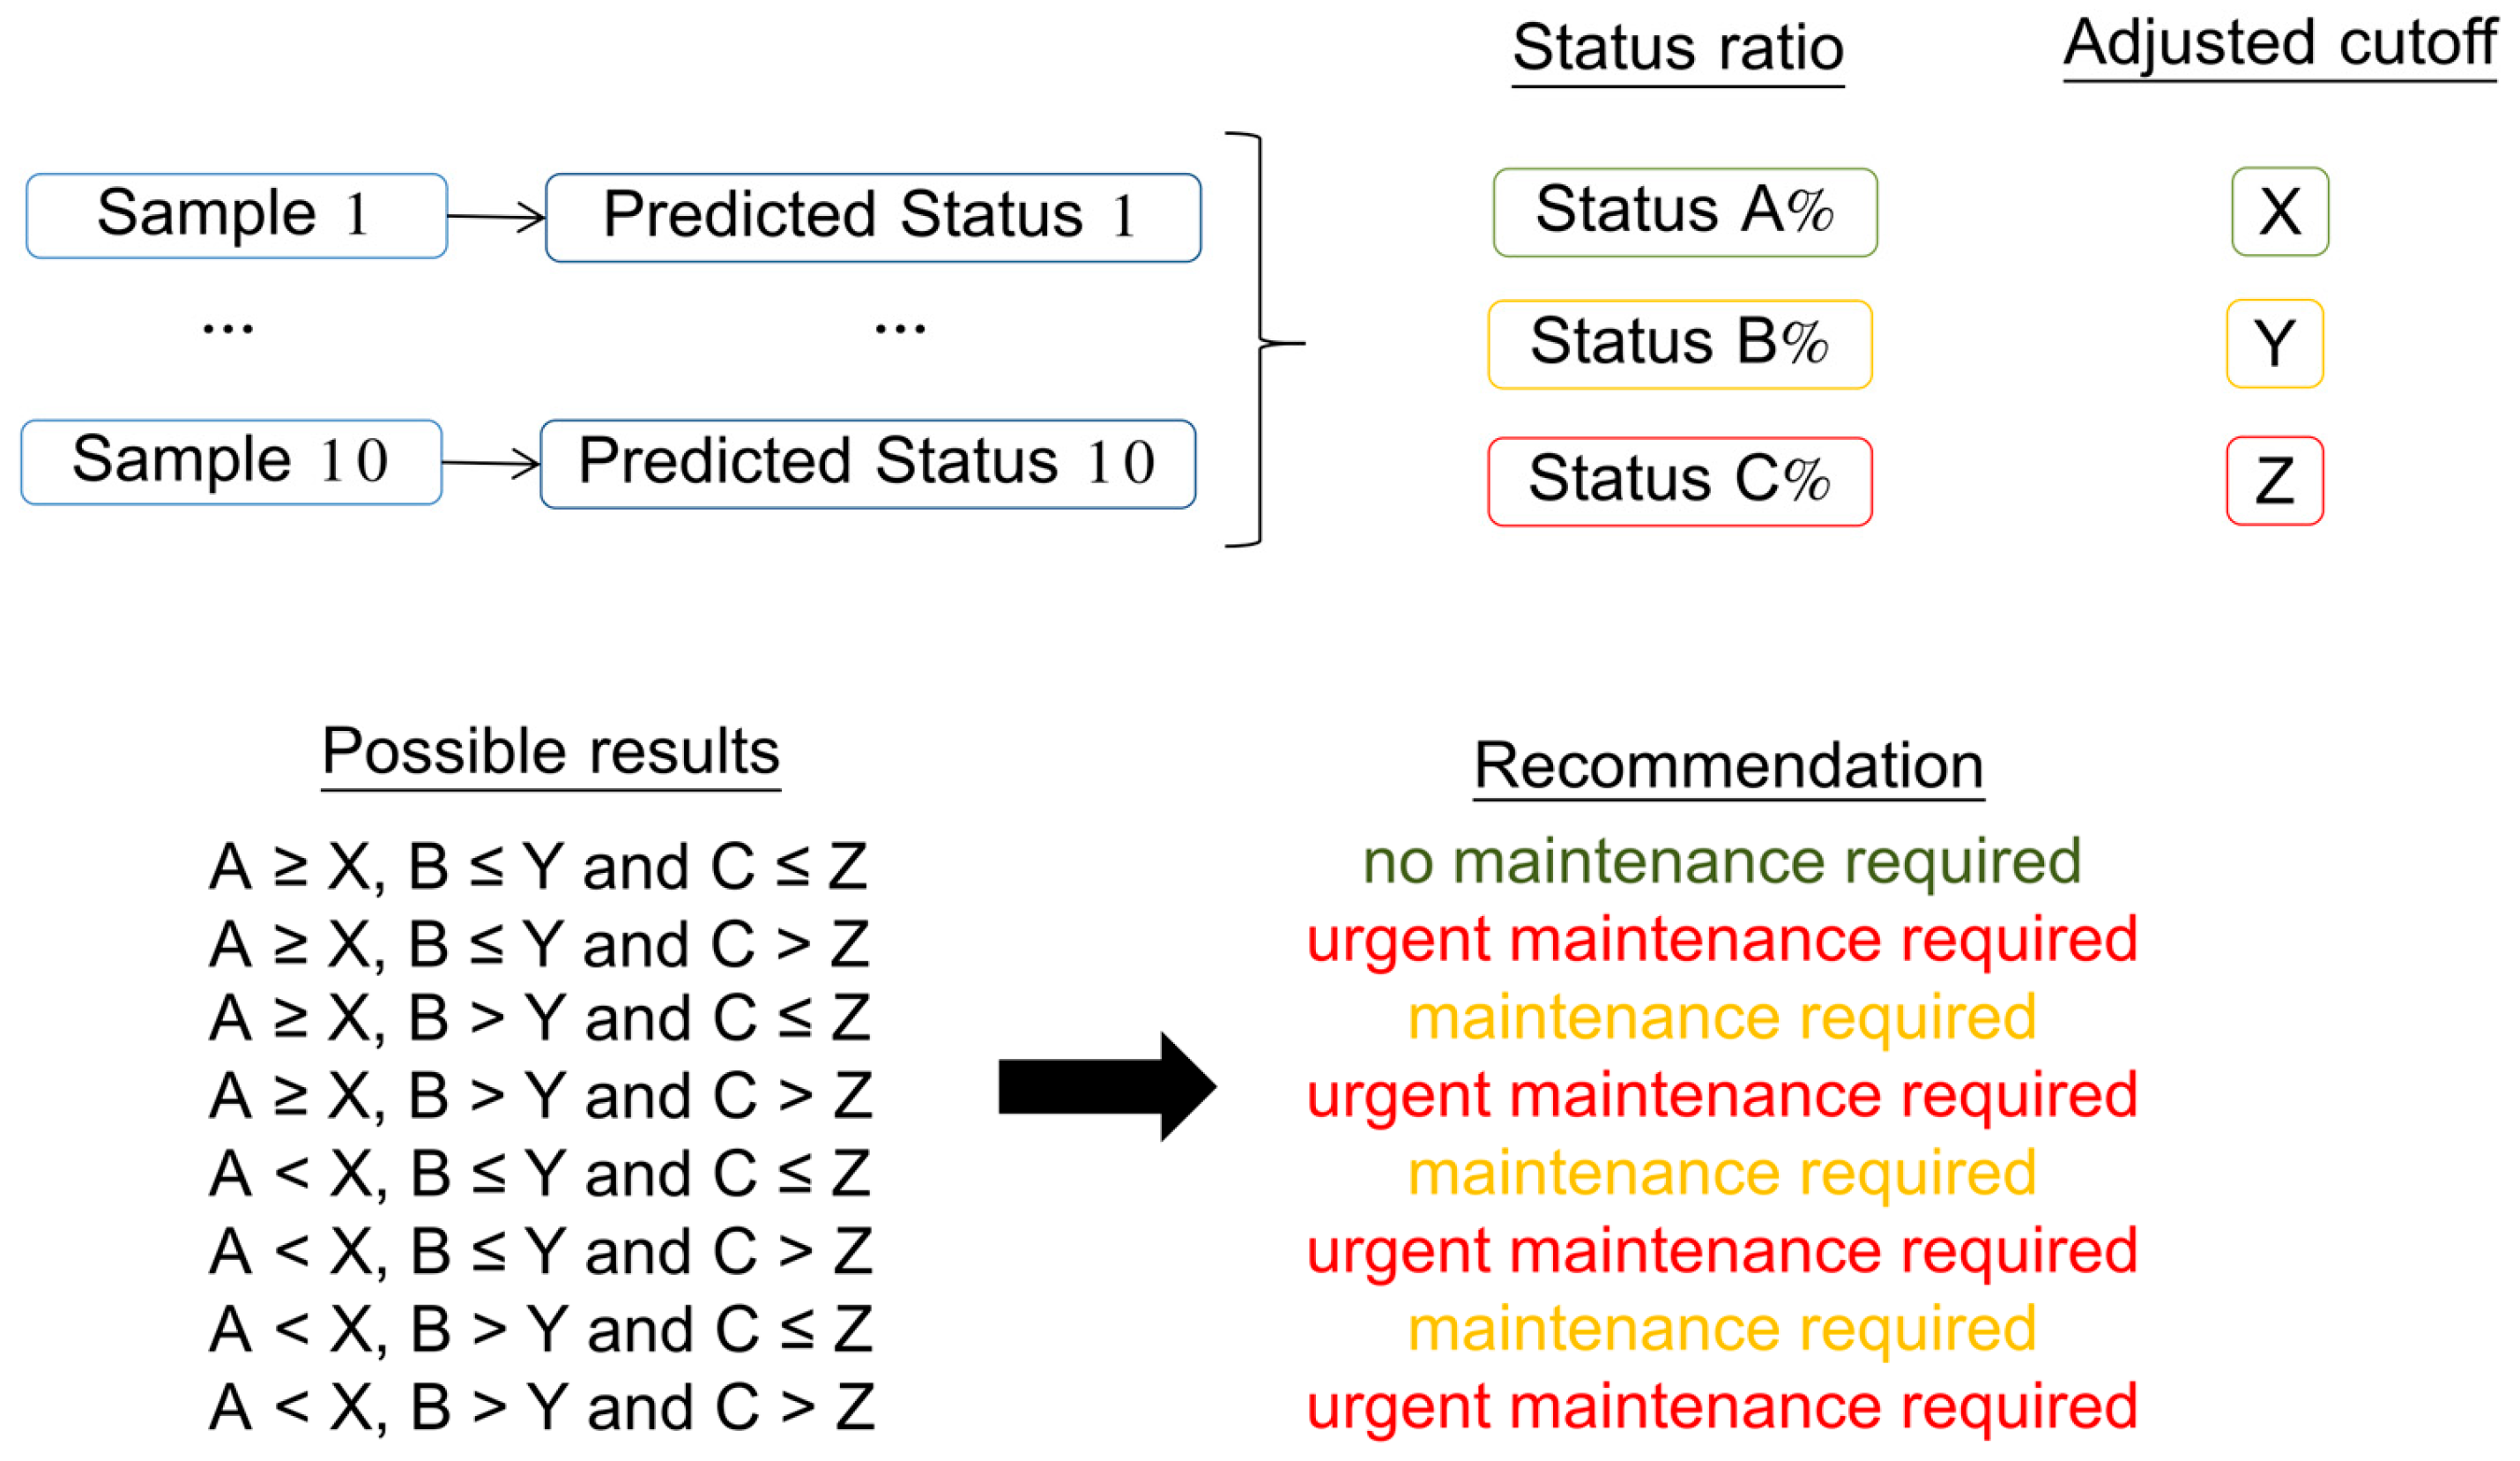
4.3. Harvester Maintenance Prediction Tool

The finished model is available for download and use at https://github.com/AlmeidaRO/ML_Tools (accessed on 29 January 2025). For ease of use by the average user, a remotely accessible web application (Figure 3) based on Streamlit is also available in the GitHub source [73]. Data science and machine learning are the main applications of Streamlit, a Python-based framework for building web applications. It allows users to easily and quickly build web applications using Python scripts [74].
To use the application, the user is required to input 10 data samples of each feature (battery potential, ECU temperature, fuel rate, intake manifold pressure, oil temperature, and oil pressure) and enter these values into the corresponding fields (periods) to calculate the total amount of maintenance status (status ratio). The user is then required to set a value (percentage) for minimum status A (no maintenance required), maximum status B (maintenance required), and maximum status C (urgent maintenance required) in the adjustable cut-off point section, thereby adjusting the maintenance requirement to the user’s desired specifications (Figure 4).

5. Conclusions

The use of machine learning methods to predict the mechanical maintenance status of harvesters showed satisfactory results, successfully achieving the objective of developing an accurate model for this prediction.
The anomaly detection analysis is critical for generating the mechanical status feature that enables modeling for data classification. Although combination models perform well, the Random Forest model performs better in the default mode.
The generated model enables the creation of a harvester maintenance prediction tool, with an interactive dashboard that provides a quick view of mechanical status to help forest managers make informed decisions.
Although the model created to predict harvester maintenance shows satisfactory results, some limitations of this study should be considered. Other datasets from other forest companies and other mechanized harvesting systems were not tested and could be useful in developing new powerful models to accurately predict harvester maintenance using machine learning.
It is recommended that further research be conducted to evaluate and compare the effectiveness of the harvester maintenance prediction tool with the methods currently used by forest companies. In addition, consideration should be given to incorporating additional sensor data or extending the tool’s predictive capabilities to other aspects of harvester performance to better predict harvester maintenance.

Supplementary Materials

The following supporting information can be downloaded at https://www.mdpi.com/article/10.3390/agriengineering7040097/s1. Table S1: Process of identifying irregularities (anomaly data) in the initial dataset; Figure S1: Data profiling based on classes for the features; Table S2: Main information of the mechanical features dataset: min, mean, max, standard deviation, and variation, by class, amber warning lamp, red stop lamp, and anomaly features; Table S3: Feature information procedure used on the mechanical features dataset; Table S4: Number of instances present in the initial, training, and balanced test datasets; Table S5: Models’ predictive performance (in default mode) on test and train datasets; Table S6: Hyperparameter optimization with the Optuna framework; Table S7: Prediction performed by the default Random Forest model on the test dataset.

Author Contributions

Conceptualization, D.S., R.B.G.d.S. and R.O.A.; Investigation, R.B.G.d.S. and R.O.A.; Methodology, D.S., R.B.G.d.S. and R.O.A.; Validation, D.S., R.B.G.d.S. and R.O.A.; Software, R.O.A.; Formal analysis, R.O.A. and D.S.; Data curation, D.S., R.B.G.d.S. and R.O.A.; Project administration, D.S.; Writing—original draft, R.B.G.d.S. and R.O.A.; Writing—review and editing, D.S., R.B.G.d.S. and R.O.A. All authors have read and agreed to the published version of the manuscript.

Funding

This research received no external funding.

Data Availability Statement

All the data are already provided in the main manuscript. Contact the corresponding author if further explanation is required.

Acknowledgments

The Conselho Nacional de Desenvolvimento Científico e Tecnológico (CNPq) supported this research.

Conflicts of Interest

The authors declare no conflicts of interest.

References

  1. Food and Agriculture Organization of the United Nations. Global Forest Resources Assessment 2020; FAO: Rome, Italy, 2020. [Google Scholar]
  2. Brazilian Institute of Geography and Statistics. Vegetal Extraction and Forestry Production; Brazilian Institute of Geography and Statistics: Rio de Janeiro, Brazil, 2023.
  3. Santana, J.S.; Valente, D.S.M.; Queiroz, D.M.; Coelho, A.L.F.; Barbosa, I.A.; Momin, A. Automated Detection of Young Eucalyptus Plants for Optimized Irrigation Management in Forest Plantations. AgriEngineering 2024, 6, 3752–3767. [Google Scholar] [CrossRef]
  4. ISO 6814:2009; International Standardization for Organization Machinery for Forestry—Mobile and Self-Propelled Machinery—Terms, Definitions and Classification. ISO: Geneva, Switzerland, 2009.
  5. Prinz, R.; Spinelli, R.; Magagnotti, N.; Routa, J.; Asikainen, A. Modifying the Settings of CTL Timber Harvesting Machines to Reduce Fuel Consumption and CO2 Emissions. J. Clean. Prod. 2018, 197, 208–217. [Google Scholar] [CrossRef]
  6. Shan, C.; Bi, H.; Watt, D.; Li, Y.; Strandgard, M.; Ghaffariyan, M.R. A New Model for Predicting the Total Tree Height for Stems Cut-to-Length by Harvesters in Pinus Radiata Plantations. J. For. Res. 2021, 32, 21–41. [Google Scholar] [CrossRef]
  7. Spinelli, R.; Conrado de Arruda Moura, A.; Manoel da Silva, P. Decreasing the Diesel Fuel Consumption and CO2 Emissions of Industrial In-Field Chipping Operations. J. Clean. Prod. 2018, 172, 2174–2181. [Google Scholar] [CrossRef]
  8. Liski, E.; Jounela, P.; Korpunen, H.; Sosa, A.; Lindroos, O.; Jylhä, P. Modeling the Productivity of Mechanized CTL Harvesting with Statistical Machine Learning Methods. Int. J. For. Eng. 2020, 31, 253–262. [Google Scholar] [CrossRef]
  9. Lundbäck, M.; Häggström, C.; Nordfjell, T. Worldwide Trends in Methods for Harvesting and Extracting Industrial Roundwood. Int. J. For. Eng. 2021, 32, 202–215. [Google Scholar] [CrossRef]
  10. Noordermeer, L.; Sørngård, E.; Astrup, R.; Næsset, E.; Gobakken, T. Coupling a Differential Global Navigation Satellite System to a Cut-to-Length Harvester Operating System Enables Precise Positioning of Harvested Trees. Int. J. For. Eng. 2021, 32, 119–127. [Google Scholar] [CrossRef]
  11. Olivera, A.; Visser, R. Using the Harvester On-Board Computer Capability to Move towards Precision Forestry. N. Z. J. For. Sci. 2016, 60, 3–7. [Google Scholar]
  12. Jankovský, M.; Merganič, J.; Allman, M.; Ferenčík, M.; Messingerová, V. The Cumulative Effects of Work-Related Factors Increase the Heart Rate of Cabin Field Machine Operators. Int. J. Ind. Ergon. 2018, 65, 173–178. [Google Scholar] [CrossRef]
  13. Felipe Maldaner, L.; de Paula Corrêdo, L.; Fernanda Canata, T.; Paulo Molin, J. Predicting the Sugarcane Yield in Real-Time by Harvester Engine Parameters and Machine Learning Approaches. Comput. Electron. Agric. 2021, 181, 105945. [Google Scholar] [CrossRef]
  14. Simões, D.; Fenner, P.T.; Esperancini, M.S.T. Produtividade e Custos do Feller-Buncher e Processador Florestal em Povoamento de Eucalipto de Primeiro Corte. Ciênc. Florest. 2014, 24, 621–630. [Google Scholar] [CrossRef]
  15. Paccola, J.E. Manutenção e Operação de Equipamentos Móveis; JAC: São José dos Campos, Brazil, 2017. [Google Scholar]
  16. Drożyner, P.; Mikołajczak, P. Maintenance of Vehicles, Machines and Equipment in View of the ISO9001 Requirements. Eksploat. Niezawodn. 2007, 4, 55–58. [Google Scholar]
  17. Clarotti, C.; Lannoy, A.; Odin, S.; Procaccia, H. Detection of Equipment Aging and Determination of the Efficiency of a Corrective Measure. Reliab. Eng. Syst. Saf. 2004, 84, 57–64. [Google Scholar] [CrossRef]
  18. Khodabakhshian, R. A Review of Maintenance Management of Tractors and Agricultural Machinery: Preventive Maintenance Systems. Agric. Eng. Int. CIGR J. 2013, 15, 147–159. [Google Scholar]
  19. Maktoubian, J.; Taskhiri, M.S.; Turner, P. Intelligent Predictive Maintenance (IPdM) in Forestry: A Review of Challenges and Opportunities. Forests 2021, 12, 1495. [Google Scholar] [CrossRef]
  20. Kemmerer, J.; Labelle, E.R. Using Harvester Data from On-Board Computers: A Review of Key Findings, Opportunities and Challenges. Eur. J. For. Res. 2021, 140, 1–17. [Google Scholar] [CrossRef]
  21. Strandgard, M.; Walsh, D.; Acuna, M. Estimating Harvester Productivity in Pinus Radiata Plantations Using Stanford Stem Files. Scand. J. For. Res. 2013, 28, 73–80. [Google Scholar] [CrossRef]
  22. Munis, R.A.; Almeida, R.O.; Camargo, D.A.; da Silva, R.B.G.; Wojciechowski, J.; Simões, D. Machine Learning Methods to Estimate Productivity of Harvesters: Mechanized Timber Harvesting in Brazil. Forests 2022, 13, 1068. [Google Scholar] [CrossRef]
  23. Munis, R.A.; Almeida, R.O.; Camargo, D.A.; da Silva, R.B.G.; Wojciechowski, J.; Simões, D. Tactical Forwarder Planning: A Data-Driven Approach for Timber Forwarding. Forests 2023, 14, 1782. [Google Scholar] [CrossRef]
  24. Almeida, R.O.; da Silva, R.B.G.; Simões, D. Cut-to-Length Harvesting Prediction Tool: Machine Learning Model Based on Harvest and Weather Features. Forests 2024, 15, 1398. [Google Scholar] [CrossRef]
  25. Leal, R.D.; da Silva, T.; Nicodemo, A.C.; Almeida, R.O.; Munis, R.A.; da Silva, R.B.G.; Simões, D. Harvesters’ Productivity Prediction in Brazilian Eucalyptus Plantations: Development of a Model from Machine Learning. Int. J. For. Eng. 2025, 36, 58–66. [Google Scholar] [CrossRef]
  26. Zonta, T.; da Costa, C.A.; da Rosa Righi, R.; de Lima, M.J.; da Trindade, E.S.; Li, G.P. Predictive Maintenance in the Industry 4.0: A Systematic Literature Review. Comput. Ind. Eng. 2020, 150, 106889. [Google Scholar] [CrossRef]
  27. Yan, J.; Wang, X. Unsupervised and Semi-Supervised Learning: The Next Frontier in Machine Learning for Plant Systems Biology. Plant J. 2022, 111, 1527–1538. [Google Scholar] [CrossRef]
  28. Quatrini, E.; Costantino, F.; Di Gravio, G.; Patriarca, R. Machine Learning for Anomaly Detection and Process Phase Classification to Improve Safety and Maintenance Activities. J. Manuf. Syst. 2020, 56, 117–132. [Google Scholar] [CrossRef]
  29. Ayvaz, S.; Alpay, K. Predictive Maintenance System for Production Lines in Manufacturing: A Machine Learning Approach Using IoT Data in Real-Time. Expert Syst. Appl. 2021, 173, 114598. [Google Scholar] [CrossRef]
  30. Mokhtari, S.; Abbaspour, A.; Yen, K.K.; Sargolzaei, A. A Machine Learning Approach for Anomaly Detection in Industrial Control Systems Based on Measurement Data. Electronics 2021, 10, 407. [Google Scholar] [CrossRef]
  31. Kumar, N.; Gangola, S.; Bhatt, P.; Jeena, N.; Khwairakpam, R. Soil Genesis, Survey and Classification. In Mycorrhizosphere and Pedogenesis; Varma, A., Choudhary, D.K., Eds.; Springer Singapore: Singapore, 2019; pp. 139–150. ISBN 978-981-13-6479-2. [Google Scholar]
  32. Momesso, L.; Crusciol, C.A.C.; Soratto, R.P.; Vyn, T.J.; Tanaka, K.S.; Costa, C.H.M.; Neto, J.F.; Cantarella, H. Impacts of Nitrogen Management on No-Till Maize Production Following Forage Cover Crops. Agron. J. 2019, 111, 639–649. [Google Scholar] [CrossRef]
  33. MacLeod, A.; Korycinska, A. Detailing Köppen–Geiger Climate Zones at Sub-National to Continental Scale: A Resource for Pest Risk Analysis. EPPO Bull. 2019, 49, 73–82. [Google Scholar] [CrossRef]
  34. Xavier, A.C.F.; Martins, L.L.; Rudke, A.P.; de Morais, M.V.B.; Martins, J.A.; Blain, G.C. Evaluation of Quantile Delta Mapping as a Bias-Correction Method in Maximum Rainfall Dataset from Downscaled Models in São Paulo State (Brazil). Int. J. Climatol. 2022, 42, 175–190. [Google Scholar] [CrossRef]
  35. Stephens, T. Gplearn: Genetic Programming in Python. with a Scikit-Learn Inspired API. Available online: https://github.com/trevorstephens/gplearn (accessed on 20 November 2024).
  36. Pedregosa, F.; Varoquaux, G.; Gramfort, A.; Michel, V.; Thirion, B.; Grisel, O.; Blondel, M.; Prettenhofer, P.; Weiss, R.; Dubourg, V.; et al. Scikit-Learn: Machine Learning in Python. J. Mach. Learn. Res. 2011, 12, 2825–2830. [Google Scholar]
  37. Akiba, T.; Sano, S.; Yanase, T.; Ohta, T.; Koyama, M. Optuna: A Next-Generation Hyperparameter Optimization Framework. In Proceedings of the KDD ’19: Proceedings of the 25th ACM SIGKDD International Conference on Knowledge Discovery & Data Mining, Anchorage, AK, USA, 4–8 August 2019; pp. 2623–2631. [Google Scholar] [CrossRef]
  38. Lundberg, S.M.; Lee, S.I. A Unified Approach to Interpreting Model Predictions. In Proceedings of the NIPS ’17: Proceedings of the 31st International Conference on Neural Information Processing Systems, Long Beach, CA, USA, 4–9 December 2017; pp. 4766–4775. [Google Scholar]
  39. Shi, M.; Xu, J.; Liu, S.; Xu, Z. Productivity-Based Land Suitability and Management Sensitivity Analysis: The Eucalyptus E. urophylla × E. grandis Case. Forests 2022, 13, 340. [Google Scholar] [CrossRef]
  40. Priyanka; Rajat; Avtar, R.; Malik, R.; Musthafa, M.; Rathore, V.S.; Kumar, P.; Singh, G. Forest Plantation Species Classification Using Full-Pol-Time-Averaged SAR Scattering Powers. Remote Sens. Appl. Soc. Environ. 2023, 29, 100924. [Google Scholar] [CrossRef]
  41. Shi, L.; Qin, Y.; Zhang, J.; Wang, Y.; Qiao, H.; Si, H. Multi-Class Classification of Agricultural Data Based on Random Forest and Feature Selection. J. Inf. Technol. Res. 2022, 15, 1–17. [Google Scholar] [CrossRef]
  42. Abioye, E.A.; Hensel, O.; Esau, T.J.; Elijah, O.; Abidin, M.S.Z.; Ayobami, A.S.; Yerima, O.; Nasirahmadi, A. Precision Irrigation Management Using Machine Learning and Digital Farming Solutions. AgriEngineering 2022, 4, 70–103. [Google Scholar] [CrossRef]
  43. Varani, M.; Mattetti, M.; Molari, G.; Biglia, A.; Comba, L. Correlation between Power Harrow Energy Demand and Tilled Soil Aggregate Dimensions. Biosyst. Eng. 2023, 225, 54–68. [Google Scholar] [CrossRef]
  44. Pitla, S.K.; Lin, N.; Shearer, S.A.; Luck, J.D. Use of Controller Area Network (CAN) Data To Determine Field Efficiencies of Agricultural Machinery. Appl. Eng. Agric. 2014, 30, 829–838. [Google Scholar] [CrossRef]
  45. Grzesiek, A.; Zimroz, R.; Śliwiński, P.; Gomolla, N.; Wyłomańska, A. A Method for Structure Breaking Point Detection in Engine Oil Pressure Data. Energies 2021, 14, 5496. [Google Scholar] [CrossRef]
  46. Lima, F.B.F.D.; Silva, M.A.D.; Silva, R.P.D. Quality of Mechanical Soybean Harvesting at Two Travel Speeds. Eng. Agrícola 2017, 37, 1171–1182. [Google Scholar] [CrossRef]
  47. Rostek, E.; Babiak, M.; Wróblewski, E. The Influence of Oil Pressure in the Engine Lubrication System on Friction Losses. Procedia Eng. 2017, 192, 771–776. [Google Scholar] [CrossRef]
  48. Wu, J.-D.; Huang, C.-K.; Chang, Y.-W.; Shiao, Y.-J. Fault Diagnosis for Internal Combustion Engines Using Intake Manifold Pressure and Artificial Neural Network. Expert Syst. Appl. 2010, 37, 949–958. [Google Scholar] [CrossRef]
  49. Wu, J.-D.; Huang, C.-K. An Engine Fault Diagnosis System Using Intake Manifold Pressure Signal and Wigner–Ville Distribution Technique. Expert Syst. Appl. 2011, 38, 536–544. [Google Scholar] [CrossRef]
  50. Maksum, H.; Purwanto, W. Pressure Analysis of the Ideal Intake Manifold with the Vibration Parameters at the Diesel Engine. J. Phys. Conf. Ser. 2019, 1317, 012109. [Google Scholar] [CrossRef]
  51. Kim, H.; Shon, J.; Lee, K. A Study of Fuel Economy and Exhaust Emission According to Engine Coolant and Oil Temperature. J. Therm. Sci. Technol. 2013, 8, 255–268. [Google Scholar] [CrossRef]
  52. Ponce-Bobadilla, A.V.; Schmitt, V.; Maier, C.S.; Mensing, S.; Stodtmann, S. Practical Guide to SHAP Analysis: Explaining Supervised Machine Learning Model Predictions in Drug Development. Clin. Transl. Sci. 2024, 17, e70056. [Google Scholar] [CrossRef]
  53. Xi, B.; Li, E.; Fissha, Y.; Zhou, J.; Segarra, P. LGBM-Based Modeling Scenarios to Compressive Strength of Recycled Aggregate Concrete with SHAP Analysis. Mech. Adv. Mater. Struct. 2024, 31, 5999–6014. [Google Scholar] [CrossRef]
  54. Basu, S.; Munafo, A.; Ben-Amor, A.; Roy, S.; Girard, P.; Terranova, N. Predicting Disease Activity in Patients with Multiple Sclerosis: An Explainable Machine-Learning Approach in the Mavenclad Trials. CPT Pharmacomet. Syst. Pharmacol. 2022, 11, 843–853. [Google Scholar] [CrossRef]
  55. Abdollahi, A.; Pradhan, B. Explainable Artificial Intelligence (XAI) for Interpreting the Contributing Factors Feed into the Wildfire Susceptibility Prediction Model. Sci. Total Environ. 2023, 879, 163004. [Google Scholar] [CrossRef]
  56. Bai, S.; Yuan, Y.; Niu, K.; Zhou, L.; Zhao, B.; Wei, L.; Liu, L.; Liu, Y.; Pang, Z.; Wang, F.; et al. Design and Implementation of the Remote Operation and Maintenance Platform for the Combine Harvester. Appl. Sci. 2022, 12, 7637. [Google Scholar] [CrossRef]
  57. Zhang, W.; Zhao, B.; Zhou, L.; Wang, J.; Niu, K.; Wang, F.; Wang, R. Research on Comprehensive Operation and Maintenance Based on the Fault Diagnosis System of Combine Harvester. Agriculture 2022, 12, 893. [Google Scholar] [CrossRef]
  58. Yang, L.; Ye, Z.; Lee, C.-G.; Yang, S.; Peng, R. A Two-Phase Preventive Maintenance Policy Considering Imperfect Repair and Postponed Replacement. Eur. J. Oper. Res. 2019, 274, 966–977. [Google Scholar] [CrossRef]
  59. Çınar, Z.M.; Abdussalam Nuhu, A.; Zeeshan, Q.; Korhan, O.; Asmael, M.; Safaei, B. Machine Learning in Predictive Maintenance towards Sustainable Smart Manufacturing in Industry 4.0. Sustainability 2020, 12, 8211. [Google Scholar] [CrossRef]
  60. Gerasimov, Y.; Seliverstov, A.; Syunev, V. Industrial Round-Wood Damage and Operational Efficiency Losses Associated with the Maintenance of a Single-Grip Harvester Head Model: A Case Study in Russia. Forests 2012, 3, 864–880. [Google Scholar] [CrossRef]
  61. Da Silva, C.A.G.; Rodrigues de Sá, J.L.; Menegatti, R. Diagnostic of Failure in Transmission System of Agriculture Tractors Using Predictive Maintenance Based Software. AgriEngineering 2019, 1, 132–144. [Google Scholar] [CrossRef]
  62. Afsharnia, F.; Marzban, A.; Asoodar, M.; Abdeshahi, A. Preventive Maintenance Optimization of Sugarcane Harvester Machine Based on FT-Bayesian Network Reliability. Int. J. Qual. Reliab. Manag. 2020, 38, 722–750. [Google Scholar] [CrossRef]
  63. Lopes, E.S.; de Oliveira, D.; Sampietro, J.A. Influence of Wheeled Types of a Skidder on Productivity and Cost of the Forest Harvesting. Floresta 2013, 44, 53–62. [Google Scholar] [CrossRef]
  64. Santos, L.N.d.; Fernandes, H.C.; Silva, R.M.F.; Silva, M.L.d.; Souza, A.P.d. Evaluation of Costs of Harvester in Cut and Processing of Eucalyptus Wood. Rev. Árvore 2017, 41, e410501. [Google Scholar] [CrossRef]
  65. Leite, E.d.S.; Fernandes, H.C.; Minette, L.J.; Leite, H.G.; Guedes, I.L. Modelagem Técnica e de Custos Do Harvester No Corte de Madeira de Eucalipto No Sistema de Toras Curtas. Sci. For. 2013, 41, 205–215. [Google Scholar]
  66. Fernandes, H.C.; Burla, E.R.; Da Silva Leite, E.; Minette, L.J. Avaliação Técnica e Econômica de um “Harvester” em Diferentes Condições de Terreno e Produtividade da Floresta. Sci. For. 2013, 41, 145–151. [Google Scholar]
  67. Fiedler, N.C.; Carmo, F.C.d.A.d.; Minette, L.J.; Souza, A.P.d. Operational Analysis of Mechanical Cut-to-Lenght Forest Harvesting System. Rev. Árvore 2017, 41, e410301. [Google Scholar] [CrossRef]
  68. Cavassin Diniz, C.C.; Da Silva Lopes, E.; De Magalhães Miranda, G.; Soares Koehler, H.; Kremer Custodio de Souza, E. Analysis of Indicators and Cost of World Class Maintenance (WCM) in Forest Machines. Floresta 2019, 49, 533. [Google Scholar] [CrossRef]
  69. Diniz, C.C.C.; Lopes, E.S.; Koehler, H.S.; Miranda, G.M.; Paccola, J. Comparative Analysis of Maintenance Models in Forest Machines. Floresta Ambient. 2020, 27, e20170994. [Google Scholar] [CrossRef]
  70. Cantú, R.P.; LeBel, L.; Gautam, S. A Context Specific Machine Replacement Model: A Case Study of Forest Harvesting Equipment. Int. J. For. Eng. 2017, 28, 124–133. [Google Scholar] [CrossRef]
  71. Bassoli, H.M.; Batistela, G.C.; Fenner, P.T.; Simões, D. Custo Anual Uniforme Equivalente de Máquinas de Colheita de Madeira: Uma Abordagem Estocástica. Pesqui. Florest. Bras. 2020, 40, 1–10. [Google Scholar] [CrossRef]
  72. Rodrigues, T.A.; Silva, M.L.d.; Fernandes, H.C.; Leite, E.d.S.; Schettini, B.L.S.; Silva, A.A.; Minette, L.J. The Optimal Replacement Time for Harvesters: An Economic Analysis. Rev. Árvore 2024, 48, e4812. [Google Scholar] [CrossRef]
  73. Streamlit—A Faster Way to Build and Share Data Apps. Available online: https://streamlit.io (accessed on 1 November 2024).
  74. Lee, C.; Lin, J.; Prokop, A.; Gopalakrishnan, V.; Hanna, R.N.; Papa, E.; Freeman, A.; Patel, S.; Yu, W.; Huhn, M.; et al. StarGazer: A Hybrid Intelligence Platform for Drug Target Prioritization and Digital Drug Repositioning Using Streamlit. Front. Genet. 2022, 13, 868015. [Google Scholar] [CrossRef]
Figure 1. Flowchart illustrating the steps taken to develop the model for predicting harvester maintenance in harvesting operations.
Agriengineering 07 00097 g001
Figure 2. SHAP dependency analysis of the mechanical harvester features: (a) effect of each feature (SHAP value) on model results and (b) effect of feature values on model results.
Agriengineering 07 00097 g002
Figure 3. Harvester Maintenance Predictor, an easy-to-use online tool.
Agriengineering 07 00097 g003
Figure 4. Possible recommendations from the Harvester Maintenance Predictor.
Agriengineering 07 00097 g004
Table 1. Unsupervised algorithms for anomaly detection analysis supplied by the scikit-learn package in Python v. 3.8.
DescriptionModel
Used with a linear complexity in the number of samples to approximate the solution of a kernelized One-Class SVM.One-Class SVM
Uses the same technique as the One-Class SVM, but adds stochastic gradient descent.SGD One-Class SVM
Fits a robust estimate of covariance to the data by discarding points outside the central mode and fitting an ellipse to the core data points.Elliptic Envelope
“Isolates” observations by randomly splitting values and performing recursive partitioning. The path length, a measure of normality in the decision function, is determined by the number of splits needed to isolate a sample.Isolation Forest
Determines the degree of outlierness of the data by computing a score known as the local outlier factor. It calculates a data point’s local density deviance in relation to its neighbors.Local Outlier Factor
Table 2. Generation of a mechanical status feature, based on the features amber warning lamp, red stop lamp, and anomaly. Class A—no maintenance required; Class B—maintenance required; Class C—urgent maintenance required.
Amber Warning LampRed Stop LampAnomalyInstancesClass
nonono8430A
yesnono3623B
noyesno19C
yesyesno7C
nonoyes65B
yesnoyes68A
noyesyes0A
yesyesyes0B
Table 3. Main categories of models that can be applied to classification analysis in supervised machine learning. Groups 1–8 were provided by the scikit-learn module in Python.
DescriptionModelGroup
A linear combination of the attributes is anticipated to be the target value.Linear Methods1
Classifiers that have closed-form solutions that are easy to compute, are inherently multiclass, and have no hyperparameters to tune.Discriminant Analysis2
The decision function benefits from using a subset of training points in high-dimensional spaces. The choice of kernel function is likewise open to the individual.SVM3
Known as nonparametric and non-generalizing machine learning techniques, the Euclidean distance, or the separation between the new location and the samples under study, serves as the foundation for the prediction.K nearest Neighbors4
Algorithms that use the Bayes theorem with the “naive” presumption that, given the value of the class variable, each pair of characteristics is conditionally independent.Naive Bayes5
A nonparametric supervised approach that learns decision rules to forecast a target feature’s value.Decision Tree6
The generality and ruggedness of the final model can be improved via a single estimator by combining the outputs of many estimators through a learning process.Ensemble7
One or more nonlinear (hidden) layers that may train and run nonlinear models in real time may be included in the input and output layers.Artificial Neural Network8
Table 4. Performance by group of algorithms, analyzing the mean between the training and test datasets through the metrics F1-score (F1), Recall (Rec), Precision (Prec), Accuracy (Acc), and Matthews Correlation Coefficient (MCC).
GroupF1RecPrecAccMCC
Linear Methods0.520.570.640.570.37
Discriminant Analysis0.740.760.760.740.63
SVM0.520.610.650.570.42
K Nearest Neighbors0.740.760.770.730.63
Naive Bayes0.500.580.680.600.42
Decision Tree0.900.900.900.900.86
Ensemble0.800.810.810.800.71
Artificial Neural Network0.690.730.770.700.61
Table 5. Best models for each model group, analyzing the mean between the training and test datasets through the metrics F1-score (F1), recall (Rec), precision (Prec), accuracy (Acc), and Matthews Correlation Coefficient (MCC).
GroupModelF1RecPrecAccMCC
1Ridge0.750.760.760.750.64
2Linear Discriminant Analysis0.750.760.760.740.63
3SVM rbf Kernel0.560.650.680.600.49
4K Nearest Neighbors0.760.790.820.760.69
5Multinomial Naive Bayes0.720.730.740.720.59
6CART0.900.900.900.900.86
7Random Forest0.930.930.930.930.90
8Multilayer Perceptron with 2 Layers0.720.750.780.720.63
Table 6. Performance of default models and combined models using F1-score (F1), recall (Rec), precision (Prec), accuracy (Acc), and Matthews Correlation Coefficient (MCC) metrics.
F1RecPrecAccMCCModeMeta LearningFinal Model
0.933 0.933 0.933 0.933 0.900 DefaultNot applicableRandom Forest
0.905 0.905 0.905 0.905 0.857 DefaultNot applicableCART
0.923 0.923 0.928 0.923 0.888 VotingNot applicableCART × Random Forest
0.927 0.928 0.934 0.928 0.896 StackingNearest NeighborsCART × Random Forest
0.928 0.929 0.934 0.929 0.896 StackingRandom ForestCART × Random Forest
0.927 0.928 0.934 0.928 0.896 StackingRandom ForestRandom Forest × CART
0.927 0.928 0.933 0.928 0.896 StackingLogistic RegressionRandom Forest × CART
0.927 0.928 0.933 0.928 0.896 StackingNearest NeighborsRandom Forest × CART
0.926 0.928 0.933 0.928 0.895 StackingLogistic RegressionCART × Random Forest
Disclaimer/Publisher’s Note: The statements, opinions and data contained in all publications are solely those of the individual author(s) and contributor(s) and not of MDPI and/or the editor(s). MDPI and/or the editor(s) disclaim responsibility for any injury to people or property resulting from any ideas, methods, instructions or products referred to in the content.

