Article

Circularity Between Aquaponics and Anaerobic Digestion for Energy Generation

by
Juliana Lobo Paes
1,2,*,
Cirlene Gomes Guimarães
1,
Alexia de Sousa Gomes
2,
Romulo Cardoso Valadão
2,
Daiane Cecchin
1,3 and
Regina Menino
4
1
Graduate Program in Digital Agroenergy, Federal University of Tocantins (UFT), Palmas Campus, Palmas 77001-090, Brazil
2
Department of Engineering, Federal Rural University of Rio de Janeiro (UFRRJ), Seropédica 23890-000, Brazil
3
Department of Agricultural Engineering and Environment, Federal Fluminense University, Niterói 24220-900, Brazil
4
National Institute for Agrarian and Veterinary Research, I.P.-UEIS-SAFSV INIAV, 2780-157 Oeiras, Portugal
*
Author to whom correspondence should be addressed.
AgriEngineering 2025, 7(5), 129; https://doi.org/10.3390/agriengineering7050129
Submission received: 16 February 2025 / Revised: 6 April 2025 / Accepted: 14 April 2025 / Published: 23 April 2025

Abstract

:
Aquaponics integrates aquaculture and hydroponics, promoting circularity through the recirculation of water and nutrients. However, waste management remains a challenge. This study aimed to evaluate the anaerobic digestion (AD) of aquaponic effluent (AE) combined with cattle manure (CM) for biogas production. An Indian model biodigester was fed with AE, CM and 1:1, 1:3, and 3:1 W (Water):CM, under anaerobic mono-digestion (MoAD) and 1:1, 1:3, and 3:1 AE:CM under anaerobic co-digestion (CoAD) conditions. The chemical characteristics of the substrates and digestates were assessed, as well as the potential for biogas production over 19 weeks. Overall, CoAD provided better results regarding the chemical characterization of the substrates aimed at biogas production. Notably, the 1:3 AE:CM ratio resulted in the most promising outcomes among the tested conditions. This ratio demonstrated higher efficiency, initiating biogas production by the third week and reaching the highest accumulated volume. It is probable that AE increased the dissolved organic load, optimizing the conversion of organic matter and eliminating the need for additional water in the process. Thus, the CoAD of AE and CM emerged as a promising alternative for waste valorization in aquaponics, contributing to renewable energy generation, agricultural sustainability, and the promotion of the circular economy.

Graphical Abstract

1. Introduction

With global population growth projections and increasingly evident environmental challenges, the search for innovative and sustainable methods that contribute to food security while ensuring sustainability has become a priority. The aquaponic system, which integrates aquaculture with hydroponics, aims to improve traditional food production systems by reconciling economic efficiency, reducing ecosystem impacts, and expanding social benefits while promoting circularity in production [1,2,3,4,5]. However, as in any production chain, waste generation occurs, which must be properly managed. Waste from aquaponic systems originates from the post-filtration process, where uneaten feed, fish fecal matter, and unintended fish mortality during cultivation are retained as suspended solids. This waste must be removed to prevent water quality deterioration and, consequently, system collapse [6,7,8,9]. Improper disposal of this effluent results in organic matter decomposition, contaminating water resources, soil, and air and releasing greenhouse gases. Therefore, adequate waste management is necessary. This can be effectively achieved through anaerobic digestion (AD). This approach enables the design of zero-waste systems using simple solutions such as zero-waste eco-industrial food parks [10,11,12].
AD is a well-established technology that can be incorporated into production chains generating organic waste with high energy potential, ensuring circularity. This process aims to produce clean and renewable energy in the form of biogas along with organic fertilizers [13,14,15,16]. Biogas can be utilized for simultaneous electricity and heat generation, offering a promising perspective for decentralized energy systems [17,18,19]. Additionally, AD has demonstrated efficiency in mitigating the risks associated with uncontrolled greenhouse gas emissions, contributing to pollution reduction and promoting the reuse of environmental liabilities [20].
Over the past decade, studies have increasingly reported promising results regarding the anaerobic digestion process of freshwater, brackish, and saline wastewater from Recirculating Aquaculture System (RAS), as well as residues from seafood processing [7,21,22]. However, limited research in the literature has shown promising results on the anaerobic digestion of waste derived from aquaponic systems, highlighting the need to investigate substrates and key parameters for its application as well as operational and process stability issues [8,9,11].
The Desert System is characterized by near-zero water and waste discharge and integrated aquaponic and anaerobic digestion technologies within a Recirculating Aquaculture System (RAS) [8,9]. This integrated approach enables the production of 0.75 kg of fish and 33.8 kg of fresh lettuce per kilogram of feed input per day, while achieving a 64% reduction in the system’s carbon footprint. Additionally, the system has demonstrated a CO2 sequestration rate 1.4 times higher than the carbon input from the feed, further contributing to its environmental sustainability [9].
The novel concept is of an aquaponics-centered eco-industrial food park, which integrates an anaerobic biodigester within the aquaponic system and generates 140 kWh using a Combined Heat and Power (CHP) engine. This energy can be utilized within the production chain to regulate the temperature of reactor influents and to offset heat losses from the reactor. In terms of pollutant emissions, this system can reduce carbon dioxide (CO2) emissions by 45 kg per day in the Netherlands, achieving a carbon footprint 6.7 times lower than that of a conventional aquaponic system [11].
Adopting off-grid systems contributes to energy independence and has the potential to expand access to productive processes for small-scale farmers in emerging economies. However, several technical and scientific challenges must be addressed to enable the widespread integration of anaerobic digestion into aquaponic production chains. These challenges include waste type selection, co-digestion applications, infrastructure availability, inhibitory conditions, digestate management, and substrate pre-treatment, all of which require further investigation to optimize implementation within sustainable food production systems [14,23,24].
Residues from RAS typically have a high water content, and the organic matter present may be insufficient to serve as the sole carbon source for the anaerobic digestion process. However, when used as a codigestant with waste rich in organic matter, it can be considered a viable alternative for biogas production [11,25]. In this case, the anaerobic co-digestion (CoAD) process is adopted, which involves the simultaneous digestion of two or more biodegradable wastes in the same biodigester with complementary and synergistic effects. This results in an improved nutrient balance, greater process stability, enhanced biotransformation efficiency, and increased biogas production [20,21,22,26].
Cattle manure is a widely available biomass waste that is abundant year-round and recognized for its significant energy potential [21,22,27,28,29,30]. As livestock production expands, the quantity of manure generated inevitably increases, posing a potential environmental pollution risk due to ammonia (NH3) and CH4 emissions from manure degradation [20,28]. Although it is extensively used in anaerobic digestion processes, its efficiency in anaerobic mono-digestion (MoAD) may be lower than in CoAD, depending on its initial characteristics [27,30,31].
Accordingly, this study investigated the anaerobic digestion processes of aquaponic effluent and cattle manure using both MoAD and CoAD in anaerobic biodigesters, with the objective of improving biogas production efficiency and advancing a sustainable strategy for the final disposal of these residues.

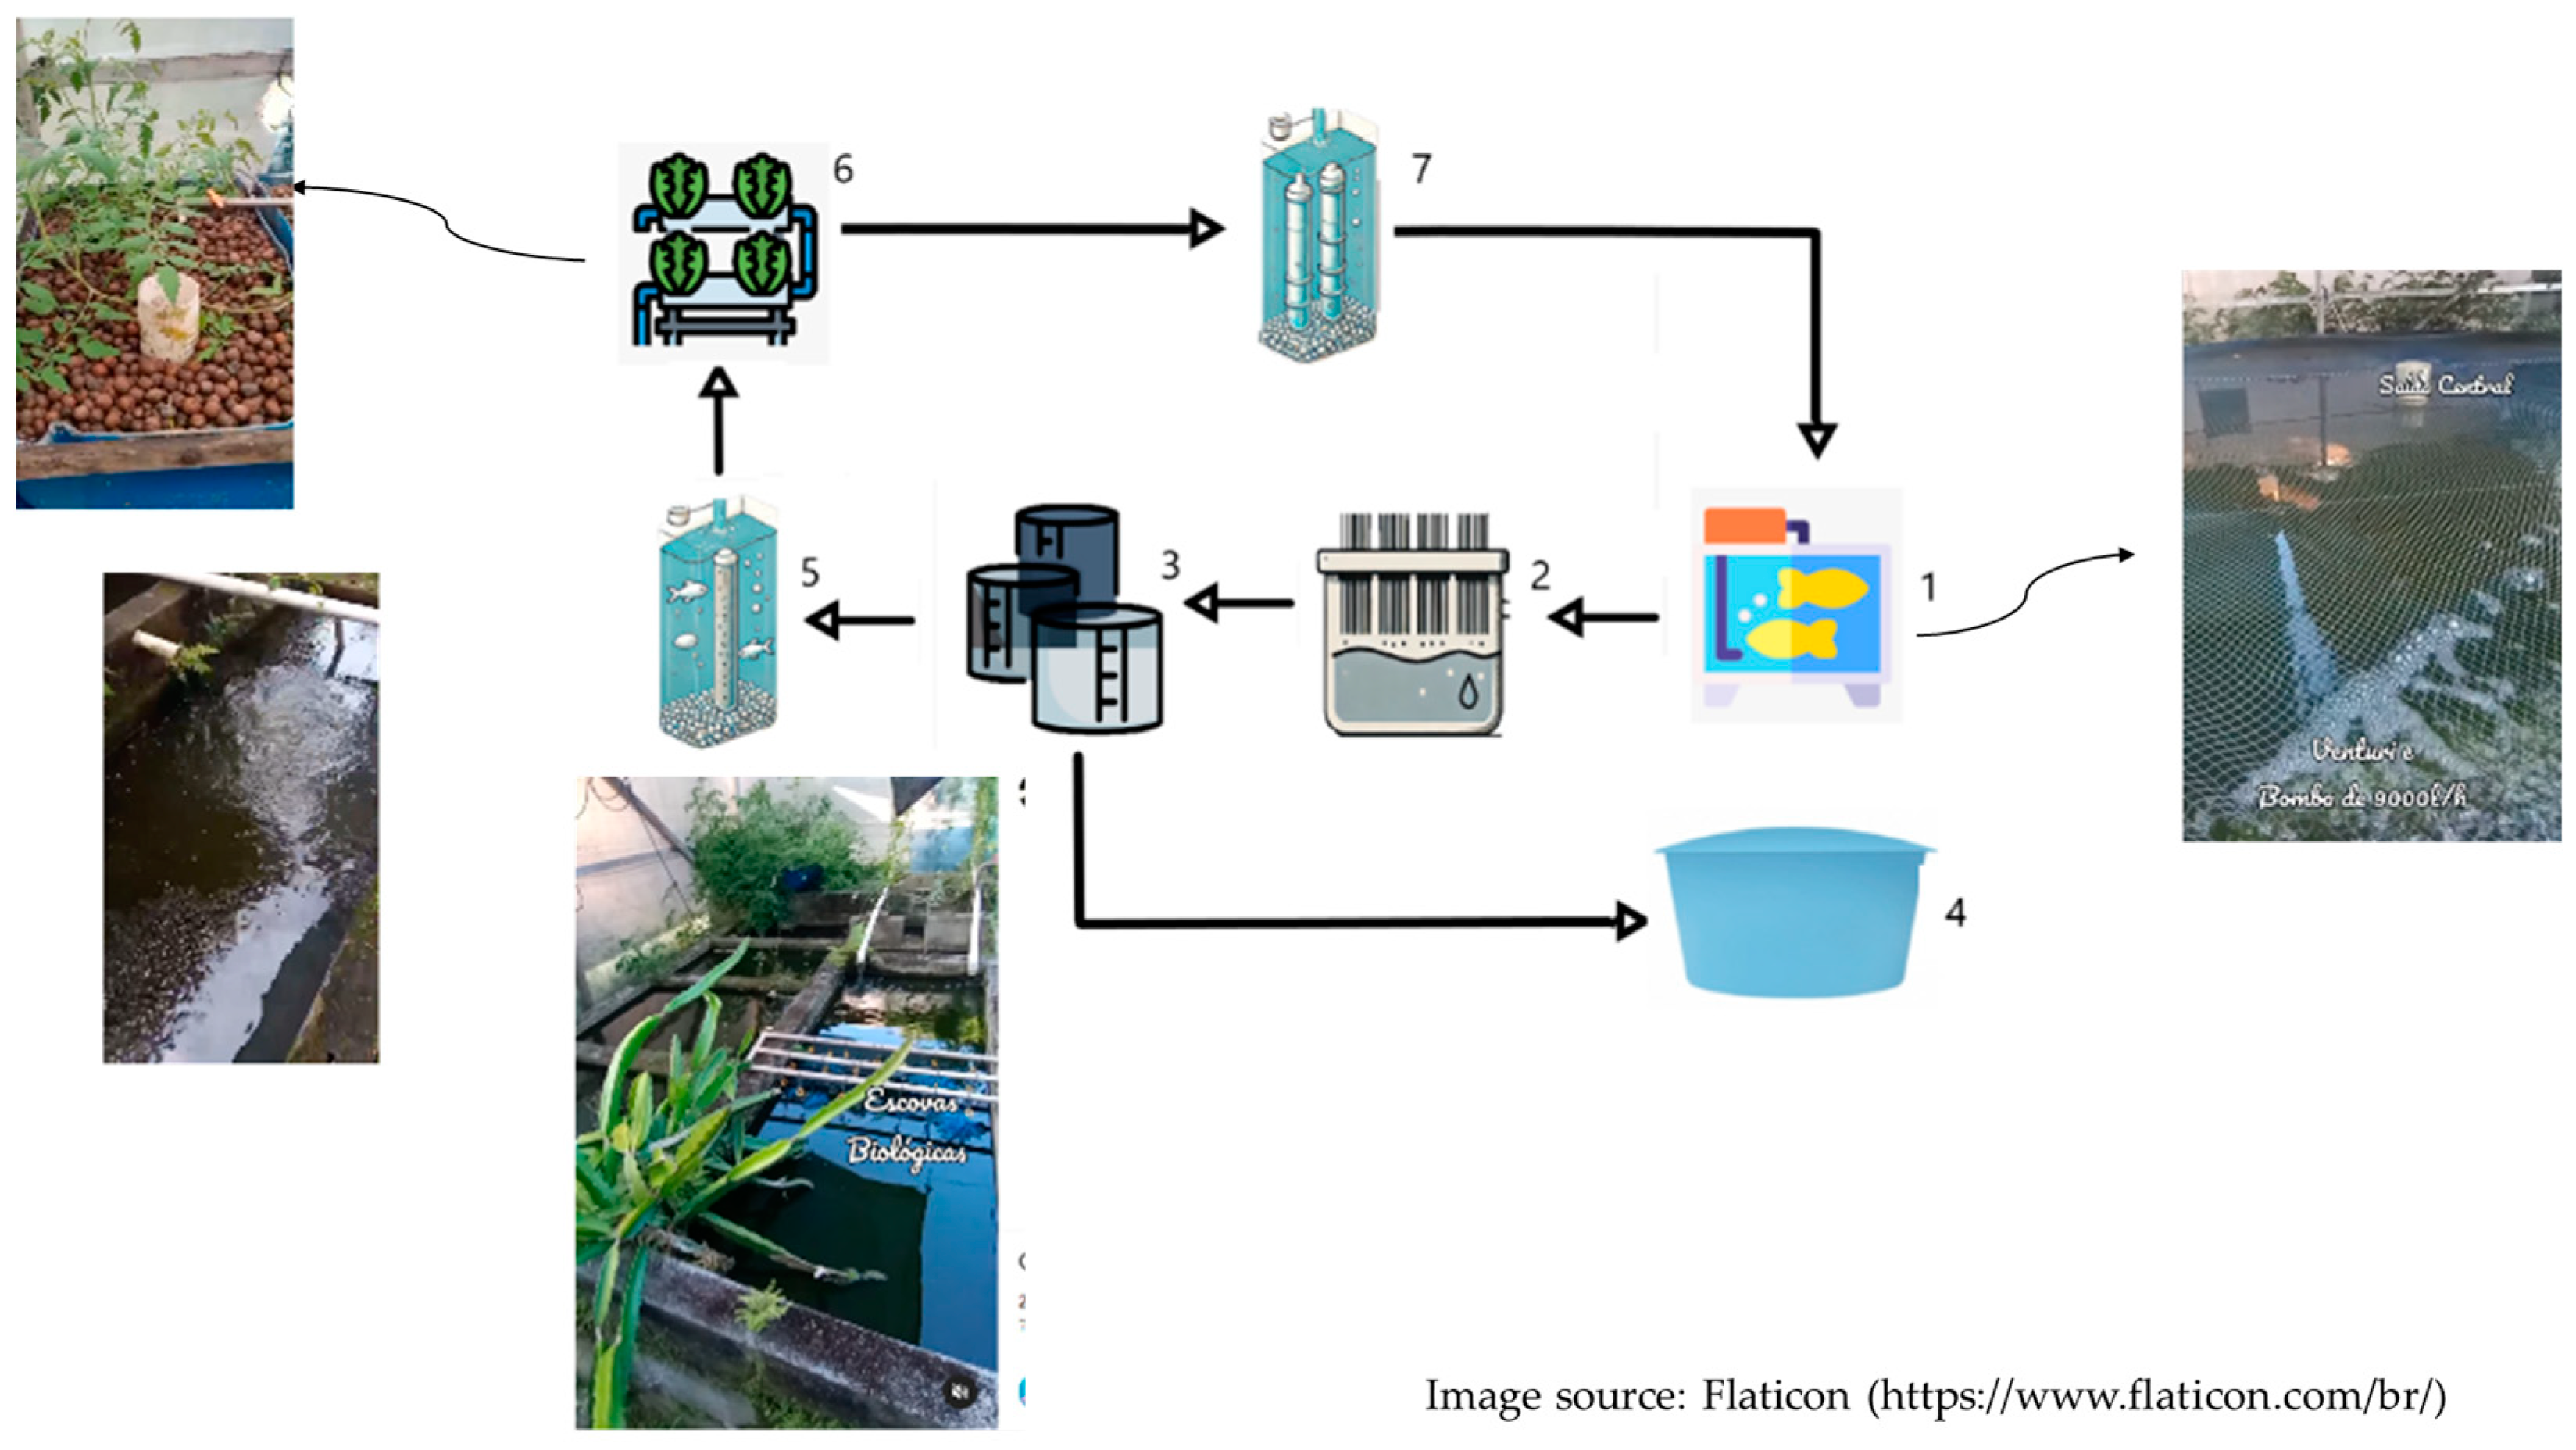
2. Materials and Methods

This study was conducted at the Rural Energy Efficiency Laboratory, linked to the Multi-User Research Laboratory of the Renewable and Alternative Rural Energy Group (LabGERAR), located at the Institute of Technology/Department of Engineering of the Federal Rural University of Rio de Janeiro (UFRRJ), Seropedica campus, Rio de Janeiro, Brazil.

2.1. Raw Materials Used in the Anaerobic Digestion Process

The raw materials used for anaerobic mono- and co-digestion consisted of cattle manure (CM) and aquaponics effluent (AE). The cattle manure was collected from the dairy cattle sector at UFRRJ, which operates under a conventional production system, feeding animals with a diet containing Tanzania grass (Panicum maximum), corn, soybean meal, and wheat bran.
The aquaponics effluent was obtained from a RAS installed on a partner farm of the Fishing Institute Foundation of the State of Rio de Janeiro (FIPERJ), located in Espraiado, Maricá–RJ, Brazil.
The RAS consisted of a 17,000 L fish farming tank, a mechanical filtration unit for removing suspended solids, a hydroponic unit, and an effluent discharge system (Figure 1).
In the fish farming tank, Nile tilapia (Oreochromis niloticus) were cultured and fed a commercial diet formulated for freshwater fish fingerlings. The nutritional composition of the feed included 360 g kg−1 of crude protein, a minimum of 80 g kg−1 of ether extract, 40 g kg−1 of crude fiber, 150 g kg−1 of ash, 20–30 g kg−1 of calcium, 10 g kg−1 of phosphorus, 100 g kg−1 of moisture, and 600 mg kg−1 of vitamin C. The tank was equipped with aerators and a central purge valve to facilitate the removal of excess water and sediments.
The excess water was directed from the central purge to a tank with biological brush filters responsible for capturing solid particles. Subsequently, the water passed through three sequential sedimentation tanks, where settleable solids were removed. The material accumulated at the bottom of these tanks, along with the wastewater, was transferred to a conditioning tank specifically for aquaponics effluent.
The treated water was directed to a tank containing additional aeration systems, biological media, and auxiliary fish, which assisted in the removal of remaining residues. Afterward, this treated water was sent to the hydroponic unit, where various vegetables and ornamental plants were cultivated. After the hydroponic process, the water passed through an additional aeration tank to remove remaining compounds and was then recirculated back to the fish farming tank, completing the recirculation cycle (Figure 1).

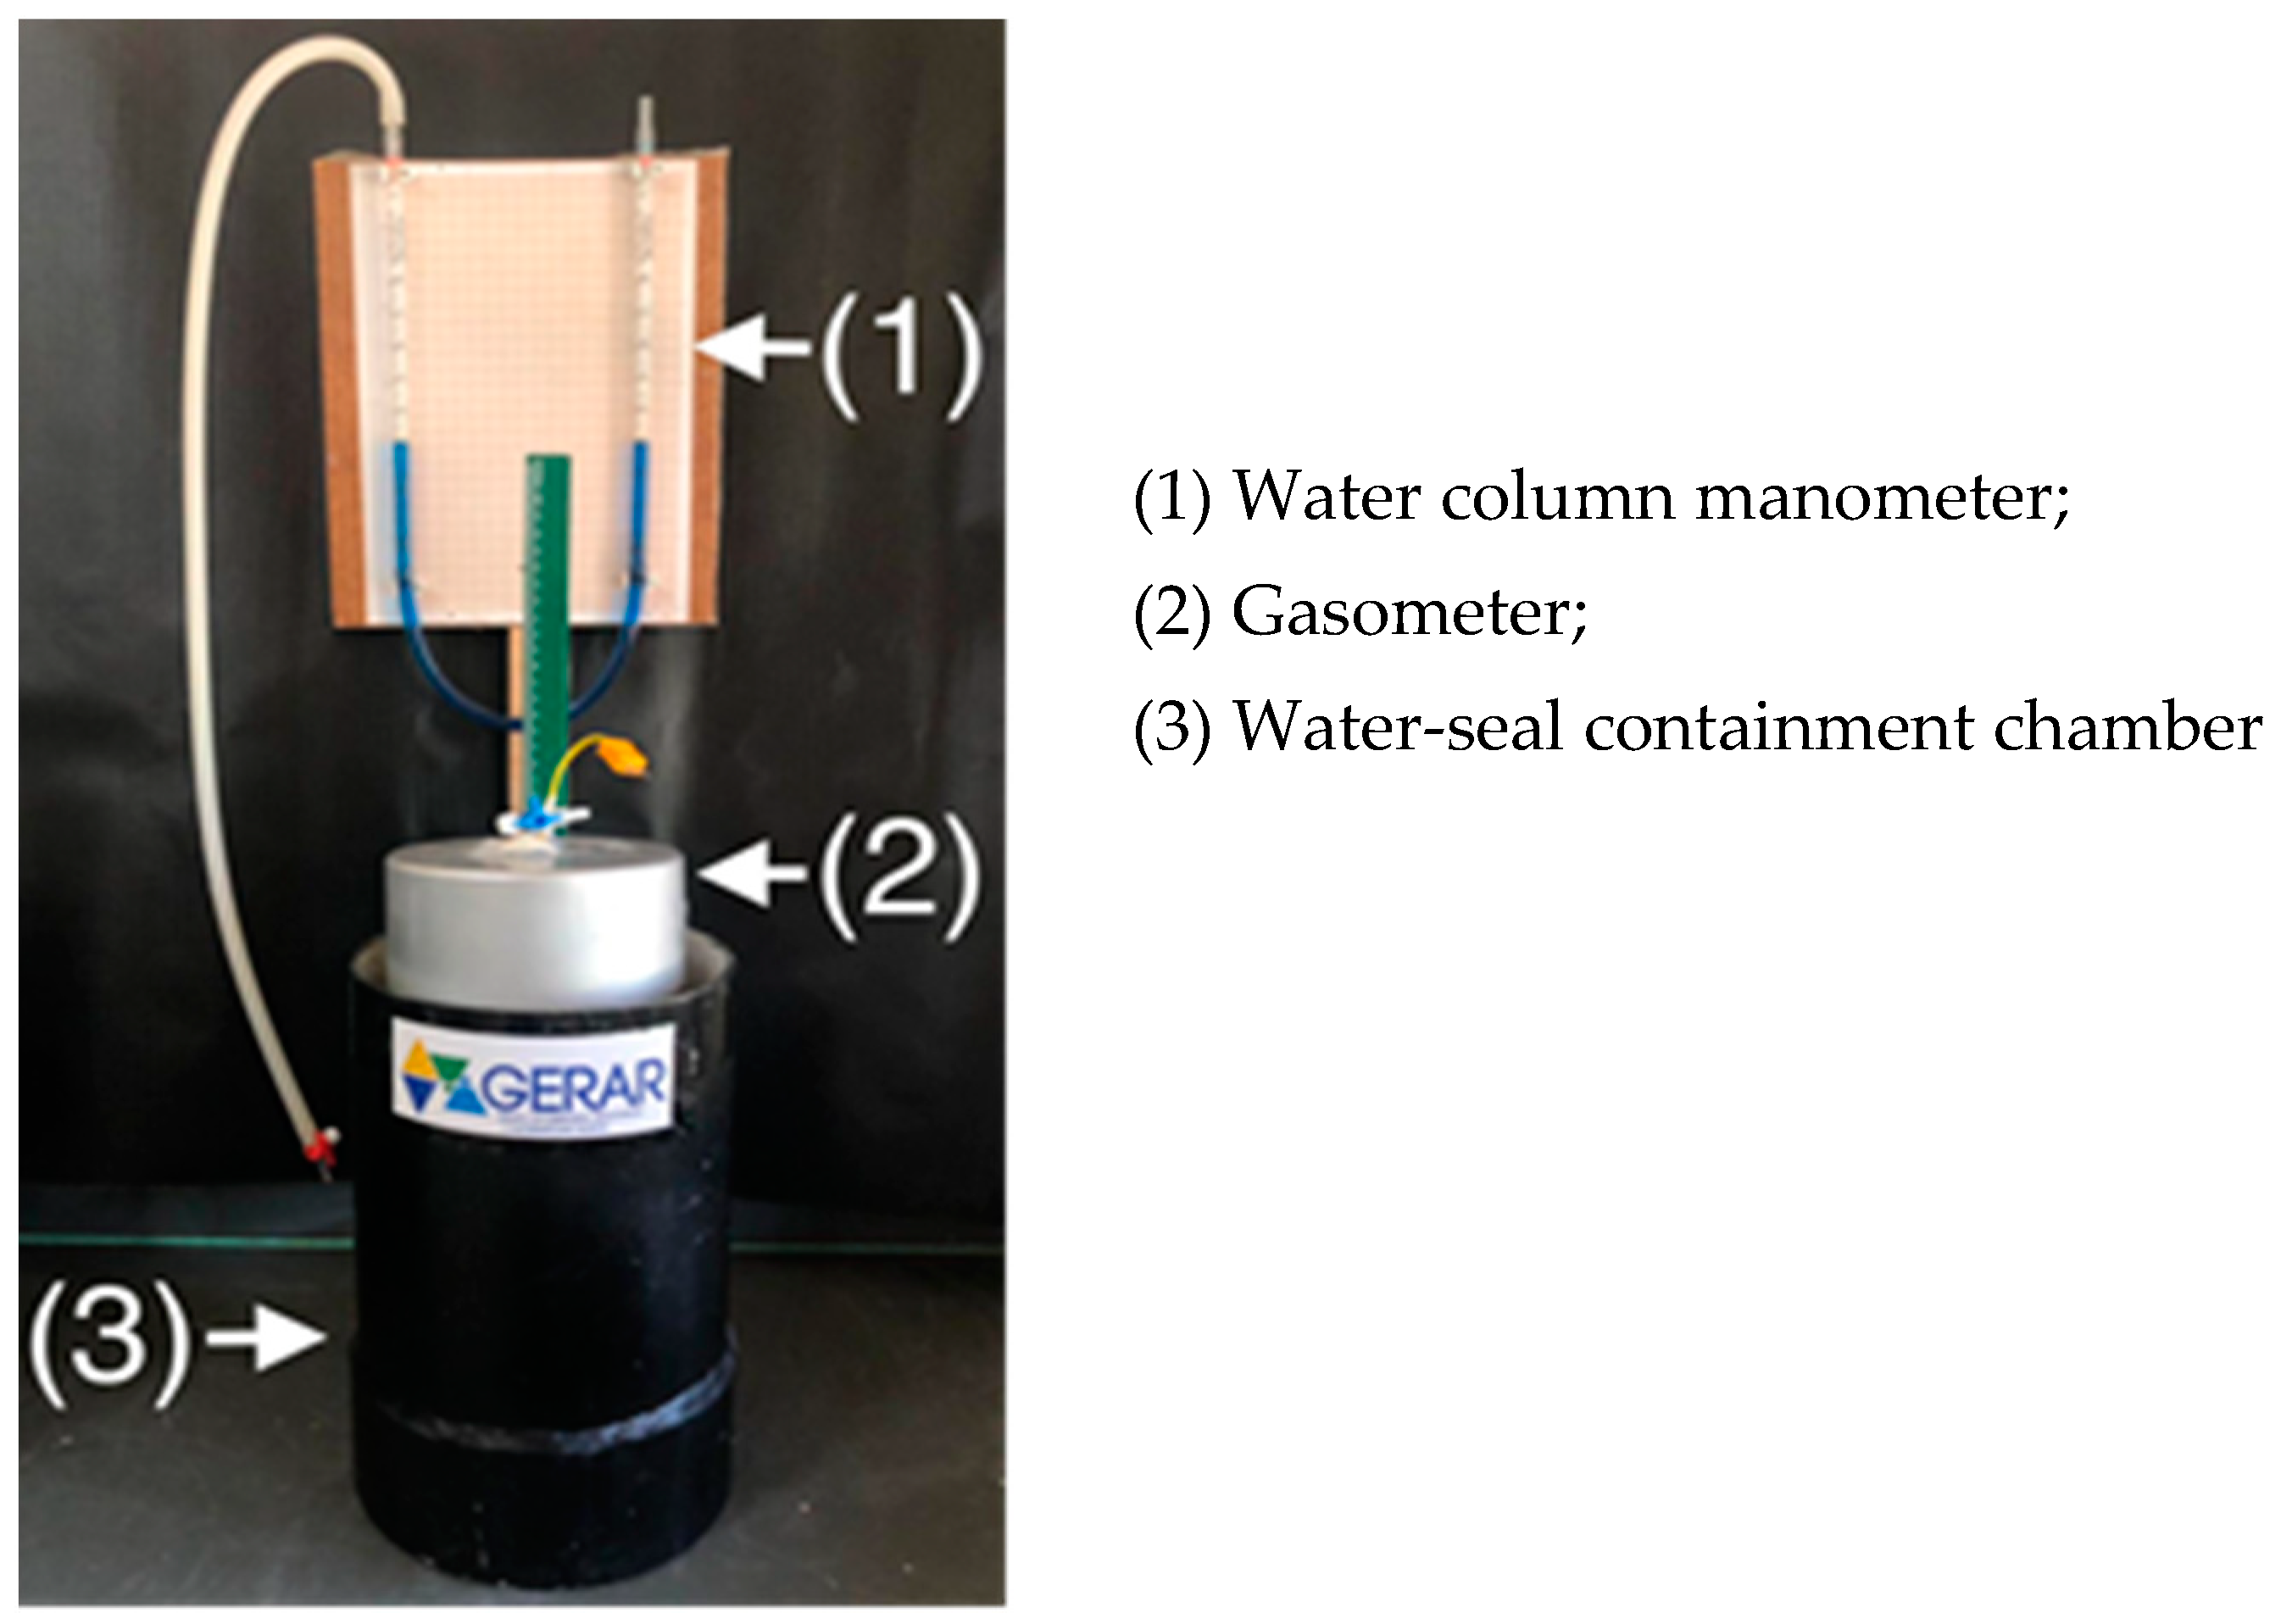
2.2. Anaerobic Biodigester

The anaerobic biodigester used in the experiment was based on the Indian model, consisting of a water-seal containment chamber, digestion chamber, gasometer, and U-tube manometer with water as the manometric liquid (Figure 2). The anaerobic biodigesters were placed on a workbench, at ambient temperature, protected from direct sunlight and rainfall. The digestion chamber was used to hold the substrate (S), while the gasometer stored the biogas produced [33].
The biodigesters were batch-fed, with a substrate capacity of 1.7 kg. The substrates consisted of AE, CM, and deionized water (W) in the following ratios: 1:1, 1:3, and 3:1 (W:CM) for MoAD, and 1:1, 1:3, and 3:1 (AE:CM) for CoAD.
The biodigesters were fed within 24 h of substrate collection to prevent uncontrolled early fermentation that could lead to biogas loss. Both substrates were collected fresh, homogenized, transferred to polyvinyl chloride containers, and stored in the laboratory. No pre-treatment was applied to the substrates, as the study aimed to assess whether the raw materials could be used directly in the process.

2.3. Biomass Characterization

The characterization of the substrate and digestate (D) included moisture content (MC), total solids (TS), volatile total solids (VTS), pH, electrical conductivity (EC), total alkalinity (TA), volatile fatty acids (VFA), chemical oxygen demand (COD), total nitrogen–nitrate (N-NO3), and total organic carbon (TOC).
The MC, TS, VTS, pH, EC, TA, and VFA were determined following the American Public Health Association (APHA) standard procedures [34]. COD and N-NO3 analyses were conducted using a DR3900 spectrophotometer (Hach, Loveland, CO, USA), with test kits supplied by Alfakit. TOC was determined according to the methodology proposed by Carmo & Silva [35].
The biodegradability (BD) was calculated based on the ratio between volatile solids and total solids, as well as the VFA/TA ratio. Analyses were performed in triplicate for each anaerobic biodigester.
The digestion temperature was monitored using a Digital Type K Thermocouple TM902C (Shenzhen Hongxin Hardware Co., Ltd., Shenzhen, China) connected to a millivoltmeter with ±0.1 °C precision. The sensor probe was fixed inside the gasometer, with the sensor tip immersed in the substrate at the midpoint of the digestion chamber.

2.4. Biogas Yield

The gas generated from the AD process in the anaerobic biodigester was analyzed in terms of temperature, weekly yield, a flame test, and composition. Data collection was conducted weekly at 10:00 AM on Wednesdays. After the measurements were completed, the gasometer was emptied using the biogas discharge valve (three-way valve) [33].
The volume produced, expressed in liters (L), was calculated as the product of the gasometer’s vertical displacement and its internal cross-sectional area, measured over 19 weeks. The volume was corrected to 273 K and 1.013 hPa, using the compressibility factor and the combined Boyle’s and Gay-Lussac’s laws for ideal gas behavior. The temperature was recorded using a Benetech GM1365 Humidity Temperature Data Logger Mete (Benetech, Guangzhou, China). For this, a 30 mL sample of biogas was collected from the gasometer using a syringe and injected into a thermally insulated glass container containing the datalogger. The pressure at the time of reading was obtained by summing the atmospheric pressure in Seropedica with the pressure measured on a mobile manometer attached to the gasometer. The mean pressure recorded on the manometers was measured in mm H2O and converted to kPa [33]. The atmospheric pressure in Seropedica during the experiment was obtained from Brazil’s National Institute of Meteorology (INMET) database [36], using the Automated Agricultural Ecology Meteorological Station located 2.73 km from UFRRJ.
The gas yield was calculated based on the weekly production and the amount of substrate added to the anaerobic biodigesters (1.7 kg). The cumulative biogas yield was obtained by summing the previous week’s production with that of the current week’s data collection. The values were expressed in liters of gas per kilogram of substrate (L kg−1) [33].

2.5. Flame Test

The flame test was performed after the measurements in the anaerobic biodigester were taken, during the gasometer emptying process via the discharge valve. To detect the presence of methane (CH4) in a sufficient concentration to sustain a flame, a torch was connected to the biogas outlet using a hose. The criterion adopted to confirm biogas production was a sustained flame on the torch after the ignition source was removed [33].
This simple and effective method allowed for a qualitative assessment of methane’s presence, demonstrating the combustibility of the produced biogas. The cumulative biogas yield (L kg−1) and biogas composition analysis were quantified after the presence of methane was confirmed by the flame test.

2.6. Biogas Composition Analysis

The composition of the biogas produced was analyzed using the Alfakit® Biogas Analysis Kit (Alfakit, Santa Catarina, Brazil), quantifying: methane (%) and carbon dioxide (%) by Orsat’s volumetric method, ammonia (ppmv) by the indophenol blue colorimetric method, and hydrogen sulfide (H2S-ppmv) by the methylene blue colorimetric method. This analytical method was developed by the Brazilian Agricultural Research Corporation (Embrapa, Brasília, Brazil) Swine and Poultry in partnership with the company Alfakit® LTDA [37].

2.7. Statistical Analysis

For the evaluation of the results of the MoAD and CoAD trials, a completely randomized design was adopted in an 8 × 2 factorial scheme, with eight treatment ratios (AE, CM, 1:1, 1:3, and 3:1 W:CM for MoAD and 1:1, 1:3, and 3:1 AE:CM for CoAD) and two analysis times (substrate and digestate). Each treatment was conducted in triplicate.
The characteristics of the S and D were analyzed using analysis of variance (ANOVA) followed by the Scott–Knott test at a 5% probability level, using the SISVAR® Statistical Software Version 5.8 Build 92 [38]. Temperature graphs (substrate and biogas) and weekly biogas yield profiles were generated using Microsoft® Excel® LTSC MSO, Version 2109 Build 16.0.14430.20292 (Microsoft, Redmond, WA, USA).

3. Results and Discussions

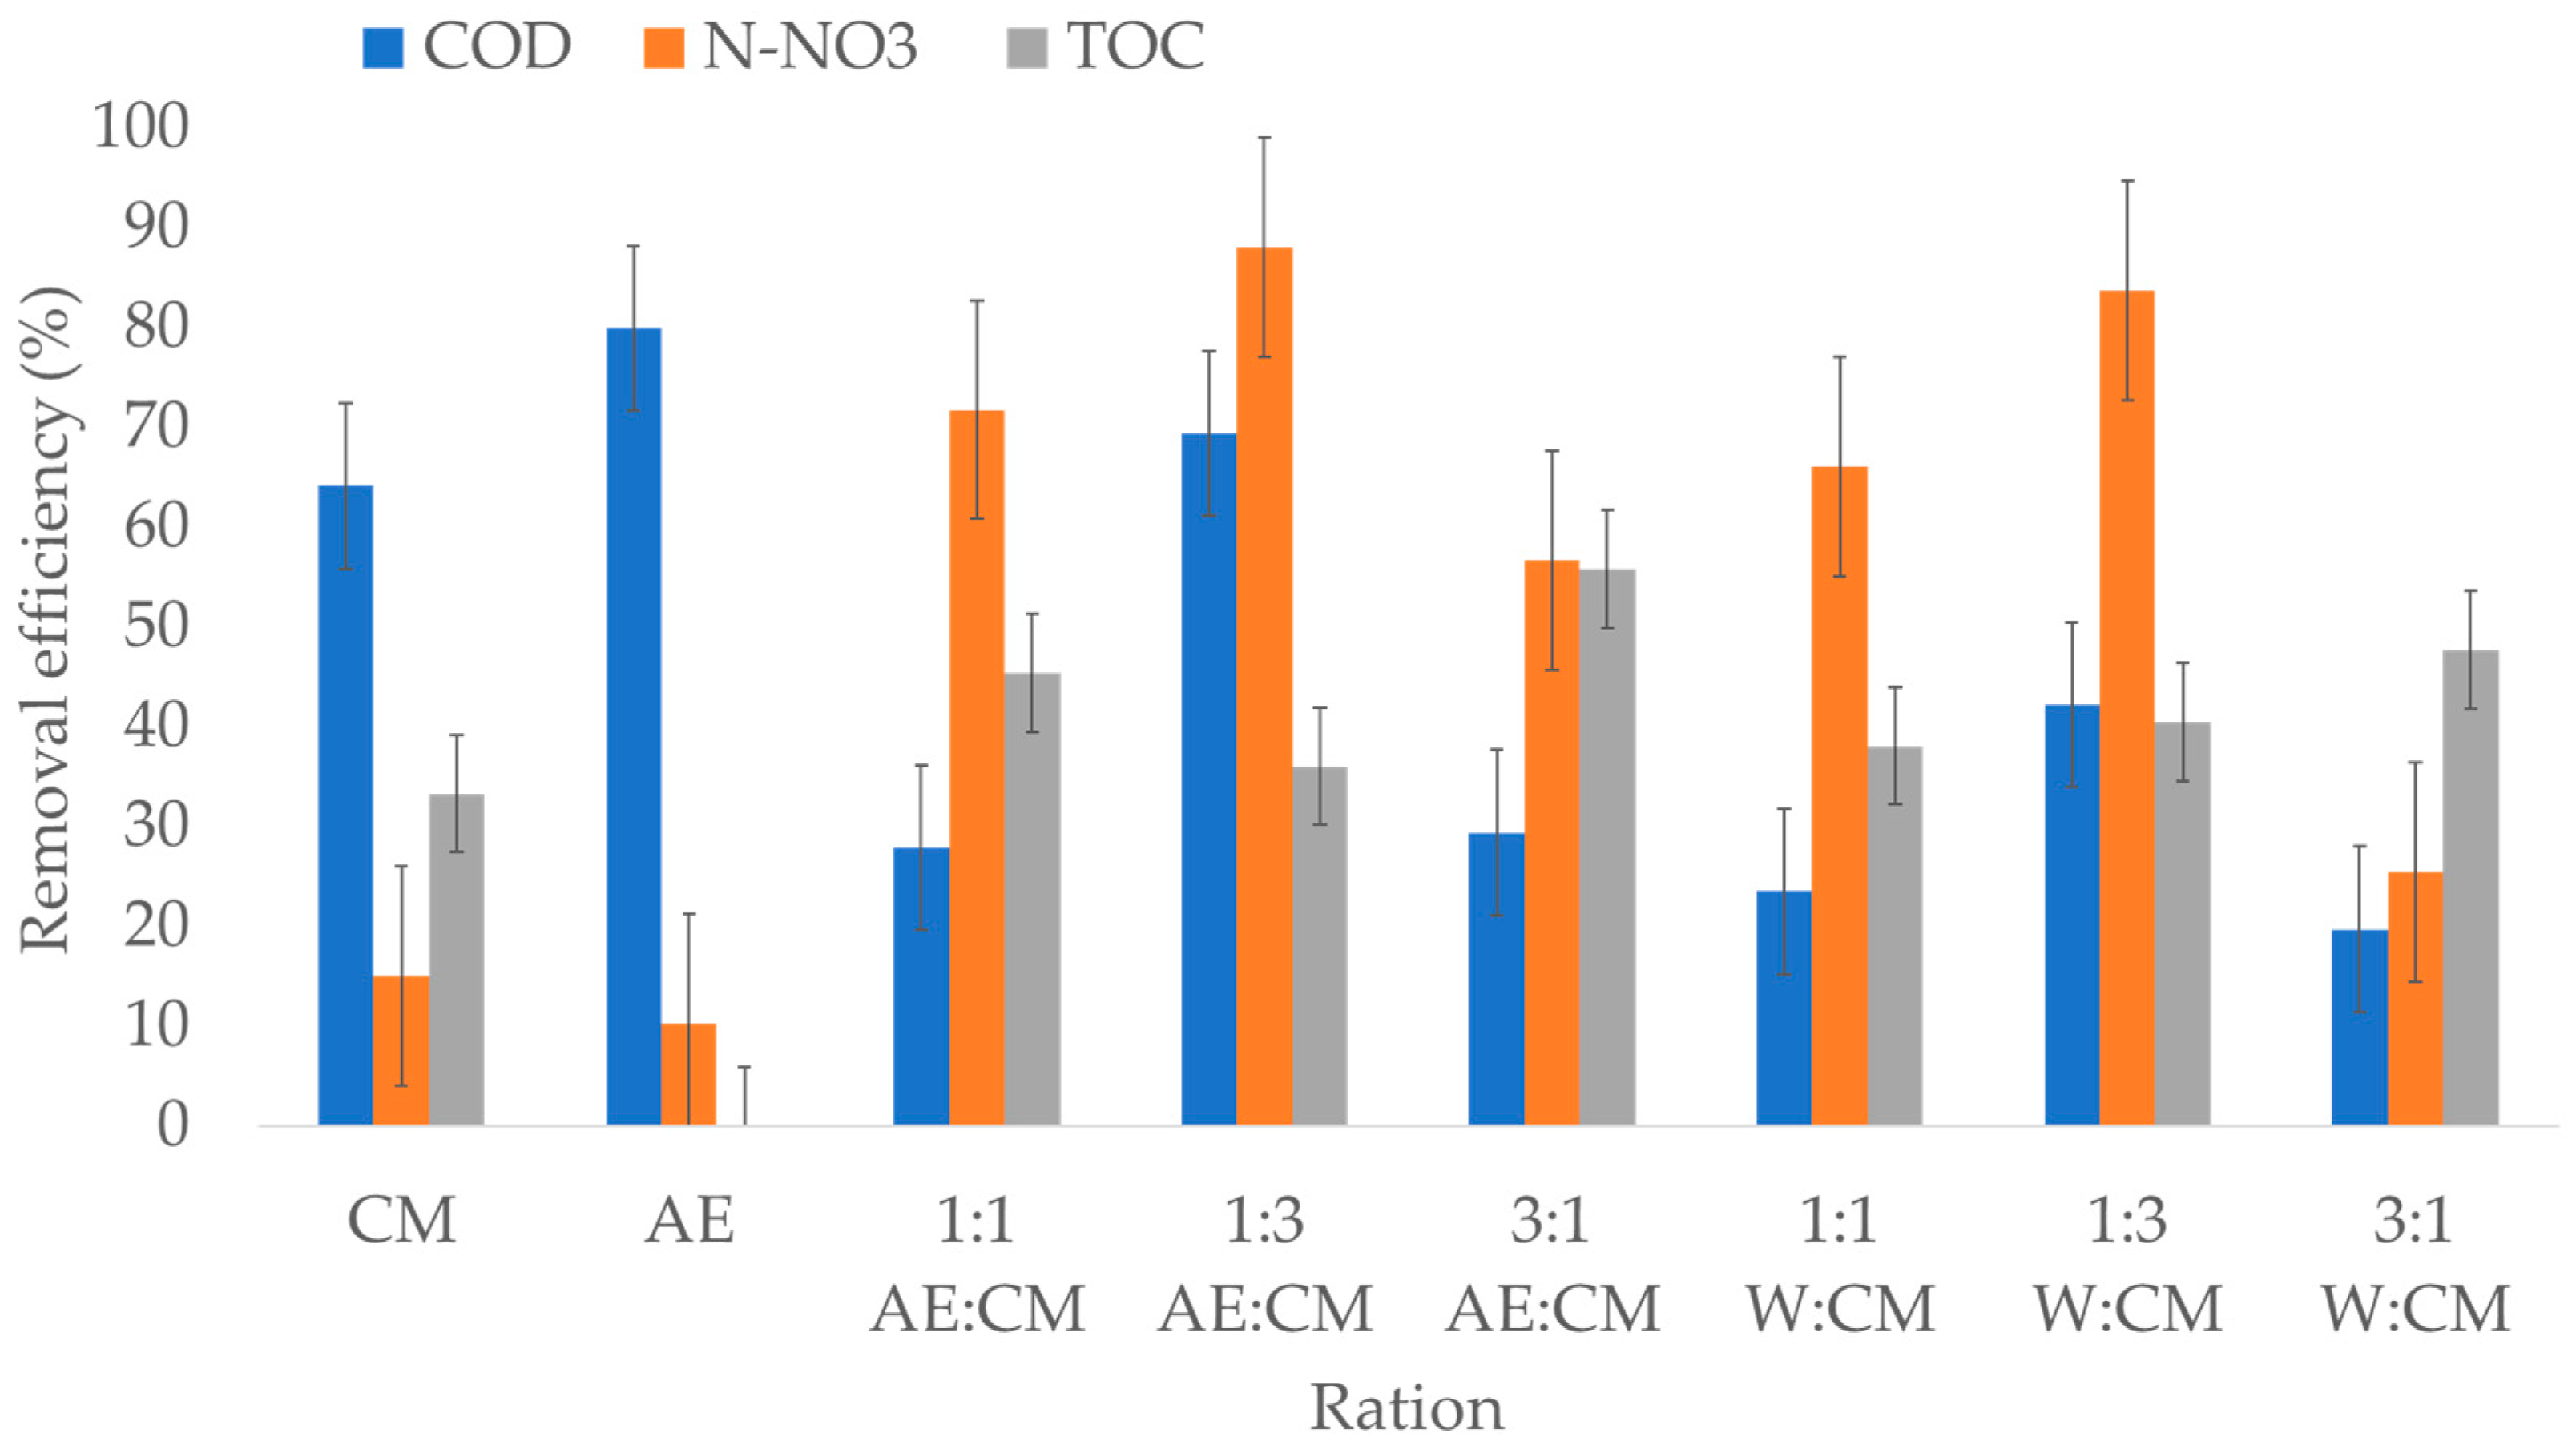
3.1. Characterization of the Substrate and Digestate

An increase in moisture content was observed, accompanied by a reduction in TS, VTS, and BD, after 19 weeks of anaerobic digestion in all tested ratios, except for the AE MoAD. In this case, due to the high MC and, consequently, the low TS, VTS was immediately consumed, nullifying BD (Table 1). Furthermore, regarding the effect of A:CM MoAD and AE:CM CoAD, an increase in MC and a reduction in TS and VTS were observed in both substrate and digestate when compared to CM (Table 1).
Overall, equivalent ratios (1:1 AE:CM and 1:1 W:CM; 1:3 AE:CM and 1:3 W:CM) showed statistically similar values for MC, TS, and VTS in both the substrate and digestate. However, the equivalent ratios 1:3 AE:CM and 1:3 W:CM exhibited lower MC values and higher TS and VTS concentrations. In the substrate, only 3:1 AE:CM and 3:1 W:CM differed statistically when comparing equivalent ratios, with CoAD showing lower MC values and higher TS and VTS concentrations. For the digestate, no significant differences were observed between equivalent ratios (Table 1).
The 3:1 AE:CM ratio showed the highest efficiency in TS (50.2%) and VTS (56.6%) removal compared to the other tested ratios. The lowest efficiency was observed for 1:3 AE:CM, with 30.9% TS removal and 38.1% VTS removal. A VTS removal rate of approximately 55–64% in CoAD of corn straw and cattle manure was reported to reduce the lag phase, achieve maximum production in a shorter time, and improve volumetric production compared to MoAD [30]. The removal of TS and VTS may be attributed to the decomposition of organic matter, which was subsequently converted into CH4 and CO2 [22].
Regarding biodegradability, no significant differences were observed between the tested ratios for both the substrate and digestate, except in the case of AE (Table 1). The highest and lowest biodegradability reduction efficiencies were 12.9 and 9.7%, respectively.
The organic matter degradation and stabilization process observed during anaerobic digestion can be related to the amount of organic fraction available in the substrate for chemical transformations occurring within the anaerobic biodigester.
Substrates with higher organic matter contents, represented by total solids concentration and moisture content, are better candidates for degradation by anaerobic microbiota than those with lower amounts of organic matter. This characteristic of the substrate influences the conversion of organic matter into metabolic intermediates, such as volatile fatty acids (VFAs) and biogas (primarily CH4 and CO2), reducing the presence of volatile compounds in the system and releasing water as a byproduct. However, high organic loading rates (OLR) using only one type of organic waste as feedstock (MoAD) may result in process instability. The nutrient composition of the substrates directly affects microbial growth and biogas production [39].
For ruminant waste such as cattle manure, a high lignocellulose content can be present due to the grass-based diet of the animals, making its degradation slower. This issue can be mitigated by using a co-digestate with easily degradable organic matter, meaning a substrate that hydrolyzes more efficiently [20]. It is important to highlight that substrates such as residual sludge from tilapia are not particularly rich in organic matter. However, due to their liquid origin, they contribute a high moisture content, which is essential for the proper functioning of the system. Additionally, the mineral richness of the tilapia sludge may enhance the enzymatic activity of the microorganisms present in the cattle manure, which acts simultaneously as both substrate and inoculum for the AD process [22].
In the present study, AE improved TS and VTS removal efficiency, with the most pronounced effect observed in the 3:1 AE:CM ratio, indicating its potential as a substitute for water (Table 1). Therefore, in organic matter conversion, the composition and quantity of easily degradable compounds (such as simple carbohydrates and proteins) present in the substrate must be considered.
Overall, the TS, VTS, and BD values obtained for CM and CoAD were similar to those reported in the literature, which confirm the biogas production potential of these materials and processes [27,39,40]. The conversion of organic matter into biogas can be confirmed by COD, N-NO3, and TOC removal efficiency [21,22]. CoAD showed higher removal values, achieving 69.3% COD and 88% N-NO3 removal for the 1:3 AE:CM ratio and 55.8% TOC removal for the 3:1 AE:CM ratio (Figure 3). These COD removal values were higher than those typically found in rural and urban waste [30], CoAD of residual sludge from tilapia and cattle manure [22], and concentrated sludge from salmon farming ponds [41]. Based on these results, it is evident that CoAD of AE and CM is a viable strategy for biogas production and process stability enhancement. In addition to the potential conversion of organic matter into high-methane biogas, COD and N-NO3 removal can result in digestates with lower pollutant loads, improved process stability, and reduced environmental impact, facilitating its use as an organic fertilizer [20,39].
The parameters pH, EC, TA, and VFA in MoAD composed of CM and AE did not show significant differences throughout the AD process. However, a significant increase in TA and a decrease in VFA were observed exclusively in the CM-only digestion system (Table 2). The EC values obtained from both MoAD and CoAD, regardless of the ratio under study, remained below those reported by [8], who indicated that values below the range of 5.53 to 7.78 mS cm−1 did not affect the biogas production rate. The VFA values presented in Table 2 are consistent with the literature, which states that an efficiently operating anaerobic digestion process should maintain VFA concentrations below 2.0 g L−1 [22].
The significant increase in pH and TA along with the reduction in VFA and the VFA/TA ratio observed in AD with the addition of W or AE suggests that the process is both stable and balanced. In contrast, EC remained stable, with no significant differences between the substrate and digestate (Table 2). These findings, together with those presented in Table 1, indicate the dynamics of organic matter degradation and the buffering capacity of the system to prevent excessive acidification [20,27].
The TA results directly influenced VFA, as acids generated from the decomposition of organic matter were consumed by methanogenic archaea, leading to an increase in bicarbonate concentration. This, in turn, raised the pH and TA of the process. This reduction indicates that VFAs were efficiently consumed by methanogenic microorganisms for methane production [17].
pH is a critical parameter in anaerobic digestion, as it directly affects the activity of the microorganisms involved. When evaluating the effects of MoAD and CoAD ratios, the pH of both the substrate and digestate remained neutral, although it significantly increased (Table 2). However, the average pH values align with the recommendations of the literature, which suggest an optimal range between 6.3 and 7.8. Within this range, most organic acids remain ionized, favoring microbial activity during AD [20,27,30,39].
This neutrality, which prevents pH fluctuations that could inhibit methanogenic microorganisms, may be attributed to the buffering effect of TA observed in the studied ratios. It is likely that the VFAs produced during digestion were neutralized, preventing abrupt pH drops that could hinder methanogenic activity. The TA and VFA values obtained in the substrates with added W and AE did not show significant differences, maintaining values within the acceptable range for biogas production [15,20,24,41].
The stability of AD depends on the balance between VFA production by acidogenic microorganisms and their consumption by methanogenic microorganisms. Adequate TA provides buffering capacity, allowing the system to withstand fluctuations in acid production without drastic pH changes. Maintaining pH within the optimal range is crucial, as an excessively low pH can inhibit methanogenic activity, while an excessively high pH can negatively affect other microorganisms involved in the process. Additionally, adequate VFA levels indicate acids consumption, which will be reflected in the methane and carbon dioxide contents of the biogas [22,42].
As a stability metric indicating balance in the anaerobic digestion process, the volatile acidity to total alkalinity ratio can be used. When VFA/TA values are below 0.4, the process is considered to be operating favorably, with no risk of acidification [24]. The analyzed parameter results can be confirmed by VFA/TA values ranging from 0.2 to 0.4, achieved with CM under W MoAD and AE CoAD (Table 2).
The success of CoAD can be attributed to the synergistic effects between the substrates used, which result in a balanced nutrient availability, ensuring that easily biodegradable compounds are available for microbial degradation.

3.2. Biogas, Digestion, and Ambient Environment Temperature Profile

Temperature is a critical variable in the AD process, directly influencing reaction efficiency and kinetics. Among these factors, its impact on microbial development during anaerobic digestion is essential for biogas production [19,43]. The temperature of the MoAD (W:CM) and CoAD (AE:CM) did not vary in the biogas (Figure 4A) or in the digestate (Figure 4B) during AD period. It was observed that the temperature of both the biogas and digestion followed the ambient temperature trend. However, regardless of the evaluated ratio, the digestion temperature exhibited slightly higher values than the ambient temperature throughout the AD process (Figure 4).
The higher digestion temperature compared to the ambient temperature was expected, given the microbial activity involved in organic matter degradation during the process. However, heat loss from the digester to the environment was not observed, due to the water seal surrounding the digestion chamber. Conversely, the biogas temperature remained in equilibrium with the ambient temperature. This occurred because the gasometer lacked thermal insulation, remaining in direct contact with the environment (Figure 4).
Although temperature variations occurred throughout the AD process, both the biogas and digestion temperatures remained stable. Maintaining temperature stability ensures a more efficient conversion of substrates into biogas and likely leads to an increase in methane content. Furthermore, these findings emphasize the importance of considering digestion conditions, such as digestion temperature, environmental conditions, and mechanisms to prevent the loss of heat from the digester [19,43].
The average temperatures recorded were 28.9 °C for the ambient environment, 29.8 ± 0.66 °C for the substrate, and 29.4 ± 0.20 °C for the biogas. The digestion temperature remained within the mesophilic range, varying between 25 and 35 °C (Figure 3). This temperature range maintained throughout anaerobic digestion aligns with the values considered optimal (20–45 °C) for biomass biodegradability and stable biogas production [19,39,40,41,43].

3.3. Biogas Performance

The AE:CM CoAD advanced the onset of biogas production to the third week, as detected by the flame test, regardless of the evaluated ratio. In contrast, in MoAD, the addition of water delayed the start of biogas production to the fifth week for the 1:1 and 1:3 W:CM ratios and the fourth week for the 3:1 W:CM ratio. Meanwhile, the anaerobic digestion of CM alone only initiated biogas production in the sixth week. The AE MoAD did not produce biogas throughout the 19-week experiment. Although biogas production significantly declined over time (Figure 5), methane was still detected via the flame test in all evaluated ratios.
The 1:1 and 3:1 AE:CM ratios exhibited the primary peak in biogas production in the fourth week, followed by a subsequent decline (Figure 5). The highest biogas yield was observed for 1:1 AE:CM, surpassing the other tested ratios (Table 3).
Although the 1:3 AE:CM ratio exhibited its primary peak in the fifth week, biogas production remained stable throughout the AD process, with a significant decline occurring only after the tenth week (Figure 5). This resulted in a higher cumulative biogas yield compared to the other ratios (Table 3).
MoAD did not show a peak in biogas production throughout the anaerobic digestion period (Figure 5) and had a lower cumulative biogas yield (Table 3) compared to the ratios under CoAD. It is noteworthy that the ratio containing only aquaponic effluent showed a zero-flame test and no biogas production throughout the process (Figure 5).
The enhanced and earlier biogas production observed in CoAD can be attributed to the additional organic and microbial load provided by AE in combination with CM. The system exhibited substrate synergy, likely due to the ability of microorganisms already present in cattle manure to adapt efficiently to the CoAD process [22,24,28]. Thus, it is evident that the addition of AE exerts a greater influence on the biodegradability of substrates. Studies indicate that aquaculture sludge has a higher propensity for intracellular material release, resulting in greater biodegradation and shorter biogas production periods during anaerobic digestion [22,23,24].
It was also observed that high cumulative biogas production was not necessarily associated with a high CH4 content and low CO2 level in the biogas (Table 3). A similar trend was reported in the CoAD of fish processing waste with cow manure and market waste (fruit and vegetable residues). In this study, the highest biogas flow rate and cumulative production were also observed during the initial stages of the CoAD process [21].
Regarding biogas composition, the studied ratios resulted in CH4 concentrations higher than those reported in the literature (Table 3) for various organic residues [17,21,27], including effluents from aquaponic [8,9,11], and aquaculture [22,41] systems. Biogas containing approximately 59.2 ± 5.6% CH4 and 38.9 ± 2.3% CO2 was produced in an anaerobic biodigester supplied with lettuce waste from an aquaponic system [8]. The CoAD of sludge from aquaponic filtration tanks combined with fish solid wastes [9] and chicken manure [11] produced biogas with approximately 74.5 and 61% methane contents, respectively. The sludge from salmon aquaculture AD produced biogas with 60.5% CH4 and 0.5–0.8% H2S [41]. The quality of the biogas components from the CoAD of fish waste with cow dung and market waste reached concentrations of approximately 60% CH4 and 32% CO2, along with stable levels of H2S [21]. Methane concentrations above 50% are considered adequate for anaerobic digestion, as the biogas quality is a key factor for its energetic valorization [21].
The results obtained in this study are consistent with those reported for the anaerobic digestion of cattle manure and residual sludge from tilapia aquaculture ponds, in which the highest CH4 concentration (70%) and the lowest CO2 concentration were observed in the CoAD, while the lowest CH4 concentration (2%) was recorded from residual sludge. On the other hand, the MoAD process produced only 43% CH4 from cattle manure [22], which contrasts with the findings of the present study.
Analyzing the CoAD process, the results of TS and VTS removal efficiency (Table 1), as well as COD, N-NO3, and TOC removal efficiency (Figure 3), suggest that the organic material is effectively consumed by microorganisms. This results in biogas production and a stable digestate with a lower pollutant load, making it potentially suitable for use as organic fertilizer.
These findings suggest that CoAD enhances biogas production efficiency, likely due to improved microbial activity and substrate availability. The results further emphasize the importance of optimizing the organic load balance and selecting appropriate co-digestion substrates to ensure higher methane yields and stable AD processes.

4. Conclusions

The results obtained in the present study indicate a balanced anaerobic system, where the conversion of organic matter occurs efficiently, without the excessive accumulation of acids that could compromise biogas production. The increases in pH and TA, along with the decreases in VFA and the VFA/TA ratio, suggests that the anaerobic digestion system operated in a balanced manner, with efficient conversion of acid intermediates into biogas, ensuring the stability and efficiency of the process.
Anaerobic co-digestion with aquaponic effluent proved advantageous when compared to single substrate anaerobic digestion. Overall, the AE provided a higher dissolved organic load, which not only enhanced but also expedited the anaerobic digestion of cattle manure. Thus, the use of AE was not only shown to be feasible for biogas production but also eliminated the need for additional water usage in the anaerobic digestion of CM. This aspect becomes even more attractive given the current global water scarcity crisis. When evaluating the efficiency of removal of TS, TSV, and COD, the 3:1 AE:CM ratio indicated the highest biogas production. However, more promising results were obtained with the 1:3 AE:CM ratio.
Biogas production adds value to RAS and represents a source of clean, renewable energy, especially beneficial for remote communities that rely solely on grid electricity systems or face frequent energy supply disruptions.
In this context, aquaponic systems combined with anaerobic digestion present the potential to establish a closed-loop cycle, in alignment with circular economy principles, by offering a technologically advantageous and sustainable solution for waste management—converting environmental liabilities into valuable resources. The innovative character of this research lies in the observation that studies on anaerobic digestion integrated with aquaponics, particularly those aimed at harnessing effluents for energy generation, remain scarce in the academic literature. Nevertheless, laboratory-scale studies have demonstrated the effectiveness of employing CoAD strategies involving various waste types. As this study was conducted through lab-scale batch tests, further large-scale investigations are necessary to validate the findings reported herein.

Author Contributions

Conceptualization, J.L.P., R.C.V. and D.C.; Data curation, J.L.P. and A.d.S.G.; Formal analysis, J.L.P., A.d.S.G. and R.M.; Funding acquisition, J.L.P.; Investigation, J.L.P., C.G.G., A.d.S.G. and R.C.V.; Methodology, J.L.P., C.G.G. and A.d.S.G.; Project administration, J.L.P.; Resources, J.L.P.; Supervision, J.L.P. and D.C.; Writing—original draft, J.L.P. and A.d.S.G.; Writing—review and editing, J.L.P., R.C.V., D.C. and R.M. All authors have read and agreed to the published version of the manuscript.

Funding

This research was funded by Foundation for Research Support of the State of Rio de Janeiro (FAPERJ), grant number SEI-260003/015161/2021-E_27/2021– Basic Research Assistance (APQ1) in ICTs based in the State of Rio de Janeiro–2021.

Data Availability Statement

The data supporting the findings of this study are contained within the article.

Acknowledgments

To the Fishing Institute Foundation of the State of Rio de Janeiro (FIPERJ for providing the aquaponic effluent.

Conflicts of Interest

The authors declare no conflicts of interest.

Abbreviations

The following abbreviations are used in this manuscript:
ADAnaerobic Digestion
AEAquaponic Effluent
ANOVAAnalysis of Variance
BDBiodegradability
CH4Methane
CHPCombined Heat and Power
CMCattle Manure
CO2Carbon dioxide
CoADAnaerobic Mono-Digestion
CODChemical Oxygen Demand
DDigestate
ECElectrical Conductivity
FIPERJFishing Institute Foundation of the State of Rio de Janeiro
H2SHydrogen Sulfide
LLiters
L kg−1Liters per Kilogram
LabGERARLaboratory of the Renewable and Alternative Rural Energy Group
MCMoisture Content
MoADAnaerobic Mono-Digestion
NH3Ammonia
N-NO3Total Nitrogen–Nitrate
OLROrganic Loading Rates
RASRecirculating Aquaculture System
SSubstrate
TATotal Alkalinity
TOCTotal Organic Carbon
TSTotal Solids
UFRRJFederal Rural University of Rio de Janeiro
VFAVolatile Fatty Acids
VTSVolatile Total Solids
WWater

References

  1. Cifuentes-Torres, L.; Correa-Reyes, G.; Mendoza-Espinosa, L.G. Can reclaimed water be used for sustainable food production in aquaponics? Front. Plant Sci. 2021, 12, 669984. [Google Scholar] [CrossRef] [PubMed]
  2. Baganz, G.F.M.; Junge, R.; Portella, M.C.; Goddek, S.; Keesman, K.J.; Baganz, D.; Staaks, G.; Shaw, C.; Lohrberg, F.; Kloas, W. The aquaponic principle—It is all about coupling. Rev. Aquac. 2022, 14, 252–264. [Google Scholar] [CrossRef]
  3. Okomoad, V.T.; Oladimeji, S.A.; Solomon, S.G.; Olufeagba, S.O.; Ogah, S.I.; Ikhwanuddin, M. Aquaponics production system: A review of historical perspective, opportunities, and challenges of its adoption. Food Sci. Nutr. 2023, 11, 1157–1165. [Google Scholar] [CrossRef] [PubMed]
  4. Chandramenon, P.; Aggoun, A.; Tchuenbou-Magaia, F. Smart approaches to aquaponics 4.0 with focus on water quality—comprehensive review. Comput. Electron. Agric. 2024, 225, 109256. [Google Scholar] [CrossRef]
  5. Guerreiro, S.L.M.; Cabral Júnior, J.F.G.; Eiras, B.J.C.F.; Miranda, B.D.S.; Lopes, P.C.A.; Melo, N.F.A.C.D.; Luz, R.K.; Sterzelecki, F.C.; Palheta, G.D.A. Integrating aquaponics with Macrobrachium Amazonicum (Palaemonidae: Decapoda) cultivation for the production of microgreens: A sustainable approach. AgriEngineering 2024, 6, 2718–2731. [Google Scholar] [CrossRef]
  6. Yep, B.; Zheng, Y. Aquaponic trends and challenges—A review. J. Clean. Prod. 2019, 228, 1586–1599. [Google Scholar] [CrossRef]
  7. Choudhury, A.; Lepine, C.; Witarsa, F.; Good, C. Anaerobic digestion challenges and resource recovery opportunities from land-based aquaculture waste and seafood processing byproducts: A review. Bioresour. Technol. 2022, 354, 127144. [Google Scholar] [CrossRef]
  8. Zhu, Z.; Yogev, U.; Keesman, K.J.; Gross, A. Onsite anaerobic treatment of aquaponics lettuce waste: Digestion efficiency and nutrient recovery. Aquac. Int. 2021, 29, 57–73. [Google Scholar] [CrossRef]
  9. Zhu, Z.; Yogev, U.; Goddek, S.; Yang, F.; Keesman, K.J.; Gross, A. Carbon dynamics and energy recovery in a novel near-zero waste aquaponics system with onsite anaerobic treatment. Sci. Total Environ. 2022, 833, 155245. [Google Scholar] [CrossRef]
  10. David, L.H.; Pinho, S.M.; Agostinho, F.; Costa, J.I.; Portella, M.C.; Keesman, K.J.; Garcia, F. Sustainability of urban aquaponics farms: An emergy point of view. J. Clean. Prod. 2022, 331, 129896. [Google Scholar] [CrossRef]
  11. Korte, M.; Bergman, J.; Van Willigenburg, L.G.; Keesman, K.J. Towards a zero-waste aquaponics-centered eco-industrial food park. J. Clean. Prod. 2024, 454, 142109. [Google Scholar] [CrossRef]
  12. Wagh, M.S.; S, S.; Nath, P.C.; Chakraborty, A.; Amrit, R.; Mishra, B.; Mishra, A.K.; Mohanta, Y.K. Valorisation of agro-industrial wastes: Circular bioeconomy and biorefinery process—A sustainable symphony. Process Saf. Environ. Prot. 2024, 183, 708–725. [Google Scholar] [CrossRef]
  13. Alengebawy, A.; Ran, Y.; Osman, A.I.; Jin, K.; Samer, M.; Ai, P. Anaerobic digestion of agricultural waste for biogas production and sustainable bioenergy recovery: A review. Environ. Chem. Lett. 2024, 22, 2641–2668. [Google Scholar] [CrossRef]
  14. Zhu, Z.; Yogev, U.; Keesman, K.J.; Gross, A. Promoting circular economy: Comparison of novel coupled aquaponics with anaerobic digestion and conventional aquaponic systems on nutrient dynamics and sustainability. Resour. Conserv. Recycl. 2024, 208, 107716. [Google Scholar] [CrossRef]
  15. Duan, Y.; Wang, Z.; Ganeshan, P.; Sar, T.; Xu, S.; Rajendran, K.; Sindhu, R.; Binod, P.; Pandey, A.; Zhang, Z.; et al. Anaerobic digestion in global bio-energy production for sustainable bioeconomy: Potential and research challenges. Renew. Sustain. Energy Rev. 2025, 208, 114985. [Google Scholar] [CrossRef]
  16. Shafaghat, A.H.; Merenda, A.; Seccombe, D.; Phuntsho, S.; Shon, H.K. From waste to high-value fertilisers: Harvesting nutrients from liquid anaerobic digestate for a circular bioeconomy. Desalination 2025, 596, 118266. [Google Scholar] [CrossRef]
  17. Jaimes-Estévez, J.; Mercado, E.V.; Jaramillo, J.G.; Rodríguez, P.; Martí-Herrero, J.; Escalante, H.; Castro, L. From laboratory to farm-scale psychrophilic anaerobic co-digestion of cheese whey and cattle manure. Bioresour. Technol. Rep. 2022, 19, 101168. [Google Scholar] [CrossRef]
  18. Argyropoulos, C.; Thomopoulos, V.; Petrakis, T.; Kavga, A. Implementing circular economy in the production of biogas from plant and animal waste: Opportunities in greenhouse heating. AgriEngineering 2024, 6, 4675–4687. [Google Scholar] [CrossRef]
  19. Garkoti, P.; Ni, J.-Q.; Thengane, S.K. Energy management for maintaining anaerobic digestion temperature in biogas plants. Renew. Sustain. Energy Rev. 2024, 199, 114430. [Google Scholar] [CrossRef]
  20. Casallas-Ojeda, M.; Cabeza, I.; Sanchez, N.; Caicedo-Concha, D.M.; Astals, S. Cheese whey and dairy manure anaerobic co-digestion at psychrophilic conditions: Technical and environmental evaluation. Environ. Res. 2024, 251, 118525. [Google Scholar] [CrossRef]
  21. Kébé, N.N.; Rieker, C.; Fall, P.A.; Diouf, D.; Ndiaye, D.; Mockenhaupt, T.; Beuel, P.; Bursche, J. Anaerobic co-digestion of fish processing waste with cow manure and waste of market (rests of fruits and vegetables): A lab scale batch test. J. Sustain. Bioenergy Syst. 2021, 11, 45–59. [Google Scholar] [CrossRef]
  22. Campos-Montiel, R.; Medina-Pérez, G.; Afanador-Barajas, L.; Ibarra-Sánchez, C.; Prince, S.; Pérez-Ríos, S.; Hernández-Niño, J. Anaerobic co-digestion of bovine manure and residual sludge from tilapia fish (Oreochromis niloticus) breeding ponds. Agro Product. 2022, 15, i11.2248. [Google Scholar] [CrossRef]
  23. Suhr, K.I.; Letelier-Gordo, C.O.; Lund, I. Anaerobic digestion of solid waste in RAS: Effect of reactor type on the Biochemical Acidogenic Potential (BAP) and assessment of the Biochemical Methane Potential (BMP) by a batch assay. Aquac. Eng. 2015, 65, 65–71. [Google Scholar] [CrossRef]
  24. Luo, G.; Ma, N.; Li, P.; Tan, H.; Liu, W. Enhancement of anaerobic digestion to treat saline sludge from recirculating aquaculture systems. Sci. World J. 2015, 2015, 479101. [Google Scholar] [CrossRef] [PubMed]
  25. Choi, H.-J. Influence of acidogenic fermented fish by-products with rice bran for sludge reduction and biogas recovery in anaerobic co-digestion. Environ. Eng. Res. 2020, 26, 190409. [Google Scholar] [CrossRef]
  26. Liu, K.; Lv, L.; Li, W.; Ren, Z.; Wang, P.; Liu, X.; Gao, W.; Sun, L.; Zhang, G. A comprehensive review on food waste anaerobic co-digestion: Research progress and tendencies. Sci. Total Environ. 2023, 878, 163155. [Google Scholar] [CrossRef]
  27. Zhang, C.; Xiao, G.; Peng, L.; Su, H.; Tan, T. The anaerobic co-digestion of food waste and cattle manure. Bioresour. Technol. 2013, 129, 170–176. [Google Scholar] [CrossRef]
  28. Ngwabie, M.; VanderZaag, A.; Nji, P.; Tembong, G.; Chenwi, T. Assessment of gaseous emissions from cattle abattoir wastes in Cameroon. AgriEngineering 2019, 1, 145–152. [Google Scholar] [CrossRef]
  29. Albuquerque, M.G.; Sousa, S.S.O.D.; Arruda, V.C.M.D.; El-Deir, S.G. Impactos socioambientais dos dejetos da pecuária no âmbito rural: Uma revisão de literatura. Rev. AIDIS Ing. Cienc. Ambient. 2022, 15, 517. [Google Scholar] [CrossRef]
  30. Wei, L.; Qin, K.; Ding, J.; Xue, M.; Yang, C.; Jiang, J.; Zhao, Q. Optimization of the co-digestion of sewage sludge, maize straw and cow manure: Microbial responses and effect of fractional organic characteristics. Sci. Rep. 2019, 9, 2374. [Google Scholar] [CrossRef]
  31. Li, Y.; Zhao, J.; Krooneman, J.; Euverink, G.J.W. Strategies to boost anaerobic digestion performance of cow manure: Laboratory achievements and their full-scale application potential. Sci. Total Environ. 2021, 755, 142940. [Google Scholar] [CrossRef] [PubMed]
  32. Freepik Company S.L.—Flaticon. Available online: https://www.flaticon.com/ (accessed on 24 January 2025).
  33. Paes, J.L.; Costa, L.M.P.; Fernandes, P.L.B.G.; Vargas, B.C.; Cecchin, D. Biogas production by anaerobic digestion of coffee husks and cattle manure. Eng. Agrícola 2023, 43, e20220126. [Google Scholar] [CrossRef]
  34. Eaton, A.D.; Franson, M.A.H. Standard Methods for the Examination of Water & Wastewater, 23rd ed.; American Public Health Association—APHA: Washington, DC, USA, 2005; Volume 21. [Google Scholar]
  35. Carmo, D.L.D.; Silva, C.A. Métodos de quantificação de carbono e matéria orgânica em resíduos orgânicos. Rev. Bras. Ciênc. Solo 2012, 36, 1211–1220. [Google Scholar] [CrossRef]
  36. Brazil’s National Institute of Meteorology (INMET). Available online: https://tempo.inmet.gov.br/TabelaEstacoes/A001 (accessed on 24 January 2025).
  37. Kunz, A.; Sulzbach, A. Kit biogas portátil. Concórdia: EMBRAPA—CNPSA. 2007. 2p. Available online: https://www.embrapa.br/suinos-e-aves/busca-de-publicacoes/-/publicacao/439433/kit-biogas-portatil-para-analise-de-concentracao-de-gas-metano-amonia-e-gas-sulfidrico-em-biogas (accessed on 24 January 2025).
  38. Ferreira, D.F. SISVAR: A computer analysis system to fixed effects split plot type designs. Rev. Bras. Biom. 2019, 37, 529–535. [Google Scholar] [CrossRef]
  39. Slopiecka, K.; Liberti, F.; Massoli, S.; Bartocci, P.; Fantozzi, F. Chemical and physical characterization of food waste to improve its use in anaerobic digestion plants. Energy Nexus 2022, 5, 100049. [Google Scholar] [CrossRef]
  40. Franqueto, R.; da Silva, J.D.; Konig, M. Effect of temperature variation on codigestion of animal waste and agricultural residue for biogas production. BioEnergy Res. 2020, 13, 630–642. [Google Scholar] [CrossRef]
  41. Gebauer, R.; Eikebrokk, B. Mesophilic anaerobic treatment of sludge from salmon smolt hatching. Bioresour. Technol. 2006, 97, 2389–2401. [Google Scholar] [CrossRef] [PubMed]
  42. Wu, L.; Jin, T.; Chen, H.; Shen, Z.; Zhou, Y. Conductive materials as fantastic toolkits to stimulate direct interspecies electron transfer in anaerobic digestion: New insights into methanogenesis contribution, characterization technology, and downstream treatment. J. Environ. Manag. 2023, 326, 116732. [Google Scholar] [CrossRef]
  43. Bahadur, A.; Zhang, L.; Guo, W.; Sajjad, W.; Ilahi, N.; Banerjee, A.; Faisal, S.; Usman, M.; Chen, T.; Zhang, W. Temperature-dependent transformation of microbial community: A systematic approach to analyzing functional microbes and biogas production. Environ. Res. 2024, 249, 118351. [Google Scholar] [CrossRef]
Figure 1. Schematic representation of the aquaponic system and its components: 1—Fish farming tank; 2—Tank with biological brush filter; 3—Three sedimentation tanks; 4—Conditioning tank for aquaponics effluent; 5—Tank containing aeration systems, biological media, and auxiliary fish; 6—Hydroponic unit; 7—Aeration tank. Images source: [32].
Agriengineering 07 00129 g001
Figure 2. Bench-scale Indian model biodigester.
Agriengineering 07 00129 g002
Figure 3. Removal efficiency (%) of chemical oxygen demand (COD), total nitrogen—nitrate (N-NO3), and total organic carbon (TOC) in different substrate compositions, including cattle manure (CM), aquaponic effluents (AE), Water (W) and their combinations in 1:1, 1:3, and 3:1 ratio in both mono-digestion (MoAD) and co-digestion (CoAD) anaerobic digestion.
Agriengineering 07 00129 g003
Figure 4. Temperature (°C) profile of the ambient environment, (A) biogas, and (B) digestion as a function of the anaerobic digestion period (Week).
Agriengineering 07 00129 g004
Figure 5. Biogas Yield (L kg−1) as a Function of Anaerobic Digestion Period (Week).
Agriengineering 07 00129 g005
Table 1. Mean values (n = 3) of moisture content (MC), total solids (TS), volatile total solids (VTS), and biodegradability (BD) in the substrate (S) and digestate (D) for cattle manure (CM), aquaponic effluents (AE), water (W), and their different ratios (1:1, 1:3, and 3:1) in anaerobic mono-digestion (MoAD) and Anaerobic Co-digestion (CoAD).
ProcessRatioMC (%)TS (%)VTS (%)BD
SDSDSDSD
MoADCM83.32 Bf87.40 Ae16.68 Aa12.60 Ba13.22 Aa8.78 Ba0.79 Aa0.70 Ba
AE99.93 Aa100 Aa0.07 Af0.00 Ae0.00 Ag0.00 Ae0.00 Ab0.00 Ab
CoAD1:1 AE:CM92.32 Bd95.18 Ac7.68 Ac4.81 Bc5.97 Ac3.32 Bc0.77 Aa0.69 Ba
1:3 AE:CM89.78 Be92.94 Ad10.22 Ab7.06 Bb8.10 Ab5.01 Bb0.79 Aa0.71 Ba
3:1 AE:CM94.95 Bc97.48 Ab5.04 Ad2.51 Bd4.19 Ae1.82 Bd0.83 Aa0.72 Ba
MoAD1:1 W:CM92.90 Bd95.41 Ac7.10 Ac4.59 Bc5.34 Ad3.10 Bc0.75 Aa0.67 Ba
1:3 W:CM89.66 Be93.37 Ad10.34 Ab6.63 Bb7.95 Ab4.60 Bb0.77 Aa0.69 Ba
3:1 W:CM96.33 Bb98.11 Ab3.67 Ae1.89 Bd2.82 Af1.31 Bd0.77 Aa0.68 Ba
Means followed by different uppercase letters in the same row (substrate and digestate) for each variable differ statistically according to the Scott–Knott test at a 5% probability level. Means followed by different lowercase letters in the same column for each variable indicate significant differences between ratios, according to the Scott–Knott test at a 5% probability level.
Table 2. Mean values (n = 3) of pH, electrical conductivity (EC), total alkalinity (TA), volatile acidity (VFA), and AFV/TA ratio in the substrate (S) and digestate (D) for cattle manure (CM), aquaponic effluents (AE), water (W), and their different ratios (1:1, 1:3, and 3:1) in anaerobic mono-digestion (MoAD) and Anaerobic Co-digestion (CoAD).
RatiopHEC
(ds m−1)
TA
(gCaCO3 L−1)
VFA
(g eq HAc L−1)
VFA/TA
SDSDSDSDSD
CM7.24 Aa7.36 Aa0.32 Ad0.82 Ac3.54 Ba5.62Aa1.06 Aa0.80 Ba0.29 Ab0.14 Ba
AE7.03 Ab7.12 Ab0.34 Ad0.31 Ac0.02 Ad0.05Ad0.01Ad 0.01 Ac0.46 Aa0.14 Ba
1:1 AE:CM6.61 Bc6.82 Ac4.04 Aa3.56 Aa1.63 Bb2.69 Ac0.48 Ac0.20 Bc0.30 Ab0.08 Ba
1:3 AE:CM6.80 Bc7.36 Aa4.41 Aa4.23 Aa2.33 Bb4.02Ab0.86 Ab0.58 Bb0.37 Aa0.15 Ba
3:1 AE:CM6.63 Bc6.84 Ac3.19Ab2.95 Ab1.04Bc2.63Ac0.43 Ac0.19 Bc0.41 Aa0.07 Ba
1:1 W:CM6.73 Bc6.95 Ac3.79 Aa3.80Aa1.94 Bb3.72 Ab0.49 Ac0.20 Bc0.25 Ab0.05 Ba
1:3 W:CM6.78 Bc7.15 Ab2.55 Ac2.70 Ab2.10 Bb3.62Ab0.69 Ab0.25 Bc0.33 Ab0.07 Ba
3:1 W:CM6.42 Bd6.76 Ac3.17 Ab2.93 Ab1.96 Bb3.91Ab0.46 Ac0.13 Bc0.24 Ab0.03 Ba
Means followed by different uppercase letters in the same row (substrate and digestate) for each variable differ statistically according to the Scott–Knott test at a 5% probability level. Means followed by different lowercase letters in the same column for each variable indicate significant differences between ratios, according to the Scott–Knott test at a 5% probability level.
Table 3. Biogas yield and concentrations of methane (CH4), carbon dioxide (CO2), hydrogen sulfide (H2S), and ammonia (NH3) as a function of peak biogas production and cumulative biogas yield (Week).
RatioWeekBiogas Yield
(L kg−1)
Biogas CompositionCumulative Biogas Yield (L kg−1)
CH4 (%)CO2 (%)H2S (ppmv)NH3 (ppmv)
CM125.8376.523.5201557.58
AE-------
1:1 AE:CM 47.2175.025.0152056.92
1:3 AE:CM 57.0977.522.5152069.72
3:1 AE:CM 46.3675.025.0152032.49
1:1 W:CM 125.8460.040.0201547.85
1:3 W:CM 55.0777.522.5201540.92
3:1 W:CM 54.0975.025.0201531.83
Disclaimer/Publisher’s Note: The statements, opinions and data contained in all publications are solely those of the individual author(s) and contributor(s) and not of MDPI and/or the editor(s). MDPI and/or the editor(s) disclaim responsibility for any injury to people or property resulting from any ideas, methods, instructions or products referred to in the content.

