Article

Study on Pressure Fluctuation Characteristics and Chaos Dynamic Characteristics of Two-Way Channel Irrigation Pumping Station Under the Ultra-Low Head Based on Wavelet Analysis

by
Weixuan Jiao
1,*,
Xiaoyuan Xi
1,
Haotian Fan
1,
Yang Chen
2,
Jiantao Shen
1,
Jinling Dou
3 and
Xuanwen Jia
1
1
College of Hydraulic Science and Engineering, Yangzhou University, Yangzhou 225100, China
2
Shanghai Branch of Changjiang Institute of Survey, Planning, Design and Research Co., Ltd., Shanghai 200439, China
3
Xinji Water Conservancy Station, Yizheng 211403, China
*
Author to whom correspondence should be addressed.
AgriEngineering 2025, 7(9), 270; https://doi.org/10.3390/agriengineering7090270
Submission received: 19 June 2025 / Revised: 12 August 2025 / Accepted: 20 August 2025 / Published: 22 August 2025

Abstract

Two-way channel irrigation pumping stations are widely used along rivers for irrigation and drainage. Due to fluctuating internal and external water levels, these stations often operate under ultra-low or near-zero head conditions, leading to poor hydraulic performance. This study employs computational fluid dynamics (CFD) to investigate such systems’ pressure fluctuation and chaotic dynamic characteristics. A validated 3D model was developed, and the wavelet transform was used to perform time–frequency analysis of pressure signals. Phase space reconstruction and the Grassberger–Procaccia (G–P) algorithm were applied to evaluate chaotic behavior using the maximum Lyapunov exponent and correlation dimension. Results show that low frequencies dominate pressure fluctuations at the impeller inlet and guide vane outlet, while high-frequency components increase significantly at the intake bell mouth and outlet channel. The maximum Lyapunov exponent in the impeller and guide vane regions reaches 0.0078, indicating strong chaotic behavior, while negative values in the intake and outlet regions suggest weak or no chaos. This integrated method provides quantitative insights into the unsteady flow mechanisms, supporting improved stability and efficiency in ultra-low-head pumping systems.

1. Introduction

Under the dual challenges of the global water shortage and the continuous growth of agricultural production demands, efficient agricultural irrigation systems have become an essential issue for ensuring food security and ecological sustainability [1]. Irrigation pumping stations are the core energy hub of modern irrigation systems, converting mechanical power into hydraulic energy to enable large-scale and efficient water delivery across diverse terrains [2]. For a long time, irrigation pumping stations have been invaluable in resisting drought and waterlogging, improving production and living conditions, and improving labor productivity [3]. In the coastal areas along the Yangtze River, due to the slight difference between the inland and outer water levels, and the frequent alternation of drought and flood, the comprehensive application of drainage, irrigation, self-drainage, and self-diversion functions is required. The ultra-low-head two-way channel irrigation pumping station arises because of demand.
The vertical axial-flow pumping station is a common form of pumping station. The research on vertical axial-flow pumping stations mainly focuses on hydraulic optimization design and stability analysis [4,5,6,7]. Compared with other ordinary pumping stations, the two-way channel pumping station has the advantages of a simple structure, saving resources, stable operation, high efficiency, and small engineering investment, which meets the energy saving requirements and environmental protection of pumping station operation. Zhou et al. [8] discovered that structural simplification and efficient hydraulic performance are key to effectively utilizing ultra-low-head water power resources and reducing hydroelectric unit costs. Lu et al. [9] carried out the optimal design of two-way intake of an in-operation pumping station based on the numerical and experimental study. Hou et al. [10] studied the dynamic response law of a dual-flow channel pump station structure under water pressure fluctuation using the harmonic response analysis method. Zhou et al. [11] proposed the optimal design of an outlet concentric pipe for an open dual-directional pumping system combined with the Zaogang Pumping Station. Zheng et al. [12] found that reasonably reducing the bell mouth suspension height can improve the circumferential uniformity of the inflow to the impeller and suppress low-frequency fluctuations, while enhancing pressure pulsations on the pressure and suction sides and stabilizing the mainstream region. Zhu et al. [13] found through LDV experiments and IDDES simulations that under drainage conditions in a pumped storage power station, the turbulence intensity first increases and then decreases, and the probability density of the fluctuating velocity tends to follow a normal distribution. The two-way channel vertical pump device is typically used less under the ultra-low head, primarily when a negative head occurs, and the device performs poorly. Under the ultra-low-head condition, the flow rate of the pumping station exceeds the design flow rate by 20~30%, the flow in the inlet channel and outlet channel is disordered, and the energy loss is significant. So, research on two-way channel pumping stations is still necessary.
The most prominent characteristic of two-way flow channel pump stations in coastal and riverine regions is their prolonged operation under ultra-low-head conditions. In such scenarios, a significantly larger flow rate—approximately 1.2 to 1.3 times the design flow rate—passes through the unit’s internal components. This phenomenon exacerbates internal flow instability within the water pump and intensifies cavitation [14,15], adversely affecting its operational efficiency and economic performance. Furthermore, it substantially increases energy loss within the pump [16,17]. Several researchers have conducted comprehensive studies on energy loss in ultra-low-head pump stations utilizing the entropy generation method. Jiao et al. [18] investigated the sources of internal energy loss and pressure fluctuation characteristics of ultra-low-head axial flow pump units by integrating entropy generation analysis with high-frequency pressure fluctuation tests. Their findings revealed that turbulent dissipation resulting from velocity fluctuations of both impeller and guide vanes constitutes the primary source of energy loss for these pumps under ultra-low-head conditions, with significant increases observed in pressure fluctuation amplitudes—particularly near the impeller, where low-frequency resonance warrants careful consideration. Kan et al. [19] employed the entropy generation method to explore the energy loss mechanisms associated with axial flow pumps transitioning from pump mode to turbine mode under ultra-low-head conditions, emphasizing transient characteristics and energy loss distribution during this transition process. The results provide valuable insights for ensuring safe and stable operations at pumped storage facilities during transitions between modes.
In addition to studies on energy dissipation based on the entropy generation method, many recent investigations have utilized CFD-based unsteady numerical simulations to analyze the internal flow dynamics of pumps under ultra–low–head conditions. Zhang et al. [20] developed an innovative three-dimensional CFD coupling method that overcomes the limitations of the traditional transfer function approach, enabling high-accuracy simulation of transient dynamic characteristics in variable-speed pumped storage units. Gu et al. [21] applied a dynamic mesh CFD simulation technique. They discovered that axial vibration of the floating impeller causes periodic fluctuations in pressure, efficiency, and head coefficient in centrifugal pumps, thereby intensifying operational instability. They further proposed a trigonometric function model for rapid stability assessment. Xu et al. [22] addressed hydraulic issues in the S-shaped region of pumped storage units, combining model tests and CFD simulations to reveal that rigid-body vortex structures between guide vanes induce low-frequency, high-pressure pulsations. Based on the Rortex method and entropy transport equation, they confirmed that shear effects and velocity gradient–induced pseudo-Lamb terms are the dominant mechanisms in vortex evolution. Wang et al. [23] investigated the energy conversion characteristics of bulb tubular pump-turbines within ultra-low head pumped hydroelectric storage (PHES) systems, examining various geometric scales. Their study encompassed aspects such as energy performance, hydraulic stability, and the progressive alterations in internal flow dynamics. Additionally, they proposed recommendations for optimal unit sizing through a generalized economic analysis, offering forward-looking insights to minimize internal energy losses and enhance the efficiency of PHES generation under ultra-low-head conditions. Chen et al. [24] introduced an optimization strategy known as OT-CFD, which integrates orthogonal testing methods with CFD to refine the geometric parameters of turbine runners in turbine mode. The objective was to enhance both the efficiency and head of the turbine. Although extensive research has been conducted using CFD numerical simulation methods to investigate the operation of pumping stations and pumped storage power stations under ultra-low-head conditions, the primary focus has been on energy loss mechanisms. Consequently, it remains essential to investigate the instability of internal transient flow and the pressure fluctuation characteristics in pumps under ultra-low-head conditions.
Because the pressure fluctuation can directly reflect the pressure fluctuation characteristics of fluids, the research on the analysis of the pressure fluctuation characteristics inside the pump and pumping station is currently abundant. Yu et al. [25] investigated numerically the effects of tip clearance on propulsion performance and pressure fluctuations in a pump jet propulsor. Al-Obaidi [26] studied the behaviors of flow field and pressure fluctuations in both time and frequency domains in an axial flow pump by changing various impeller blade angles using a CFD technique. Zhang et al. [27] compared and analyzed the hydrodynamic characteristics of the two-way axial flow pump under positive and negative operation comprehensively, especially the pressure fluctuation characteristics in the pump, and revealed the energy characteristics and the propagation law of pressure fluctuation of the two-way axial flow pump under positive and negative operation. The fast Fourier transform (FFT) is the most commonly used method for pressure fluctuation analysis [28,29]. Still, there are limitations to the fast Fourier transform analysis method, which cannot distinguish between the many non-equilibrium signals that exist in practice, where the frequency changes with time. Therefore, some experts [30,31,32] have used wavelet analysis to analyze pressure fluctuation data at the same time. Jin et al. [33] examined the transient characteristics of a double-suction centrifugal pump under different operating conditions using FFT and continuous wavelet transform (CWT). Compared with the fast Fourier transform method, the wavelet analysis method can realize the advantage of synchronous analysis of the time-domain and frequency-domain data of signals. Although there is a wealth of research on pressure fluctuation in pumping units, the study of fluctuation characteristics within the inlet and outlet channels is not yet mature, especially in two-way channel pumping stations under the ultra-low head.
Chaos theory, a rapidly advancing branch of nonlinear science, describes motion characterized by sensitivity to initial conditions, long-term unpredictability, fractal geometry, bounded dynamics, and aperiodic trajectories. Researchers widely apply it in power systems. Su and Xu [34] utilized chaos and fractal theories to study the spatial characteristics of Alternating Current (AC) fault arc current and established the diagnostic model of fault arc. Ma et al. [35] used the phase space reconstruction theory to analyze the highly resistant vibration signal; studied the change law of the phase trajectory of the highly resistant vibration signal under different voltage levels, different mechanical fault types, and fault degrees; and proposed a highly resistant mechanical fault identification method based on multi-chaotic feature space. In addition to chaos theory, several other theoretical frameworks play significant roles in studying pressure pulsations in hydraulic machinery. Su et al. [36] studied the chaotic dynamic characteristics of pressure fluctuation signals in hydraulic turbines. Liang et al. [37] used the chaotic characteristics of frequency bands to describe the cavitation state and the evolution law of the centrifugal pump. Wang et al. [38] used the wavelet packet transform and recurrence plot to investigate the hydrodynamics of airlift pumps at various gas superficial velocities due to their capabilities for extracting the microstructures and determining the whole complexity in airlift pumps. Lan et al. [39], using an improved Hilbert–Huang Transform (HHT) combined with wavelet analysis, found that during intensified cavitation in turbines, the proportion of low-frequency energy in pressure pulsation signals decreased while high-frequency energy increased, with the spectrum tending toward a continuous distribution—revealing the relationship between operating condition and energy distribution. Xiao et al. [40] applied HHT to identify that in runaway conditions of pump turbines, the dominant frequencies of pressure pulsations in the bladeless zone correspond to the rotational frequency and blade passing frequency. In contrast, in the draft tube, they correspond to vortex rope frequency. Wang et al. [41] used FFT to determine that for Francis turbines in runaway conditions, the preferred operating range is 0.7Qdes to 0.8Qdes. Shen et al. [42] adopted the normalized scale-averaged wavelet power spectrum as an analytical tool and—combined with the Thoma number—studied the relationship between internal flow characteristics of PATs and output power fluctuations. Xiao and Jin [43] proposed a new flow pattern classification method for gas/liquid two-phase flow by combining the different dimensions’ chaotic attractor morphological feature parameters. The process can achieve a good clustering of gas/liquid two-phase flow patterns, including the complex transitional flow pattern, and it implies that the method of chaotic attractor morphological characterization is a practical approach to studying nonlinear time series in practice. Although advanced signal processing techniques such as chaos theory, wavelet transform, and fast Fourier transform have been widely applied in hydraulic machinery systems, their application to pressure pulsation signals in ultra-low-head pumping stations remains limited. Therefore, conducting an in-depth investigation into the nonlinear dynamic behavior and chaotic characteristics of such signals is necessary.
Although FFT has been widely used to analyze pressure fluctuations, it cannot capture non-stationary and time-varying signals in pumping systems. This study investigates an ultra-low-head two-way channel pumping station to address this gap, where complex flow dynamics and pressure instabilities are prominent. CWT is employed to analyze pressure signals’ time–frequency characteristics at multiple monitoring points. Furthermore, phase space reconstruction is performed to calculate the maximum Lyapunov exponent, allowing the identification of chaotic behavior. The correlation dimension is also obtained via the G–P algorithm to evaluate the nonlinear complexity of the system quantitatively. The novelty of this study lies in integrating CFD-based unsteady simulation with advanced nonlinear dynamic analysis, providing a deeper understanding of pressure pulsation mechanisms under ultra-low-head conditions. The results offer valuable insights for improving two-way channel pumping stations’ stability and operational efficiency.

2. Numerical Calculation Model and Method

2.1. Calculation Model

This chapter presents the numerical calculation model and method used to study the pressure fluctuation characteristics of the ultra-low-head two-way channel pumping station along the Yangtze River. The computational domain, grid generation, grid independence analysis, boundary conditions, and turbulence models for numerical solution are described in detail in the following subsections.
The calculation model of this paper is an ultra-low-head two-way channel pumping station along the Yangtze River. The three-dimensional geometric model of the pumping station’s inlet channel, impeller, guide vanes, and outlet channel was established using Siemens NX 12.0, a commercial computer-aided design software widely used in engineering for complex surface modeling and structural detailing. The main parameters of the two-way channel pumping station are shown in Table 1, and the characteristic head of the station is shown in Table 2. The minimum head reaches a negative head. The pumping station calculation model includes the inlet and extension sections, impeller, guide vane, outlet channel, and extension sections (Figure 1).

2.2. Calculation Method and Mesh Generation

In this paper, the large commercial CFD software ANSYS CFX 2021 R1 is used for numerical simulation based on the continuity equation of incompressible fluid and the RANS equation. Due to the incompressibility of the fluid and the slight temperature variation, heat exchange can be ignored without considering the energy conservation equation. Thus, the continuity equation and momentum equation can be formulated as follows:
u 𝚤 ¯ x i = 0
u i t + u 𝚤 u 𝚥 ¯ x j = 1 ρ p - x i + x i v u i x j + u j x i u 𝚤 u 𝚥 ¯ x i f i
where u i is the velocity component in the x i direction, t is time, ρ is the fluid density, p is the static pressure, v is the kinematic viscosity, ¯ and are the time-averaged and fluctuating components of any arbitrary parameter, respectively, and f i is the mass force source term.
Because the RNG k-ε model can effectively predict rotating flow and vortex flow, it has good applicability in the axial flow pump flow field; so, the RNG k-ε model is used in a three-dimensional steady and unsteady turbulent pump device model. The k equation and ε equation are as follows [44,45,46]:
ρ k t + ρ k u i x j = x j α k μ e k x j + ρ P k ε
ρ ε t + ρ ε u j x j = x j α ε μ e ε x j + ρ ε k C 1 ε * P k C 2 ε ε η = 2 E i j E i j 1 2 k ε
where C 1 ε * = C 1 ε η 1 η / η 0 1 + β η 3 . E i j = 1 2 ( u i x j + u j x i ) . The values of the constants are as follows: α k = α ε = 1.39 ;   C 1 ε = 1.42 ;   C 2 ε = 1.68 ; η 0 = 4.377 ;   β = 0.012 .
The mesh is divided into an ANSYS mesh and a Turbo grid, a hybrid mesh. Due to the complex shape of the inlet and outlet channels, most are hexahedral grids, and a few are unstructured tetrahedral grids. In this paper, the grid density of the impeller and guide vane is encrypted to ensure the calculation accuracy.
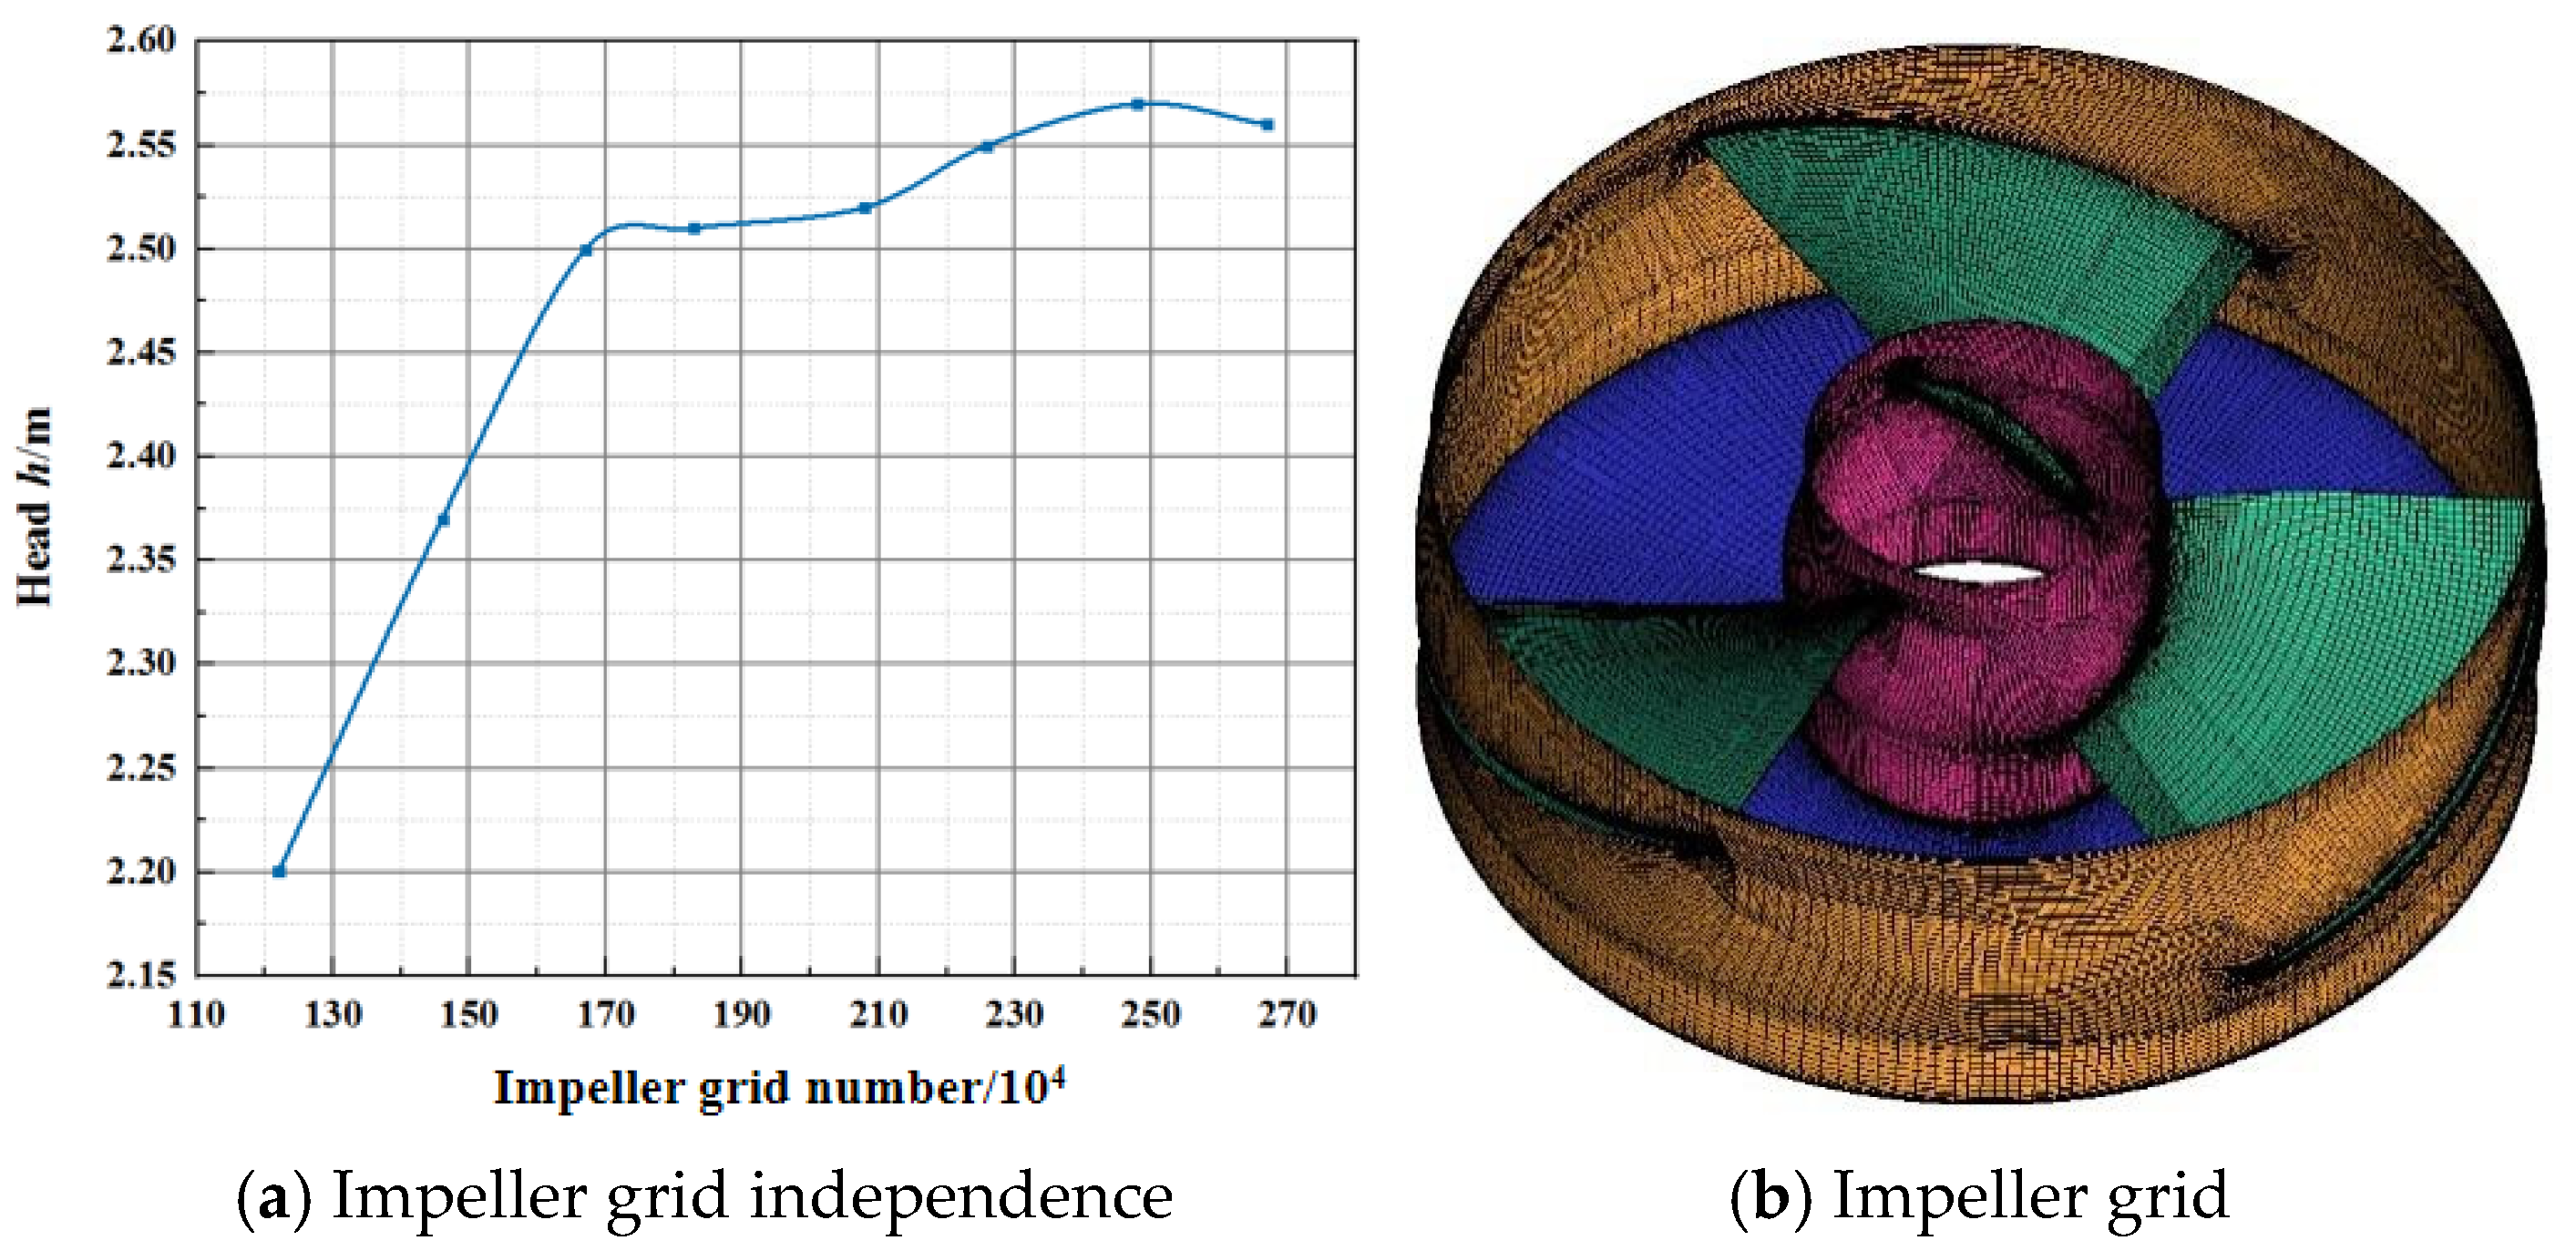
To verify the rationality of the mesh division, a grid independence analysis of the impeller mesh under the design flow condition (Qd = 20 m3/s) was conducted, as shown in (Figure 2a). The head variation stabilizes when the number of impeller mesh elements reaches 2.5 million. At this point, the total mesh count of the pump device reaches 8.22 million, and the corresponding head is 2.57 m. The simulation results agree well with the experimental data, indicating that the mesh quantity is appropriately set. Meanwhile, the mesh quality in each computational domain exceeds 0.35. Figure 2 presents the results of the impeller mesh independence verification and the schematic of the impeller mesh division.

2.3. Calculation Parameters and Boundary Conditions

The diameter of the pump impeller is D = 2.50 m and the speed n = 150 r/min. To study the internal characteristics and water pressure fluctuation of the two-way channel pumping station under the condition of ultra-low head and significant flow rate, the frequently occurring condition (Q = 28 m3/s, H = 0.01 m) that is often running is taken as the ultra-low-head condition for calculation and analysis.
The calculation area includes the inlet and extension sections, impeller, guide vane, outlet channel, and extension sections. The boundary conditions are set as follows.
The inlet boundary is set at a distance of 4D upstream from the entrance, where a mass flow rate of 28,000 kg/s is applied using the mass flow inlet condition. The outlet boundary is located 4D downstream from the end of the outlet channel, and the pressure outlet condition is taken as 1 atm. The non-slip condition is specified at the solid side wall (u = v = w = 0), and the wall function is used in the near-wall region. The blade surface is set as a moving wall. The pump station has a rotating impeller, stationary guide vanes, and inlet and outlet channels, and the dynamic and static interface is set between the inlet channel and impeller, as well as the impeller and guide vane. The multi-reference system model deals with the dynamic–static interface in the steady calculation, and the Transient Rotor Stator interface is used in the transient calculation. The calculation accuracy is 1.0 × 10⁻⁴. In transient calculation, the time step is 1/40 of the impeller rotation period, 0.4 s, and the sampling time is eight impeller rotation periods. The calculation accuracy is 1.0 × 10⁻⁵.

3. Experimental Setup

3.1. Experimental Instrument

The energy performance test of the two-way channel pumping system was conducted on a high-precision pump model test-bed. The diameter of the model impeller for the hydraulic model test is 0.3 m, the diameter of the prototype impeller is 2.50 m, and the similarity ratio λD is 8.33. The test speed of the model device is converted according to the equal value of the prototype and the model nD (the equal head), where n is the impeller speed and D is the impeller diameter. Hence, the test speed of the model pump after conversion is 1250 r/min. The experimental system primarily consists of an open-type inlet tank, a sealed bidirectional inlet/outlet flow channel, a vertical axial-flow pump unit, a pressurized outlet tank, an AC motor, a torque sensor, an electromagnetic flowmeter, a butterfly valve, an auxiliary pump, and a DN200 PVC circulation pipeline. Among these, the open-type inlet tank, sealed bidirectional flow channel, vertical axial-flow pump, and pressurized outlet tank constitute the core test section, with a total length of 3.3 m. The entire experimental loop has a total length of 12 m, and all components are connected using PVC flanges. The working fluid is room-temperature water. To minimize asymmetry and flow disturbances at the inlet, a rectifying grid is installed in the tank to ensure that the internal flow remains uniform. The specifications of the measurement instruments used in the experiment are listed in Table 3.

3.2. Uncertainty Analysis

The uncertainty in the efficiency measurement of the two–way flow channel pump set is related to the measuring instruments used in the experiment, including the electromagnetic flowmeter provided by Kaifeng Instrument Co., Ltd., the differential pressure transmitter from Yokogawa Instrument Co., Ltd. (Sichuan, China), the torque sensor and torque speed indicator produced by Xiangyi Electrical Instrument Co., Ltd. (Hunan, China). The uncertainties of these instruments are ±0.2%, ±0.10%, ±0.15%, and ±0.05%, respectively. The Jiangsu Institute of Metrology (China) certified all measurement devices used in this experiment. Based on calculations, the combined uncertainty of the test bench efficiency measurement is determined to be ±0.37%, which meets the requirements for two–way flow channel pump unit testing.

3.3. Experimental Verification

The performance data of the prototype pump device after conversion are compared with the performance curve of the device obtained by numerical simulation. As shown in Figure 3, the change trend of the two is consistent, the errors are all within a 5% margin, so the numerical simulation results are reliable. In this study, the flow coefficient K Q , head coefficient K H , and efficiency coefficient K η are defined as follows [47]:
K Q = Q n D 3
K H = H n 2 D 2
K η = η η m a x
where Q is the volume flow rate (m3/s), H is the head of the water pump (m), η is pump efficiency, η m a x is the highest water pump efficiency, n is the rotational speed (r/s), and D is the impeller diameter (m).

4. Calculation Results

4.1. Pressure Fluctuation

The arrangement of the monitoring points for each part of the pump unit is shown in Figure 4. Pressure monitoring points M1, M2, and M3 were set up at the impeller inlet along the direction from the hub to the rim. Pressure monitoring points M4, M5, and M6 were set up at the impeller outlet. Pressure monitoring points M7, M8, and M9 were set up at the outlet of the guide vane. Pressure monitoring points M10, M11, and M12 were arranged at the intake bell mouth in the inlet channel, and pressure monitoring points M13, M14, M15, and M16 were placed in the outlet channel.
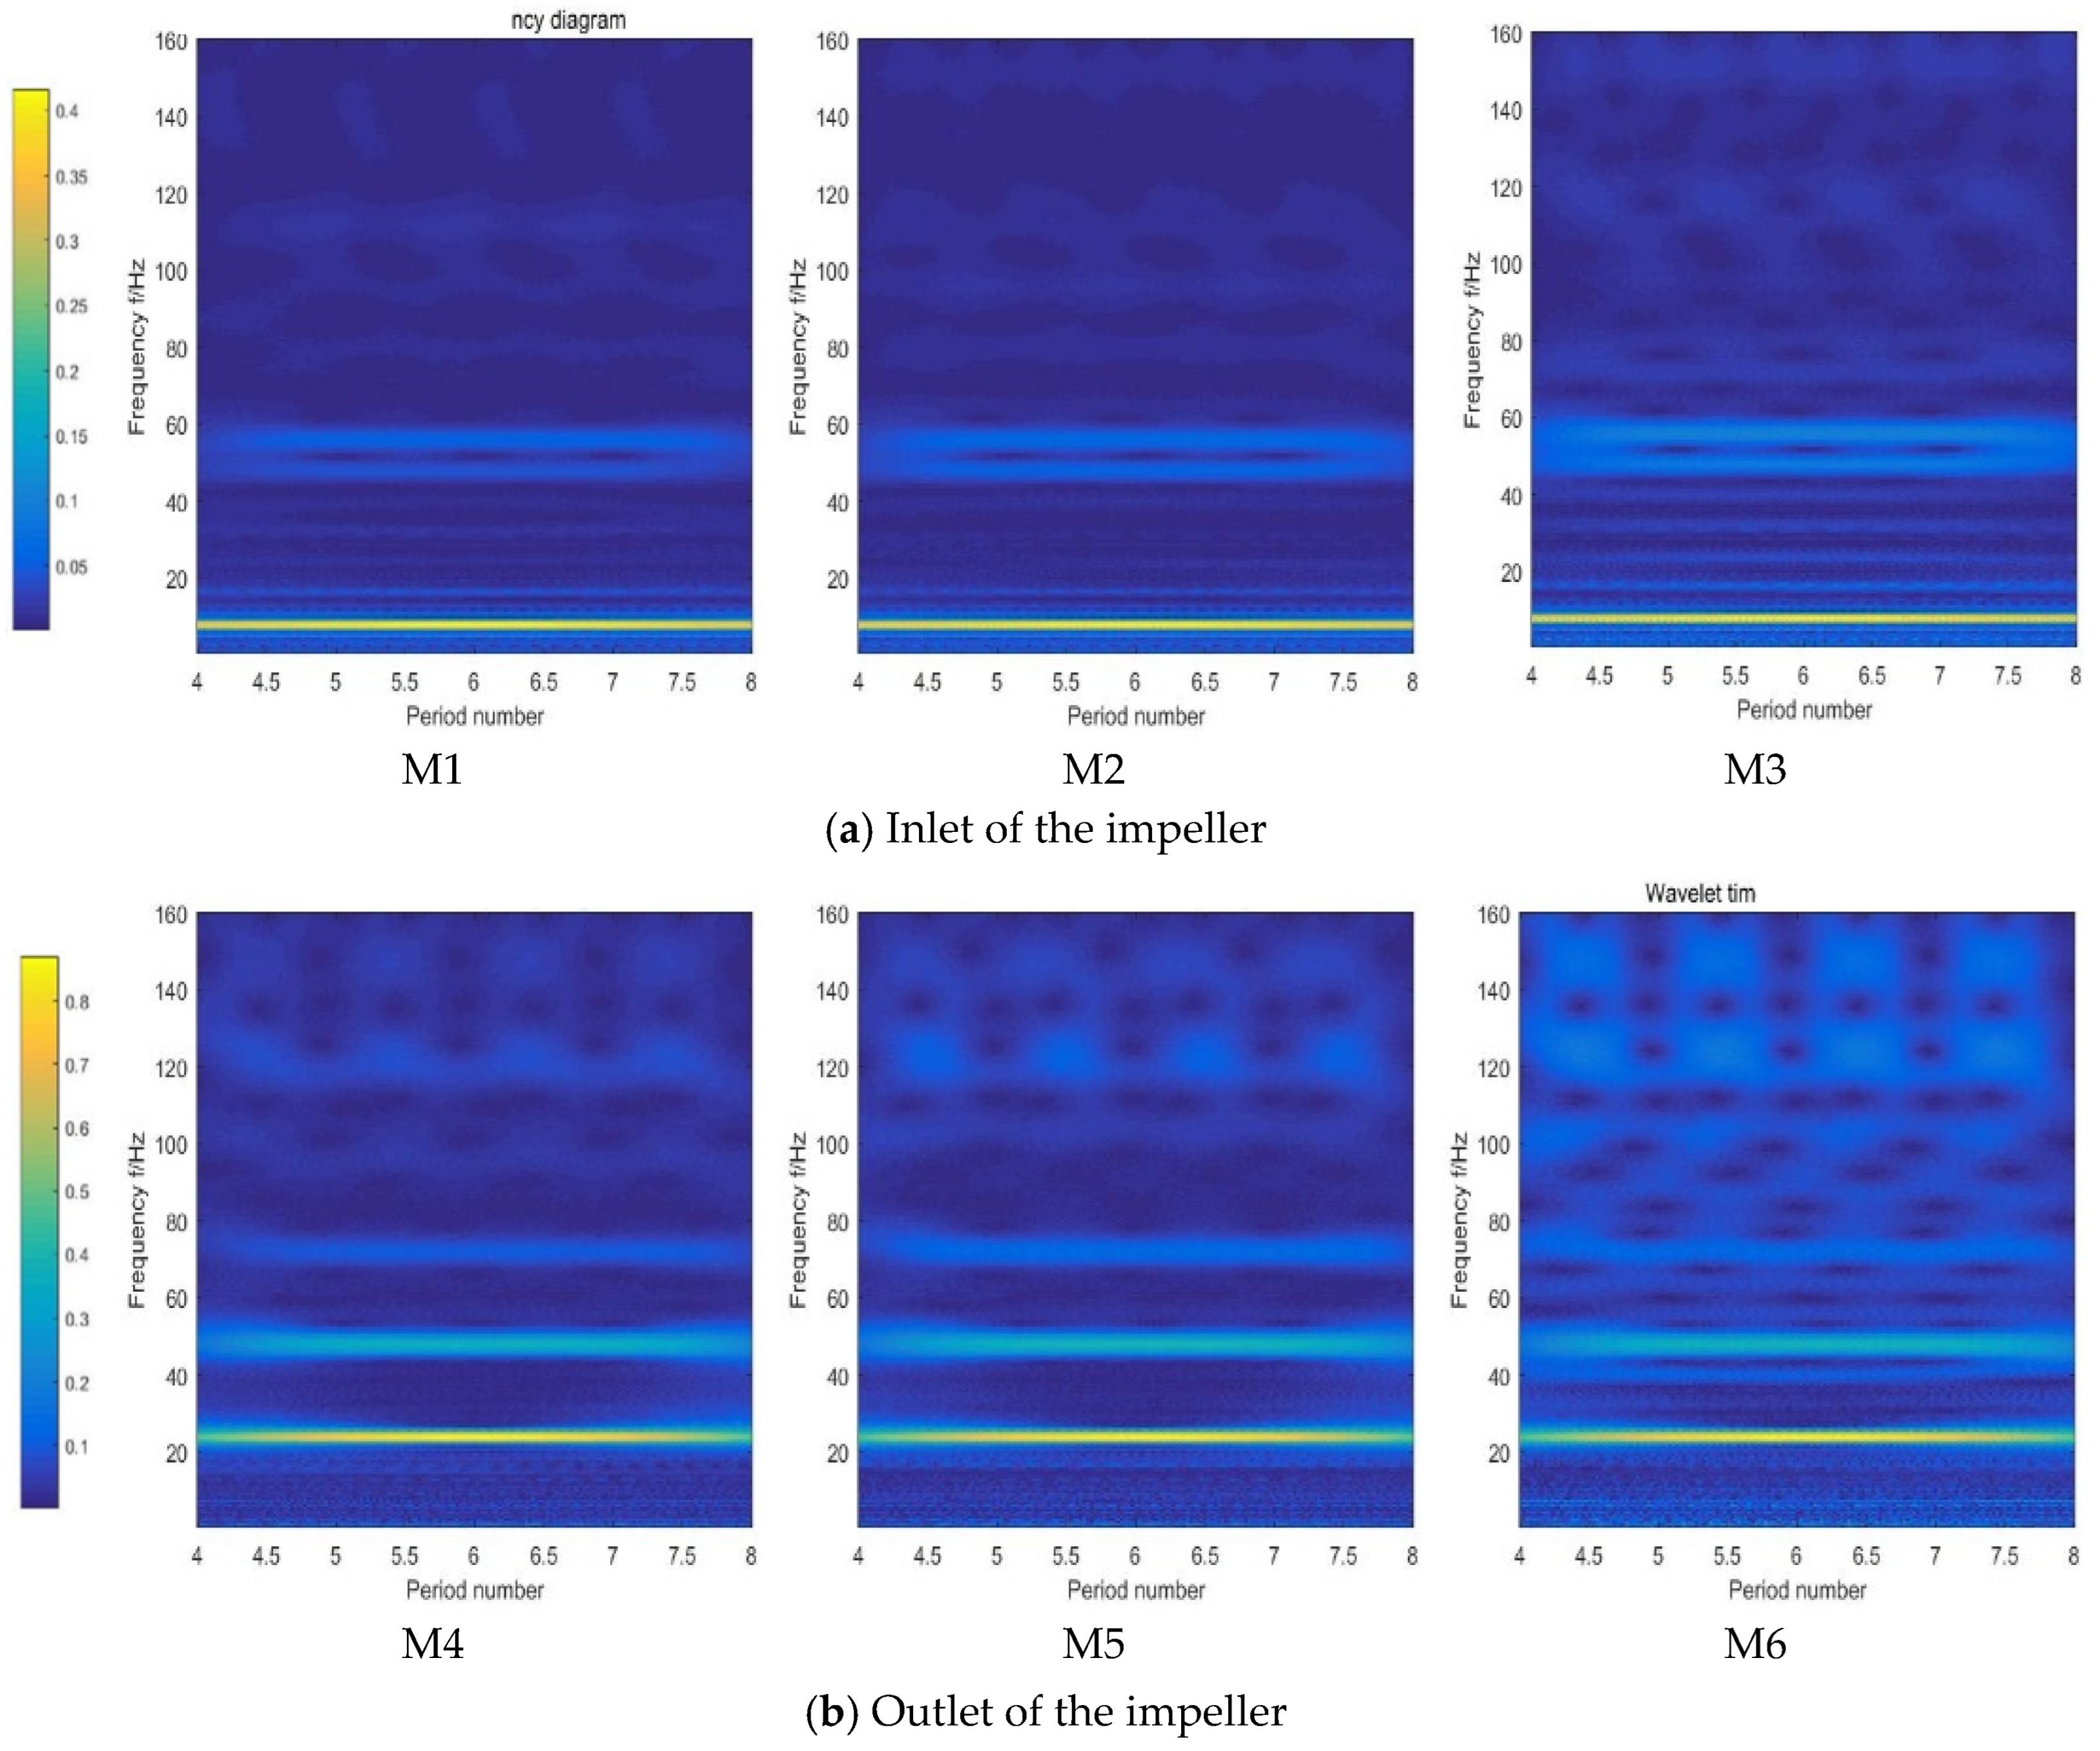
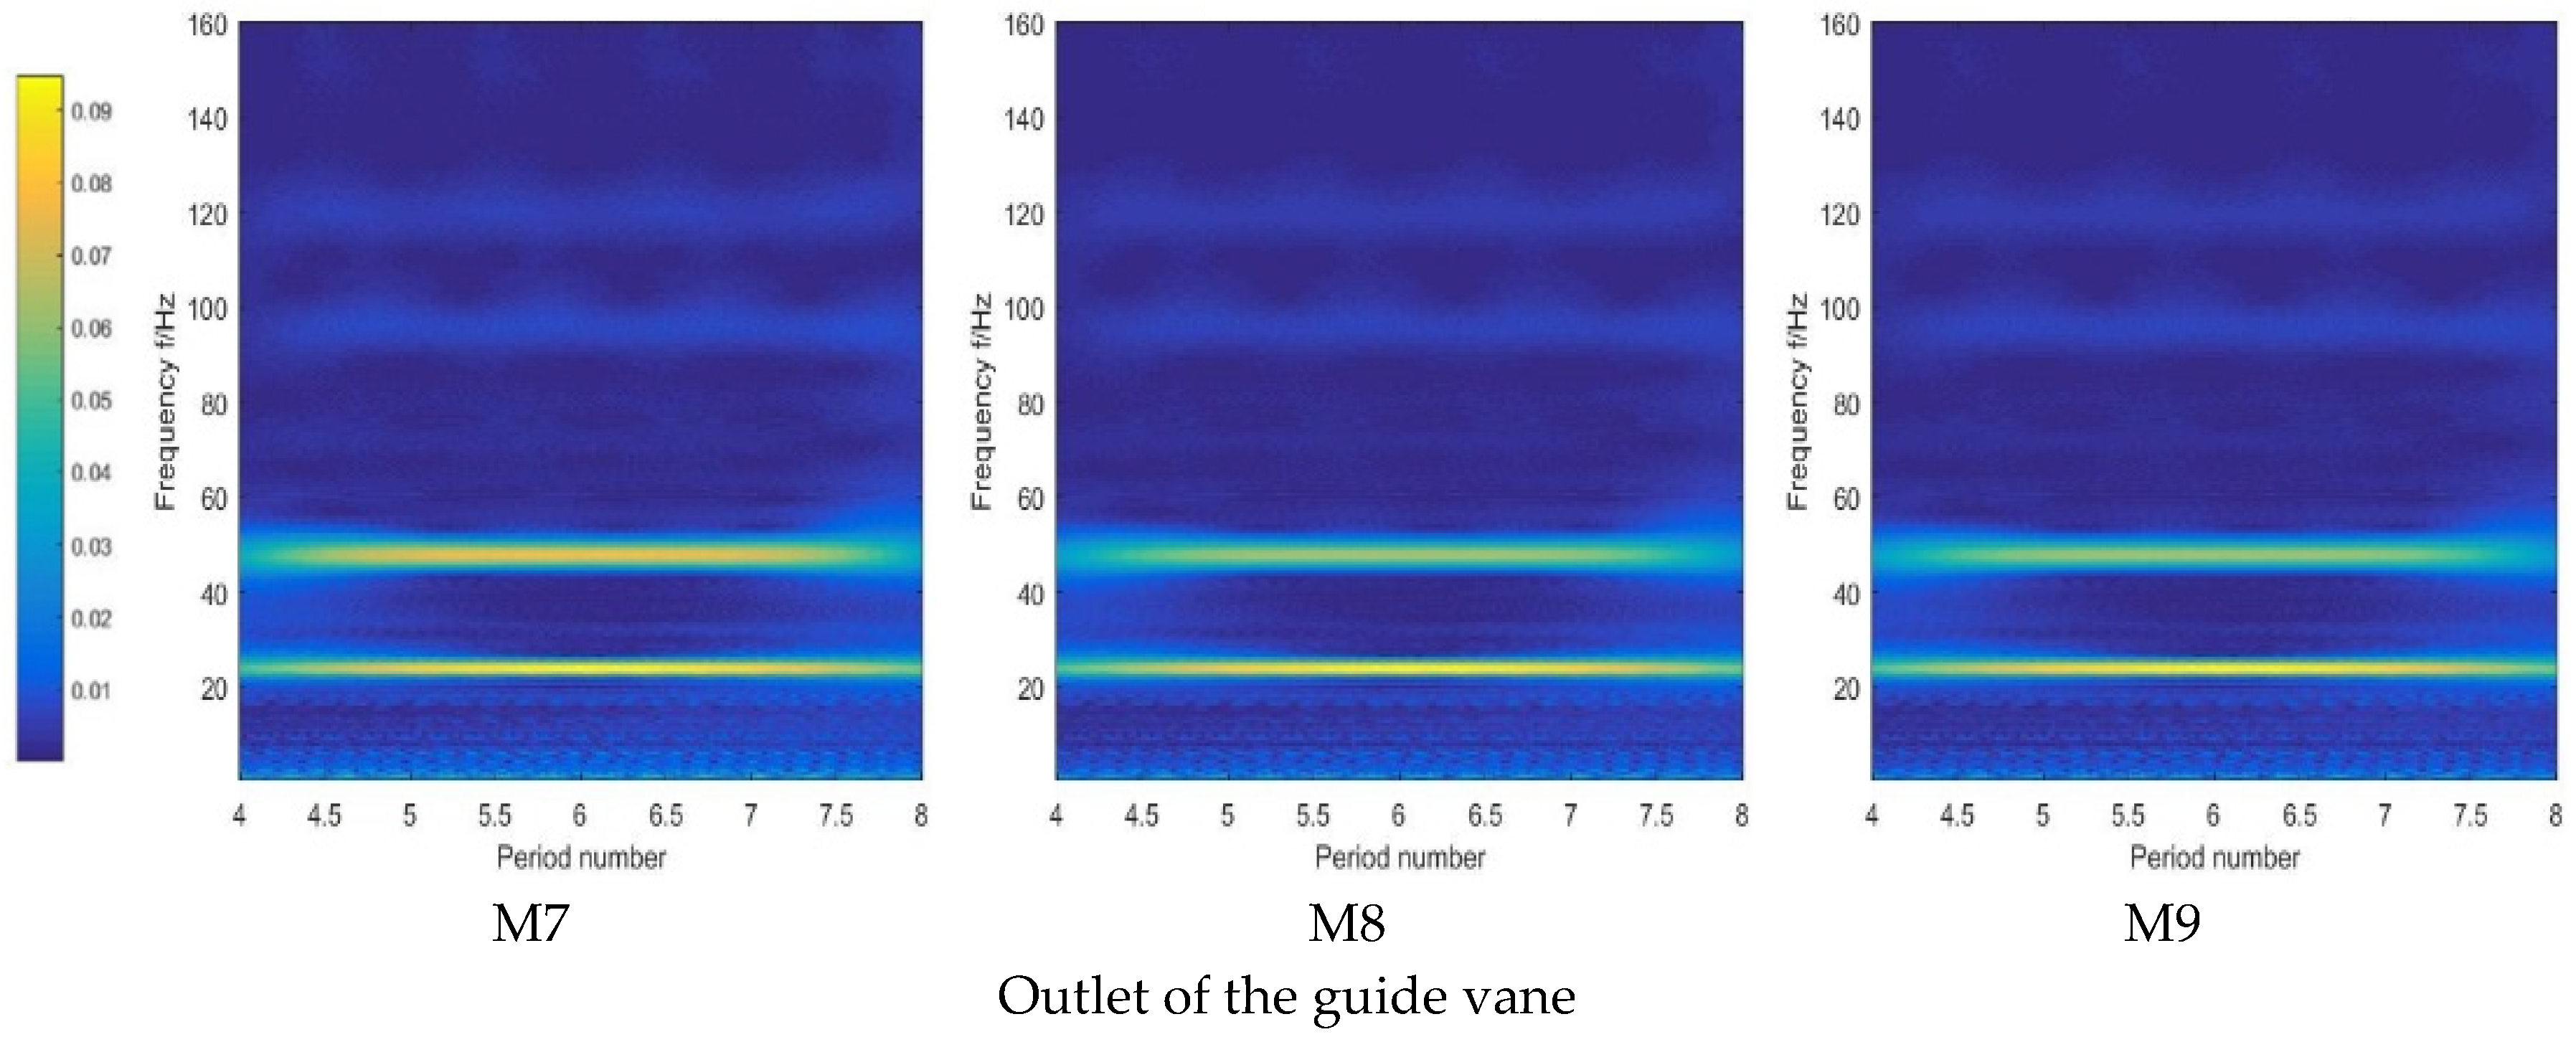
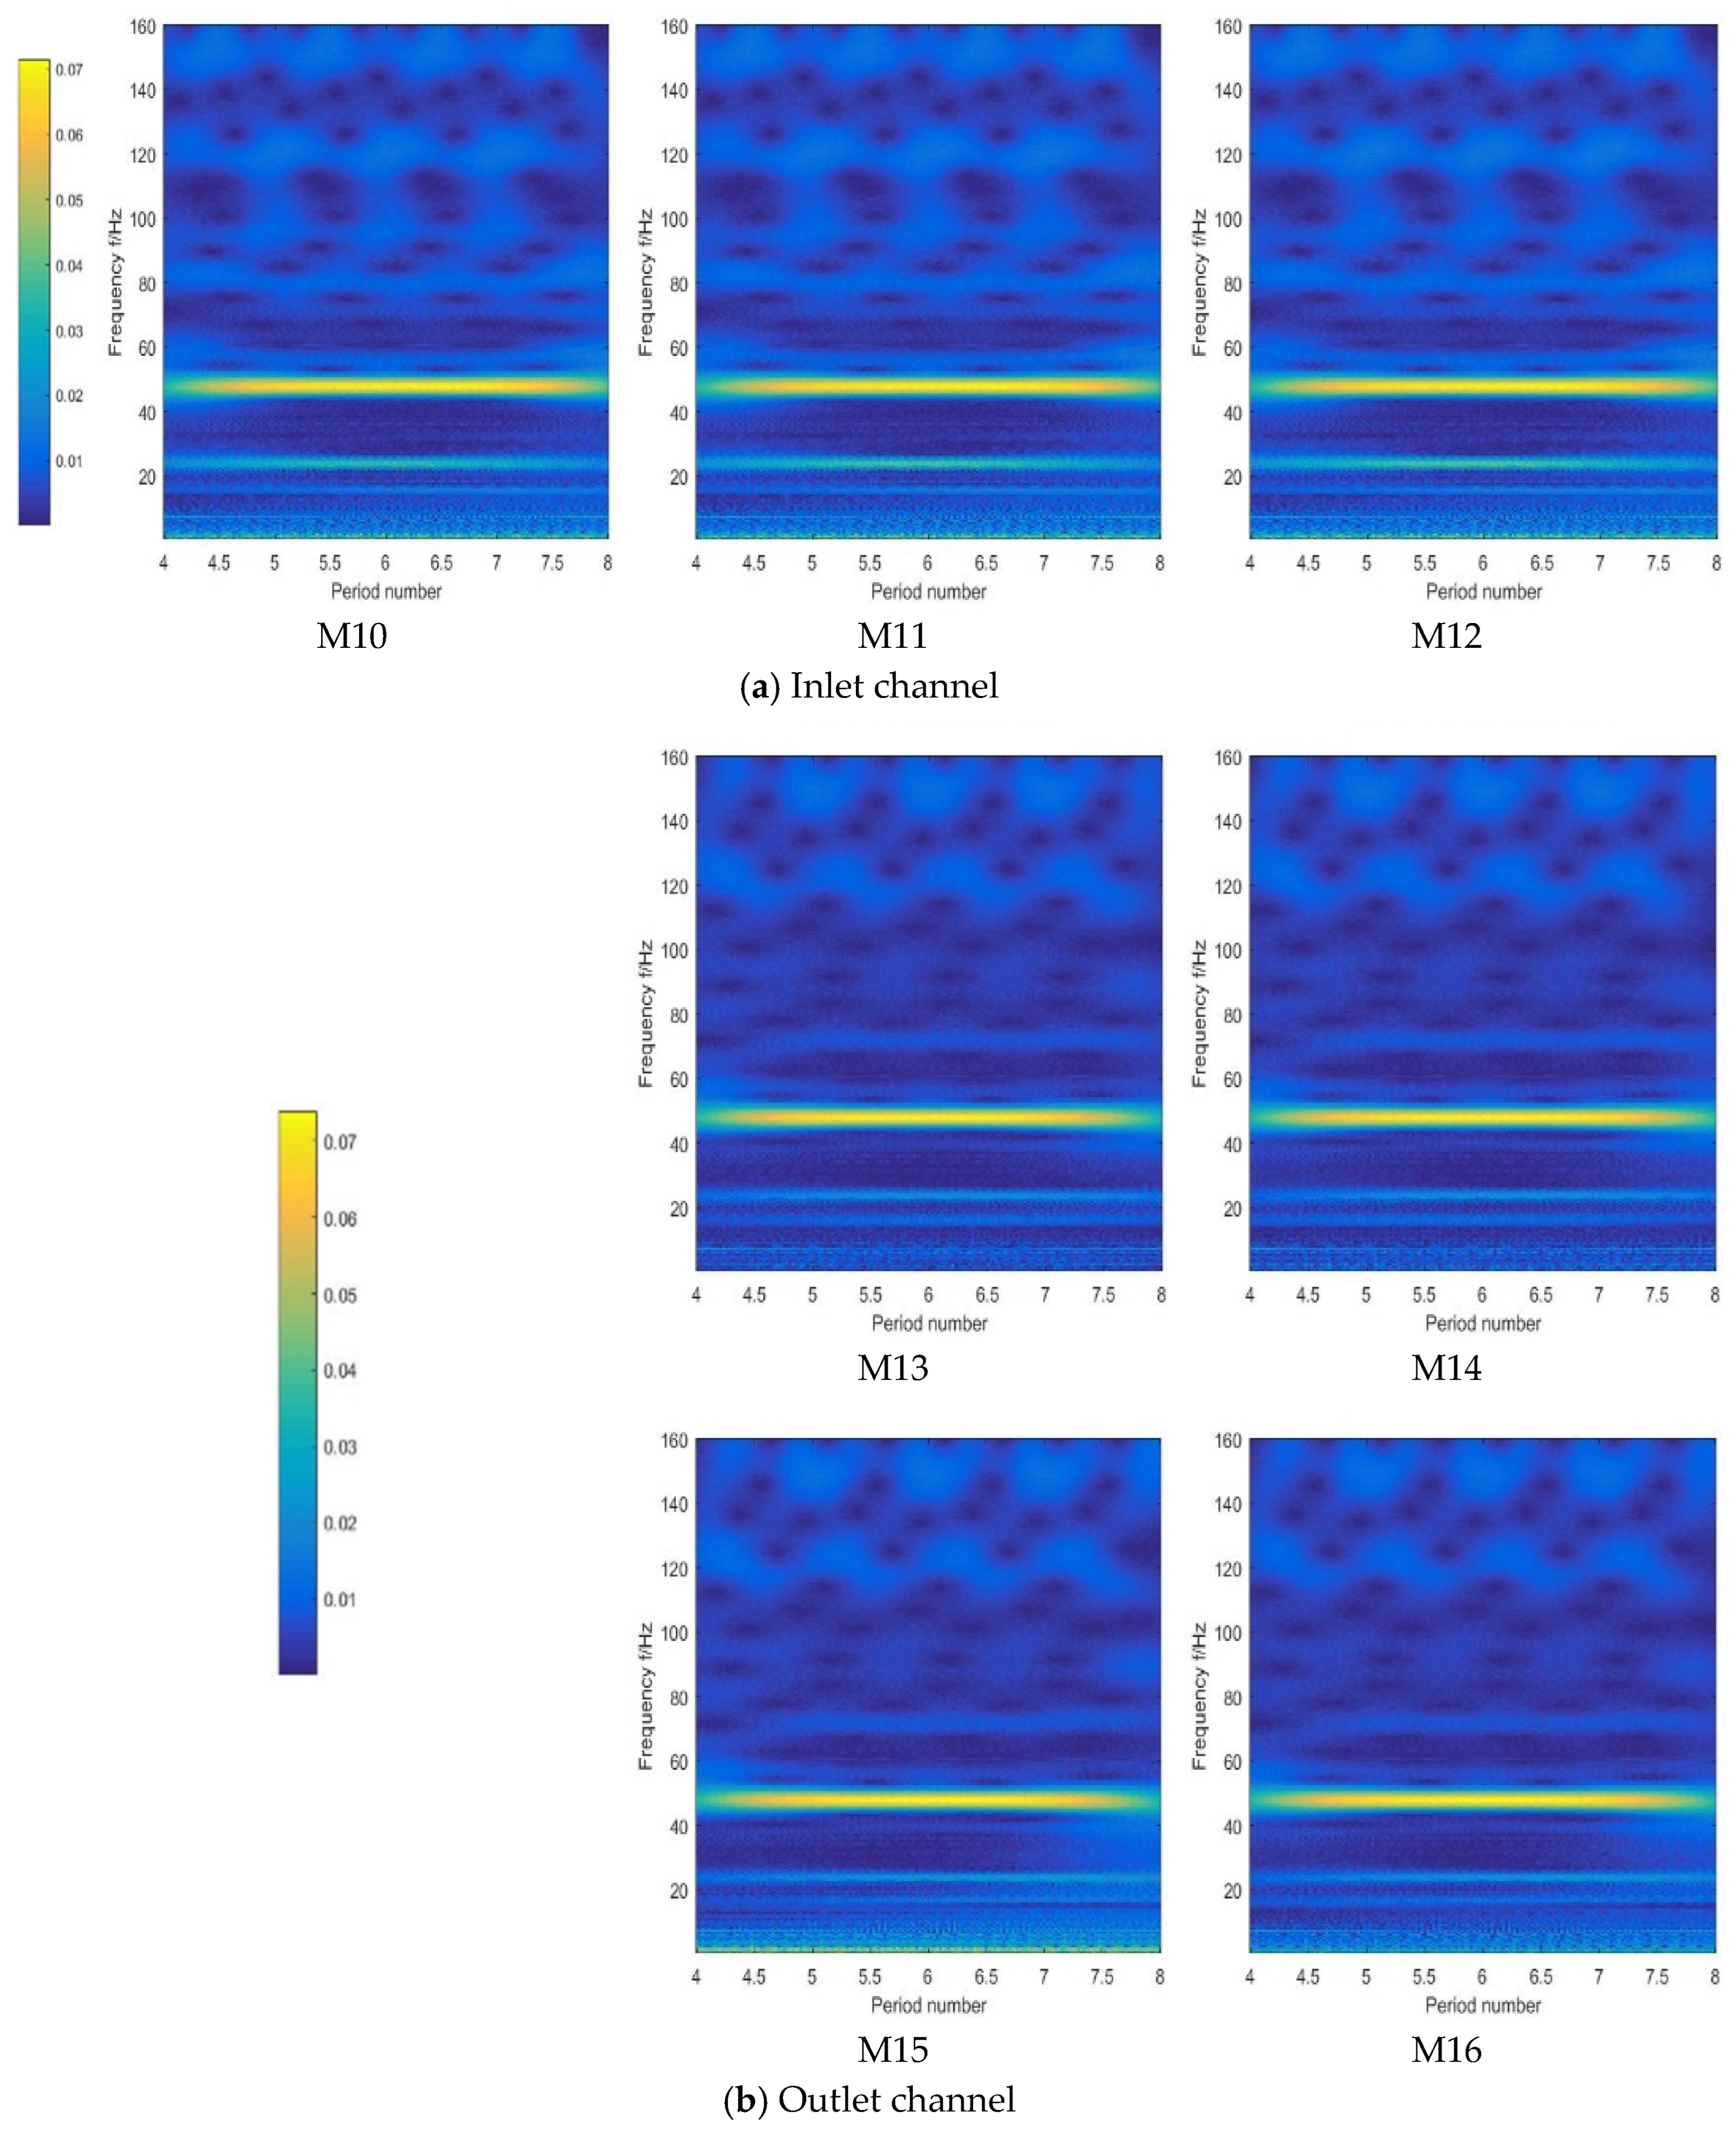
Under the ultra–low–head condition, when the rotational speed is 150 r/min, the pump shaft frequency is 2.5 Hz. The impeller has three blades, so the corresponding blade-passing frequency (BPF) is 7.5 Hz. The wavelet time–frequency domain conversion is achieved by using the MATLAB R2023a “cwt” function to plot the time–frequency distribution of pressure fluctuation at different monitoring points, which is shown in Figure 5, Figure 6 and Figure 7 The horizontal coordinate indicates the period number, the vertical coordinate indicates the frequency, and the colors indicate the fluctuation amplitude; the dimensionless pressure fluctuation coefficient Cp is introduced [48].
C p = p 0 p 0 ¯ ρ g H 0
Here, p0 is the instantaneous pressure at each measuring point, p - 0 is the averaged pressure at each monitoring point, ρ is the water density, g is the acceleration of gravity, and H0 is the head under the corresponding flow.
Define the number of rotation periods as N = t T , where t is the acquisition time of the signal at any point and T is the time of one cycle of impeller rotation. To demonstrate the time domain pattern of the fluctuation, the pressure fluctuation data of four cycles are shown in the time–frequency diagrams in this paper.
As can be seen from Figure 5 and Figure 6, the frequency of each monitoring point at the impeller and guide vane (M1–M9) does not change with time, and the pressure fluctuation is a stable signal. It can be seen from Figure 5 that low frequencies dominate the pressure fluctuation at the impeller inlet (M1–M3). Due to the influence of the impeller rotation, the main frequency of the pressure fluctuation at the monitoring point at the impeller inlet (M1–M3) is two times the impeller rotation frequency. The secondary main frequency is six times the impeller rotation frequency, while at seven times the impeller rotation frequency, a larger fluctuation amplitude also appears. The reason for this is that the rotating water flow in the impeller impacts the stationary guide vane, and the dynamic and static interference effect is significant. As the monitoring points are arranged from the hub to the rim, the amplitude of the pressure fluctuation coefficient gradually decreases.
The main frequency of pressure fluctuation at the impeller outlet (M4–M6) is 3 times the impeller rotation frequency, the secondary frequency is 6 times the impeller rotation frequency, and a large amplitude at 10 times the impeller rotation frequency. Compared with the impeller inlet (M1–M3), the amplitude of the pressure fluctuation coefficient increases as a whole, and the proportion of high frequency increases slightly. As the monitoring points are arranged from the hub to the rim, the amplitude of the pressure fluctuation coefficient gradually decreases. In particular, according to the wavelet time–frequency diagram, the high-frequency part has fluctuating signals that change continuously with time, and the amplitude at the rim (M1) is larger than that at the hub (M3). This is because the rim region has a higher linear velocity, resulting in more intense flow. This leads to stronger shear and turbulence effects. Additionally, complex flow structures such as blade wakes and vortices are more pronounced near the rim, further amplifying the pressure fluctuations.
It can be seen from Figure 6 that the main frequency of pressure fluctuation at the outlet of the guide vane (M7–M9) is three times the impeller frequency, and the secondary frequency is six times the impeller frequency. The amplitude of the main frequency is similar to that of the secondary frequency, and the low-frequency signal is dominant. In addition, there are small peaks at 13 times the impeller frequency and 16 times the impeller frequency.
It can be seen from Figure 7 that the main frequency of pressure fluctuation at the monitoring point at the intake bell mouth of the inlet channel (M10–M12) is six times the impeller rotation frequency. The impeller rotation has no obvious effect on the pressure fluctuation at the monitoring point, and the fluctuation amplitude is significantly reduced. The proportion increased significantly compared to the impeller and the guide vane (M1–M9).
The wavelet time–frequency diagram of pressure fluctuation at four monitoring points in the outlet channel (M13–M16) is generally complex in frequency variation and distribution. The main frequency is six times the impeller rotation frequency. Because it is far from the impeller, the fluctuation is little affected by the impeller rotation. In particular, there is a fluctuating signal with time sinusoidal variation at the high frequency of the monitoring point in the outlet channel (M13–M16).

4.2. Chaotic Dynamics

4.2.1. Phase Diagram Analysis

The judgment, analysis, and prediction of chaotic time series are carried out in the reconstructed phase space, so the phase space reconstruction is an essential step in analyzing chaotic characteristics. Taking the pressure fluctuation of each monitoring point under the ultra-low-head condition as the analysis object, an m-dimensional phase space vector is constructed from the one-dimensional time series x n using different time delays τ, expressed as [49]
x i = x i ,   x i + π , ,   x i + m 1 τ
The mutual information method obtains the time delay τ, and the G-P algorithm obtains the embedding dimension m. The three-dimensional phase trajectory is plotted, as shown in Figure 8, Figure 9 and Figure 10, where x, (x + τ), and (x + 2τ) are the original time series and the reconstructed sequence under the corresponding time delay, respectively.
The phase trajectory diagram of the monitoring points at the inlet of the impeller (M1–M3) has a clear boundary, hierarchy, and regularity. From the hub to the rim, the overall shape of the phase trajectory diagram is similar, and it shows a gradual contraction state, corresponding to the weakening of the pressure fluctuation signal. Although the phase trajectory at the outlet of the impeller (M4–M6) is generally shrinking, the folding is disorderly and irregular due to backflow or tip vortex inside the impeller. The phase trajectory of the monitoring points at the outlet of the guide vane (M7–M9) is twisted circular. Compared with the inlet of the impeller (M1–M3), the trajectory is smoother, the burrs and bulges are less, and the chaotic characteristics are obvious.
Due to being far from the fluctuation source, the pressure fluctuation signal of the monitoring point at the intake bell mouth of the inlet channel (M10–M12) is complex and disordered. The phase trajectory diagram is a strip geometry, and the boundary burrs and bulges are more, and the regularity is not obvious. The monitoring points at the top of the outlet channel (M13–M14) are far away from the fluctuation source. Combined with the influence of flow disturbance in the channel, the phase trajectory diagram has irregular geometry. The phase trajectory diagram of the monitoring points at the floor of the outlet channel (M15–M16) is a strip geometry with a trend of outward divergence, and the chaotic characteristics are not obvious.
Although the phase trajectories of pressure fluctuation signals at different monitoring points have regular changes, it is difficult to judge and describe them accurately in the actual operation. Therefore, this paper uses the maximum Lyapunov index, correlation dimension, and other chaotic characteristics to analyze the pressure fluctuation signals quantitatively.

4.2.2. Maximum Lyapunov Exponent Analysis

Lyapunov exponent measures the degree to which two adjacent trajectories with different initial conditions attract or separate exponentially over time. The system converges to a fixed point when the maximum Lyapunov exponent is less than 0. When the maximum Lyapunov exponent is greater than 0, the system will neither be stable at the fixed point, nor have stable periodic solutions, nor will it diverge, indicating that the system enters chaos. The system is critical when the maximum Lyapunov exponent equals 0. The maximum Lyapunov exponent at each monitoring point was calculated using the Wolf algorithm. The specific procedure is as follows:
(1)
The pressure fluctuation time series is denoted as x t i ,   i = 1 ,   2 ,   ,   N , where N represents the endpoint of the time series.
(2)
The time delay τ is determined using the mutual information method.
(3)
The embedding dimension m was determined by comparing the results of the Cao method and the saturated correlation dimension (G-P) method.
(4)
The phase space was reconstructed based on the time delay τ and the embedding dimension m [50]:
Y t = Y t + Y t + τ , , Y t m 1 τ , t = 1,2 , , M
where M = N m + 1 τ .
(5)
Assume that the initial point in the reconstructed phase space is Y t 0 , and its distance from the nearest neighbor Y 0 t 0 is L 0 . The temporal evolution of these two points is then tracked. At time t i , if the separation becomes L 0 = Y t 1 Y t 0 > ε , where ε ε > 0 is a predefined threshold, the point Y t 1 is retained. A new neighboring point Y 1 t 1 is then selected within the vicinity, satisfying L 0 = Y t 1 Y t 0 < ε , ensuring the angle between the vectors remains as small as possible. This process is repeated until all available data points in the time series are traversed. After a total iteration time of t M t 0 , the maximum Lyapunov exponent λ 1 can be expressed as [51].
λ 1 = 1 t M t 0
L 0 = Y t i Y t i i
L 0 = Y t i Y t i i
where Y i t i denotes a point within the ε-neighborhood of the state Y t i at time t i .
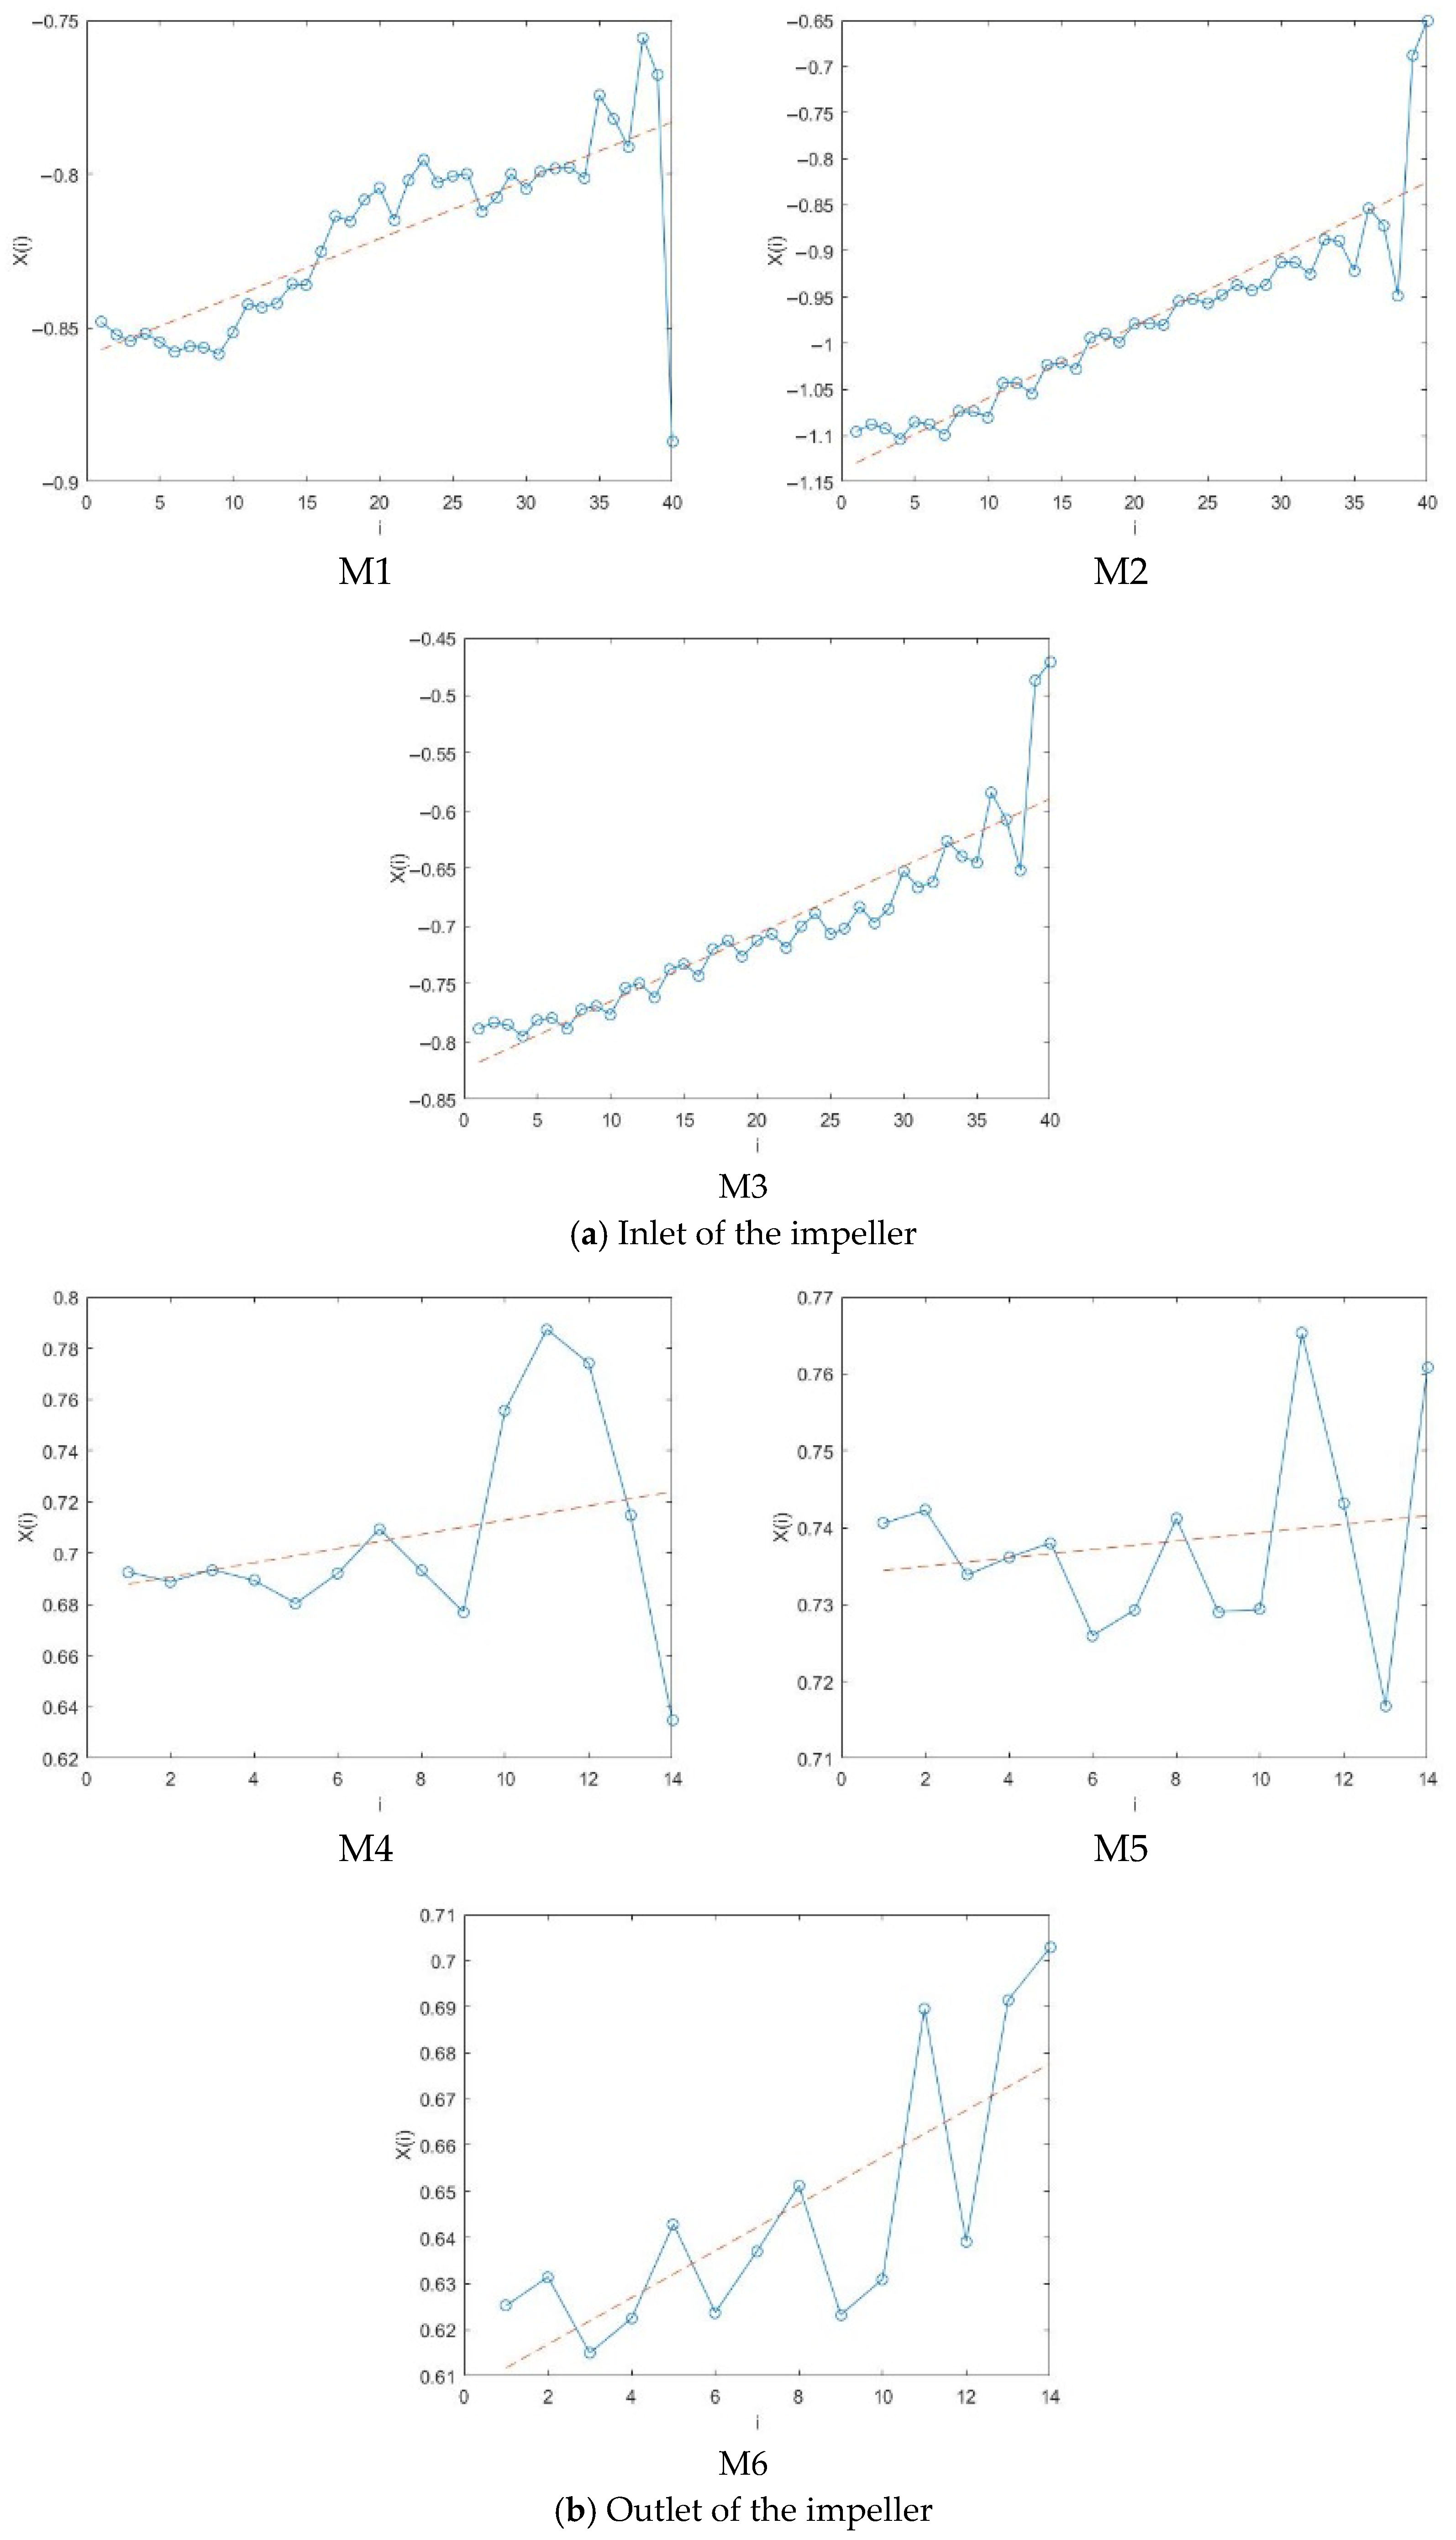
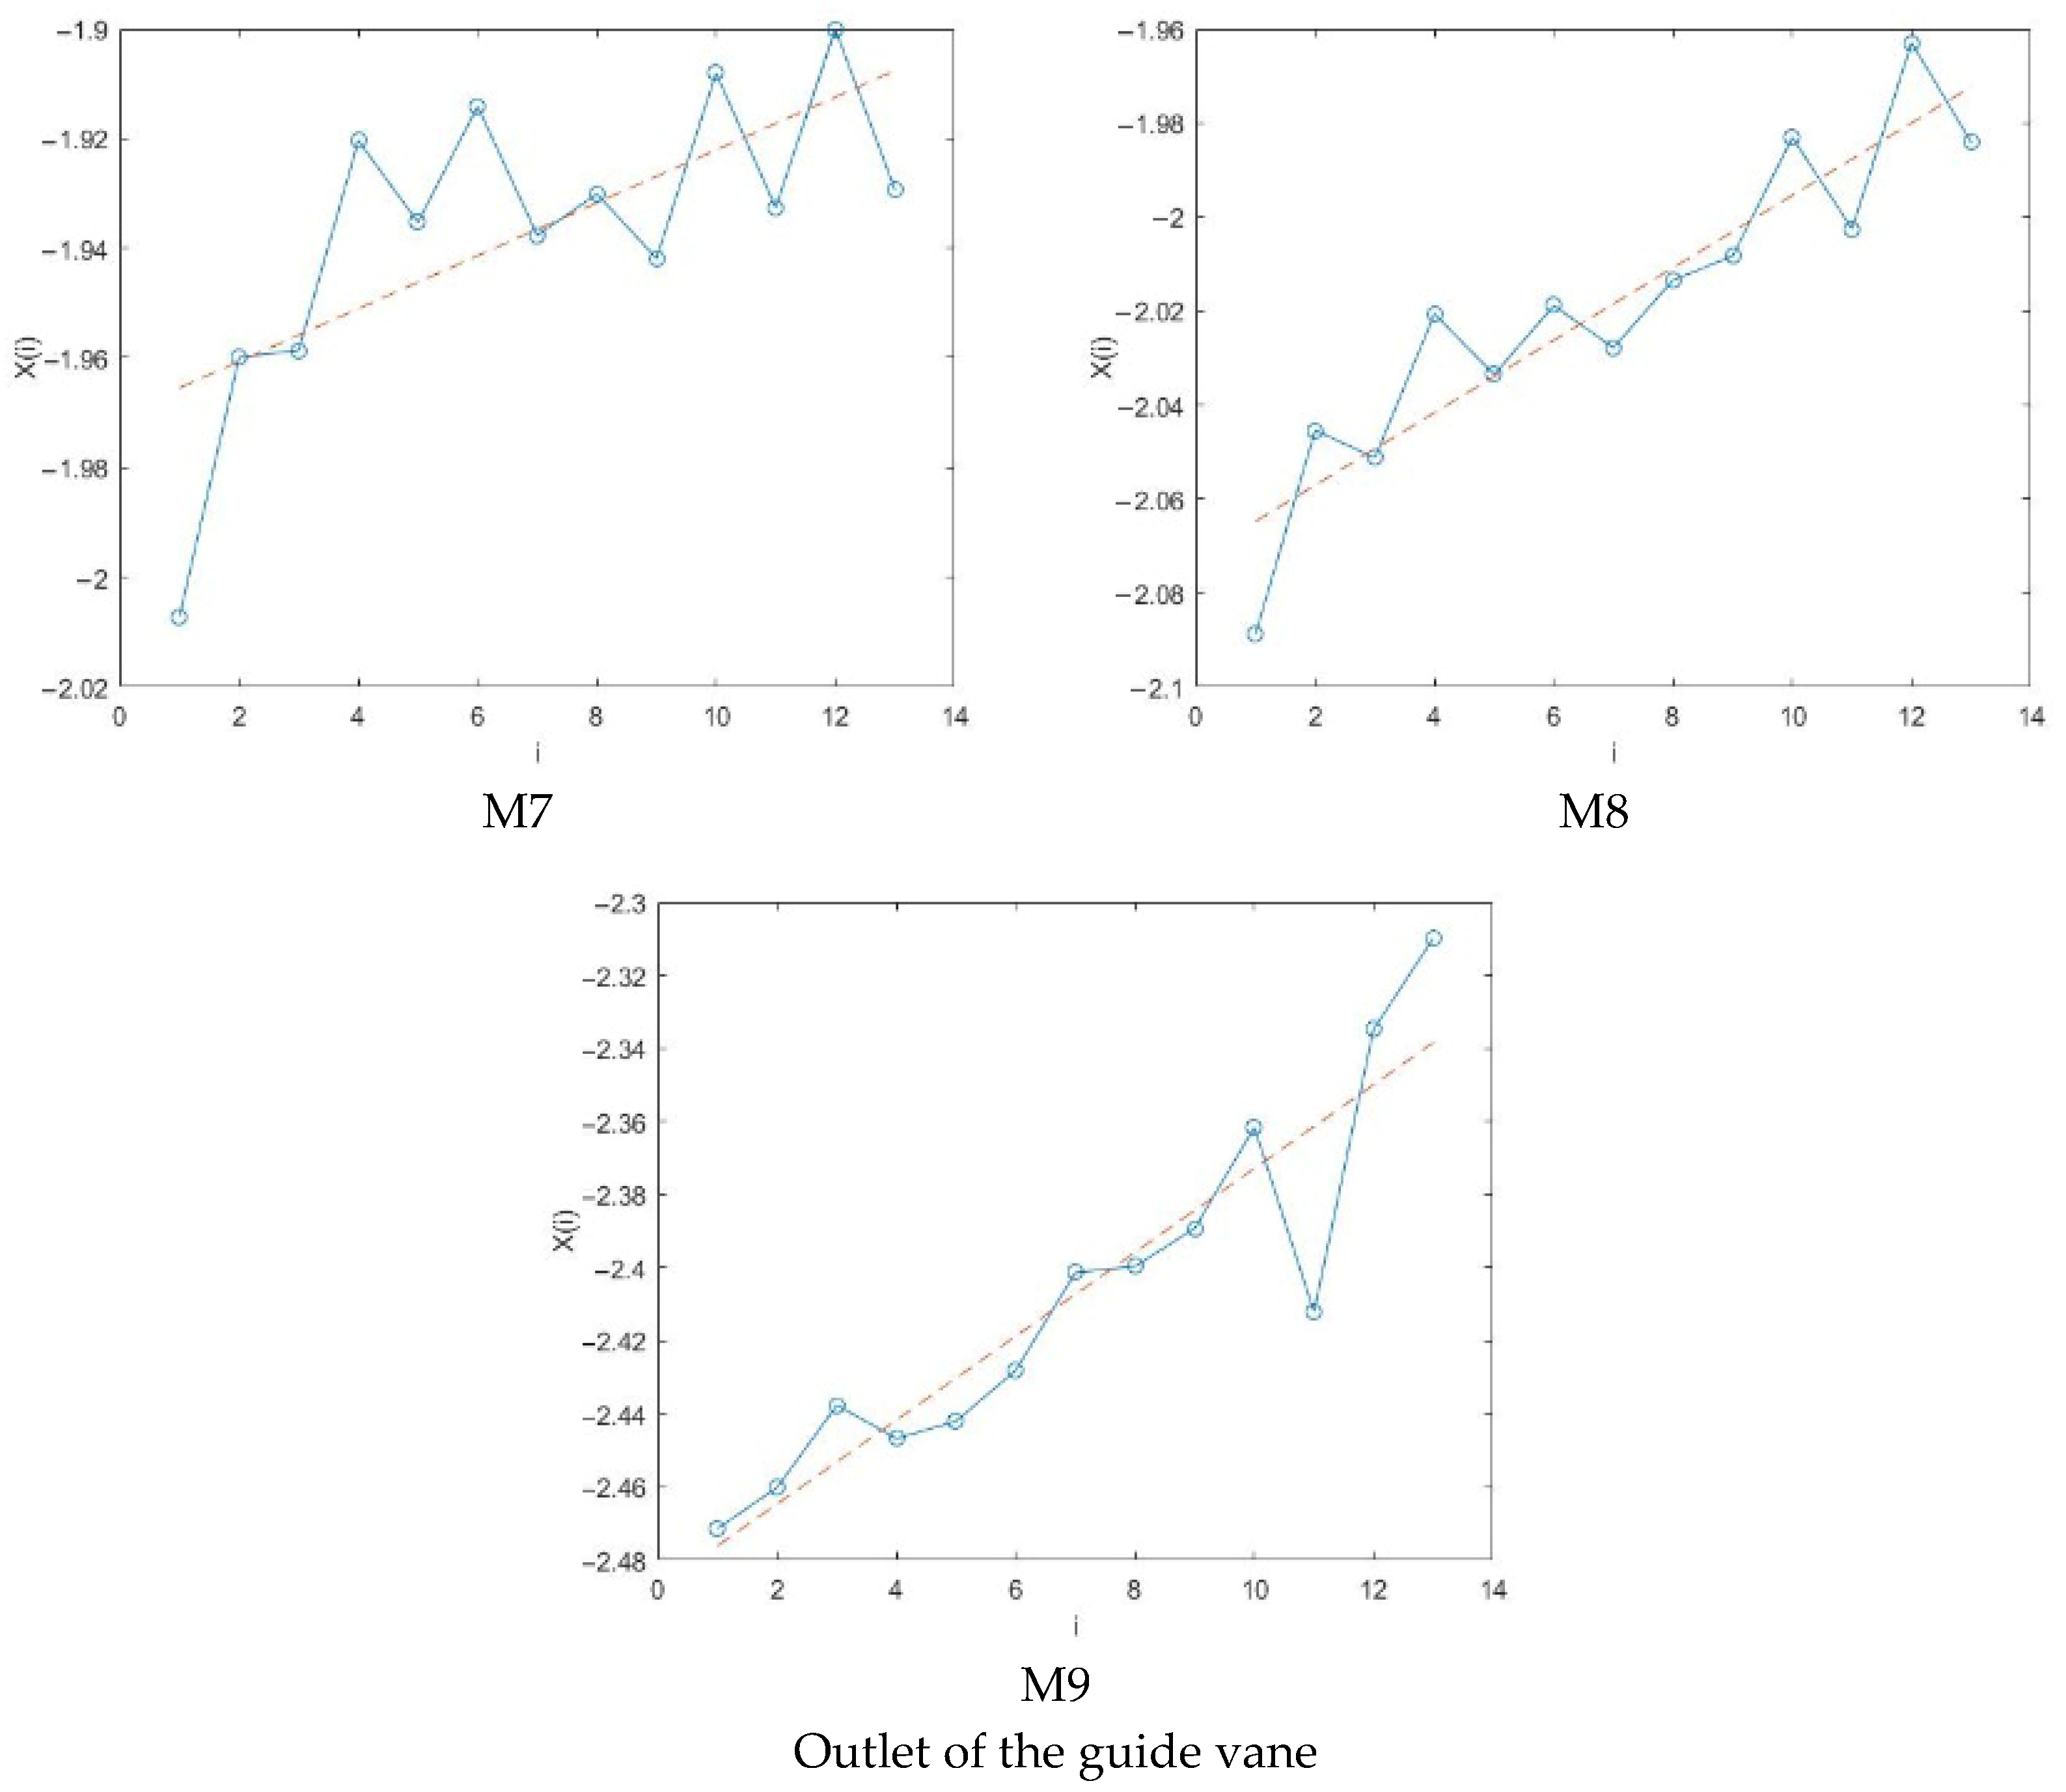
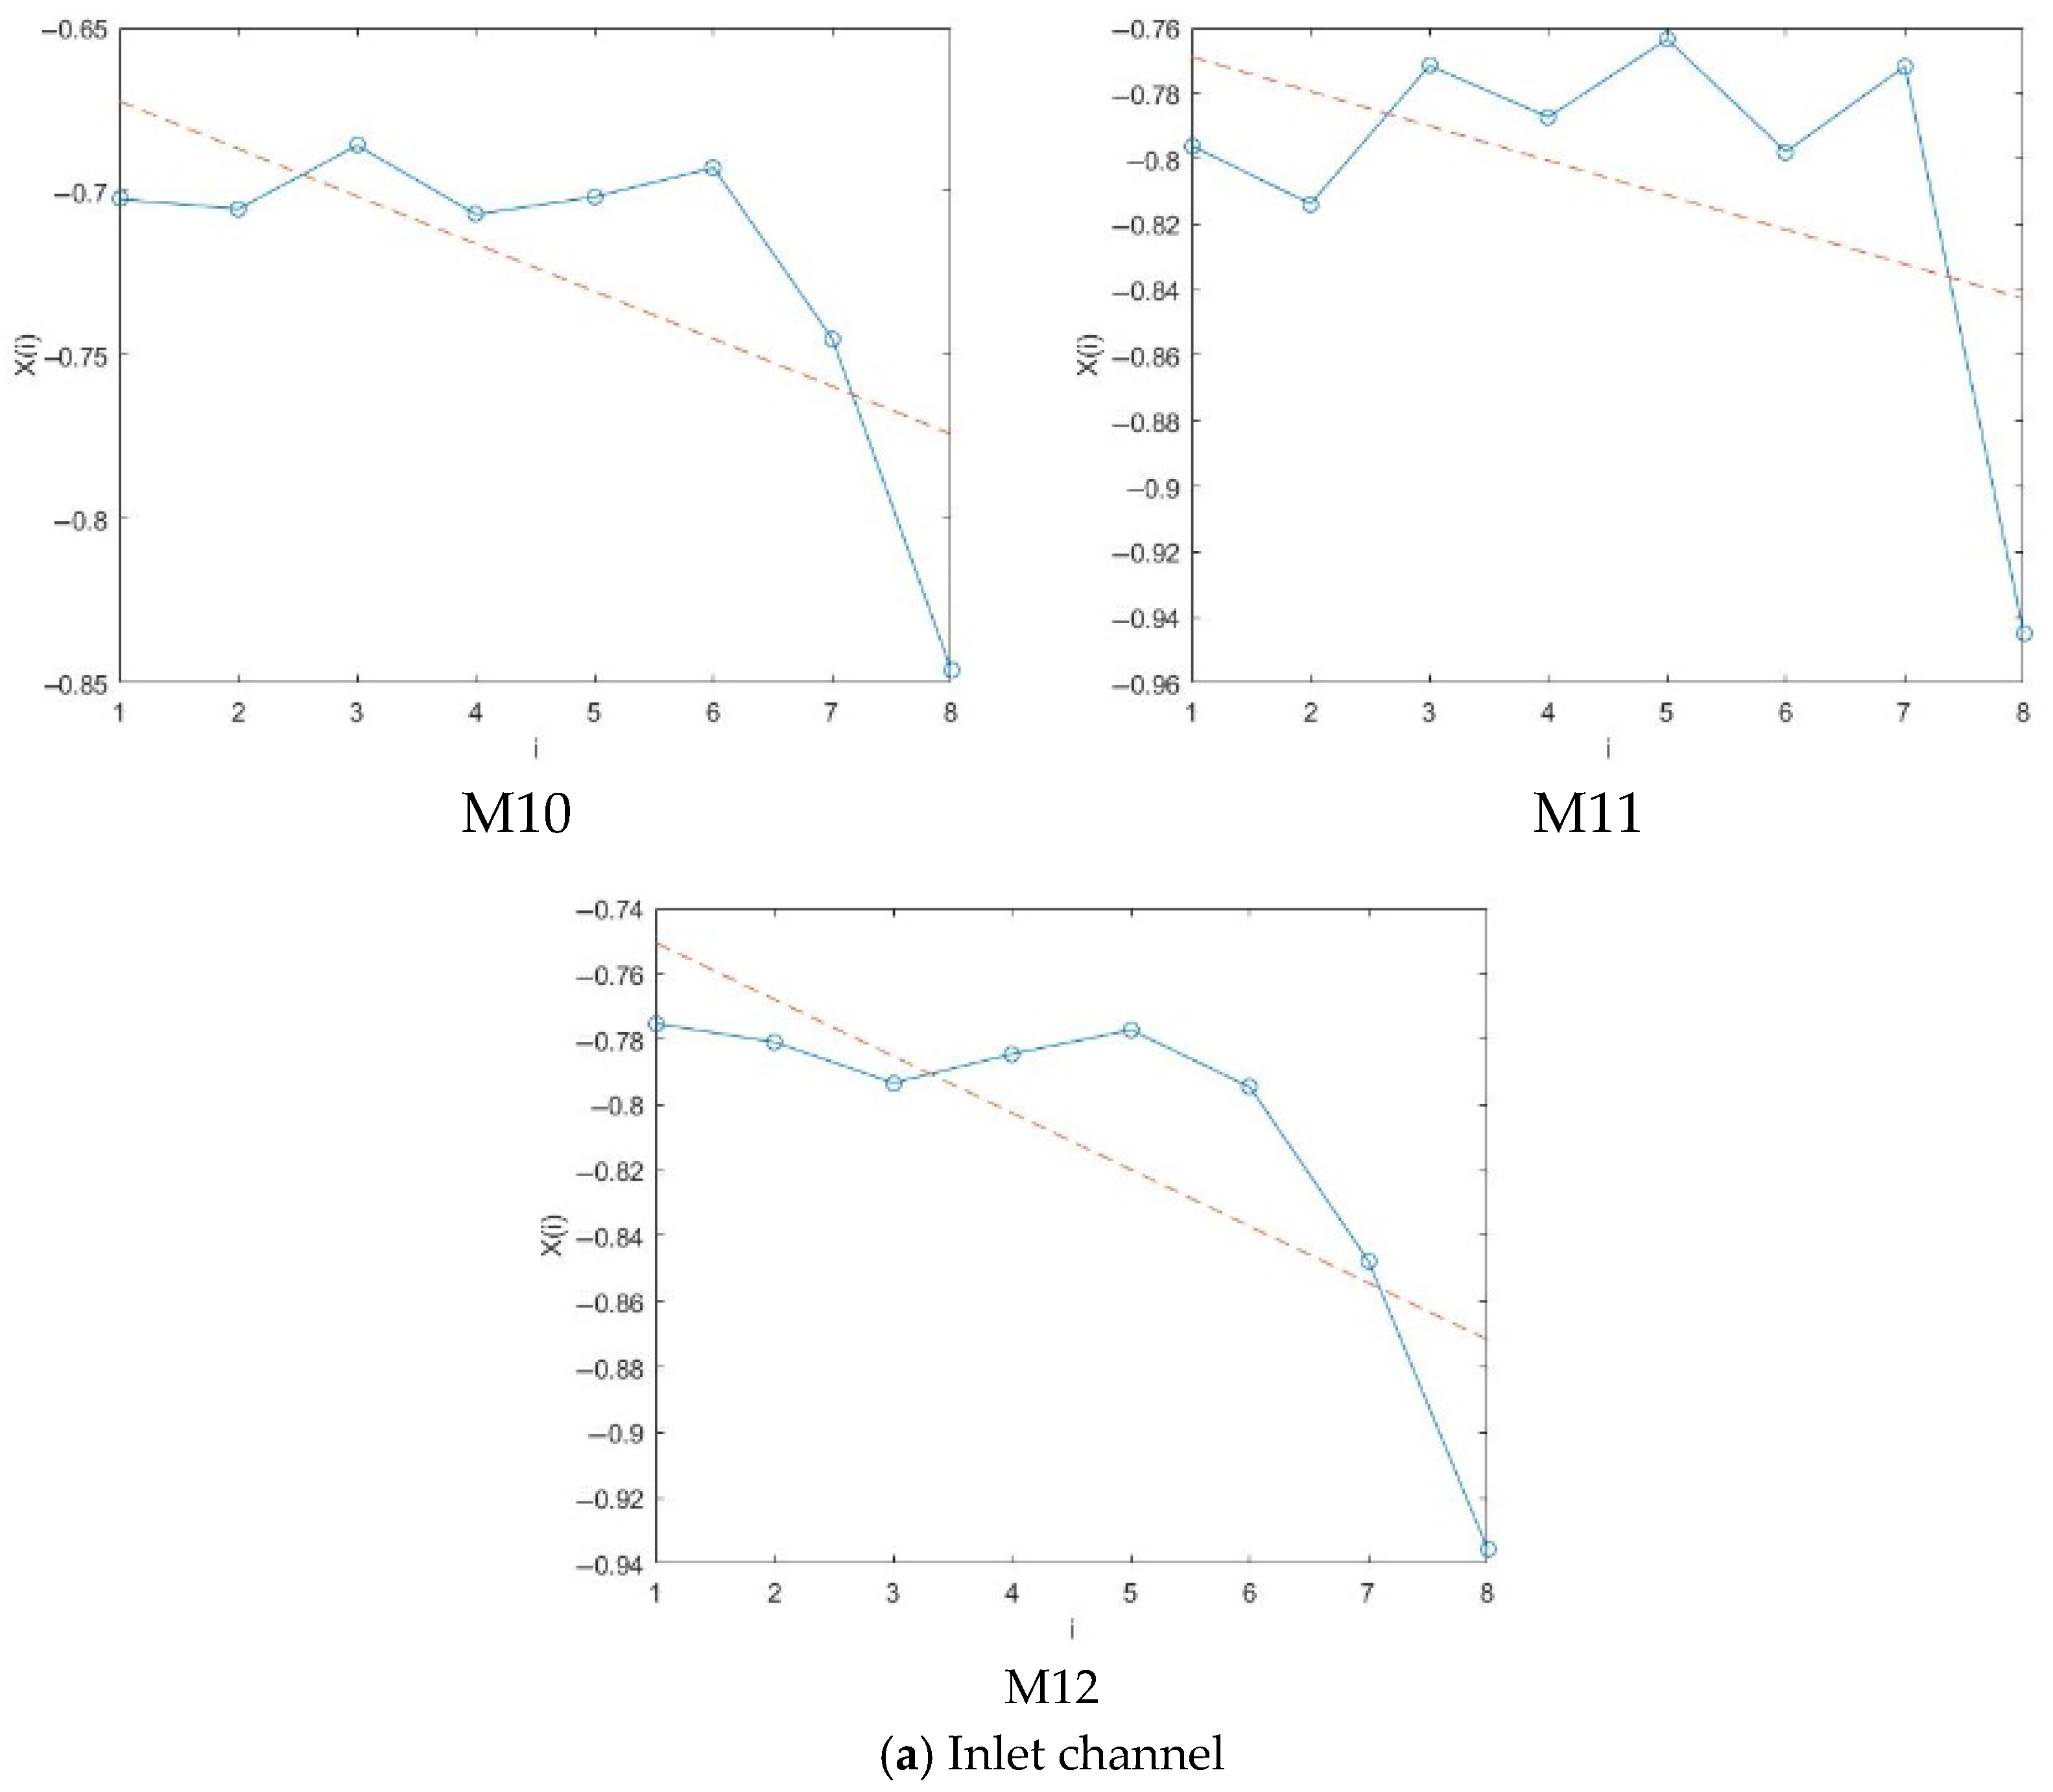
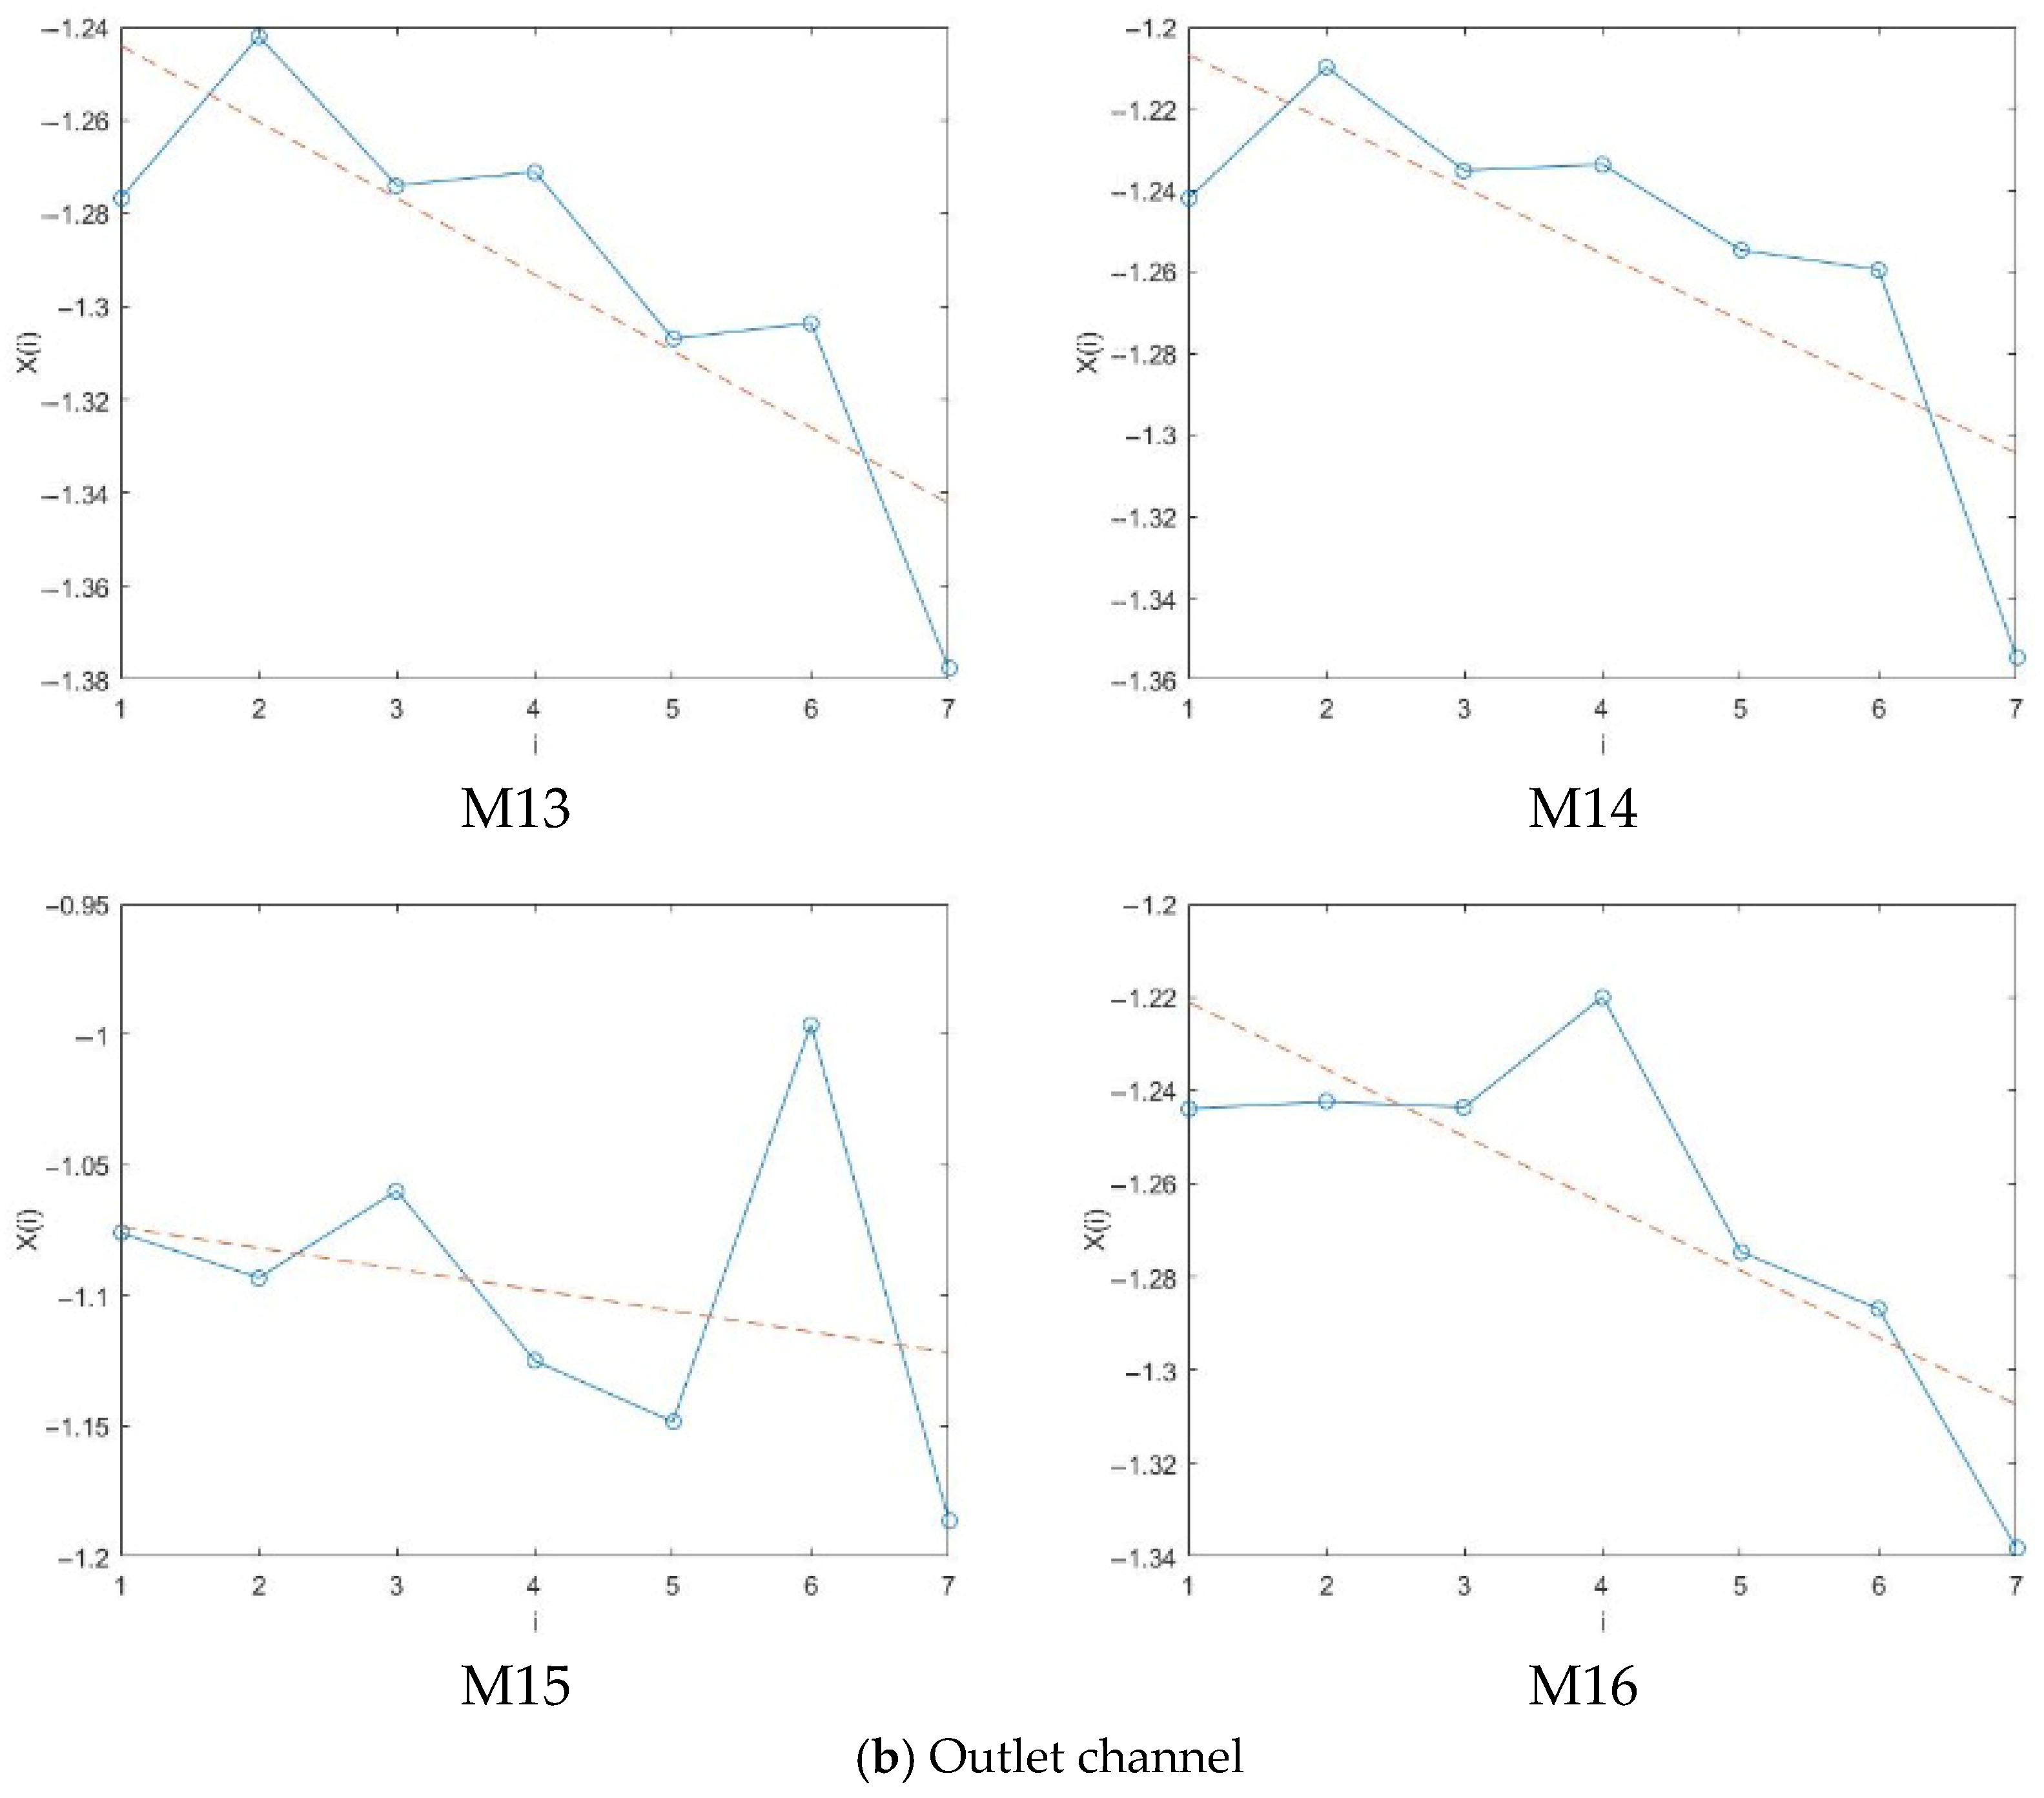
Figure 11, Figure 12 and Figure 13 shows the X(i)-i curves for each pressure monitoring point. The maximum Lyapunov exponents of the pressure fluctuation signals at the monitoring points of the impeller and the guide vane (M1–M9) are greater than 0, which are 0.0019, 0.0078, 0.0059, 0.0028, 0.00055, 0.0051, 0.0048, 0.0077, and 0.0115, respectively, indicating that the pressure fluctuation signals at each point have chaotic characteristics due to the rotation of the impeller. The maximum Lyapunov exponents of the pressure fluctuation signals at the monitoring points at the intake bell mouth (M10–M12) and the outlet channel (M13–M16) are less than 0. The reason for this is that the inlet and outlet channels are far from the impeller and less affected by the impeller rotation, mainly due to the flow disturbance. The pressure fluctuation signal here does not have chaotic characteristics. The farther away from the impeller, the weaker the chaotic characteristics of the pressure fluctuation signal.

4.2.3. Correlation Dimension Analysis

In 1983, Grassberger and Procaccia proposed the correlation dimension calculation method (G-P algorithm) based on the time-delay embedding method. They introduced the concept of the correlation integral, along with the corresponding calculation formula, as follows [52]:
C   r = 1 N 2 i , j = 1 V Θ r x i x j
where C   r represents the probability that the distance between two points x i and x j in the phase space is less than r, N is the total number of data points, Θ denotes the Heaviside step function, x i and x j are points from the time series, and r is a predefined distance, which is closely related to the correlation integral function C   r .
The following relationship exists between C   r and the correlation dimension d:
d = lim r 0 I n C I n r
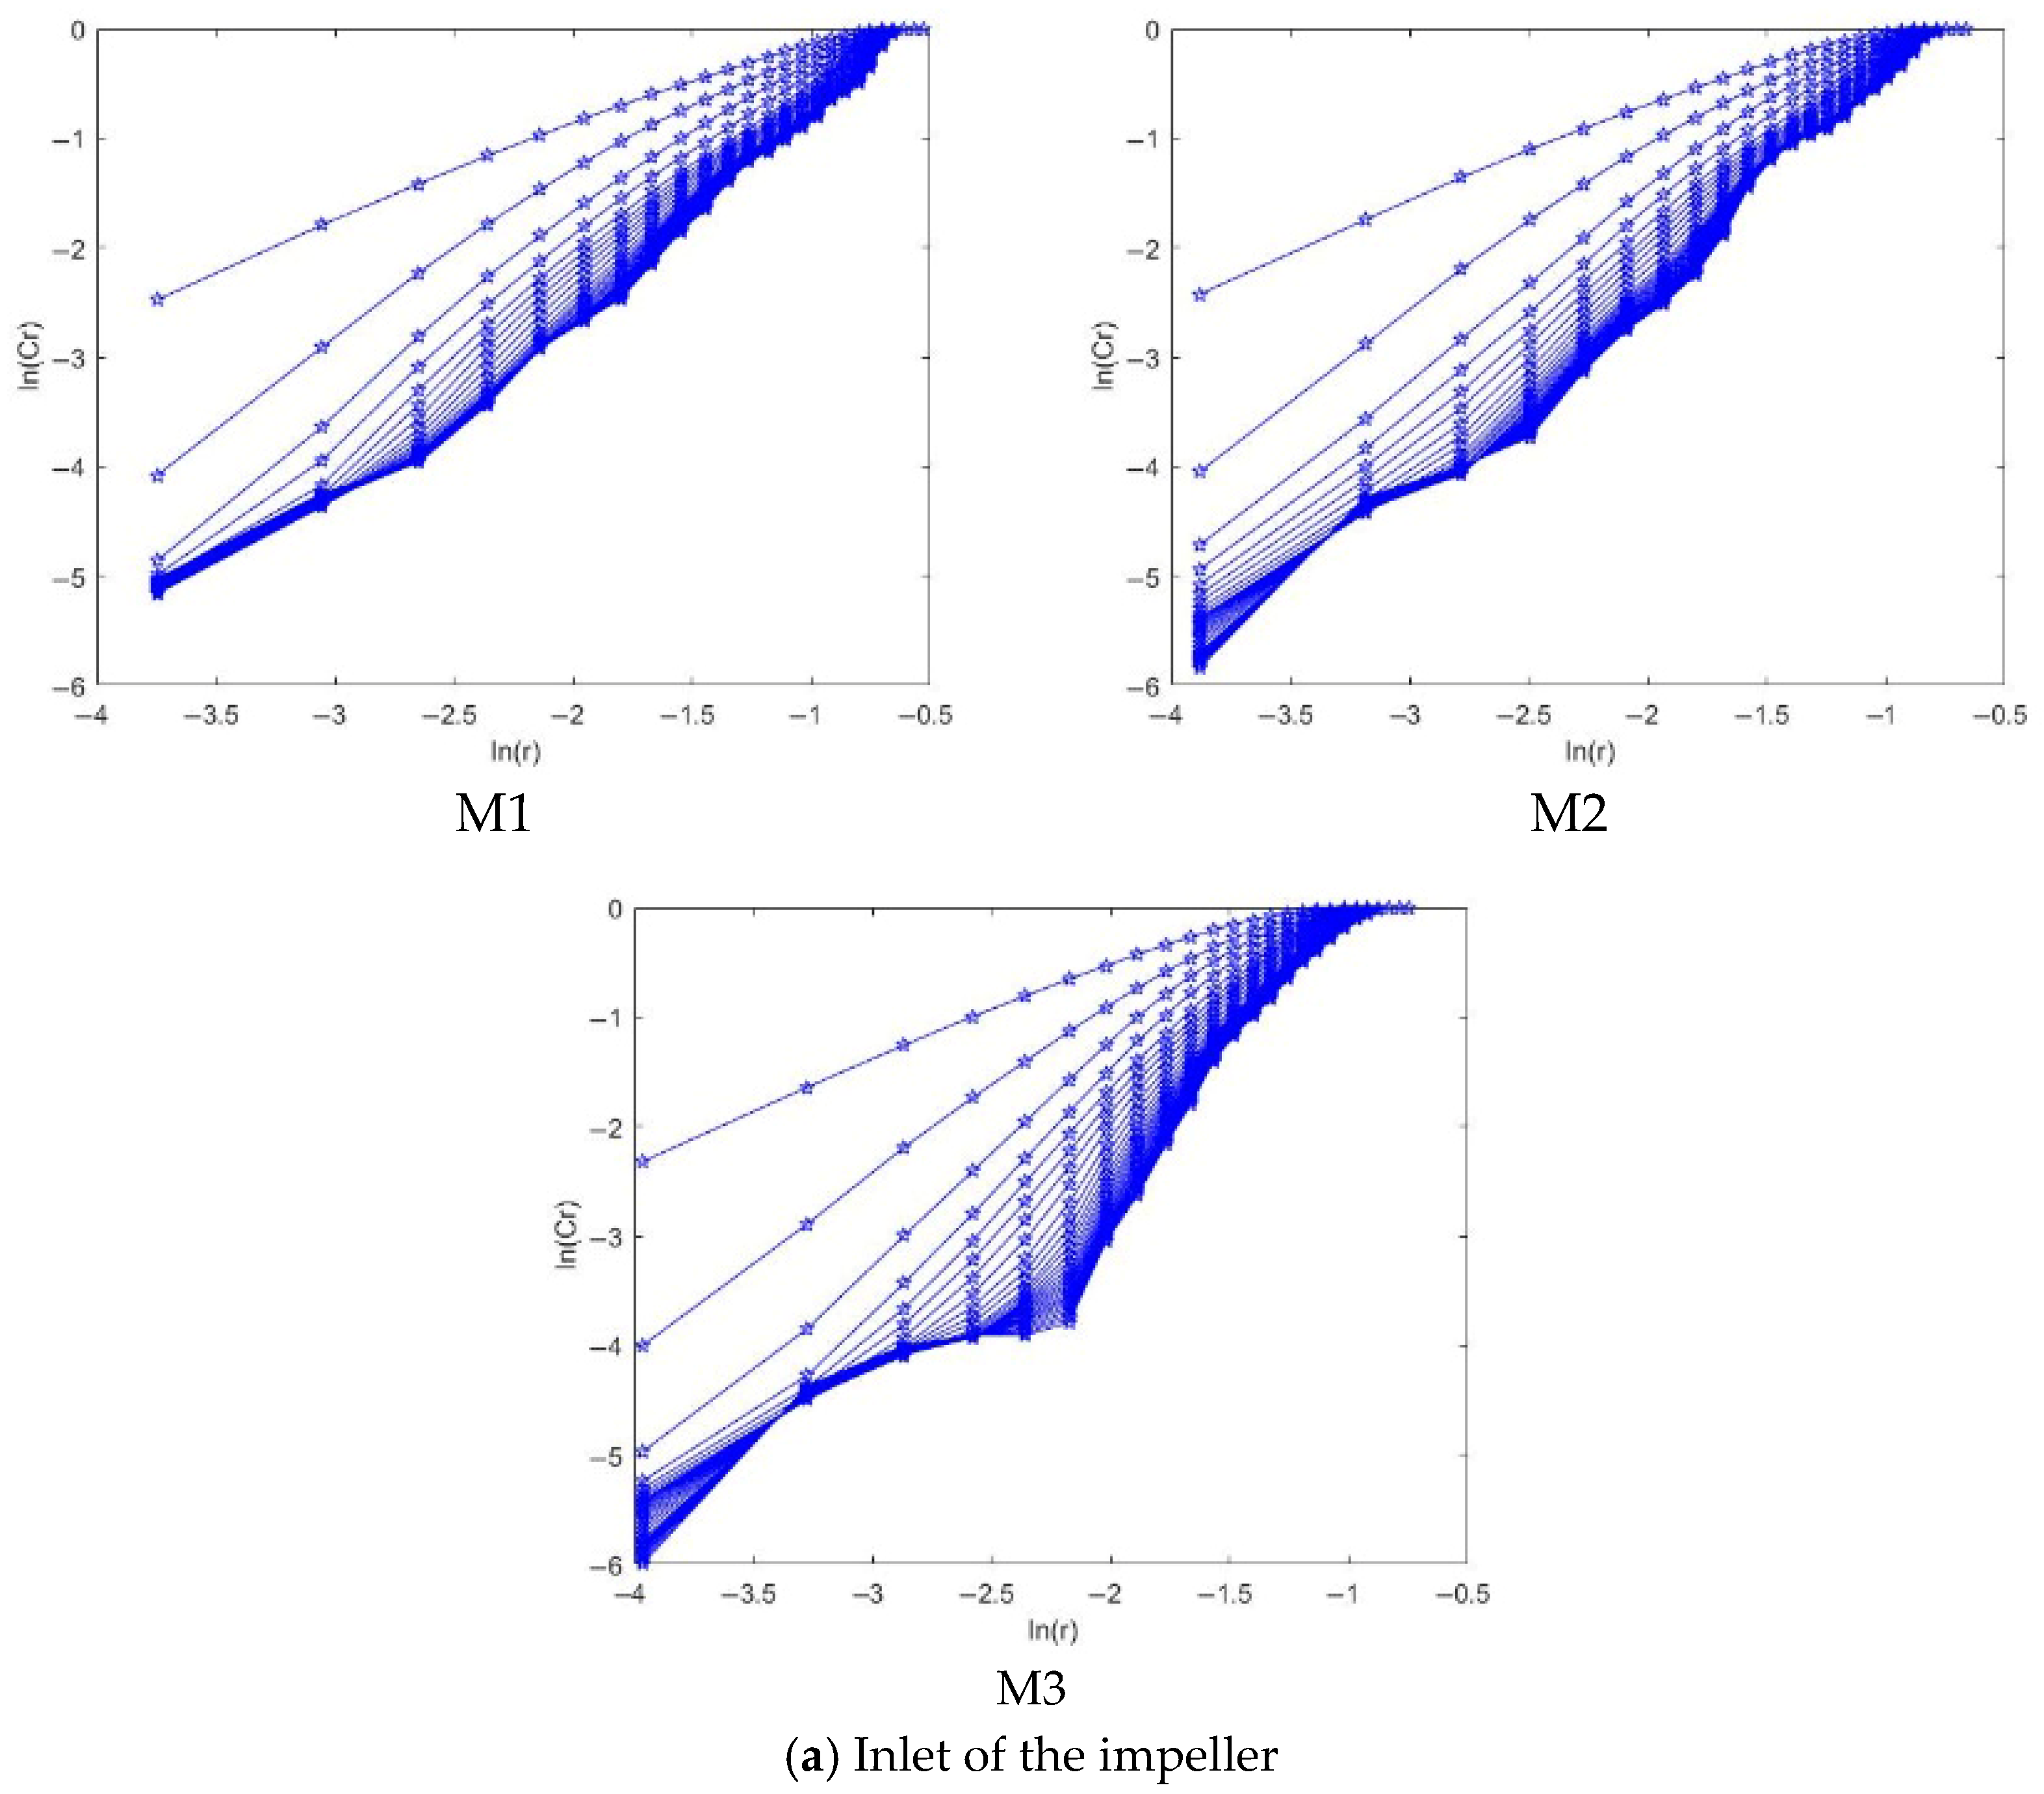
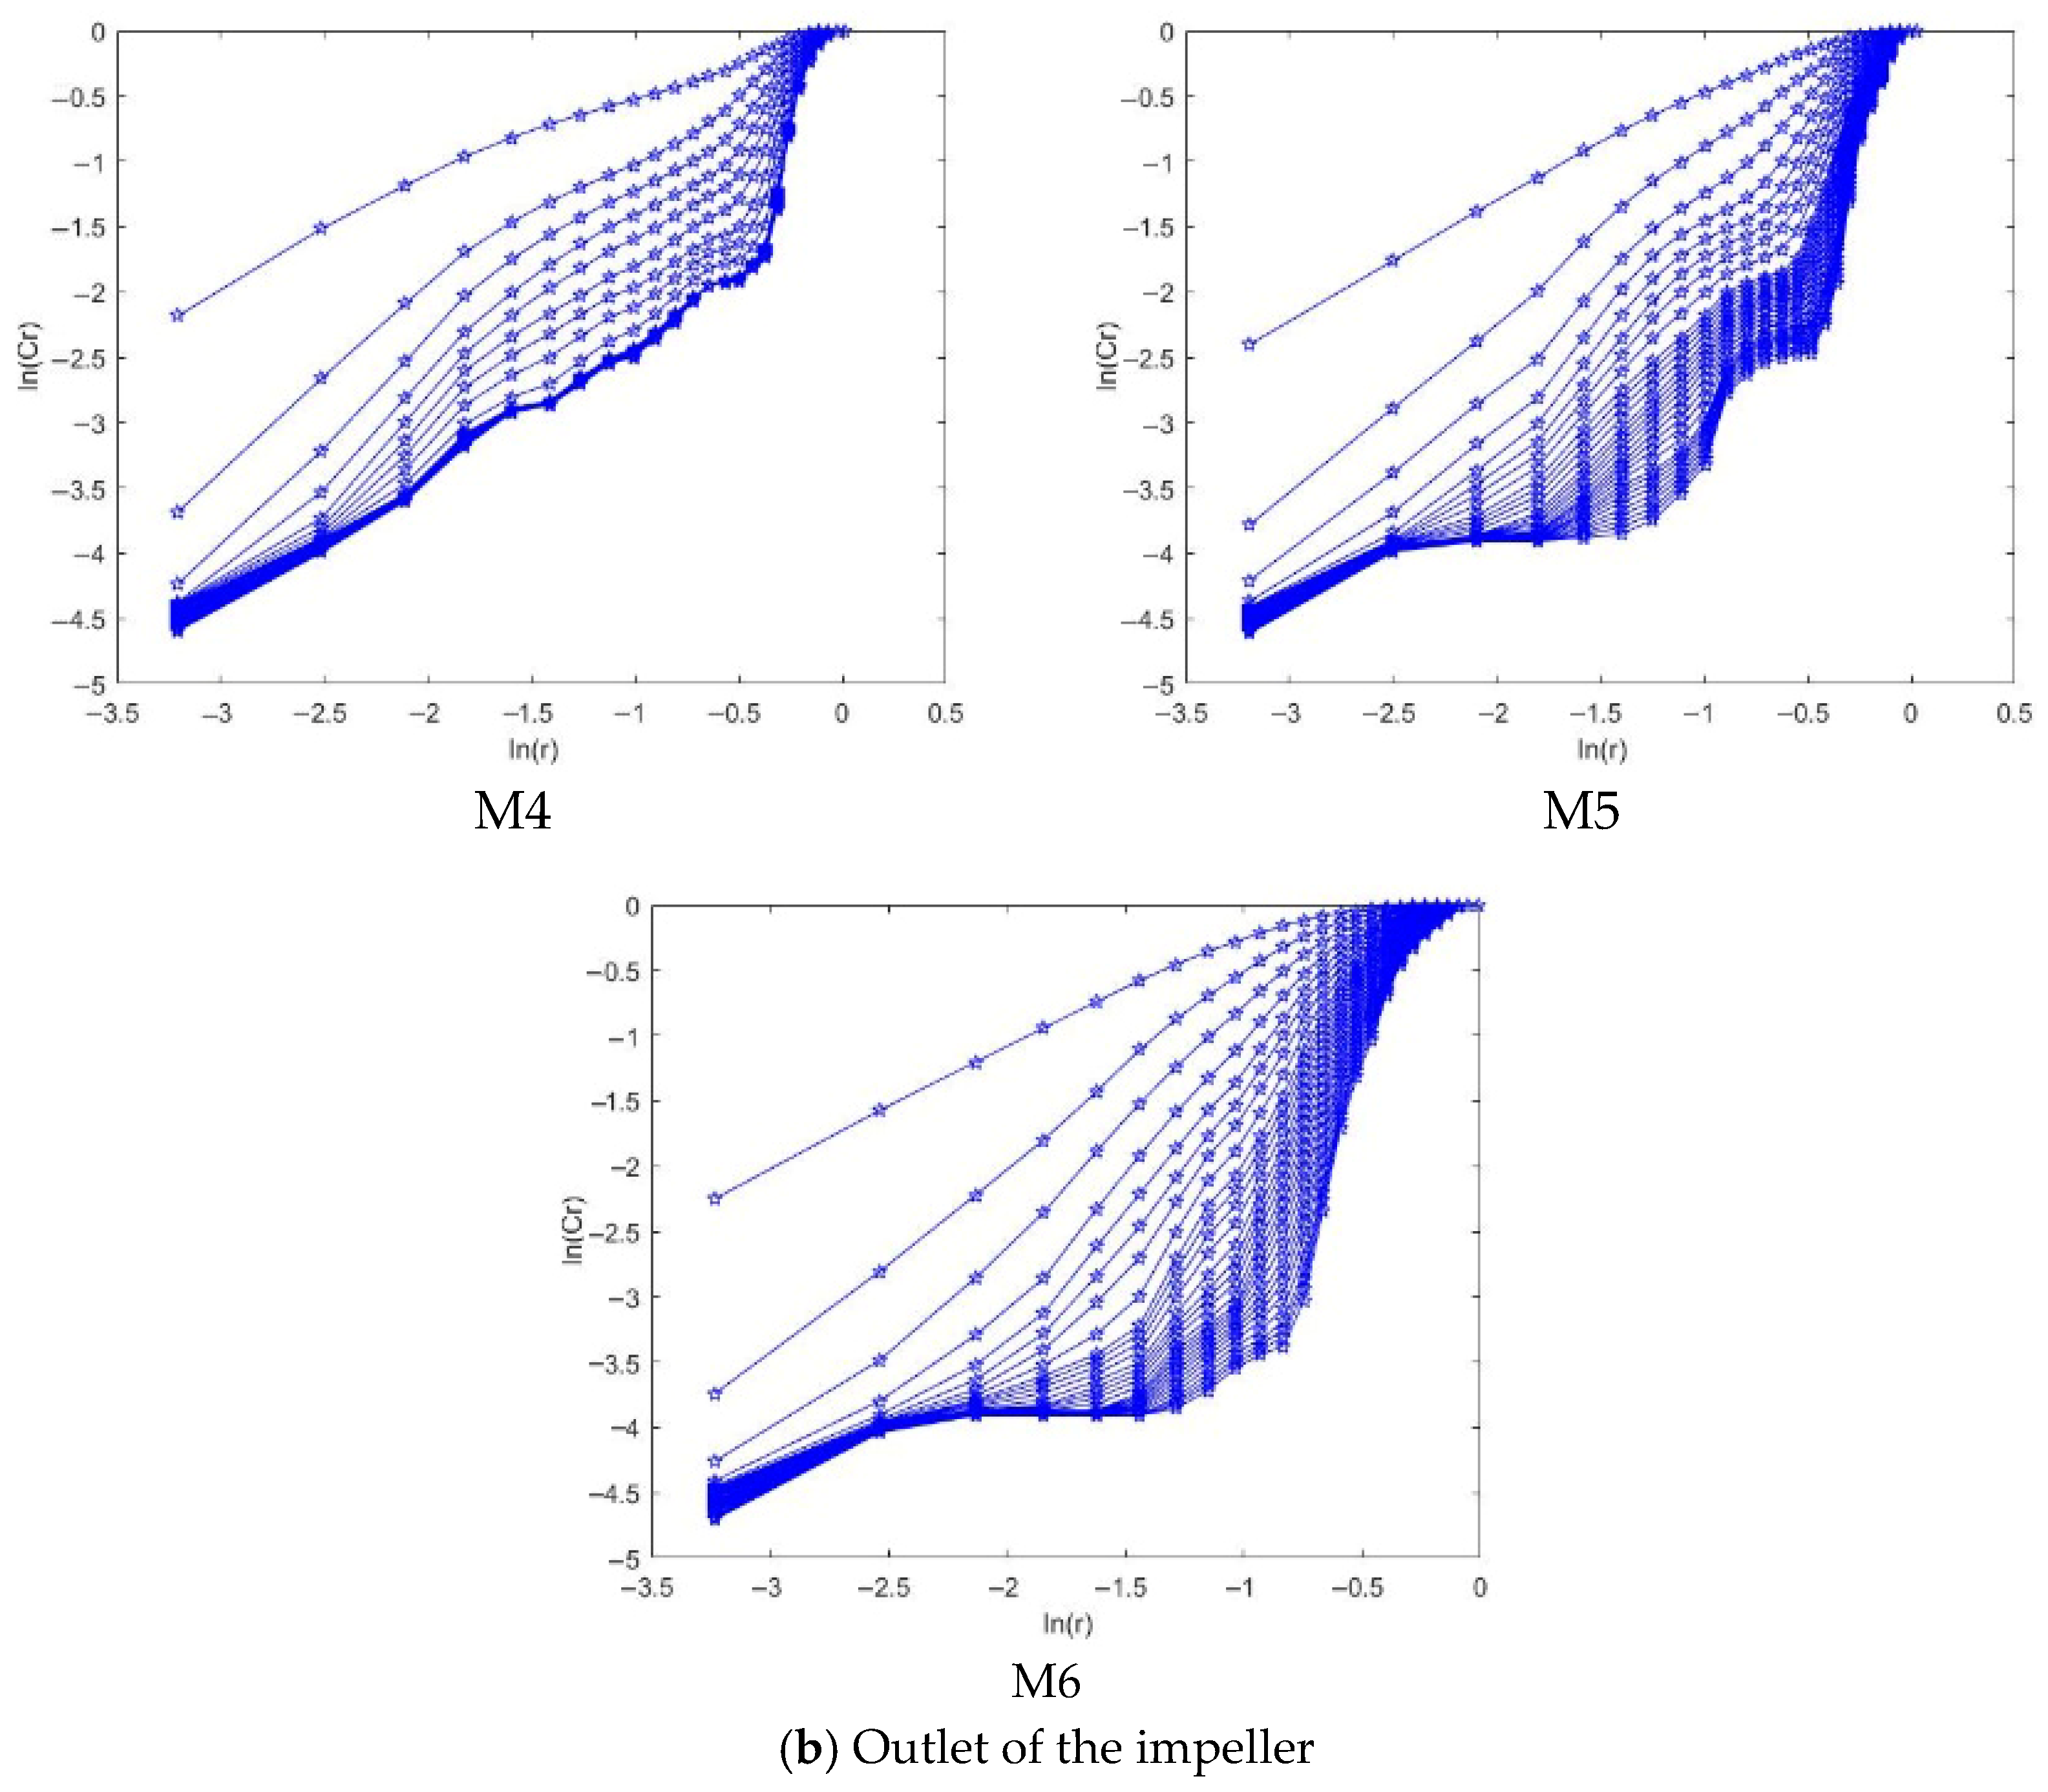
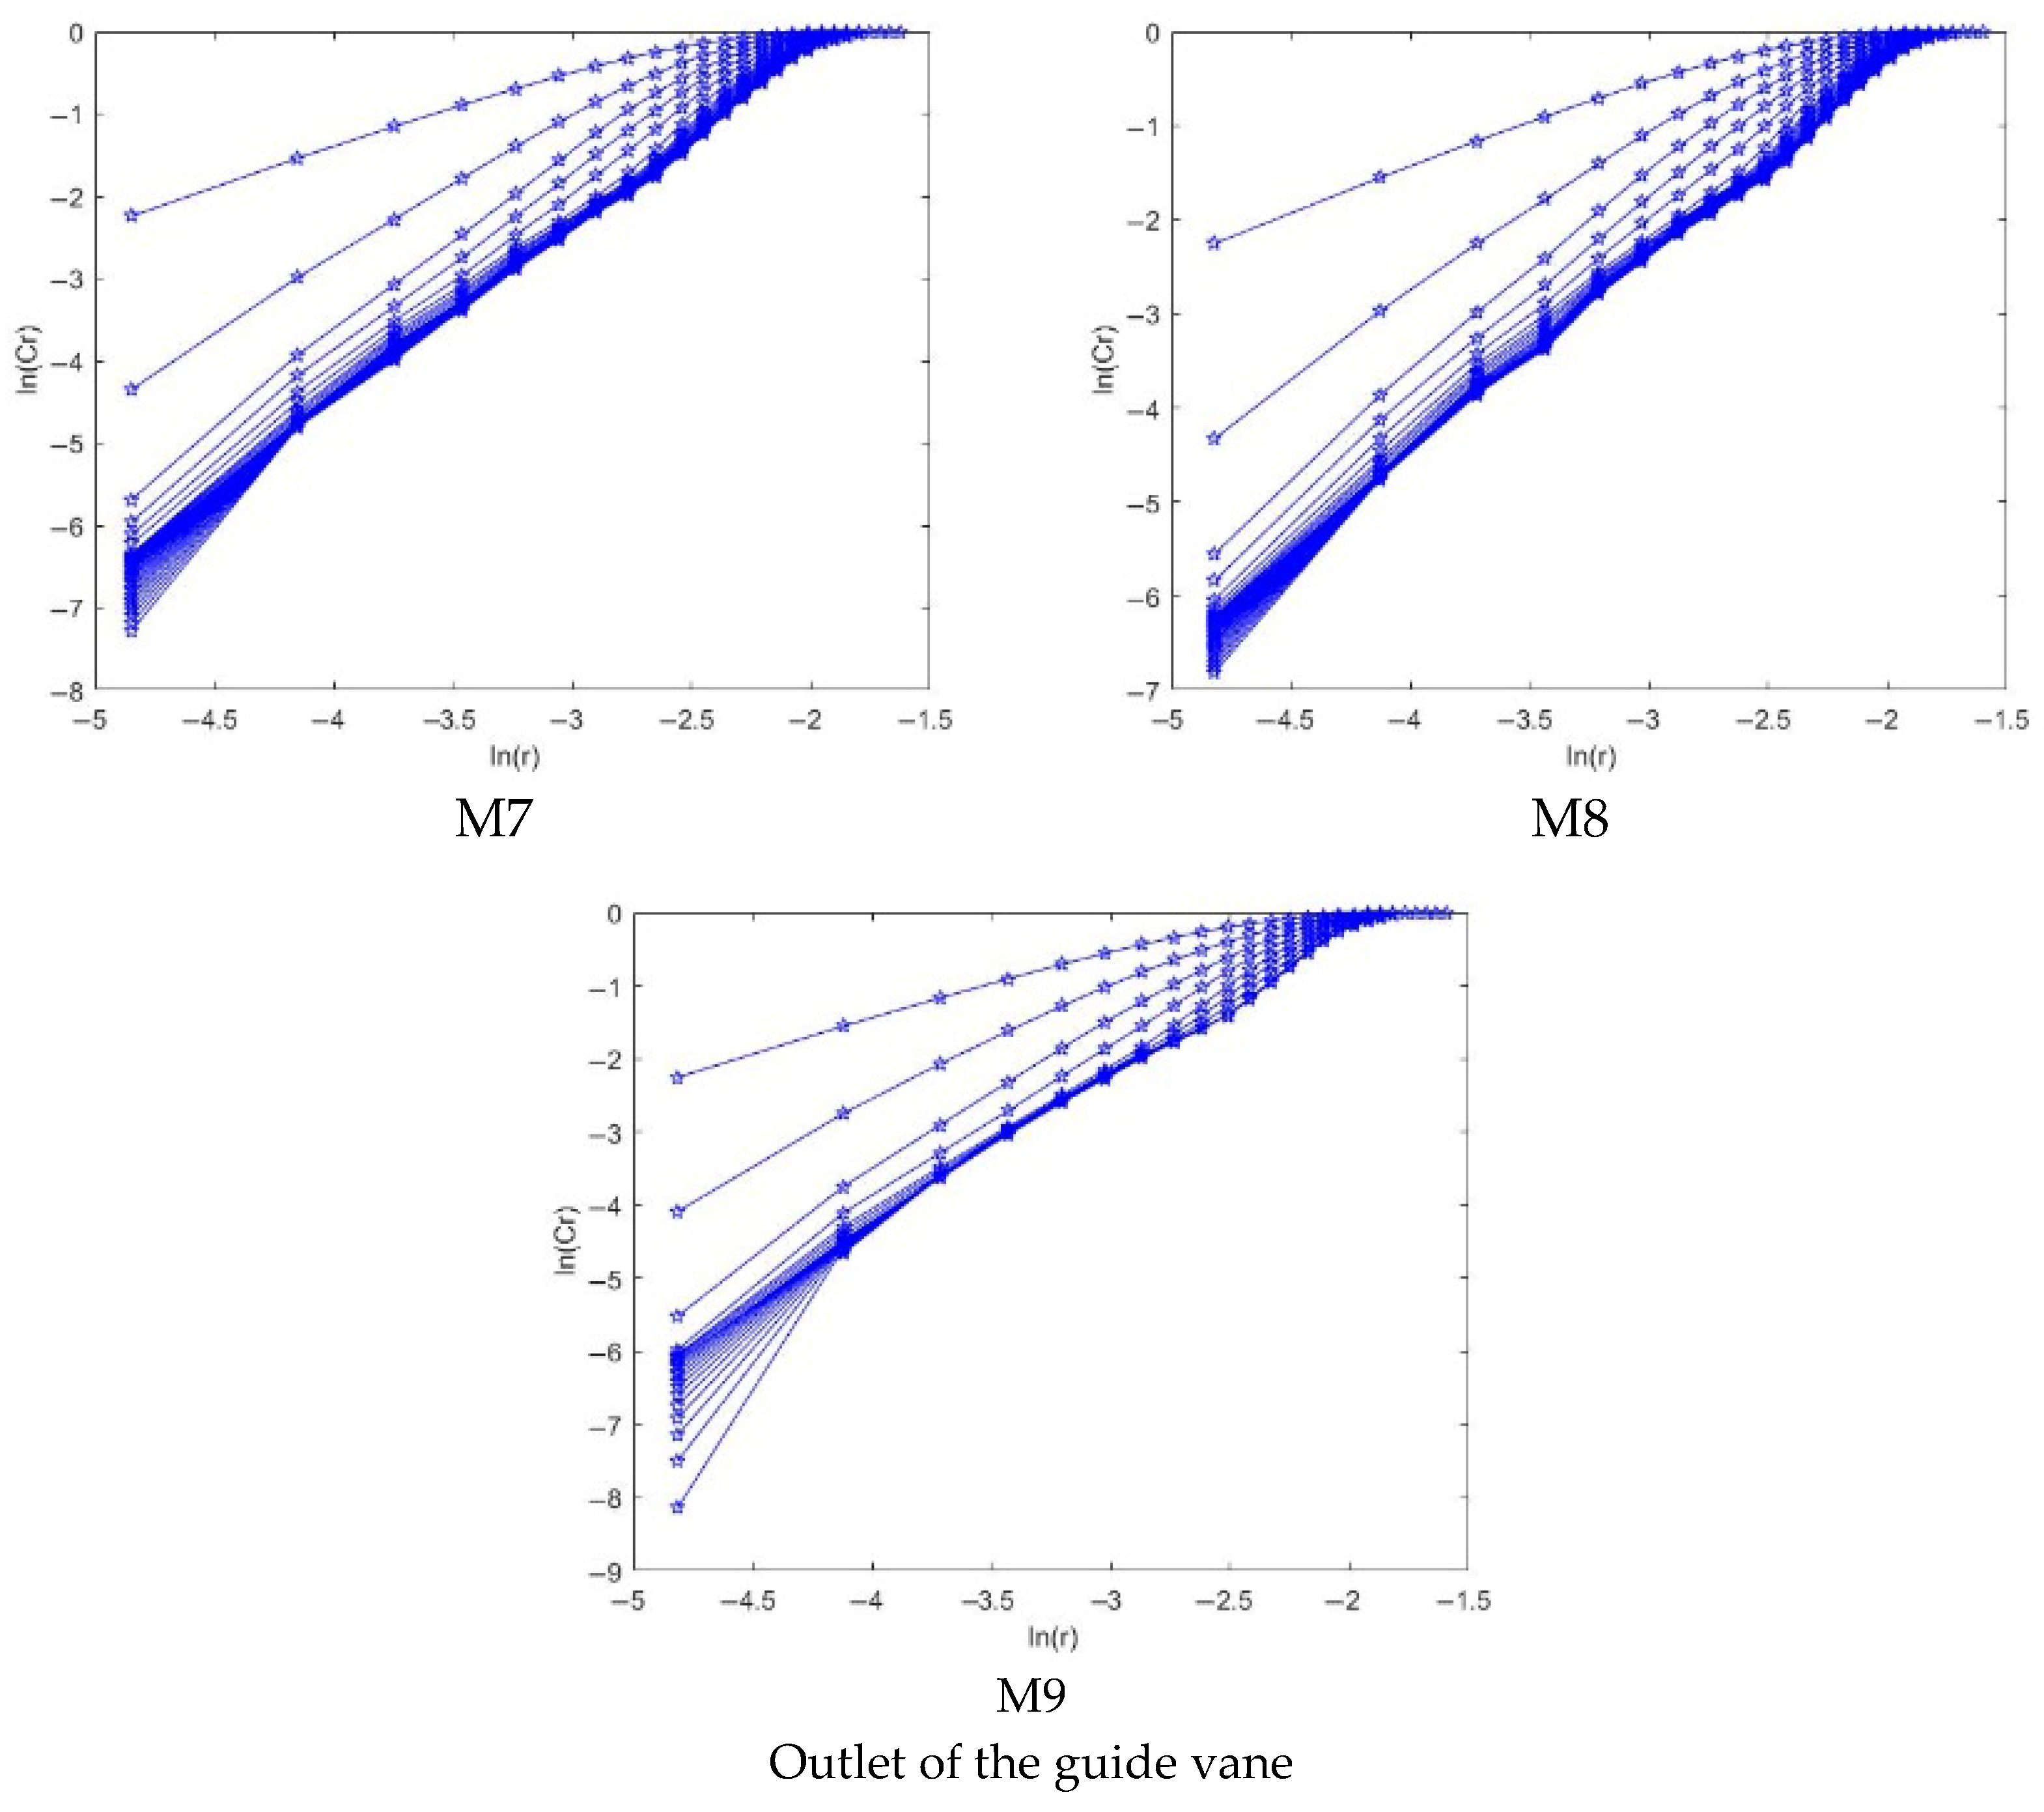
As a fractal dimension, correlation dimension can describe the dimension of a singular attractor in the phase space of a time series, which can be obtained directly from the time series [53]. Figure 14, Figure 15 and Figure 16 shows the correlation dimension integral curve of the pressure fluctuation signal collected by each monitoring point.
Each monitoring point has drawn the correlation dimension curve of 30 cases in embedding dimension m increasing from 1 to 30. With the increase in embedding dimension, the correlation dimension tends to be saturated. According to Takens’ theorem, the pressure fluctuation signal has chaotic characteristics.
The saturated correlation dimension of the monitoring points at the impeller (M1–M6) increases gradually from the hub to the rim, and the closer to the hub, the faster the saturated correlation dimension converges. The saturated correlation dimension of the monitoring points at the guide vane (M7–M9) decreases gradually along the hub to the rim. The correlation dimension of the monitoring points in the inlet channel (M10–M12) and outlet channel (M13–M16) is generally smaller than that at the impeller (M1–M6) and at the guide vane (M7–M9), indicating that the chaotic attractor dimension of the pressure fluctuation time series in the inlet channel (M10–M12) and outlet channel (M13–M16) is relatively low. It is mainly considered that the flow channel area is far from the fluctuation source, and the fluctuation is relatively disordered and has no obvious periodicity. Overall, the saturation correlation dimension at each monitoring point has no obvious change rule. Its size is related to its chaotic characteristics, and the larger the number of correlated bits, the stronger the chaotic characteristics. The correlation dimension corresponds to the variation in pressure fluctuation amplitude, and the larger the amplitude variation is, the larger the correlation dimension is, while the smaller the amplitude changes are, the smaller the correlation dimension is.
Furthermore, chaos intensity, as reflected by the correlation dimension, not only characterizes the complexity of the flow but also has practical implications for pump performance. Higher chaos intensity indicates more substantial turbulent fluctuations and unsteady flow, which can increase energy dissipation and thus reduce pump efficiency. At the same time, intense chaotic fluctuations cause more irregular pressure pulsations, increasing the risk of mechanical vibrations, fatigue, and potential structural damage. Therefore, understanding and controlling chaos intensity is essential for improving pump reliability and operational stability.

5. Comparative Analysis and Future Work

This study reveals the key characteristics of pressure pulsations and chaotic behavior in ultra-low-head two-way channel irrigation pump stations, providing valuable insights into improving operational stability and performance. Although the current work has clarified the mechanisms of flow instability and the presence of chaos in the impeller and guide vane regions, several avenues remain for further exploration.
Firstly, future work could focus on cavitation phenomena, using methods such as entropy generation analysis to investigate the relationship between cavitation and pressure fluctuations. This would have important implications for the pump’s reliability and efficiency.
Secondly, while this study focuses on a Yangtze River-based ultra-low-head two-way channel station, similar hydraulic and nonlinear behaviors are also present in other pumps. Therefore, extending the current numerical simulation and nonlinear analysis approach to various impeller geometries, operating conditions, and a wider range of ultra-low-head values (e.g., from −0.1 m to 0.5 m) would help validate the generalizability of the results and enhance their practical applicability. Future work will focus on these aspects to better identify chaos thresholds and improve system stability under diverse conditions.
The pressure pulsation characteristics identified in this study are consistent with previous findings while expanding the current understanding. For example, Ref. [54] employed wavelet analysis to investigate dynamic reverse flow conditions in axial-flow pumps, revealing significantly enhanced pulsations at the impeller inlet, which aligns with the larger amplitudes observed at the blade tip in this study. Ref. [55] indicated that the dominant frequency at various monitoring points is typically four times the impeller rotation frequency, and that pulsation amplitude increases from hub to shroud—consistent with the shrinking and weakening signal patterns in phase space observed in this study. Ref. [56] further demonstrated that the impeller inlet exhibits the strongest pressure pulsations under reverse operating conditions, which echoes the finding of this study that chaotic features are most pronounced at high flow rates.
Based on these findings, this study proposes optimization strategies to mitigate chaotic fluctuations, such as refining the impeller leading-edge design and adjusting the guide vane arrangement, which can improve operational stability under extreme conditions.

6. Conclusions

In this paper, numerical simulation combined with an experimental verification method is used to study pressure fluctuation characteristics and chaotic dynamic characteristics of an ultra-low head two-way channel irrigation pumping station. The following conclusions are obtained:
(1)
The pressure fluctuation at the inlet of the impeller and the outlet of the guide vane is mainly low frequency, and the proportion of high frequency at the outlet of the impeller is slightly increased. At the same time, there are fluctuation signals that change with time, and the amplitude at the rim is larger than at the hub.
(2)
Compared with the impeller and guide vane, the proportion of high-frequency fluctuation signals at the intake bell mouth and outlet channel is significantly increased. There is a fluctuating signal with time sinusoidal variation at the high frequency of the monitoring point in the outlet channel.
(3)
The pressure fluctuation phase trajectory of the monitoring points at the impeller and guide vane has obvious regularity, showing a contraction trend from the hub to the rim, and the corresponding pressure fluctuation signal is weakened.
(4)
The positive maximum Lyapunov exponents at the impeller and guide vane indicate chaotic pressure fluctuations under high flow conditions. At the same time, the negative values at the inlet bell mouth and outlet channel suggest non-chaotic behavior. Moreover, the saturated correlation dimension is associated with both the chaotic characteristics and the amplitude variation in the signal—larger amplitude fluctuations correspond to higher correlation dimensions.
(5)
This study reveals the key mechanisms of pressure pulsations and chaotic characteristics in ultra-low-head two-way channel pump stations, confirming the presence of significant chaotic behavior in the impeller and guide vane regions. Optimization strategies for the impeller leading edge and guide vane arrangement are proposed to enhance operational stability and performance under extreme conditions.

Author Contributions

W.J.: writing—original draft, writing—review and editing, methodology, funding. X.X.: writing—original draft, writing—review and editing, formal analysis. H.F.: writing—original draft, formal analysis. Y.C.: supervision, formal analysis. J.S.: software, formal analysis. J.D.: software, supervision. X.J.: formal analysis. All authors have read and agreed to the published version of the manuscript.

Funding

This research was supported by the National Natural Science Foundation of China (Grant No: 52309120), the Project Funded by the Priority Academic Program Development of Jiangsu Higher Education Institutions [PAPD], the Natural Science Foundation of the Jiangsu Higher Education Institutions of China (Grant No: 23KJB570003), and the Open Research Subject of Key Laboratory of Fluid and Power Machinery (Xihua University), Ministry of Education (Grant No: LTDL-2024011).

Conflicts of Interest

Yang Chen is employed by Shanghai Branch of Changjiang Institute of Survey, Planning, Design and Research Co., Ltd. The authors declare that this study was conducted without any commercial or financial relationships that might be interpreted as potential conflicts of interest.

References

  1. Cui, S.; Wu, M.; Huang, X.; Cao, X. Unravelling resources use efficiency and its drivers for water transfer and grain production processes in pumping irrigation system. Sci. Total Environ. 2022, 818, 151810. [Google Scholar] [CrossRef]
  2. Wu, Y.; Chen, R.; Lin, Z.; Chen, Y.; Chen, Z.; Chen, X.; Yuan, J. Day-ahead scheduling model for agricultural microgrid with pumped-storage hydro plants considering irrigation uncertainty. J. Energy Storage 2024, 95, 112468. [Google Scholar] [CrossRef]
  3. Ogie, R.I.; Dunn, S.; Holderness, T.; Turpin, E. Assessing the vulnerability of pumping stations to trash blockage in coastal mega-cities of developing nations. Sustain. Cities Soc. 2017, 28, 53–66. [Google Scholar] [CrossRef]
  4. Zhang, W.; Shi, L.; Tang, F.; Duan, X.; Liu, H.; Sun, Z. Analysis of inlet flow passage conditions and their influence on the performance of an axial-flow pump. Proc. Inst. Mech. Eng. Part A J. Power Energy 2021, 235, 733–746. [Google Scholar] [CrossRef]
  5. Li, Y.; Lin, Q.; Meng, F.; Zheng, Y.; Xu, X. Research on the Influence of Tip Clearance of Axial-Flow Pump on Energy Characteristics under Pump and Turbine Conditions. Machines 2022, 10, 56. [Google Scholar] [CrossRef]
  6. Yang, F.; Li, Z.; Yuan, Y.; Liu, C.; Zhang, Y.; Jin, Y. Numerical and experimental investigation of internal flow characteristics and pressure fluctuation in inlet passage of axial flow pump under deflection flow conditions. Energies 2021, 14, 5245. [Google Scholar] [CrossRef]
  7. Shi, L.; Zhu, J.; Tang, F.; Wang, C. Multi-disciplinary optimization design of axial-flow pump impellers based on the approximation model. Energies 2020, 13, 779. [Google Scholar] [CrossRef]
  8. Zhou, D.; Gui, J.; Deng, Z.D.; Chen, H.; Yu, Y.; Yu, A.; Yang, C. Development of an ultra-low head siphon hydro turbine using computational fluid dynamics. Energy 2019, 181, 43–50. [Google Scholar] [CrossRef]
  9. Lu, R.; Zhang, H.; Li, Y.; Yuan, J.; Xu, J.; Wang, L. The effect of bell mouth height on the hydraulic characteristics of the two-way pumping station based on the parameter design. Proc. Inst. Mech. Eng. Part A J. Power Energy 2022, 236, 1320–1334. [Google Scholar] [CrossRef]
  10. Hou, C.; Cheng, L.; Pan, W.; Li, S.; Jiao, W. Dynamic Response Analysis of Dual-Flow Channel Pump Station Structure under Water Pressure Pulsation. Energies 2022, 15, 3770. [Google Scholar] [CrossRef]
  11. Zhou, W.; Tao, W.; Zhou, H.B.; Tang, X.C. Optimal Design of Outlet Conical Pipe for Open Dual-Directional Pumping System. South--North Water Transf. Water Sci. Technol. 2014, 12, 164–166. (In Chinese) [Google Scholar]
  12. Zheng, Y.; Li, Y.; Zhu, X.; Yuan, S.; Zhang, H.; Wang, H. Hydraulic performance improvement of a two-way pumping station through bell mouth shape design. Phys. Fluids 2024, 36, 035119. [Google Scholar] [CrossRef]
  13. Zhu, H.; Gao, X.; Liu, Y.; Liu, S. Numerical and experimental assessment of the water discharge segment in a pumped-storage power station. Energy 2023, 265, 126375. [Google Scholar] [CrossRef]
  14. Zhao, H.; Zhu, B.; Jiang, B. Comprehensive assessment and analysis of cavitation scale effects on energy conversion and stability in pumped hydro energy storage units. Energy Convers. Manag. 2025, 325, 119370. [Google Scholar] [CrossRef]
  15. Lin, Z.; Yang, F.; Guo, J.; Jian, H.; Sun, S.; Jin, X. Leakage flow characteristics in blade tip of shaft tubular pump. J. Mar. Sci. Eng. 2023, 11, 1139. [Google Scholar] [CrossRef]
  16. Zhu, Z.; Gu, Q.; Chen, H.; Ma, Z.; Cao, B. Investigation and optimization into flow dynamics for an axial flow pump as turbine (PAT) with ultra-low water head. Energy Convers. Manag. 2024, 314, 118684. [Google Scholar] [CrossRef]
  17. Lei, S.; Cheng, L.; Sheng, W. Study of energy dissipation mechanisms and pressure pulsation spectrums in a vertical axial flow pump station on the ultra-low head condition based on multiple analysis methods. Energy 2025, 320, 135227. [Google Scholar] [CrossRef]
  18. Jiao, W.; Chen, H.; Cheng, L.; Zhang, B.; Gu, Y. Energy loss and pressure fluctuation characteristics of coastal two-way channel pump stations under the ultra-low head condition. Energy 2023, 278, 127953. [Google Scholar] [CrossRef]
  19. Kan, K.; Xu, Z.; Chen, H.; Xu, H.; Zheng, Y.; Zhou, D. & Maxime, B. Energy loss mechanisms of transition from pump mode to turbine mode of an axial-flow pump under bidirectional conditions. Energy 2022, 257, 124630. [Google Scholar]
  20. Zhang, P.; Cheng, Y.; Hu, Z.; Xue, S.; Li, W.; Zhao, Z.; Hu, Z. CFD-based hydraulic-mechanical-electrical coupled simulation method for variable-speed pumped storage units. Energy 2025, 329, 136701. [Google Scholar] [CrossRef]
  21. Gu, Y.; Bian, J.; Wang, Q.; Stephen, C.; Liu, B.; Cheng, L. Energy performance and pressure fluctuation in multi-stage centrifugal pump with floating impellers under various axial oscillation frequencies. Energy 2024, 307, 132691. [Google Scholar] [CrossRef]
  22. Xu, L.; Zhang, Y.; Xu, J.; Wang, Y.; Feng, C.; Yang, Y.; Zheng, Y. Towards the integration of new-type power systems: Hydraulic stability analysis of pumped storage units in the S-characteristic region based on experimental and CFD studies. Energy 2025, 329, 136755. [Google Scholar] [CrossRef]
  23. Wang, H.; Wang, F.; Wang, C.; Wang, B.; Li, C.; Li, D. A prospective assessment of scale effects of energy conversion in ultra-low-head pumped hydro energy storage units. Energy Convers. Manag. 2024, 315, 118798. [Google Scholar] [CrossRef]
  24. Chen, J.; Zheng, Y.; Zhang, L.; He, G.; Zou, Y.; Xiao, Z. Optimization of geometric parameters of hydraulic turbine runner in turbine mode based on the orthogonal test method and CFD. Energy Rep. 2022, 8, 14476–14487. [Google Scholar] [CrossRef]
  25. Yu, H.; Zhang, Z.; Hua, H. Numerical investigation of tip clearance effects on propulsion performance and pressure fluctuation of a pump-jet propulsor. Ocean Eng. 2019, 192, 106500. [Google Scholar] [CrossRef]
  26. Al-Obaidi, A.R. Analysis of the effect of various impeller blade angles on characteristic of the axial pump with pressure fluctuations based on time-and frequency-domain investigations. Iran. J. Sci. Technol. Trans. Mech. Eng. 2021, 45, 441–459. [Google Scholar] [CrossRef]
  27. Zhang, X.; Tang, F.; Chen, Y.; Huang, C.; Chen, Y.; Wang, L.; Shi, L. Experimental Study on the Internal Pressure Pulsation Characteristics of a Bidirectional Axial Flow Pump Operating in Forward and Reverse Directions. Machines 2022, 10, 167. [Google Scholar] [CrossRef]
  28. Yang, F.; Chang, P.; Yuan, Y.; Li, N.; Xie, R.; Zhang, X.; Lin, Z. Analysis of Timing Effect on Flow Field and Pulsation in Vertical Axial Flow Pump. J. Mar. Sci. Eng. 2021, 9, 1429. [Google Scholar] [CrossRef]
  29. Zhang, X.; Tang, F. Investigation on hydrodynamic characteristics of coastal axial flow pump system model under full working condition of forward rotation based on experiment and CFD method. Ocean Eng. 2022, 253, 111286. [Google Scholar] [CrossRef]
  30. Huang, R.; Qiu, R.; Wang, Y.; Luo, X.; Zhang, W. Space-time frequency spectra analyses of the unsteady cavitating vortical flows inside a mixed-flow pump. Ocean Eng. 2021, 238, 109758. [Google Scholar] [CrossRef]
  31. Li, J.; Xu, F.; Cheng, L.; Pan, W.; Zhang, J.; Shen, J.; Ge, Y. Numerical Simulation of Internal Flow Characteristics and Pressure Fluctuation in Deceleration Process of Bulb Tubular Pump. Water 2022, 14, 1788. [Google Scholar] [CrossRef]
  32. Ji, L.; Li, W.; Shi, W.; Zhou, L.; Agarwal, R. Experimental study of pressure pulsation in a mixed-flow pump with different tip clearances based on wavelet analysis. Shock Vib. 2020, 2020, 9041686. [Google Scholar] [CrossRef]
  33. Jin, F.; Yao, Z.; Li, D.; Xiao, R.; Wang, F.; He, C. Experimental investigation of transient characteristics of a double suction centrifugal pump system during starting period. Energies 2019, 12, 4135. [Google Scholar] [CrossRef]
  34. Su, J.; Xu, Z. Arc fault diagnosis method based on chaos and fractal theories. Electr. Mach. Control 2021, 25, 125–133. (In Chinese) [Google Scholar]
  35. Ma, H.; Hou, P.; Yan, Y.; Wu, J.; Chen, X.; Zhu, C. Chaotic characteristic analysis and feature recognition of mechanical failure of high voltage reactor winding and iron core. Electr. Power Autom. Equip. 2022, 42, 204–211. [Google Scholar]
  36. Su, W.T.; Li, X.B.; Lan, C.F.; An, S.; Wang, J.-S.; Li, F.-C. Chaotic dynamic characteristics of pressure fluctuation signals in hydro-turbine. J. Mech. Sci. Technol. 2016, 30, 5009–5017. [Google Scholar] [CrossRef]
  37. Liang, C.; Zhou, Y.; Yang, N. Cavitation fault diagnosis of centrifugal pump based on wavelet multi-scale chaotic characteristic parameters. J. Vib. Shock 2021, 40, 106–112+134. (In Chinese) [Google Scholar]
  38. Wang, Z.; Kang, Y.; Li, D.; Wang, X.-C.; Hu, D. Investigating the hydrodynamics of airlift pumps by wavelet packet transform and the recurrence plot. Exp. Therm. Fluid Sci. 2018, 92, 56–68. [Google Scholar] [CrossRef]
  39. Lan, C.; Song, B.; Li, S.; Zhang, L. Wavelet and improved Hilbert–Huang transform method are used to study the spectrum distribution and energy of turbine pressure pulsation. Eng. Rep. 2022, 4, e12485. [Google Scholar] [CrossRef]
  40. Xiao, W.; Gui, Z.; Lu, Z.; Xiao, R.; Tao, R. Pressure pulsation of pump turbine at runaway condition based on Hilbert Huang transform. Front. Energy Res. 2024, 12, 1344676. [Google Scholar] [CrossRef]
  41. Wang, W.; Tai, G.; Shen, J.; Pei, J.; Yuan, S. Experimental investigation on pressure fluctuation characteristics of a mixed-flow pump as turbine at turbine and runaway conditions. J. Energy Storage 2022, 55, 105562. [Google Scholar] [CrossRef]
  42. Shen, J.; Cheng, L.; Jia, S.; Jiao, W.; Zhang, B.; Yang, A. Numerical simulation and experimental study on hydraulic instability of pump as turbine devices induced by thoma number based on scale-averaged wavelet spectrum. Eng. Appl. Comput. Fluid Mech. 2025, 19, 2454297. [Google Scholar] [CrossRef]
  43. Xiao, N.; Jin, N.D. Research on flow pattern classification method of two phase flow based on chaotic attractor morphological characteristic. Acta Phys. Sin. 2007, 56, 5149–5157. [Google Scholar] [CrossRef]
  44. Ji, B.; Luo, X.; Arndt, R.E.; Wu, Y. Numerical simulation of three dimensional cavitation shedding dynamics with special emphasis on cavitation–vortex interaction. Ocean Eng. 2014, 87, 64–77. [Google Scholar] [CrossRef]
  45. Zhang, D.S.; Bin, C.H.E.N. Unsteady flow analysis and experimental investigation of axial-flow pump. J. Hydrodyn. Ser. B 2010, 22, 35–43. [Google Scholar] [CrossRef]
  46. Yang, G. RNG k-ε pump turbine working condition of numerical simulation and optimization of the model. In International Conference on Intelligent Computing; Springer International Publishing: Cham, Switzerland, 2016; pp. 684–693. [Google Scholar]
  47. Roberson, J.A.; Chaudhry, M.H. Hydraulic Engineering, 2nd ed.; Wiley: Hoboken, NJ, USA, 1998. [Google Scholar]
  48. Lei, S.; Cheng, L.; Sheng, W. Study on power losses and pressure fluctuations of diffuser mixed flow pump as turbine on different power generation speeds based on energy power models. Renew. Energy 2024, 237, 121771. [Google Scholar] [CrossRef]
  49. Li, T. Chaotic Time Series Analysis Research and Application; Harbin Engineering University: Harbin, China, 2006. (In Chinese) [Google Scholar]
  50. Rosenstein, M.T.; Collins, J.J.; De Luca, C.J. A practical method for calculating largest Lyapunov exponents from small data sets. Phys. D Nonlinear Phenom. 1993, 65, 117–134. (In Chinese) [Google Scholar] [CrossRef]
  51. Gong, Z. The calculating method of the average period of chaotic time series. Syst. Eng. 2010, 28, 111–113. [Google Scholar]
  52. Grassberger, P.; Procaccia, I. Measuring the strangeness of strange attractors. Phys. D Nonlinear Phenom. 1983, 9, 189–208. [Google Scholar] [CrossRef]
  53. Li, F.; Zhang, L.; Wang, C.; Duan, L. Study of fault characteristic extraction method of reciprocating pump based on chaotic theory. China Pet. Mach. 2009, 37, 56–59+91. (In Chinese) [Google Scholar]
  54. Hu, C.; Zhang, X.; Shen, W.; Liu, H.; Tang, F.; Yan, B. Study on pressure field characteristics of high specific speed axial flow pump under full working conditions based on wavelet transform. Phys. Fluids 2025, 37, 025207. [Google Scholar] [CrossRef]
  55. Yang, F.; Chang, P.; Hu, W.; Mao, B.; Liu, C.; Li, Z. Numerical study on pressure pulsation in a slanted axial-flow pump device under partial loads. Processes 2021, 9, 1404. [Google Scholar] [CrossRef]
  56. Dai, Y.; Shi, W.; Yang, Y.; Xie, Z.; Zhang, Q. Numerical analysis of unsteady internal flow characteristics in a bidirectional axial flow pump. Sustainability 2024, 16, 224. [Google Scholar] [CrossRef]
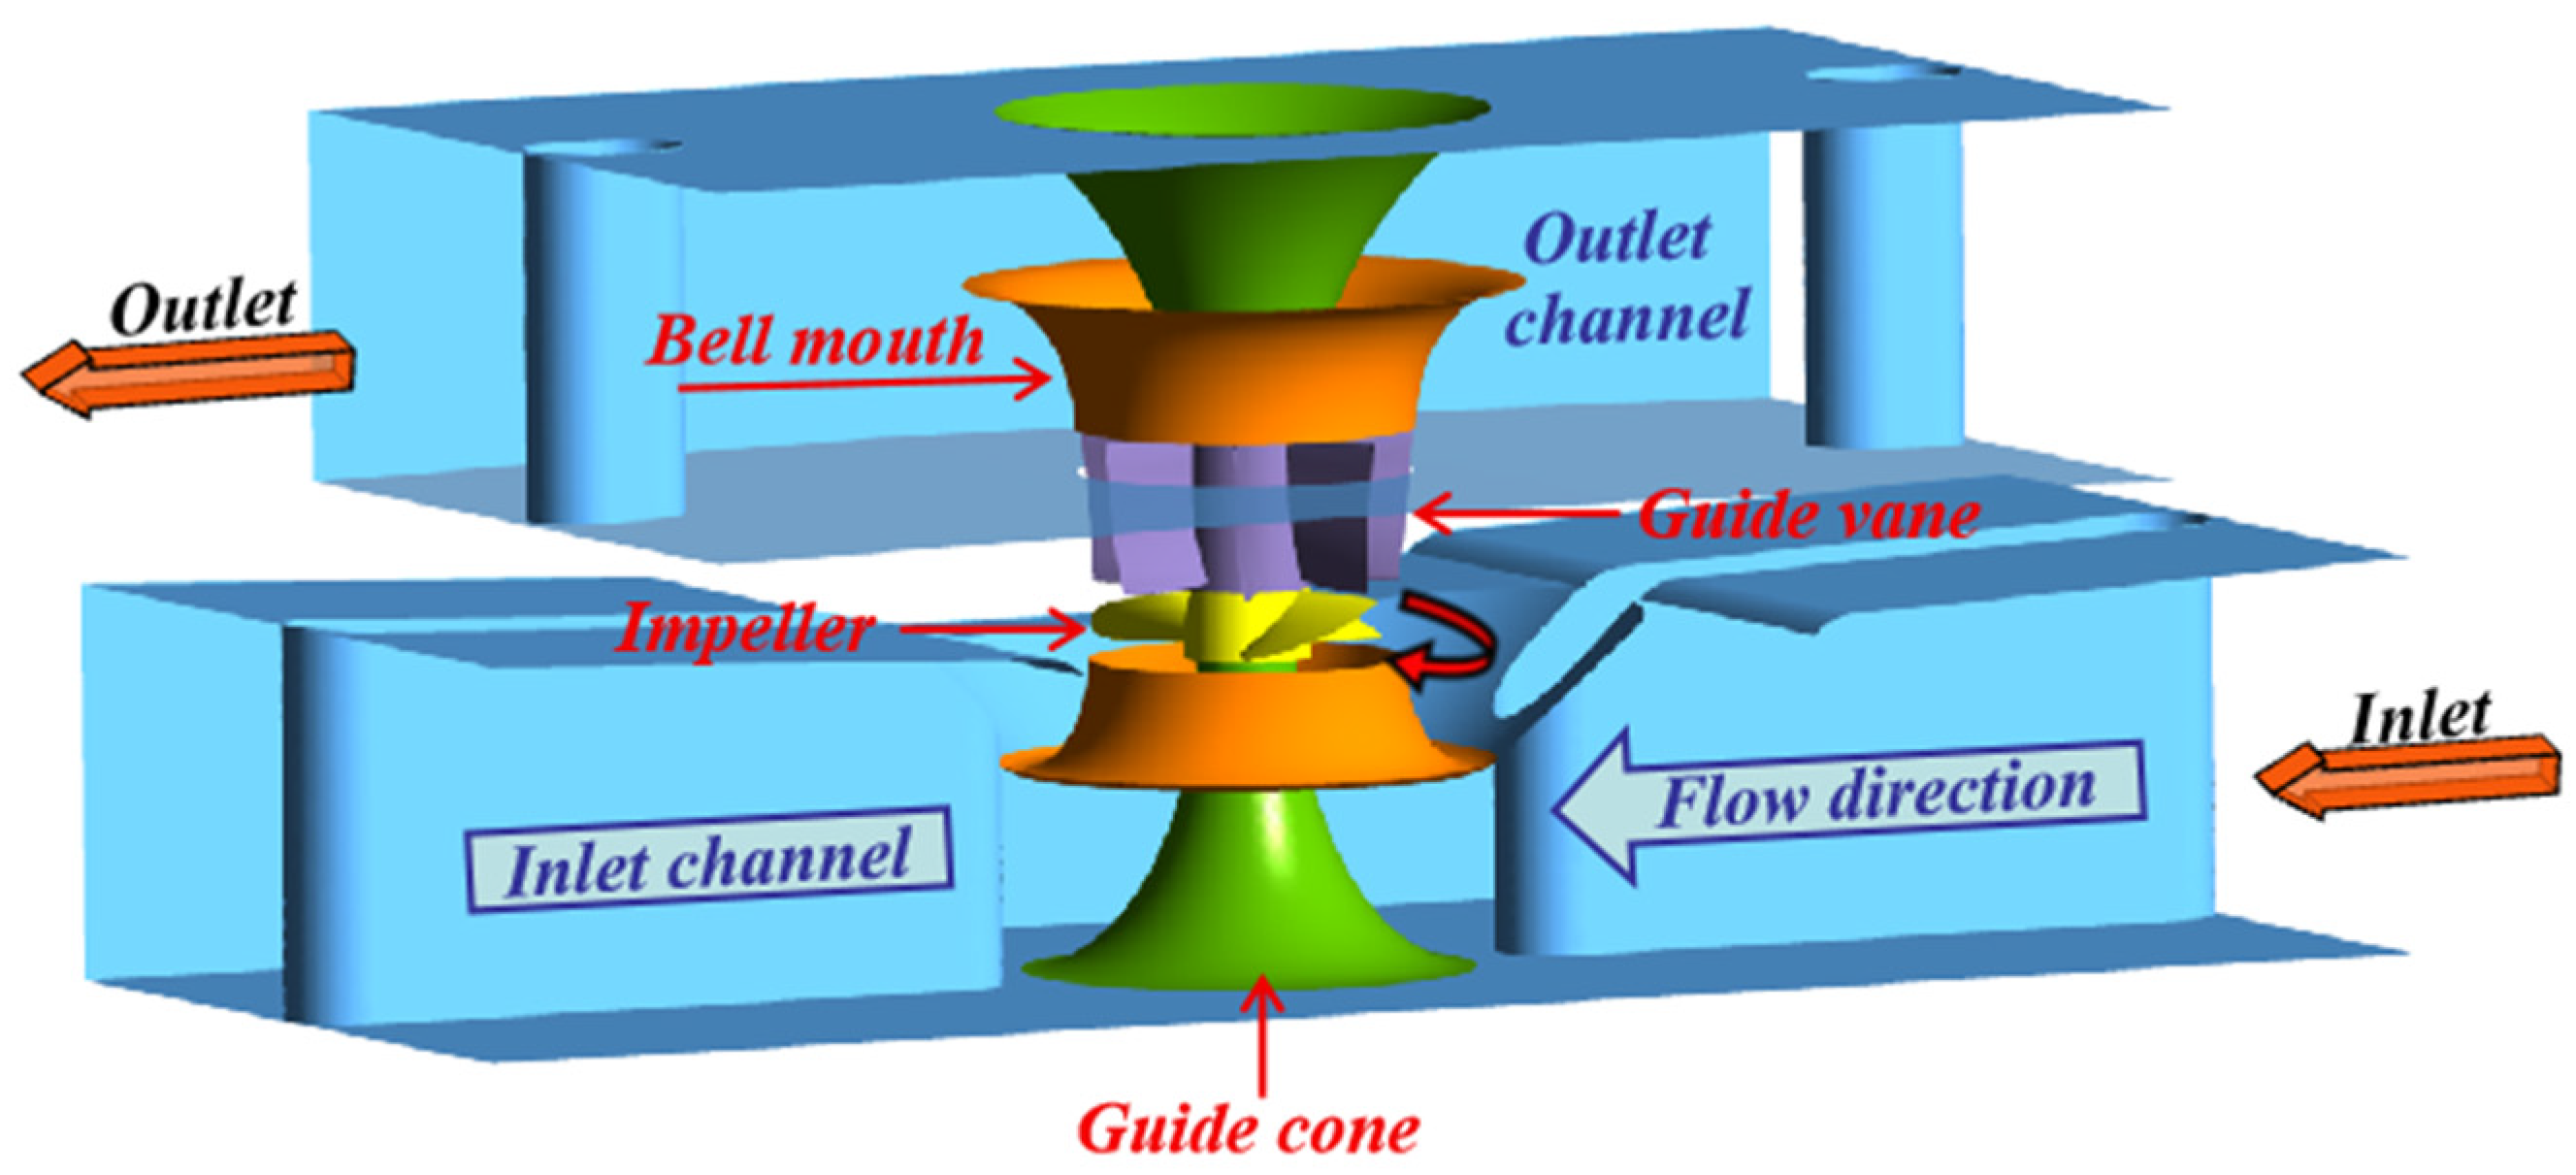
Figure 1. Three-dimensional model of two-way channel vertical pumping system.
Agriengineering 07 00270 g001
Figure 2. Impeller grid independence and grid generation.
Agriengineering 07 00270 g002
Figure 3. Comparison of hydraulic performance between simulated value and experimental value.
Agriengineering 07 00270 g003
Figure 4. Location of monitoring points.
Agriengineering 07 00270 g004
Figure 5. The time–frequency diagram of pressure fluctuation at monitoring points M1–M6.
Agriengineering 07 00270 g005
Figure 6. The time–frequency diagram of pressure fluctuation at monitoring points M7–M9.
Agriengineering 07 00270 g006
Figure 7. The time–frequency diagram of pressure fluctuation at monitoring points M10–M16.
Agriengineering 07 00270 g007
Figure 8. Phase trajectory diagram of monitoring points M1–M6.
Agriengineering 07 00270 g008aAgriengineering 07 00270 g008b
Figure 9. Phase trajectory diagram of monitoring points M7–M9.
Agriengineering 07 00270 g009
Figure 10. Phase trajectory diagram of monitoring points M10–M16.
Agriengineering 07 00270 g010
Figure 11. X(i)-i curves of monitoring points M1–M6.
Agriengineering 07 00270 g011
Figure 12. X(i)-i curves of monitoring points M7–M9.
Agriengineering 07 00270 g012
Figure 13. X(i)-i curves of monitoring points M10–M16.
Agriengineering 07 00270 g013aAgriengineering 07 00270 g013b
Figure 14. Correlation dimension integral curves of monitoring points M1–M6.
Agriengineering 07 00270 g014aAgriengineering 07 00270 g014b
Figure 15. Correlation dimension integral curves of monitoring points M7–M9.
Agriengineering 07 00270 g015
Figure 16. Correlation dimension integral curves of monitoring points M10–M16.
Agriengineering 07 00270 g016
Table 1. Main parameters of the two-way channel pumping station.
ParametersValue
Design flow rate of single unit (m3/s)20
Design net head of drainage condition (m)2.61
Design net head of diversion condition (m)1.89
Impeller diameter (m)2.50
Impeller blades number3
Guide vane number7
Rotating speed (r/min)150
Single-machine power of synchronous motor (kW)1000
Table 2. Characteristic head of a pumping station.
Characteristic HeadDrainage ConditionIrrigation Condition
Maximum head (m)4.092.60
Design head (m)2.611.89
Average head (m)2.061.57
Minimum head (m)−0.1−0.3
Table 3. Measurement apparatus of the test rig.
EquipmentTypeRangeAccuracy
Electromagnetic flowmeterMF0–600 (L/s)±0.2%
Difference pressure transmitterEJA110A0–2 (bar)±0.10%
Torque-speed sensorJC0–500 (N · m)±0.15%
Digital torque and speed indicators algorithmic indicatorTS-3200B0–4000 (rpm)±0.05%
Disclaimer/Publisher’s Note: The statements, opinions and data contained in all publications are solely those of the individual author(s) and contributor(s) and not of MDPI and/or the editor(s). MDPI and/or the editor(s) disclaim responsibility for any injury to people or property resulting from any ideas, methods, instructions or products referred to in the content.