Article

Relative Sea Level and Coastal Vertical Movements in Relation to Volcano-Tectonic Processes at Mayotte Island, Indian Ocean

1
Geosciences Paris-Saclay, CNRS, Université Paris-Saclay, 91405 Orsay, France
2
Centre d’Alembert, Université Paris-Saclay, 91405 Orsay, France
GeoHazards 2024, 5(2), 329-349; https://doi.org/10.3390/geohazards5020017
Submission received: 8 February 2024 / Revised: 21 March 2024 / Accepted: 8 April 2024 / Published: 12 April 2024

Abstract

:
During the last 10 kyr, significant subsidence and uplift occurred on Mayotte Island in the Comoros archipelago (Indian Ocean), but the role of volcanic processes in Holocene vertical movements has been neglected in the research so far. Here, we show that an abrupt subsidence of 6–10 m occurred between 9.4 and 10 kyr ago, followed by an uplift of the same amplitude at a rate of 9 mm/yr from 8.1 to 7 kyr ago. A comparison of the relative sea level of Mayotte and a reference sea level curve for the global ocean has been conducted using a modeling approach. This shows that an increasing and decreasing pressure at depth, equivalent to the process caused by a deep magma reservoir (50–70 km), was responsible for ~6–10 m subsidence and 6–10 m uplift, whereas loading by new volcanic edifices caused subsidence during the last few thousand years. Surface movements and deep pressure variations may be caused by pulses from the deep mantle, related to superplume activity, but uncertainties and unknowns about these phenomena are still present and further studies are needed. A better understanding of the volcano-tectonic cycle may improve assessments of volcanic hazards.

1. Introduction

Recent volcano-seismic events in unexpected places or with significant unforeseen impacts challenge our understanding of volcanic activity. First, these events suggest that the role of volcanic activity on local natural hazards should be reconsidered [1,2,3,4,5], promoting specific studies on the reduction in risk [6] associated with volcanic activity [7,8,9,10,11,12]. Second, the potential interrelationship between short-term volcanic activity and long-term volcano-tectonic evolution challenges our understanding of volcanic processes and the evolution of Earth’s surface.
The hazards associated with volcanic activities are not simply a response to magmatic explosive or effusive eruptions and lava flows but are also a consequence of induced landslides [13,14] and of subsidence [15,16] increasing the risk of marine submersion and tsunamis [13]. Subsidence in a volcanic context may be associated, among many other causes, with loading of the volcanic edifice [15,17] or with magma reservoir deflation [18,19]. The relationship between volcanic activity and significant relative sea level variation has been highlighted in previous studies—with concerning contemporary observations and past events [20,21,22,23,24,25]. Tectonic deformations may cause either uplift or subsidence of volcanic structures [16,23]. The tectonic context of convergent, divergent, or transform boundaries (the last as in Mayotte, Comoros archipelago), may also cause vertical displacements [26,27,28,29,30,31].
Mayotte Island (Comoros archipelago, SW Indian Ocean, between Africa and Madagascar) has experienced significant seismic activity since May 2018, with more than 11,000 reported earthquakes of up to magnitude 5.9, including unusually long-period events (more than 400) and surface deflation of up to 200 mm/yr [19,32]. This seismic activity [19,32,33,34] and petrological and geophysical analyses [35,36] underline the presence of magma reservoirs at 20–30 km depth, 50 km [37] and 70 km from Petite Terre Island, Mayotte. Details of the geometry of the active system have been improved by tomography of the area [38] and petrological analysis suggests that the primitive magma came from a >10 km3 magma reservoir of evolved basanites (~5 wt % MgO) [14]. The 70 km and 50 km depth reservoirs are connected via rapid magma propagation in the lithosphere [35,39]. The diameters of the magma reservoir are 10–20 km at 20–30 km depth and 20–30 km at ~50 km depth [19,32,33,39] (Figure 1), but further studies are needed to improve our knowledge about the accurate geometries of magma reservoirs. During the 2018–2021 seismo-volcanic event, the magma reservoir at ~50 km depth suffered deflation [19,32,33,39]. This resulting movement caused the formation of an 820 m tall, 5 km3 volcanic edifice offshore on the eastern slope of Mayotte at the tip of a 50 km long volcanic ridge comprising many other recent edifices and lava flows [33].
Before the 2018–2021 event, the most recent volcanic activity in the archipelago was to the west, in the Comoros Islands (Karthala volcano), 200 km from Mayotte [40]. Studies have suggested that a hotspot would explain the sublinear E-W trend of the Comoros volcanic archipelago [41,42,43,44], but this is controversial [45,46]. Other researchers have interpreted the E-W seismic alignment in the region as highlighting the activity of structures associated with the continuity of the East African Rift and in relation to the drift of Madagascar on an E-W-trending axis [19,31,45,47]. In detail, the overall E-W trend is associated with a N130 to N160 distribution of seismicity and of the volcanic patterns along the Somali/Lwandle plate right-lateral transform boundary [31,45,48,49].
The main volcanic building phase of Mayotte Island is estimated to have occurred from 10.6 Ma to 1.25 Ma [50]. The estimated age of the initiation of the volcanism in Mayotte by Michon (2016) [51] is ~20 Ma, and by Masquelet et al. (2022) [52] is ~26.5 Ma. The lava chemistry demonstrates shallow lithospheric but also deeper mantle sources, suggesting lithospheric melt as well as the existence of an ascending mantle plume [50]. A composite polygenetic growth during a long time span is probable. The mantle depths range from 17 km to 70 km below Mayotte [33].
Volcanic island growth stages initiate with a submarine phase, that could be explosive, and the building of the volcano shield with relatively steep slopes often caused by effusive eruptions. When the shield building stage allows the volcano to reach the sea, surface erosive processes increased due to the interaction with sea waves. Due to the enormous weight of the shield volcanoes, subsidence occurred and reef growth is documented. (Volcano subsidence could be very low to moderate, as in the Canary Archipelago (until 2 mm/yr) [53,54], or moderate to high, as at the Hawaii (until 4.8 mm/yr) [55].
Here, I focus on volcanic activities during the last thousands of years. Some volcanic events on Mayotte have been dated to 6.5–7 kyr B.P. (ash), 8 and 2.2 kyr B.P. (phonolite), 4 kyr and 4.12 ± 0.04 kyr B.P. (pumice stone), and 5.98 ± 0.14 kyr B.P. (volcanic mud) [56,57,58]. These activities highlight volcanic episodes during the Holocene. However, the volume of volcanic materials that erupted during this phase is unknown. Furthermore, the duration of the complete volcanic cycle from magma ascent to volcanic edifice construction in Mayotte during the Holocene has never been estimated.
Relative sea level may be used to quantify vertical movements [17,22,59,60,61]. Previous studies on coral reefs have obtained accurate data on relative sea levels in Mayotte during the Holocene [56,57,58,62,63,64,65]. These studies have discussed the role of climate variation and postglacial floods, as well as glacio-hydro-isostatic adjustment, on relative sea level. After the last glacial age, maximum sea levels rose at a mean rate of 10–12 m/ka between 14 and 8 kyr B.P. [61,66,67], but the rate slowed in the last 7 ka. However, the potential effects of volcanic and tectonic activity, as well as abrupt mass unloading (erosion or landslides), on relative sea level rise and fall have not been analyzed in Mayotte.
This study considers vertical movement of Mayotte in the last 10 kyr by modeling magma reservoir pressure together with volcanic edifice loading and compares these parameters with global/relative sea level discrepancies. More precisely, volcanic activities, such as magma reservoir overpressure (amplitude and duration) and the volume of volcanic edifice during the last 10 kyr in Mayotte, are estimated. The implications of these results at the regional scale are discussed.

2. Materials and Methods

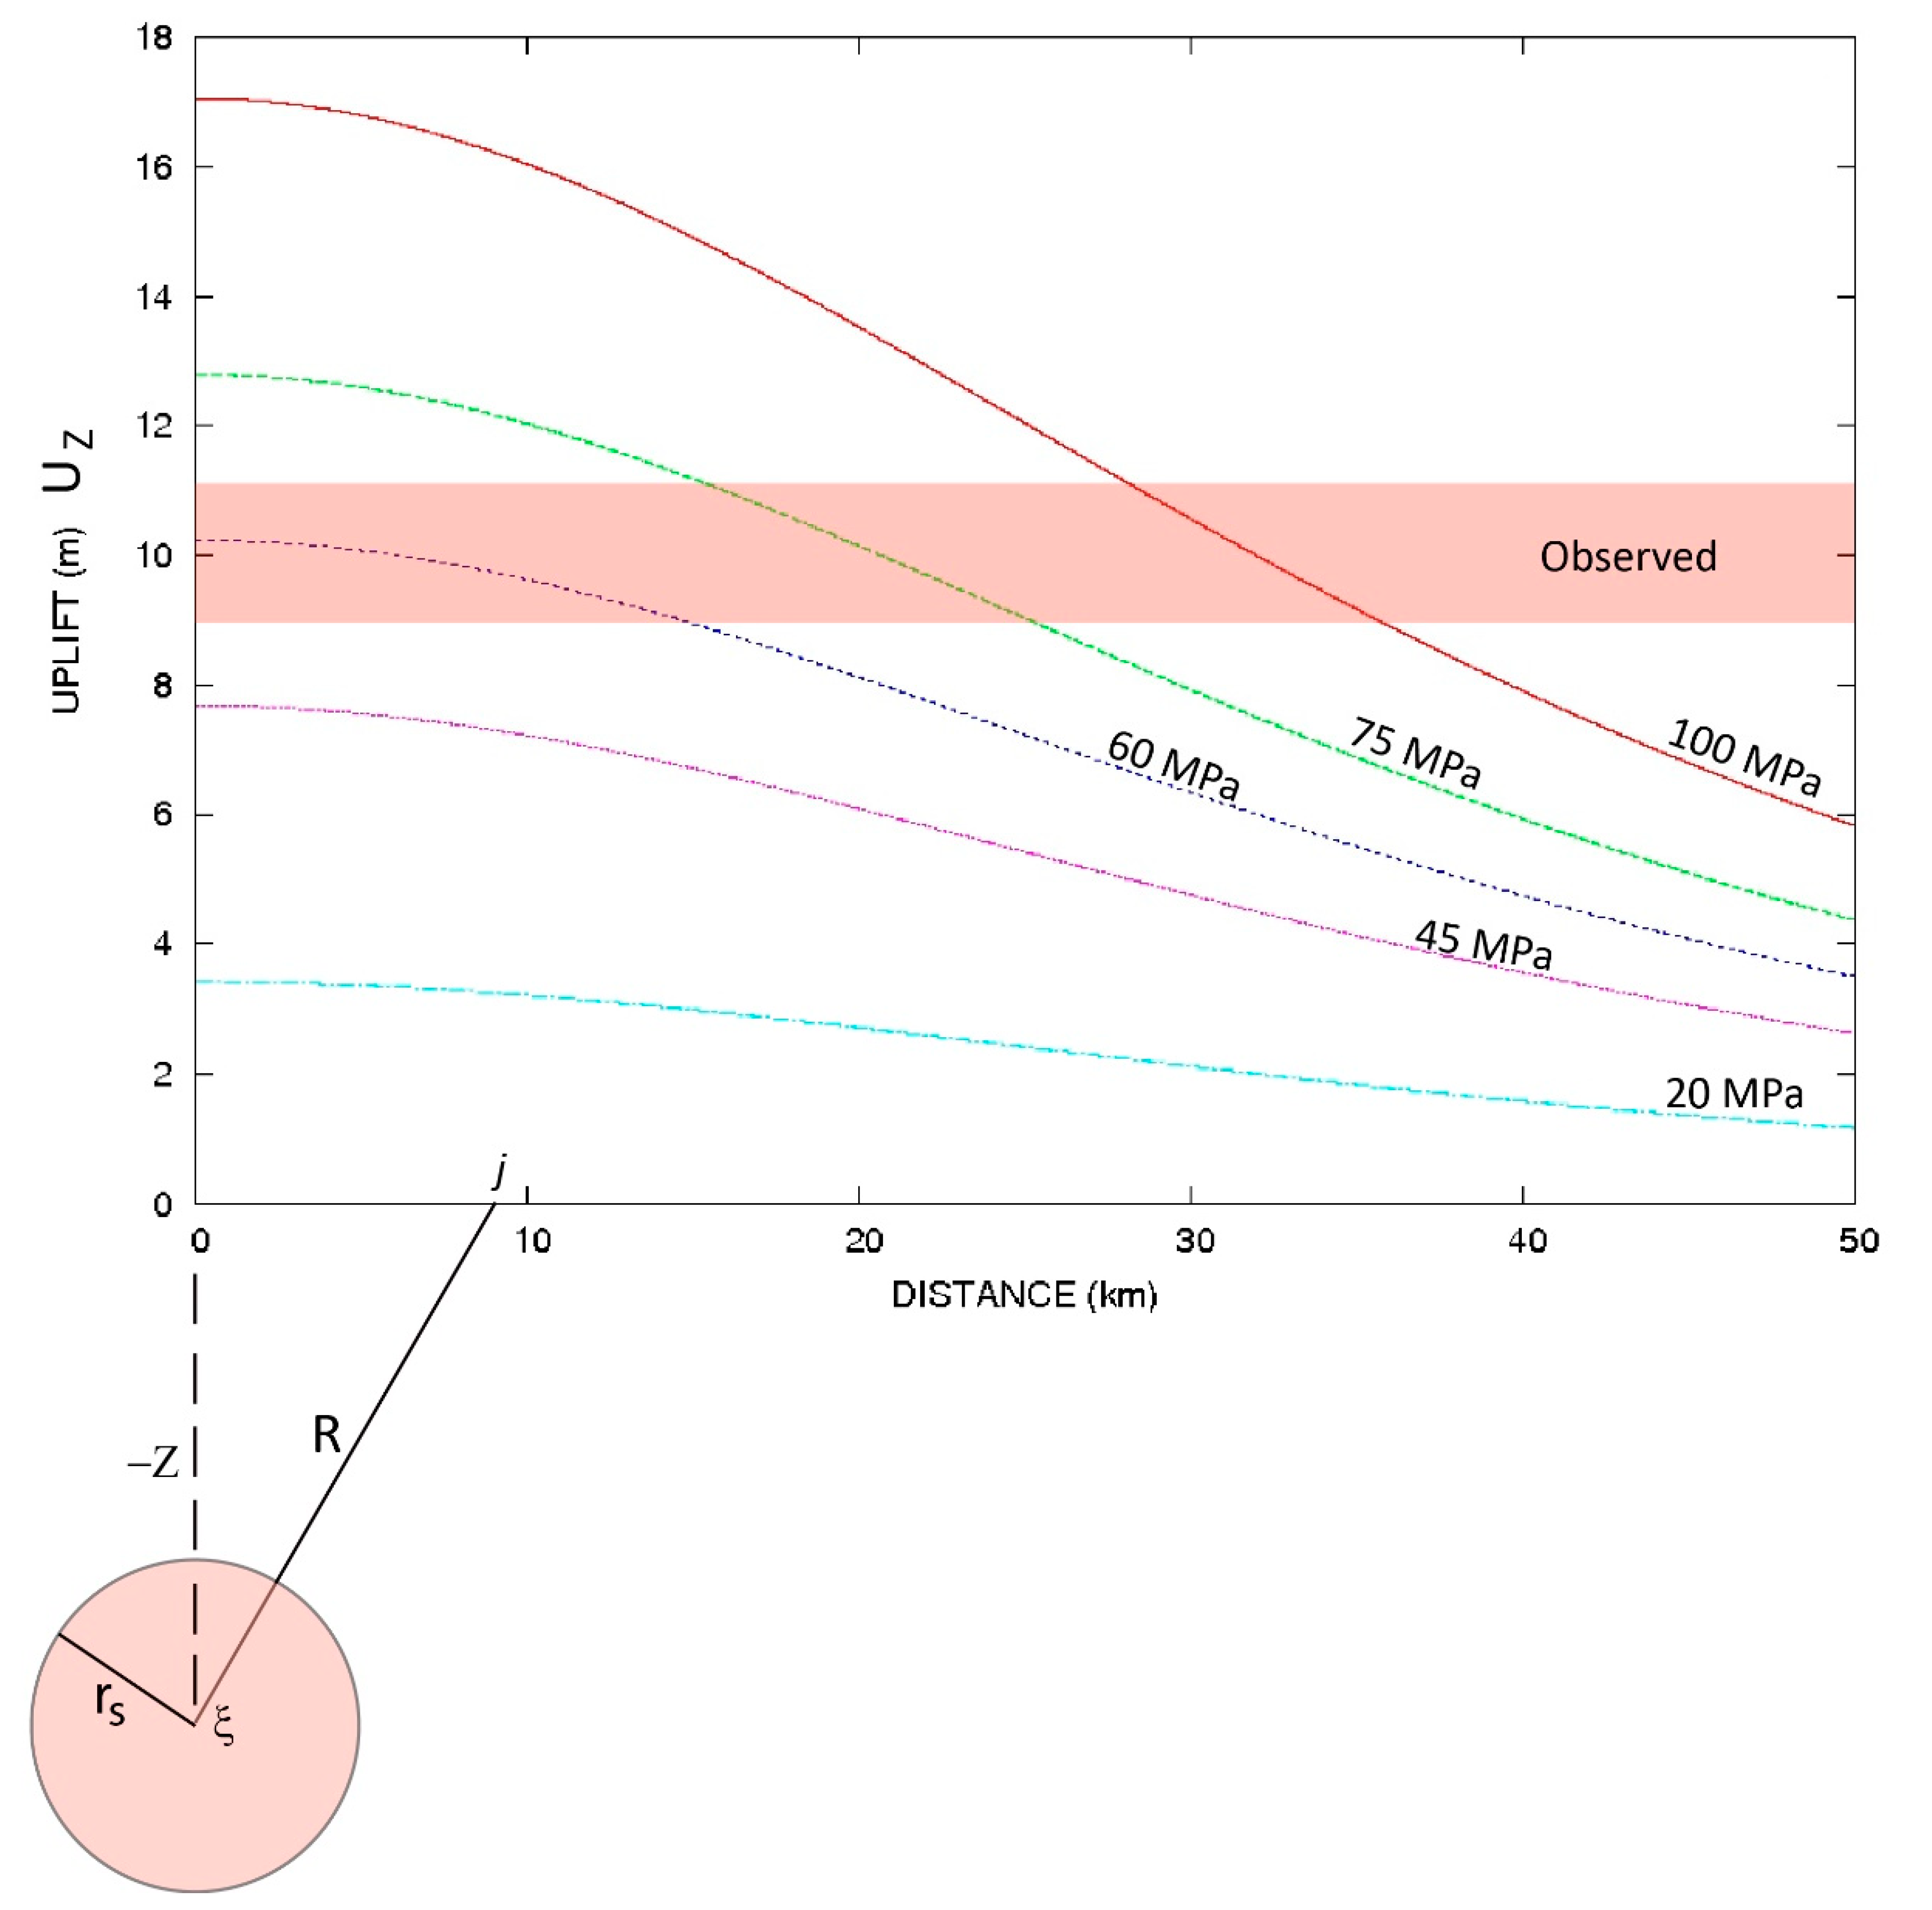
2.1. Overpressure and Surface Uplift

The vertical displacement Uz of a spheric magma reservoir of radius rs at a depth −Z with an overpressure ∆P is given by the following equation [68,69]:
Uz = (1 − ν) (∆P rs3 Z)/[G (R2 + Z2)]3/2 × [1 − (rs/Z)3 × [(1 − ν)/[2 (7 − 5ν)] − [15 (2 − ν)]/[4 (7 − 5ν)] × Z2/(R2 + Z2)]]
where ν is the Poisson’s ratio for simplicity fixed at ν = 0.25, and R is the distance from the expansion source embedded at position ξ to point j on the free surface and corresponds to the radial distance from the source (center of the magma chamber). G is the shear modulus and usual values of 15 GPa are considered [70]. The shear modulus G = E/(2 × (1 + ν)) could range between 12 and 30 GPa, when the Young’s modulus E ranges between 30 and 75 GPa [71,72,73].
The depths of the magma reservoir that are considered in this study are 20 km, 50 km [37], and 70 km, which agree with the estimates by Feuillet et al. (2021) [33]. The radii of the modeled magma reservoirs range from 5 km to 25 km, in agreement with recent studies by Berthod et al. (2021) [35], Cesca et al. (2021) [32], Feuillet et al. (2021) [33], Foix et al. (2021) [38], and Dolfal et al. (2022) [37]. The magma reservoir is considered as a sphere because there are no arguments to give any accurate shape. The horizontal distance between the center of the magma reservoir and the point influenced by vertical movement is at the maximum of 20 km, as suggested by the location of the caldera and the distance of the Caldera from the Mayotte lagoon (Figure 1B). The influence of magma reservoir pressure at different depths was also modeled. The overpressure and depressurization tested in this study range from 20 to 150 MPa following Gerbault et al. (2012) [74]. Overpressure was estimated using the observed uplift of 10 ± 1 m.

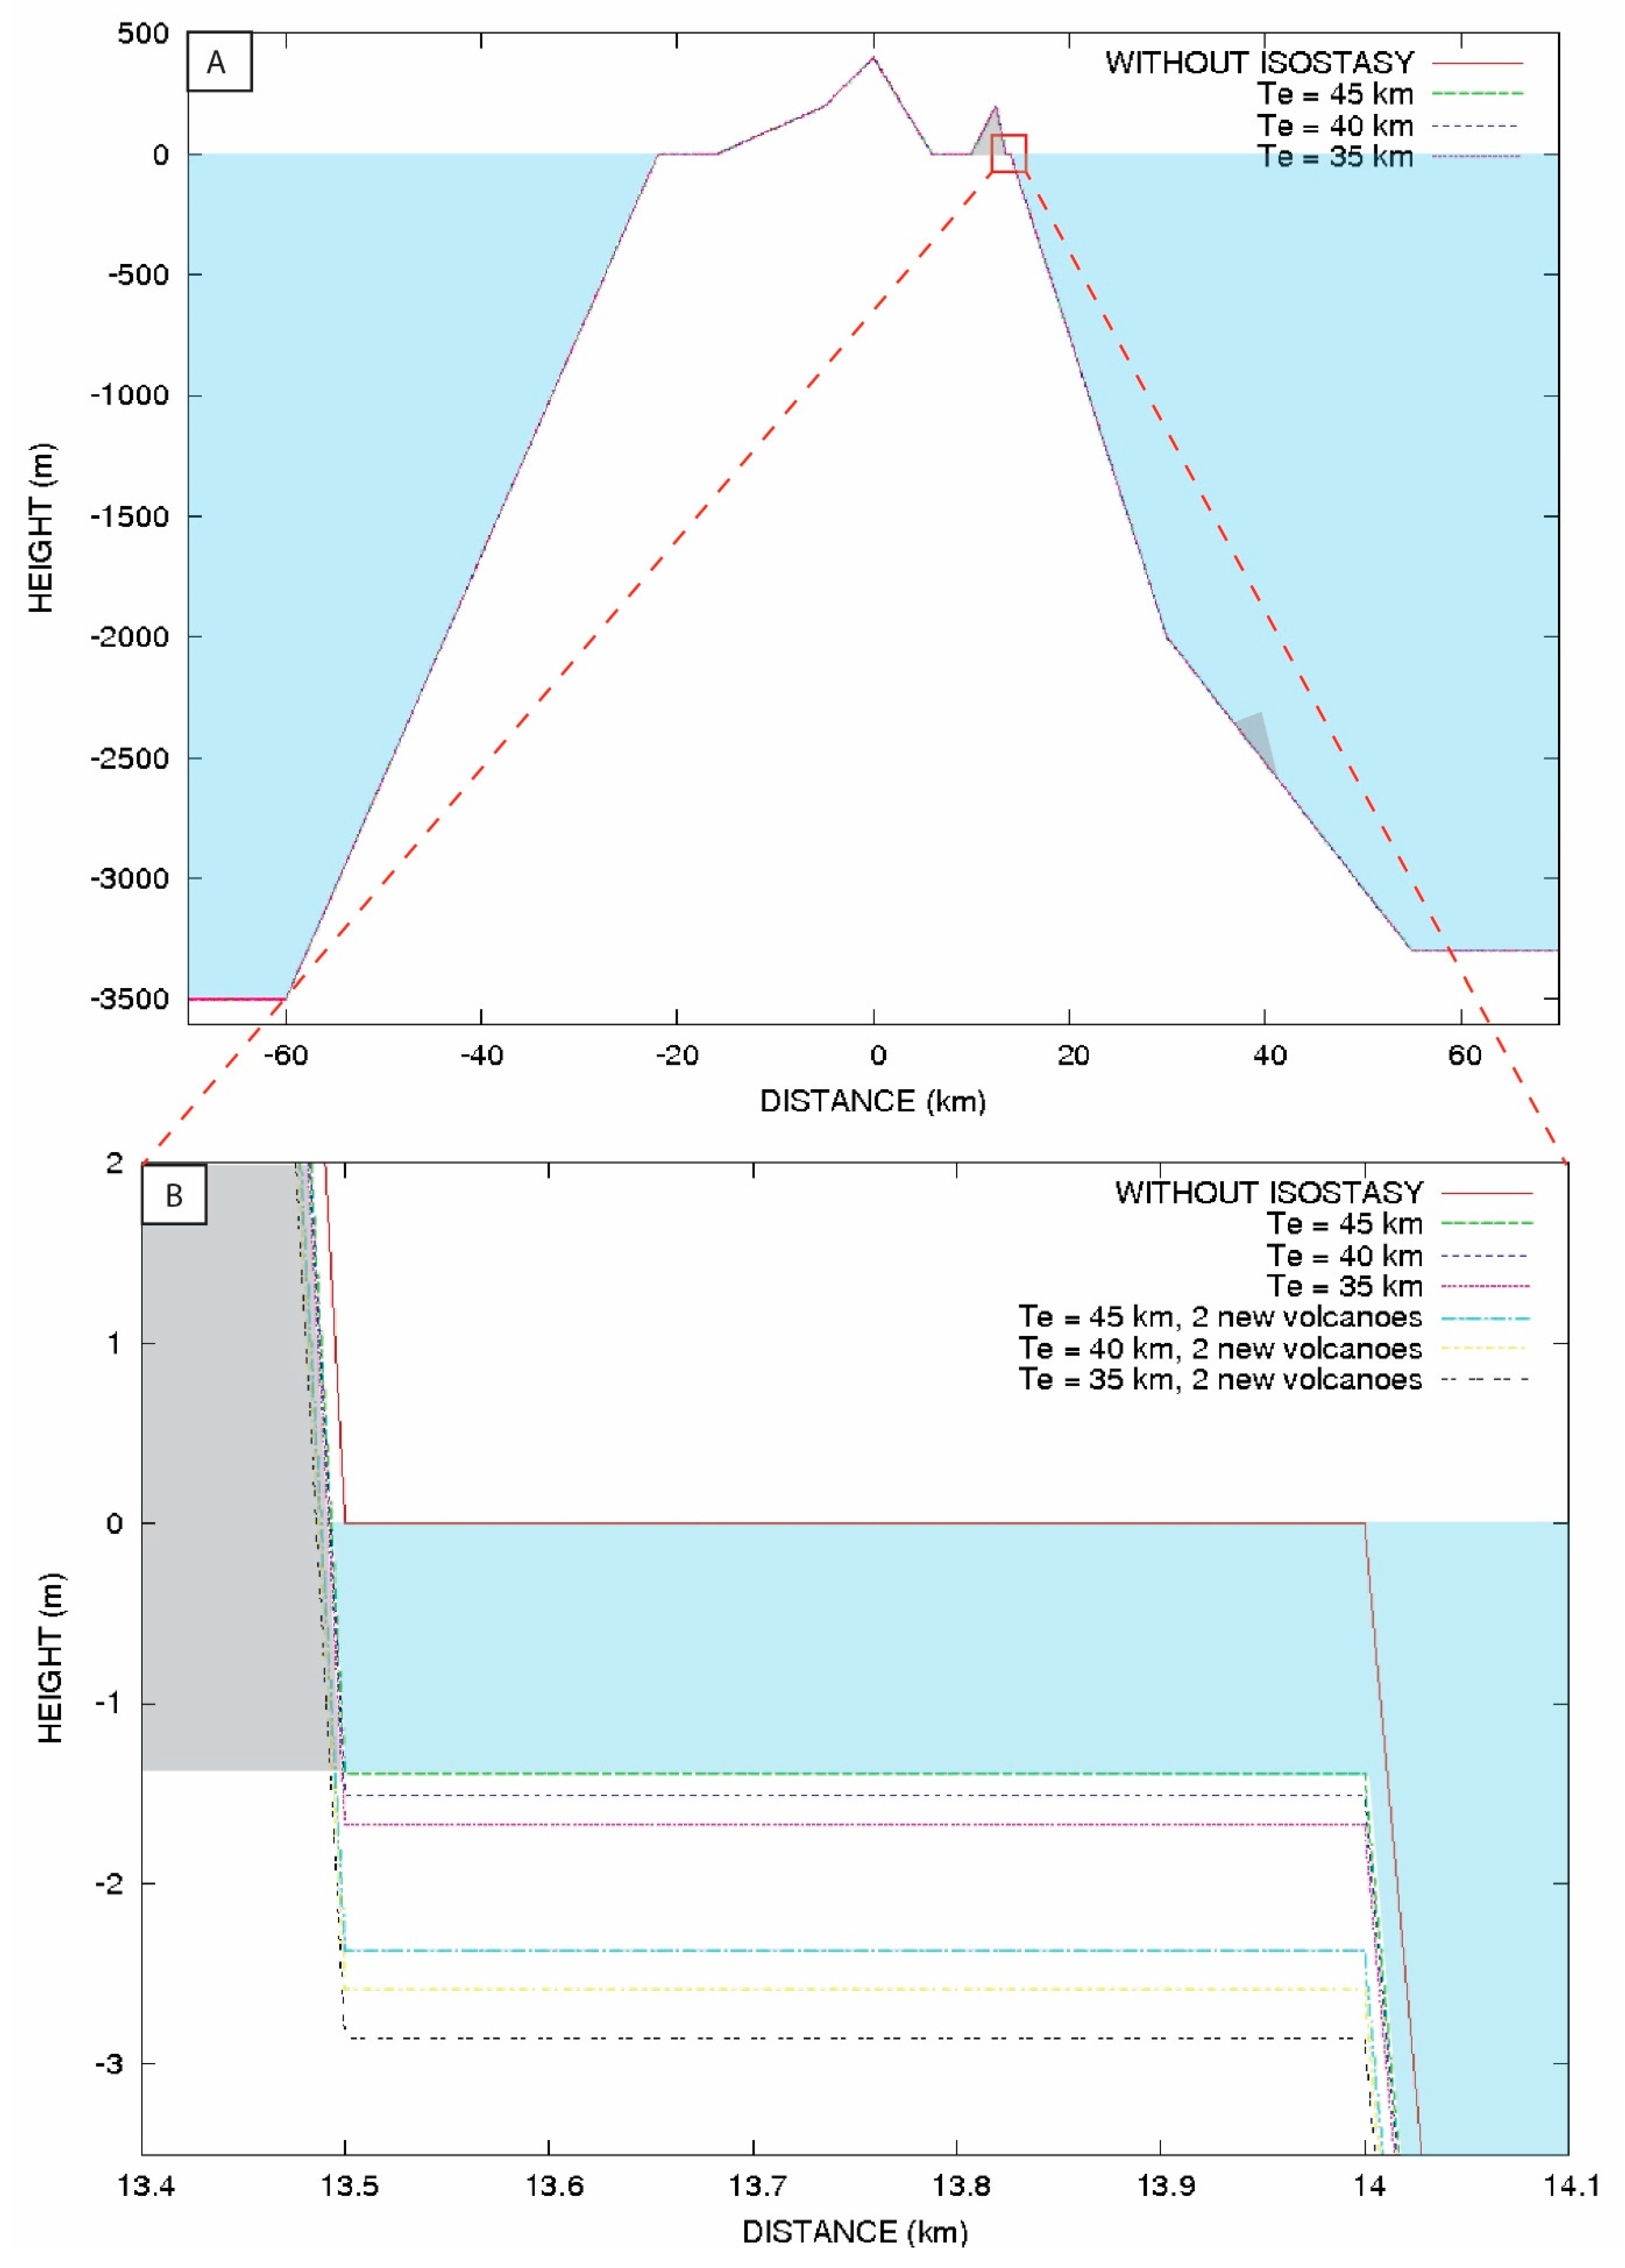
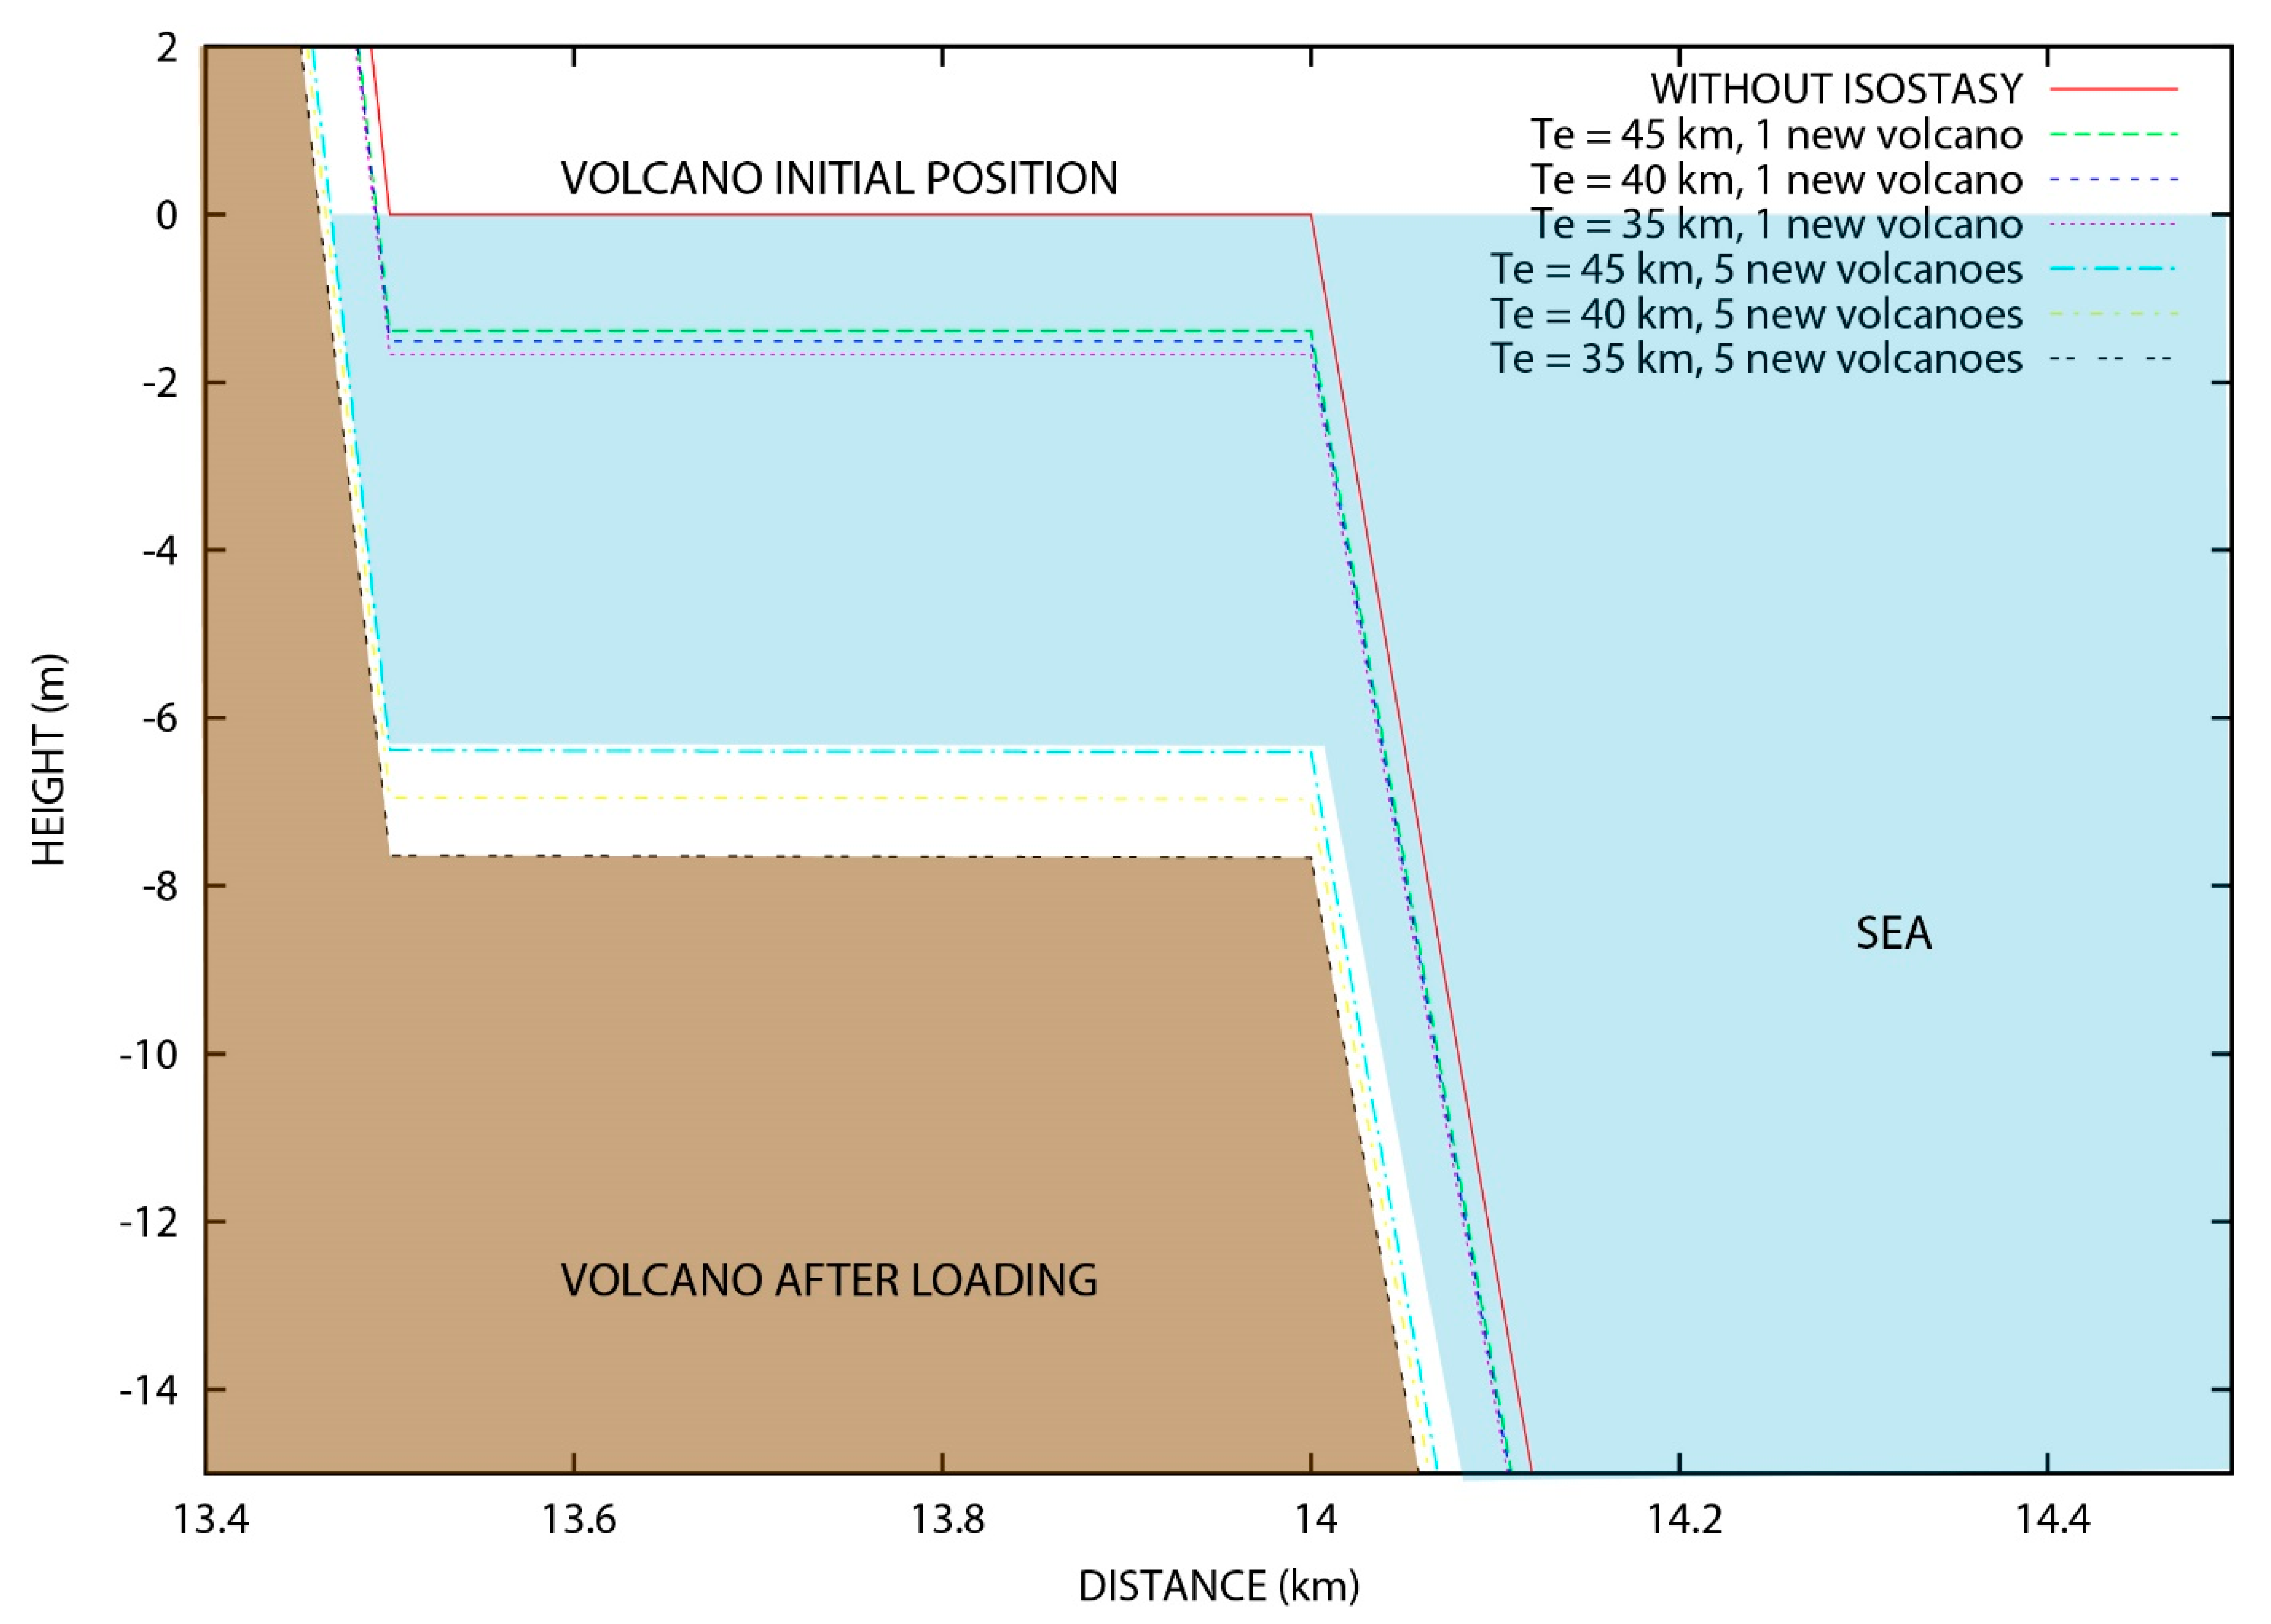
2.2. Volcanic Edifice Loading and Isostatic Adjustment

The loading of volcanic edifices on the lithosphere causes subsidence [15]. Modeling the isostatic adjustment in response to loading is performed using a classical law [75] that has been applied in various studies [76,77,78]. Turcotte and Schubert (2001) [75] used the equation ∇2(D∙∇2w(x)) + (ρa + ρv)gw(x) = ρvg[zinit(x) + z(x)] to model the flexure of the lithosphere, where D is the rigidity of the lithosphere, w(x) represents the uplift, ρa and ρv are the densities of the asthenosphere and volcanic rock, g is the acceleration of gravity, zinit(x) is the initial topography and z(x) is the topography after the construction of the new volcanic edifice. The rigidity is defined by D = ETe3/[12(1 − ν2)], where E is Young’s modulus and Te is the effective elastic thickness.
The E-W sublinear trend of the Comoros volcanic archipelago allows us to analyze the symmetry axis of this 200 km long structure and to simplify the numerical problem using a 2-D approach. This is a first order approximation adapted to the objective of the present work. The elastic thickness in Mayotte is 40 ± 5 km [79], corresponding to a flexural rigidity that ranges from 3.8 × 10²² N.m2 to 8.1 × 10²² N.m2. In the calculation, E = 1010 Pa.
The resulting vertical motion rates are calculated by considering a constant displacement during the 10 kyr after the abrupt mass displacement, which is the time necessary to relax the viscous properties of the lithosphere 10 ± 5 kyr after isostatic adjustment [80,81]. The average velocity obtained is a first-order estimation sufficient to describe the main dynamics of the system.
Different loading masses corresponding to various volumes of volcanic rock involved in volcanic edifice building were simulated in models of several volcanic edifices 200 m tall and with diameters of 3.5 km as suggested by bathymetric data [48,49,82], corresponding to a conical volume of 0.6 km3 and a mass of 1.8 × 10¹² kg. This study discusses the loading mass that explains the observed subsidence. Two different locations have been considered (0 km and 20 km from the coast of Mayotte) [33,83] and results have been compared with observed vertical movements.

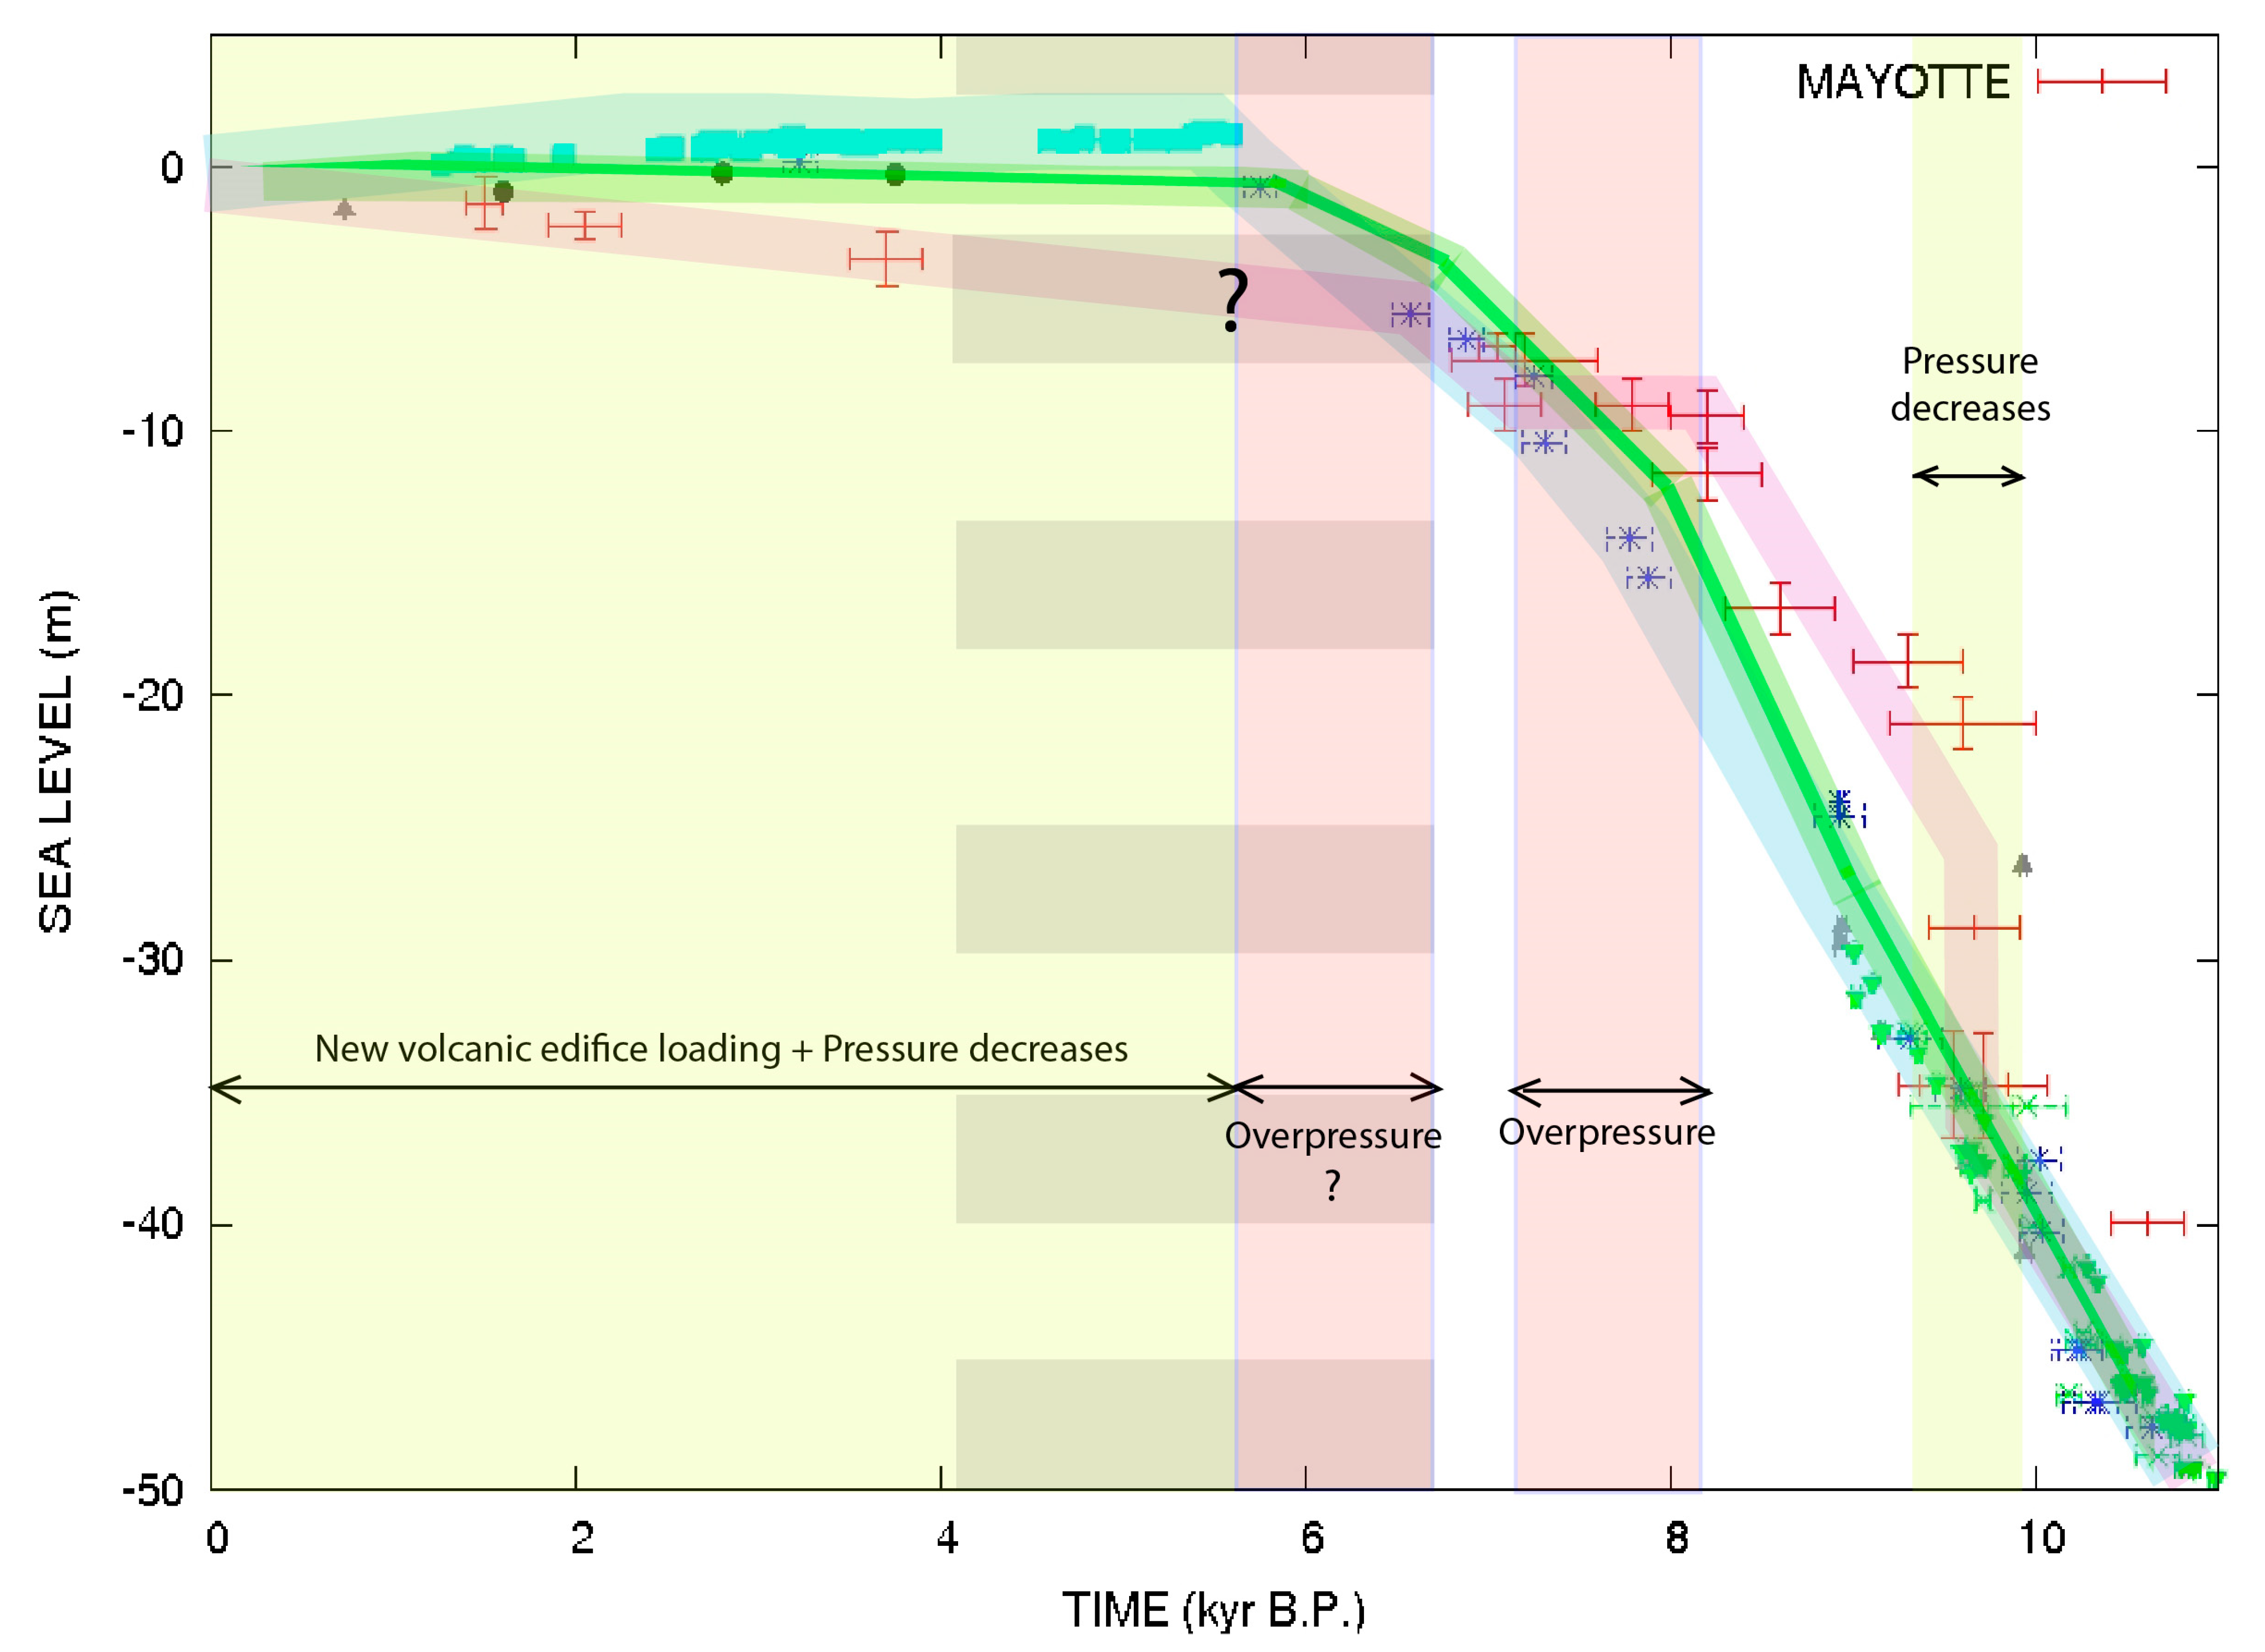
2.3. Relative Sea Level and Vertical Movement

Samples from well-preserved coral reefs in Mayotte have been dated [58,62,63] and used to produce a relative sea level curve [58,63]. The 14C data from Zinke et al. (2003) [63] were recalibrated using a radiocarbon calibration program CALIB REV8.2 [84] and more recent calibration datasets, such as Marine20 [85] and SHcal20 [86], than IntCal98 and Marine98 that were used to recalibrate Mayotte’s 14C ages in a previous study (Table 1). The Marine20 dataset was used to recalibrate 14C ages of marine samples (bivalves, molluscs, in situ corals), whereas the SHcal20 dataset was used for continental/organic samples (mangrove roots fragments, organic matter). The recalibration using the SHcal20 dataset is more appropriate than IntCal20 [87] because Mayotte is in the southern hemisphere. However, recalibration using the SHcal20 dataset provided only very small differences from our IntCal20 recalibration results. The complete dataset reconstructing relative sea level on Mayotte has been produced using U-Th age from Camoin et al. (1997) [62], and 14C ages from Zinke et al. (2003) [63] (Table 2) recalibrated in this study with depth estimated by Zinke et al. (2003) [63] (Table 2). In the case of Mayotte, there are two contemporaneous variations: (1) the global ocean level variations identical all around the Earth, called “reference sea level variations” or “reference sea level curve”, (2) the Mayotte Island uplift/subsidence due to volcano-tectonic processes.
In Mayotte, these two processes have been recorded in the sediments/coral reef. These records are called “relative sea level variations”, but is caused by both processes (i.e., global ocean level variations and local uplift/subsidence in Mayotte). This does not mean that the sea level was different in Mayotte in comparison to the sea level elsewhere, but that the records of past sea levels have been modified by vertical movements. Alternatively, the difference between the “reference sea level” and the “relative sea level” permit one to estimate the vertical movements caused. Comparison of the relative sea level curve of Mayotte with a reference sea level curve permits estimation of the vertical movement in Mayotte from 10 kyr to 1 kyr B.P.
The reference sea level curve used in this study was based on Bard et al. (1990; 1996; 2010) [88,89,90], Deschamps et al. (2012) [91], and Hallman et al. (2018) [92] for Tahiti, and Peltier and Fairbank (2006) [93], Abdul et al. (2016) [94], and Bard et al. (1990) [95] for Barbados. In this study, the reference sea level curve is reconstructed by using two accurate datasets instead of heterogeneous data. The reference sea level curve reconstructed far from the study area is not impacted by local deformation. During the last 12 kyr, the difference between these two sets is not significant, as suggested by the comparison with the Lambeck et al. (2014) [67] reference curve (Figure 2). For accuracy, only U–Th ages are used for the reference sea level curve. For coherence, only the coral Acropora palmata from Barbados is included in the reference curve. For the construction of the sea level curve using Tahiti data, I have used subsidence rate corrections of 0.25 mm/yr before 6 kyr B.P. [88,95] and 0.15 mm/yr after 6 kyr B.P. [90]. Uplift rates of 0.34 mm/yr before 11.18 kyr B.P. and 0.8 mm/yr during the last 11.18 kyr B.P. are used for Barbados [17,96].
The uncertainties are associated with the following: (i) the collection of samples in Mayotte lagoon, (ii) the distances between coral reefs that could reach more than 10 km, (iii) dating method uncertainties for mangrove roots as well as coral reefs, (iv) the uncertainties of the position of the sea surface that is inferred from the coral species, and (v) the uncertainties associated with the reference sea level curve reconstruction. In particular, the depth estimates of drilling methods, coral reefs, and mangrove roots generate uncertainties on the paleo sea level that cannot be neglected. Zinke et al. (2003) [57] estimated that sea level involved a maximum of 2 m uncertainty, but in many cases, uncertainty is less than 1 m. To avoid any underestimation, an uncertainty of 4 m will be considered for the interpretation.

3. Results

Comparison of the relative sea level in Mayotte and the reference sea level suggests that subsidence of the Island of Mayotte of approximately 6–10 m occurred abruptly between 10 and 9.4 kyr B.P., taking less than 600 yr at a minimum rate of 16.7 mm/yr (Figure 3). This was followed by uplift of +6–10 m occurred from 8.1 to 7 kyr B.P. during 1.1 kyr at a rate of 9 mm/yr. From 6 ± 0.4 kyr B.P. to 5.8 ± 0.5 kyr B.P., the increasing difference between the reference sea level curve and the relative sea level curve of Mayotte suggests an uplift of around 4 m in 0.5–2 kyr. Progressive subsidence at a maximum rate of 1.0 ± 0.1 mm/yr occurred from 5.8 ± 0.5 kyr B.P. to 1 kyr B.P.
An increase in the pressure at depth, equivalent to the one that could be estimated in the magma reservoir associated with some magma ascent, could explain the uplift of the surface observed between 8.1 and 7 kyr ago. More precisely, an overpressure of 80 ± 20 MPa at a depth of 50 km with a diameter of 20 km could explain an uplift of 10 ± 1 m (Figure 4). The position of magma reservoirs with different radiI and their distances from the Mayotte Lagoon (around Petite Terre –PT– and Grande Terre –GT–), where the coral reef has been collected, is represented in Figure 1B. Equally, an overpressure of 80 ± 20 MPa at a depth of 70 km with a magma reservoir with a radius of 25 km could produce similar uplift (Figure 5). Overpressure of 40 ± 20 MPa at a depth of 50 km explains only a 4 m uplift (Figure 4).
The cause of the 6–10 m subsidence that occurred 9.7 ± 0.3 kyr ago in Mayotte could be explained by a decrease in pressure by the same order (i.e., a pressure decrease of 80 ± 20 MPa at a depth of 50 km, with an equivalent magma reservoir size of 20 km, or a pressure decrease of 80 ± 20 MPa at a depth of 70 km for an equivalent magma reservoir with a radius of 25 km). With a maximum duration of 600 yr for abrupt subsidence, the minimum subsidence rate for this example was 1.6 cm/yr. This hypothetical and putative existence of a very deep reservoir able to produce significant effects during non-negligible durations will be discussed later. The potential influence of other processes on this vertical movement will be discussed later.
The subsidence that occurred in the last few thousand years (observed by comparison between Mayotte data/model and the reference sea level curve) could be due to the progressive deflation of a deep structure and/or a loading of the lithosphere by one or more new volcanic edifices. In this study, I also explore the potential role of the volcanic edifice loading on vertical movements without excluding the other processes, such as the potential contemporaneous effect of a magma reservoir deflation. The loading by a volcanic edifice located at a distance of 0 km from Mayotte with a height of 200 m and an elastic thickness ranging from 35 km to 45 km caused 1.4 ± 0.2 m of subsidence due to isostatic adjustment (Figure 6). This value corresponds to a subsidence rate of 0.14 mm/yr, assuming a duration of 10 kyr for isostatic adjustment. Considering a second edifice 200 m high at a maximum distance of 40 km from Mayotte (GT), the total subsidence could reach 2.5 m. To obtain the observed subsidence rate of ~1.0 mm/yr (i.e., 6.5 m in 6.5 kyr, Figure 3), it is necessary to load the lithosphere by a mass of 12.6 × 10¹² kg, corresponding to a volume of 4.2 km3 (i.e., equivalent to five volcanic edifices; Figure 7). Deflation of a deep structure with a pressure reduction of 40–75 MPa at depths of 50–70 km could cause a subsidence of 6–7 m (Figure 4 and Figure 5) with similar subsidence rates.

4. Discussion

4.1. Vertical Movement Rates

The total vertical movement sequence in Mayotte is characterized by an abrupt subsidence of approximately 6–10 m at 9.7 ± 0.3 kyr ago, at a minimum subsidence rate of 16.7 mm/yr. From 8.1 to 7 kyr ago, a progressive uplift of 6–10 m at a rate of approximately 9 mm/yr resulted from increasing pressure at depth. A second episode of increasing pressure is suggested around 6 kyr B.P., but the duration is not well defined (Figure 3). Slow subsidence, caused by deep magma reservoir deflation and/or loading by new volcanic edifices, are potential long-term evolutionary processes in this area.
The magnitude of the abrupt subsidence rate that occurred 9.7 ± 0.3 kyr ago or slightly before can be compared to the subsidence rate that occurred from May 2018 to January 2020 in Mayotte, even if the duration is different (i.e., ~2 yr vs. ~100–600 yr). It is estimated that at the peak of the volcanic event, downward surface deformation was 186 mm/yr, and the observed mean subsidence was 120 mm in 1.5 yr using the Global Navigation Satellite System (GNSS) and Interferometric Synthetic Aperture Radar (INSAR) during the 2018–2021 event [19]. The approach developed in this study allows an approximation of the vertical movements that provides some insight into the first order dynamic of Mayotte during the last 10 kyr. Comparing long-term (>1000 yr) and short term (<daily) vertical movements is tricky but gives some insight about potential processes. Even if alternative interpretations are possible, such as a purely tectonic process or shallow volcanic processes, it seems difficult to exclude the role of deep volcanic dynamics.

4.2. Influence of Tectonic Processes

Seismicity is documented along an E-W trending axis. A right-lateral strike-slip transform fault [45,47] located at the boundary between the Somalia plate and the Lwandle plate (Figure 1) allows for interpretation of the seismicity and deformations and is compatible with a relative velocity along the plate boundary of less than 1 mm/yr [47]. Historical focal mechanisms indicate mainly E-W strike-slip deformations, but indications of normal faulting were also observed during the 2018–2020 seismic swarm, striking N-S along the Davie Ridge, and, rarely, of thrust faulting focal mechanisms [45]. Volcano-tectonic activities such as the ones that occurred in 2018–2020 are able to produce vertical movements. However, E-W strike-slip transform faulting is not expected to cause vertical movements. An en échelon faults geometry, with the ability to cause vertical movements, is not documented locally. There are still knowledge gaps about the regional tectonic and geodynamic context [45]. In this context, a pure tectonic process cannot be discarded, as well as the influence of a pure volcanic process. In the present study, the maximum influence of volcanic processes has been investigated. The volcano-tectonic activity is relevant to explain the vertical movements that occurred in this area during the Holocene. Accurately discriminating volcanic from tectonic processes in the Mayotte geodynamical context is difficult, also considering that these processes are not totally independent. Furthermore, seismicity is recorded and contributes to the observed deformations during volcanic events.

4.3. Vertical Movements and Isostatic Adjustments

The rapid and relatively brief (<0.6 kyr) subsidence that occurred 9.7 ± 0.3 kyr ago cannot be explained as a result of loading of isolated new volcanic edifices due to the duration of isostatic adjustment (10 ± 5 kyr). Glacio-isostatic adjustment should be correlated with specific climatic change [98] (i.e., mass loading caused by the change in the weight of the seawater and ice), which is not the case here. Similarly, the significant uplift from 8.1 to 7.1 kyr cannot be explained by abrupt mass unloading. Landslides or erosion might cause isostatic adjustment, and influence either subsidence or uplift rates and relative sea level, but over a longer period [17,61]. But, such phenomena cannot explain uplift that lasted for 1 kyr because isostatic adjustment would take ~10 times longer [80,81]. Erosion and landslides in Mayotte [2,99] have not caused significant isostatic adjustment in the last 13 kyr, because a permanent uplift or a reduction in subsidence would be visible.
The estimated subsidence rate of 1.0 ± 0.1 mm/yr of Mayotte from 5.5 ± 1 kyr to 1 kyr B.P. might have been caused by loading from new volcanic edifices and/or by magma reservoir deflation. Slow subsidence is active on the island [57,58], but estimated long-term subsidence rate for this period is slightly higher than that estimated over longer periods, ranging from 0.13 to 0.25 mm/yr [58]. However, neglecting vertical fluctuations of −6–10 m at 9.7 ± 0.3 kyr B.P. followed by +6–10 m from 8.1 to 7 kyr BP (and also the potential vertical fluctuations that may have occurred between 6.5 and 4 kyr B.P.) provides an average subsidence value of approximately 3.5 ± 1 m in 12 ± 1 kyr B.P., in agreement with previous studies [58].
New volcanic edifices have been built in the last few thousand years during the sea level rise, including relatively young volcanic features east of Mayotte [1,33,48,49], along the slope of the main structure and volcanic rocks ranging in age from 2.2 to 7.965 kyr [56,57,58]. To our knowledge, there are no published ages for submarine edifices on the Mayotte slope. The beginning of the current subsidence phase, during the last few thousand years, is not well defined and could have been from 7 to 4.5 kyr B.P., compatibly with the depth/age of the most recent coral reefs in Mayotte.
A delay of around 10 kyr between sea level lowering and increasing magma reservoir pressure may be a consequence of the viscous properties of the lithosphere [21,25] and consequently the volcanic activity recorded at 9.7 ± 0.3 kyr could results from the low stand at 24 kyr to 18 kyr BP [66,67]. However, neither this potential effect nor its duration are well studied.

4.4. Volcanic Activity and Deep Magmatic Root

A decrease in magma reservoir pressure, beginning at 9.7 ± 0.3 kyr B.P., or an increase from 8.1 kyr to 7.1 kyr, is consistent with the volcanic context, as attested by the current eruption observed since 2018 in offshore Mayotte, and explains the vertical movements (Table 3). The observation of altered phonolite in the Mayotte lagoon dated at 7.965 ± 0.045 kyr also suggests volcanic activity [57]. Phonolite has been also observed onshore [99] and in the deep offshore, in a horseshoe-shaped caldera [35]. The presence of various volcanic rocks, such as ankaramitic basalt [99], phonolite [57,99], pumice-stone [57], basanite, and tephra-phonolite [10]) suggests that different volcanic dynamics [100] extended along the chain. A deep magma reservoir has been suggested by the study of the recent volcano-tectonic activity in Mayotte [33]. The cores and rocks dredged offshore during the post-2018 marine surveys, MAYOBS, SISMAORE, SCRATCH, and GEOFLAMME [101], will certainly provide new ages for volcanic activity. Seismological findings that show a complex geometry of a plume of hot upwelling rock rooted in the deep mantle, imply the existence of hotspot volcanism beneath the Comoros archipelago [102,103,104].
A negative seismic velocity anomaly indicative of hot materials can be observed below Mayotte and the Comoros archipelago (Figure 8) in a global radially anisotropic shear-velocity model of the earth’s upper mantle and transition zone [102,105]. Geophysical observations are consistent with geochemical data showing a nonvolatile superplume isotopic signature in the Comoros–Mayotte and Madagascar systems [103]. The geochemical and petrographic characteristics of lavas from Mayotte indicate a deep mantle source [50,106]. In turn, this suggests a complex hotspot origin for volcanic activity [41,107] or upwelling, reflecting complex volcano-tectonic activity at the boundary between the Somali and the Lwandle plates, in the extension of the East African Rift. A wholly tectonic process could have caused vertical deformation and cannot be excluded. The accurate volcano-tectonic cycle that may have occurred has to be better documented (volcanic activity ages, volcanic and tectonic geometries and processes) and modeled. Nevertheless, the occurrence of volcanic activity at this time suggests that it may have contributed to the vertical deformations observed. The relatively persistence (1 kyr) of the deep (50–70 km) overpressure suggests that the magmatic pulsing beneath Mayotte and the Comoros in the past 13 kyr was caused by deep mantle processes [108]. Potentially, this mantle/asthenospheric flow might be a pulse from either a complex hotspot system or a tectono-volcanic system with a deep root in the extension of the East African Rift, at the boundary of the Somali and Lwandle plates (Figure 8). An incipient plate boundary or a mantle heterogeneity could have triggered the volcano-tectonic evolution [109] and caused a complex volcano-tectonic cycle.

4.5. Uncertainties and Unknown

Uncertainties regarding the reference sea level curve may be estimated by comparison with Lambeck et al.’s (2014) [67] results. The reconstruction proposed here is identical to the Lambeck et al. (2014) [67] curve from 12 to 10 kyr, but is 0.5–3 m below the Lambeck et al. (2014) [67] curve from 10 to 6 kyr B.P., and slightly above the curve from 6 to 1 kyr BP (Figure 2). As a consequence, there are a maximum of 2 m of uncertainty on the reference curve. The conclusions here are compatible with a total of 4 m of uncertainty.
The results suggest that a variation of pressure at depths equivalent to those caused by a magma reservoir located at a 50–70 km depth is able to fit the data (Figure 4 and Figure 5). Uncertainties regarding the depth and radius of the potential magma reservoir are significant but are compatible with interpreting observed vertical movements as evidence of the influence of magma activity. The maximum uncertainties on the reservoir characteristics are 20 km for depth, 20 km for lateral position of the center of the magma reservoir from the coral reef, 10 km for diameter and 40 MPa for pressure. At depth > 50 km, a pressure increase of ∆P > 100 MPa is necessary to cause vertical movements > 6 m with an equivalent magma reservoir radius of <20 km. If shallow magma reservoirs (~20 km depth) could cause significant vertical movements with moderate pressure variation (~50 MPa) of a large magma reservoir (~10 km), it is necessary for deep magma reservoirs (>50 km) to be very large (>15 km) and experience high pressure variations (>100 MPa) to obtain the same results (Figure 9). Deep sources spread their effects over large areas. The accurate position of the magma reservoir relative to the Mayotte lagoon is not known. However, the position of the seismicity during the 2018–2020 eruption, as well as the offshore caldera position around 10 km to the east of the Mayotte lagoon, suggest that the center of the deep magma reservoir is located at a maximum lateral distance of 20 km from the Mayotte lagoon where the data have been collected. This study suggests a maximum vertical movement rate caused by deep volcanic processes. The fact that the potential values for the parameters vary means that the interpretation of the vertical movements may be used to improve the development of models, especially those that explain the duration of the processes. The relationship between very deep processes and surface movements must be still improved.

5. Conclusions

During the last 10 kyr, significant magmatic activity caused uplift and subsidence in Mayotte. The subsidence of −6–10 m is interpreted as due to a pressure decrease at 9.7 ± 0.3 kyr B.P., whereas the uplift of +6–10 m is caused by a pressure increase of 80 ± 20 MPa at 50–70 km depth. The significant duration of the overpressure may reflect a quasi-permanent deep magmatic flow lasting 1 kyr and suggests a deep magmatic root. The increase in pressure was contemporaneous with volcanic activity. The accumulation of volcanic material around the Mayotte edifice could have contributed to the slow subsidence of more than 2.5 m in the last few thousand years. The volcano-tectonic cycle of approximately 10 kyr was recorded by changes in relative sea level that provide new insight for understanding the volcanic activity of the Comoros archipelago. A plume of hot upwelling rock, rooted in the deep mantle and the asthenosphere, extends from the East African Rift below the Comoros archipelago, and reaches the surface at the boundary between the Somali and Lwandle plates. This complex system may be responsible for the volcano-tectonic activity of Mayotte.

Funding

This research received no external funding.

Data Availability Statement

The research codes required to reproduce the reported manuscript are available here: https://data.mendeley.com/datasets/h4mg2z84k9/1 accessed on 31 December 2023 [111]. The tomography model used has been implemented with the Submachine software [57]. The 14C data from Zinke et al. (2003) [57] were recalibrated using a radiocarbon calibration program CALIB REV8.2 [97].

Acknowledgments

The 4 reviewers and the editorial staff are acknowledged for their constructive suggestions and their help to improve the manuscript.

Conflicts of Interest

The authors declare no conflicts of interest.

References

  1. Audru, J.C.; Bitri, A.; Desprats, J.F.; Dominique, P.; Eucher, G.; Hachim, S.; Jossot, O.; Mathon, C.; Nédellec, J.L.; Sabourault, P.; et al. Major natural hazards in a tropical volcanic island: A review for Mayotte island, Comoros archipelago, Indian Ocean. Eng. Geol. 2010, 114, 264–381. [Google Scholar] [CrossRef]
  2. Roger, J. Potential tsunami hazard related to the seismic activity east of Mayotte Island, Comoros archipelago. J. Tsunami Soc. Int. 2019, 38, 118–131. [Google Scholar]
  3. Poulain, P.; Le Friant, A.; Pedreros, R.; Mangeney, A.; Filippini, A.G.; Grandjean, G.; Lemoine, A.; Fernández-Nieto, E.D.; Castro Díaz, M.J.; Peruzzetto, M. Numerical simulation of submarine landslides and generated tsunamis: Application to the on-going Mayotte seismo-volcanic crisis. C. R. Géosci. 2022, 354 (Suppl. S2), 361–390. [Google Scholar] [CrossRef]
  4. Roullé, A.; Baillet, M.; Bertil, D.; Cornou, C. Site effects observations and mapping on the weathered volcanic formations of Mayotte Island. C. R. Géosci. 2022, 354 (Suppl. S2), 317–341. [Google Scholar] [CrossRef]
  5. Taillefer, N.; Bertil, D.; Negulescu, C.; Roullé, A.; Iasio, C.; Auclair, S.; Quique, R. Seismic damage scenarios for Mayotte: A tool for disaster management. C. R. Géosci. 2022, 354 (Suppl. S2), 343–359. [Google Scholar] [CrossRef]
  6. Deves, M.; Lacassin, R.; Pécout, H.; Robert, G. Rick communication during seismo-volcanic crises: The example of Mayotte, France. Nat. Hazards Earth Syst. Sci. 2022, 22, 2001–2029. [Google Scholar] [CrossRef]
  7. Harvey, M. Sentinel-1 InSAR captures 2019 catastrophic White Island eruption. J. Volcanol. Geotherm. Res. 2021, 411, 107124. [Google Scholar] [CrossRef]
  8. Németh, K. Geoheritage and geodiversity aspects of catastrophic volcanic eruptions: Lessons from the 15th of January 2022 Hunga Tonga—Hunga Ha’apai eruption, SW Pacific. Int. J. Geoheritage Parks 2022, 10, 546–568. [Google Scholar] [CrossRef]
  9. Proud, S.R.; Prata, A.; Schmauss, S. The January 2022 eruption of Hunga Tonga-Hunga Hapai volcano reached the mesosphere. Earth Space Sci. Open Arch. 2022, 378, 554–557. [Google Scholar] [CrossRef]
  10. Barsotti, S.; Parks, M.M.; Pfeffer, M.A.; Óladóttir, B.A.; Barnie, T.; Titos, M.M.; Jónsdóttir, K.; Pedersen, G.B.M.; Hjartardóttir, Á.R.; Stefansdóttir, G.; et al. The eruption in Fagradalsfjall (2021, Iceland): How the operational monitoring and the volcanic hazard assessment contributed to its safe access. Nat. Hazards 2023, 116, 3063–3092. [Google Scholar] [CrossRef]
  11. Dóniz-Páez, J.; Németh, K.; Becerra-Ramírez, R.; Hernández, W.; Gosálvez, R.U.; Escobar, E.; González, E. Tajogaite 2021 Eruption (La Palma, Canary Islands, Spain): An Exceptional Volcanic Heritage to Develop Geotourism. Proceedings 2023, 87, 26. [Google Scholar] [CrossRef]
  12. Zhang, H.; Zhu, K.; Cheng, Y.; Marchetti, D.; Chen, W.; Fan, M.; Wang, S.; Wang, T.; Zhang, D.; Zhang, Y. Atmospheric and Ionospheric Effects of La Palma Volcano 2021 Eruption. Atmosphere 2023, 14, 1198. [Google Scholar] [CrossRef]
  13. Ward, S.N.; Day, S. Cumbre Vieja Volcano—Potential collapse and tsunami at La Palma, Canary Islands. Geophys. Res. Lett. 2001, 28, 3397–3400. [Google Scholar] [CrossRef]
  14. Gargani, J. Modelling the mobility and dynamics of a large Tahitian landslide using runout distance. Geomorphology 2020, 370, 107354. [Google Scholar] [CrossRef]
  15. Lambeck, K. Flexure of the ocean lithosphere from island uplift, bathymetry and geoid observations: The Society Islands. Geophys. J. Int. 1981, 67, 91–114. [Google Scholar] [CrossRef]
  16. Vitale, S.; Natale, J. Combined volcano-tectonic processes for the drowning of the Roman western coastal settlements at Campi Flegrei (southern Italy). Earth Planets Space 2023, 75, 38. [Google Scholar] [CrossRef]
  17. Gargani, J. Isostatic adjustment, vertical rate variation and potential detection of past abrupt mass unloading. Geosciences 2022, 12, 302. [Google Scholar] [CrossRef]
  18. Gargani, J.; Geoffroy, L.; Gac, S.; Cravoisier, S. Fault slip and Coulomb stress variations around a pressured magma reservoir: Consequences on seismicity and magma intrusion. Terra Nova 2006, 18, 403–411. [Google Scholar] [CrossRef]
  19. Lemoine, A.; Briole, P.; Bertil, D.; Roullé, A.; Foumelis, M.; Thinon, I.; Raucoules, D.; de Michele, M.; Valty, P.; Hoste Colomer, R. The 2018–2019 seismo-volcanic crisis east of Mayotte, Comoros islands: Seismicity and ground deformation markers of an exceptional submarine eruption. Geophys. J. Int. 2020, 223, 22–44. [Google Scholar] [CrossRef]
  20. Duggen, S.; Hoernic, K.; van den Bogaard, P.; Rüphe, L.; Phipps Morgan, J. Deep roots of the Messinian salinity crisis. Nature 2003, 422, 602–606. [Google Scholar] [CrossRef]
  21. Sternai, P.; Caricchi, I.; Garcia-Castellanos, D.; Jolivet, L.; Sheldrak, T.; Castelltort, S. Magmatic pulse driven by sea-level changes associated with the messinian salinity crisis. Nat. Geosci. 2017, 10, 783–787. [Google Scholar] [CrossRef] [PubMed]
  22. Isaia, R.; Vitale, S.; Marturano, A.; Aiello, G.; Barra, D.; Ciarcia, S.; Iannuzzi, E.; Tramparulo, F.D.A. High-resolution geological investigations to reconstruct the long-term ground movements in the last 15 kyr at Campi Flegrei caldera (southern Italy). J. Volcanol. Geotherm. Res. 2019, 385, 143–158. [Google Scholar] [CrossRef]
  23. Natale, J.; Ferranti, L.; Isaia, R.; Marino, C.; Sacchi, M.; Spiess, V.; Steinmann, L.; Vitale, S. Integrated on-land-offshore stratigraphy of the Campi Flegrei caldera: New insights into the volcano-tectonic evolution in the last 15 kyr. Basin Res. 2022, 34, 855–882. [Google Scholar] [CrossRef]
  24. Marino, C.; Ferranti, L.; Natale, J.; Anzidei, M.; Benini, A.; Sacchi, M. Quantitative reconstruction of Holocene ground displacements in the offshore part of the Campi Flegrei caldera (southern Italy): Perspectives from seismo-stratigraphic and archaeological data. Mar. Geol. 2022, 447, 106797. [Google Scholar] [CrossRef]
  25. Gargani, J. Influence of relative sea-level rise, meteoric water infiltration and rock weathering on giant volcanic landslides. Geosciences 2023, 13, 113. [Google Scholar] [CrossRef]
  26. De Chabalier, J.-B.; Avouac, J.-P. Kinematics of the Asal Rift (Djibouti) determined from the deformation of Fieale volcano. Sciences 1994, 265, 1677–1681. [Google Scholar] [CrossRef] [PubMed]
  27. Borgia, A.; van Wyk de Vries, B. The volcano-tectonic evolution of Concepcion, Nicaragua. Bull. Volcanol. 2003, 65, 248–266. [Google Scholar] [CrossRef]
  28. Beyene, A.; Abdelsalam, M.G. Tectonics of the Afar Depression: A review and synthesis. J. Afr. Earth Sci. 2005, 41, 41–59. [Google Scholar] [CrossRef]
  29. Puskas, C.M.; Smith, R.B.; Meertens, C.M.; Chang, W.L. Crustal deformation of the Yellowstone-Snake River Plain volcano-tectonic system: Campaign and continuous GPS observations, 1987–2004. J. Geophys. Res. 2007, 112, B03401. [Google Scholar] [CrossRef]
  30. Geirson, H.; d’Oreye, N.; Mashagiro, N.; Syauswa, M.; Gelli, G.; Kadufu, B.; Smets, B.; Kervyn, F. Volcano-tectonic deformation in the Kivu Region, Central Africa: Results from six years of continuous GNSS observations of the Kivu Geodetic Network (KivuGNet). J. Afr. Earth Sci. 2017, 134, 809–823. [Google Scholar] [CrossRef]
  31. Famin, V.; Michon, L.; Bourhane, A. The Comoros archipelago: A right-lateral transform boundary between the Somalia and Lwandle plates. Tectonophysics 2020, 789, 228539. [Google Scholar] [CrossRef]
  32. Cesca, S.; Letort, J.; Razafindrakoto, H.N.T.; Heimann, S.; Rivalta, E.; Isken, M.P.; Nikkhoo, M.; Passarelli, L.; Petersen, G.M.; Cotton, F.; et al. Drainage of a deep magma reservoir near Mayotte inferred from seismicity and deformation. Nat. Geosci. 2020, 13, 87–93. [Google Scholar] [CrossRef]
  33. Feuillet, N.; Jorry, S.; Crawford, W.C.; Deplus, C.; Thinon, I.; Jacques, E.; Saurel, J.M.; Lemoine, A.; Paquet, F.; Satriano, C.; et al. Birth of a large volcanic edifice through lithosphere-scale dyking offshore Mayotte (Indian Ocean). Nat. Geosci. 2021, 14, 787–795. [Google Scholar] [CrossRef]
  34. Saurel, J.-M.; Jacques, E.; Aiken, C.; Lemoine, A.; Retailleau, L.; Lavayssière, A.; Foix, O.; Dofal, A.; Laurent, A.; Mercury, N.; et al. Mayotte seismic crisis: Building knowledge in near real-time by combining land and ocean-bottom seismometers, first results. Geophys. J. Int. 2021, 228, 1281–1293. [Google Scholar] [CrossRef]
  35. Berthod, C.; Médard, E.; Bachèlery, P.; Gurioli, L.; Di Muro, A.; Peltier, A.; Komorowski, J.-C.; Benbakkar, M.; Devidal, J.-L.; Langlade, J.; et al. The 2018-ongoing Mayotte submarine eruption: Magma migration imaged by petrological monitoring. Earth Planet. Sci. Lett. 2021, 571, 117085. [Google Scholar] [CrossRef]
  36. Darnet, M.; Wawrzyniak, P.; Tarits, P.; Hautot, S.; D’Eu, J.F. Mapping the geometry of volcanic systems with magnetotelluric soundings: Results from a land and marine magnetotelluric survey performed during the 2018–2019 Mayotte seismovolcanic crisis. J. Volcanol. Geotherm. 2020, 406, 107046. [Google Scholar] [CrossRef]
  37. Dofal, A.; Michon, L.; Fontaine, F.R.; Rindraharisaona, E.; Barruol, G.; Tkalčić, H. Imaging the lithospheric structure and plumbing system below the Mayotte volcanic zone. C. R. Géosci. 2022, 354 (Suppl. S2), 47–64. [Google Scholar] [CrossRef]
  38. Foix, O.; Aiken, C.; Saurel, J.M.; Feuillet, N.; Jorry, S.J.; Rinnert, E.; Thinon, I. Offshore Mayotte volcanic plumbing revealed by local passive tomography. J. Volcanol. Geotherm. Res. 2021, 420, 107395. [Google Scholar] [CrossRef]
  39. Lavayssière, A.; Crawford, W.C.; Saurel, J.-M.; Satriano, C.; Feuillet, N.; Jacques, E.; Komorowski, C. A new 1D velocity model and absolute locations image the Mayotte seismo-volcanic region. J. Volvanol. Geotherm. Res. 2022, 421, 107440. [Google Scholar] [CrossRef]
  40. Bachèlery, P.; Morin, J.; Villeneuve, N.; Soulé, H.; Nassor, H.; Ali, A.R. Structure and eruptive history of Karthala volcano. In Active Volcanoes of the Southwest Indian Ocean. Active Volcanoes of theWorld; Bachelery, P., Lenat, J.F., Di Muro, A., Michon, L., Eds.; Springer: Berlin/Heidelberg, Germany, 2016; pp. 345–366. [Google Scholar] [CrossRef]
  41. Emerick, C.M.; Duncan, R. Age progressive volcanism in the Comore Archipelago, western lndian Ocean and implications for Somali plate tectonics. Earth Planet. Sci. Lett. 1982, 60, 415–428. [Google Scholar] [CrossRef]
  42. Ebinger, C.J.; Sleep, N. Cenozoic magmatism throughout east Africa resulting from impact of a single plume. Nature 1998, 395, 788–791. [Google Scholar] [CrossRef]
  43. Class, C.; Goldstein, S.L.; Altherr, R.; Bachèlery, P. The process of plume–lithosphere interactions in the ocean basins—The case of Grande Comore. J. Petrol. 1998, 39, 881–903. [Google Scholar] [CrossRef]
  44. Class, C.; Goldstein, S.L.; Stute, M.; Kurz, M.D.; Schlosser, P. Grand Comore Island: A well constrained “low 3He/4He” mantle plume. Earth Planet. Sci. Lett. 2005, 233, 391–409. [Google Scholar] [CrossRef]
  45. Bertil, D.; Mercury, N.; Doubre, C.; Lemoine, A.; van der Woerd, J. The unexpected Mayotte 2018–2020 seismic sequence: A reappraisal of the regional seismicity of the Comoros. C. R. Géosci. 2021, 353 (Suppl. S1), 211–235. [Google Scholar] [CrossRef]
  46. Quidelleur, X.; Michon, L.; Famin, V.; Geffray, M.-C.; Danišík, M.; Gardiner, N.; Rusquet, A.; Zakaria, M.G. Holocene volcanic activity in Anjouan Island (Comoros archipelago) revealed by new Cassignol-Gillot groundmass K–Ar and 14C ages. Quat. Geochronol. 2022, 67, 101236. [Google Scholar] [CrossRef]
  47. Stamps, D.S.; Saria, E.; Kreemer, C. A Geodetic Strain Rate Model for the East African Rift System. Sci. Rep. 2018, 8, 732. [Google Scholar] [CrossRef]
  48. Tzevahirtzian, A.; Zaragosi, S.; Bachèlery, P.; Biscara, L.; Marchès, E. Submarine morphology of the Comoros volcanic archipelago. Mar. Geol. 2021, 432, 106383. [Google Scholar] [CrossRef]
  49. Thinon, I.; Lemoine, A.; Leroy, S.; Paquet, F.; Berthod, C.; Zaragosi, S.; Famin, V.; Feuillet, N.; Boymond, P.; Masquelet, C.; et al. Volcanism and tectonics unveiled in the Comoros Archipelago between Africa and Madagascar. C. R. Géosci. 2022, 354 (Suppl. S2), 7–34. [Google Scholar] [CrossRef]
  50. Pelleter, A.A.; Caroff, M.; Cordier, C.; Bachelery, P.; Nehlig, P.; Debeuf, D.; Arnaud, N. Melilite-bearing lavas in Mayotte (France): An insight into the mantle source below the Comores. Lithos 2014, 208–209, 281–297. [Google Scholar] [CrossRef]
  51. Michon, L. The volcanism of the Comoros archipelago integrated at a regional scale. In Active Volcanoes of the Southwest Indian Ocean; Bachèlery, P., Lenat, J.-F., Di Muro, A., Michon, L., Eds.; Springer: Berlin/Heidelberg, Germany, 2016; pp. 333–344. [Google Scholar]
  52. Masquelet, C.; Leroy, S.; Delescluse, M.; Chamot-Rooke, N.; Thinon, I.; Lemoine, A.; Franke, D.; Watremez, L.; Werner, P.; Paquet, F.; et al. The East-Mayotte new volcano in the Comoros Archipelago: Structure and timing of magmatic phases inferred from seismic reflection data. C. R. Géosci. 2022, 354 (Suppl. S2), 65–79. [Google Scholar] [CrossRef]
  53. Mitchell, N.C.; Masson, D.G.; Watts, A.B.; Gee, M.J.R.; Urgeles, R. The morphology of the submarine flanks of volcanic ocean silands: A comparative study of the Canary and Hawaiian hotspot ilsands. J. Volcanol. Geotherm. Res. 2002, 115, 83–107. [Google Scholar] [CrossRef]
  54. Sanchez-Alzola, A.; Marti, J.; Garcia-Yeguas, A.; Gil, A.J. Subsidence and current strain patterns on Tenerife Island (Canary Archipelago, Spain) derived from continous GNSS time series (2008–2015). J. Volcanol. Geotherm. Res. 2016, 327, 240–248. [Google Scholar] [CrossRef]
  55. Moore, J.G. Relationship between subsidence and volcanic load, Hawaii. Bull. Volcanol. 1970, 34, 562–576. [Google Scholar] [CrossRef]
  56. Zinke, J.; Reijmer, J.J.G.; Thomassin, B.A. Seismic architecture and sediment distribution within the Holocene barrier reef-lagoon complex of Mayotte (Comoro archipelago, SW Indian Ocean). Paleogeogr. Paleoclimatol. Paleoecol. 2001, 175, 343–368. [Google Scholar] [CrossRef]
  57. Zinke, J.; Reijmer, J.J.; Thomassin, B.A.; Dullo, W.C.; Grootes, P.M.; Erlenkeuser, H. Postglacial flooding history of Mayotte lagoon (Comoro Archipelago, southwest Indian Ocean). Mar. Geol. 2003, 194, 181–196. [Google Scholar] [CrossRef]
  58. Camoin, G.F.; Montaggioni, L.F.; Braithwaite, C.J.R. Late Glacial to Post Glacial Sea-Levels in the Western Indian Ocean. Mar. Geol. 2004, 206, 119–146. [Google Scholar] [CrossRef]
  59. Ortlieb, L.; Zazo, C.; Goy, J.L.; Hillaire-Marcel, C.; Ghaleb, B.; Cournoyer, L. Coastal deformation and sea-level changes in the northern Chile subduction area (23° S) during the last 330 ky. Quat. Sci. Rev. 1996, 15, 819–831. [Google Scholar] [CrossRef]
  60. Pedoja, K.; Husson, L.; Johnson, M.E.; Melnick, D.; Witt, C.; Pochat, S.; Nexer, M.; Delcailleau, B.; Pinegina, T.; Poprawski, Y.; et al. Coastal staircase sequences reflecting sea-level oscillations and tectonic uplift during the Quaternary and Neogene. Earth-Sci. Rev. 2014, 132, 13–38. [Google Scholar] [CrossRef]
  61. Gargani, J. Relative Sea Level and Abrupt Mass Unloading in Barbados during the Holocene. Geomorphology 2022, 413, 108353. [Google Scholar] [CrossRef]
  62. Camoin, G.F.; Colonna, M.; Montaggioni, L.F.; Cacanova, J.; Faure, G.; Thomassin, B.A. Holocene sea-level changes and reef development in South-Western Indian Ocean. Coral Reefs 1997, 16, 247–259. [Google Scholar] [CrossRef]
  63. Zinke, J.; Reijmer, J.J.G.; Thomassin, B.A. Systems tracts sedimentology in the lagoon of Mayotte associated with the Holocene transgression. Sediment. Geol. 2003, 160, 57–79. [Google Scholar] [CrossRef]
  64. Zinke, J.; Reijmer, J.J.G.; Taviani, M.; Dullo, W.-C.; Thomassin, B. Facies and faunal assemblage changes in response to the Holocene transgression in the Lagoon of Mayotte (Comoro Archipelago, SW Indian Ocean). Facies 2005, 50, 391–408. [Google Scholar] [CrossRef]
  65. Montaggioni, L.F.; Martin-Garin, B. Quaternary development history of coral reefs from West Indian islands: A review. Int. J. Earth Sci. 2020, 109, 911–930. [Google Scholar] [CrossRef]
  66. Fleming, K.; Jognston, P.; Zwartz, D.; Yokoyama, Y.; Lambeck, K.; Chappel, J. Refining the eustatic sea-level curve since the Last Glacial Maaximum using far- and intermediate-field sites. Earth Planet. Sci. Lett. 1998, 163, 327–342. [Google Scholar] [CrossRef]
  67. Lambeck, K.; Rouby, H.; Purcell, A.; Sun, Y.; Sambridge, M. Sea level and global ice volumes from the Last Glacial Maximum to the Holocene. Proc. Natl. Acad. Sci. USA 2014, 111, 15296–15303. [Google Scholar] [CrossRef] [PubMed]
  68. McTigue, D.F. Elastic stress and deformation near a finite spherical magma body: Resolution of the point source paradox. J. Geophys. Res. 1987, 92, 12931. [Google Scholar] [CrossRef]
  69. Battaglia, M.; Cervelli, P.F.; Murray, J.R. Modeling Crustal Deformation near Active Faults and Volcanic Centers—A Catalog of Deformation Models; U.S. Geological Survey Techniques and Methods, Book 13; U.S. Geological Survey: Reston, VA, USA, 2013; Chapter B1, 96p.
  70. Hautmann, S.; Gottsmann, J.; Sparks, R.S.J.; Mattioli, G.S.; Sacks, I.S.; Strutt, M.H. Effect of mechanical heterogeneity in arc crust on volcano deformation with application to Soufrière Hills volcano Montserrat, West Indies. J. Geophys. Res. 2010, 115, B09203. [Google Scholar] [CrossRef]
  71. William, C.A.; Wadge, G. The effects of topography on magma chamber deformation models: Application to Mt. Etna and radar interferometry. Geophys. Res. Lett. 1998, 25, 1549–1552. [Google Scholar] [CrossRef]
  72. Luttrell, K.; Mensin, D.; Francis, O.; Hurwitz, S. Constraints on the upper crustal magma reservoir beneath Yellowstone caldera inferred from lake-seiche induced strain observations. Geophys. Res. Lett. 2013, 40, 501–506. [Google Scholar] [CrossRef]
  73. Rajaonarison, T.A.; Stamps, D.S.; Fishwick, S.; Brune, S.; Glerum, A.; Hu, J. Numerical modeling of mantle flow beneath Madagascar to constrain upper mantle rheology beneath continental regions. J. Geophys. Res. Solid Earth 2020, 125, e2019JB018560. [Google Scholar] [CrossRef]
  74. Gerbault, M.; Cappa, F.; Hassani, R. Elasto-plastic and hydromechanical models of failure around an infinitely long magma chamber. Geochem. Geophys. Geosystems 2012, 13, Q03009. [Google Scholar] [CrossRef]
  75. Turcotte, D.L.; Schubert, G. Geodynamics, 2nd ed.; Cambridge University Press: New York, NY, USA, 2001; 456p. [Google Scholar]
  76. Watts, A.B. Isostasy and Flexure of the Lithosphere; Cambridge University Press: Cambridge, UK, 2000. [Google Scholar]
  77. Gargani, J. Modelling of the erosion in the Rhone valley during the Messinian crisis (France). Quat. Int. 2004, 121, 13–22. [Google Scholar] [CrossRef]
  78. Gargani, J.; Rigollet, C.; Scarselli, S. Istostatic response and geomorphological evolution of the Nile valley during the Messinian salinity crisis. Bull. Soc. Geol. Fr. 2010, 181, 19–26. [Google Scholar] [CrossRef]
  79. Calmant, S.; Francheteau, J.; Cazenave, A. Elastic layer thickening with age of the oceanic lithosphere: A tool for prediction of the age of volcanoes or oceanic crust. Geophys. J. Int. 1990, 100, 59–67. [Google Scholar] [CrossRef]
  80. Mitrovica, J.X.; Forte, A.M.; Simons, M. A reappraisal of postglacial decay times from Richmond Gulf and James Bay, Canada. Geophys. J. Int. 2000, 142, 783–800. [Google Scholar] [CrossRef]
  81. Van der Wal, W.; Wu, P.; Wang, H.; Sideris, M.G. Sea levels and uplift rate from composite rheology in glacial isostatic adjustment modelling. J. Geodyn. 2010, 50, 38–48. [Google Scholar] [CrossRef]
  82. Audru, J.-C.; Guennoc, P.; Thinon, I.; Abellard, O. Bathymay: La structure sous-marine de Mayotte révélée par l‘imagerie multifaisceaux. C. R. Geosci. 2006, 338, 1240–1249. [Google Scholar] [CrossRef]
  83. Nehlig, P.; Lacquement, F.; Bernard, J.; Caroff, M.; Deparis, J.; Jaouen, T.; Pelleter, A.A.; Perrin, J.; Prognon, C.; Vittecoq, B. Notice de la Carte Géologique de Mayotte; BRGM: Orléans, France, 2013; 135p. [Google Scholar]
  84. Stuiver, M.; Reimer, P.J. Extended 14C data base and revised CALIB 3.0 14C age calibration program. Radiocarbon 1993, 35, 215–230. [Google Scholar] [CrossRef]
  85. Heaton, T.J.; Köhler, P.; Butzin, M.; Bard, E.; Reimer, R.W.; Austin, W.E.N.; Bronk Ramsey, C.; Grootes, P.M.; Hughen, K.A.; Kromer, B.; et al. Marine20—The marine radiocarbon age calibration curve (0–55,000 cal BP). Radiocarbon 2020, 62, 779–820. [Google Scholar] [CrossRef]
  86. Hogg, A.G.; Heaton, T.J.; Hua, Q.; Palmer, J.G.; Turney, C.S.M.; Southon, J.; Bayliss, A.; Blackwell, P.G.; Boswijk, G.; Ramsey, C.B.; et al. SHCal20 Southern Hemisphere calibration, 0–55,000 years cal BP. Radiocarbon 2020, 62, 759–778. [Google Scholar] [CrossRef]
  87. Reimer, P.; Austin, W.E.N.; Bard, E.; Bayliss, A.; Blackwell, P.G.; Ramsey, C.B.; Butzin, M.; Edwards, R.L.; Friedrich, M.; Grootes, P.M.; et al. The IntCal20 Northern Hemisphere radiocarbon age calibration curve (0–55 cal kB). Radiocarbon 2020, 62, 725–757. [Google Scholar] [CrossRef]
  88. Bard, E.; Hamelin, B.; Fairbanks, R. U-Th ages obtained by mass spectrometry in corals from Barbados: Sea level during the past 130,000 years. Nature 1990, 346, 456–458. [Google Scholar] [CrossRef]
  89. Bard, E.; Hamelin, B.; Arnold, M.; Montaggioni, L.; Cabiosh, G.; Faure, G.; Rougerie, F. Deglacial sea-level record from Tahiti corals and the timing of global meltwater discharge. Nature 1996, 382, 241–244. [Google Scholar] [CrossRef]
  90. Bard, E.; Hamelin, B.; Delanghe-Sabatier, D. Deglacial Meltwater Pulse 1B and Younger Dryas Sea Levels Revisited with Boreholes at Tahiti. Science 2010, 327, 1235–1237. [Google Scholar] [CrossRef] [PubMed]
  91. Deschamps, P.; Durand, N.; Bard, E.; Hamelin, B.; Camoin, G.; Thomas, A.L.; Henderson, G.M.; Okuno, J.; Yokoyama, Y. Ice sheet collapse and sea-level rise at the Bølling warming 14,600 years ago. Nature 2012, 483, 559–564. [Google Scholar] [CrossRef] [PubMed]
  92. Hallmann, N.; Camoin, G.; Eisenhauer, A.; Botella, A.; Milne, G.A.; Vella, C.; Samankassou, E.; Pothin, V.; Dussouillez, P.; Fleury, J.; et al. Ice volume and climate changes from a 6000 year sea-level record in French Polynesia. Nat. Commun. 2018, 9, 285. [Google Scholar] [CrossRef] [PubMed]
  93. Peltier, W.R.; Fairbank, R.G. Global glacial ice volume and last glacial maximum from extended Barbados sea level record. Quat. Sci. Rev. 2006, 25, 3322–3337. [Google Scholar] [CrossRef]
  94. Abdul, N.A.; Mortlock, R.A.; Wright, J.D.; Fairbanks, R.G. Younger Dryas sea level and meltwater pulse 1B recorded in Barbados reef crest coral Acropora palmata. Paleoceanography 2016, 31, 330–344. [Google Scholar] [CrossRef]
  95. Bard, E.; Hamelin, B.; Fairbanks, R.G.; Zindler, A. Calibration of the 14C timescale over the past 30,000 years using mass spectrometric U-Th ages from Barbados corals. Nature 1990, 345, 405–410. [Google Scholar] [CrossRef]
  96. Bard, E.; Hamelin, B.; Deschamps, P.; Camoin, G. Comment on «Younger Dryas sea level and meltwater pulse 1B recorded in Barbados reefal crest coral Acropora palmata» by N. A. Abdul et al. Paleoceanography 2016, 31, 1603–1608. [Google Scholar] [CrossRef]
  97. Pirazzoli, P.A.; Montaggioni, L.F.; Delibrias, G.; Faure, G.; Salvat, B. Late Holocene sea-level changes in the Society Islands and in the northwest Tuamotu Atolls. In Proceedings of the Fifth International Coral Reef Congress; Gabrie, C., Toffart, J.L., Salvat, B., Eds.; Symposia and Seminars (A): Tahiti, French Polynesia, 1985. [Google Scholar]
  98. Austermann, J.; Mittrovica, J.X.; Latychev, K.; Milne, G.A. Barbados based estimate of ice volume at Last Glacial Maximum affected by subducted plate. Nat. Geosci. 2013, 6, 553–557. [Google Scholar] [CrossRef]
  99. Puyraveau, R.-A.; Rad, S.; Basile-Doelsch, I.; Deparis, J.; Jaouën, T.; Nehlig, P. Mayotte critical zone observatory: Preliminary results on chemical weathering and erosion rates on volcanic edifices. Procedia Earth Planet. Sci. 2014, 10, 73–76. [Google Scholar] [CrossRef]
  100. Puzenat, V.; Feuillet, N.; Komorowski, J.-C.; Escartín, J.; Deplus, C.; Bachèlery, P.; Berthod, C.; Gurioli, L.; Scalabrin, C.; Cathalot, C.; et al. Volcano-tectonic structures of Mayotte’s upper submarine slope: Insights from high-resolution bathymetry and in-situ imagery from a deep-towed camera. C. R. Géosci. 2022, 354 (Suppl. S2), 81–104. [Google Scholar] [CrossRef]
  101. Berthod, C.; Komorowski, J.-C.; Gurioli, L.; Médard, E.; Bachèlery, P.; Besson, P.; Verdurme, P.; Chevrel, O.; Di Muro, A.; Peltier, A.; et al. Temporal magmatic evolution of the Fani Maoré submarine eruption 50 km east of Mayotte revealed by in situ sampling and petrological monitoring. C. R. Géosci. 2022, 354 (Suppl. S2), 195–223. [Google Scholar] [CrossRef]
  102. French, S.W.; Romanowicz, B.A. Whole-mantle radially anisotropic shear velocity structure from spectral-element waveform tomography. Geophys. J. Int. 2014, 199, 1303–1327. [Google Scholar] [CrossRef]
  103. O’Connor, J.M.; Jokat, W.; Regelous, M.; Kuiper, K.F.; Miggins, D.P.; Koppers, A.A.P. Superplume mantle tracked isotopically the length of Africa from the Indian Ocean to the Red Sea. Nat. Commun. 2019, 10, 5493. [Google Scholar] [CrossRef]
  104. French, S.W.; Romanowicz, B. Broad plumes rooted at the base of the Earth’s mantle beneath major hotspots. Nature 2015, 525, 95–99. [Google Scholar] [CrossRef]
  105. French, S.; Lekic, V.; Romanowicz, B. Waveform Tomography Reveals Channeled Flow at the Base of the Oceanic Asthenosphere. Science 2013, 342, 227–230. [Google Scholar] [CrossRef]
  106. Spath, A.; Le Roex, A.P.; Duncan, R.A. The geochemistry of lavas from Comores Archipelago, Western Indian Ocean: Petrogenesis and mantle source region characteristics. Oceanogr. Lit. Rev. 1996, 37, 961–991. [Google Scholar]
  107. Debeuf, D. Étude de L‘évolution Volcano-Structurale et Magmatique de Mayotte, Archipel des Comores, Océan Indien: Approches Structurale, Pétrographique, Géochimique et Géochronologique. Ph.D. Thesis, Université de la Réunion, Saint-Denis, France, 2004. [Google Scholar]
  108. Barruol, G.; Sigloch, K.; Scholz, J.R.; Mazzullo, A.; Stutzmann, E.; Montagner, J.P.; Kiselev, S.; Fontaine, F.R.; Michon, L.; Dyment, C.; et al. Large-scale flow of Indian Ocean asthenosphere driven by Réunion plume. Nat. Geosci. 2019, 12, 1043–1049. [Google Scholar] [CrossRef]
  109. Rolandone, F.; Poort, J.; Masquelet, C.; Leroy, S.; Thinon, I.; Lemoine, A.; Paquet, F. Heat flow measurements in the Northern Mozambique Channel. C. R. Géosci. 2022, 354 (Suppl. S2), 35–46. [Google Scholar] [CrossRef]
  110. Hosseini, K.; Matthews, K.J.; Sigloch, K.; Shepard, G.E.; Domeier, H.; Tsekhmistremko, M. Submachine: Web-based tools for exploring seismic tomography and other models of Earth’s deep interior. Geochem. Geophys. Geosystems 2018, 19, 1464–1483. [Google Scholar] [CrossRef]
  111. Gargani, J. Mayotte’s Codes, Mendeley Data, V1. 2023. Available online: https://data.mendeley.com/datasets/h4mg2z84k9/1 (accessed on 31 December 2023). [CrossRef]
Figure 1. Mayotte volcanic context. (A) Regional tectonic plate context with inferred plate boundaries represented by dashed lines and the East African Rift represented by dark violet bars, Africa and Madagascar are represented in pink; (B) bathymetric map (units in meters) around Grand Terre (GT) and Petite Terre (PT) islands in the Mayotte archipelago, with volcanic edifices in red, lava flows in pink with the caldera circled; the extension of magma reservoir at 50 km and 70 km is represented by light red dashed lines and the radius represented are approximatively of 20 km and 40 km, respectively; and (C) schematic representation of the lithosphere below Mayotte, modified from Feuillet et al. (2021) [33] and Dofal et al. (2022) [37]. The accurate shape of the magma reservoir is not known. The coral reefs used to estimate the relative sea level are located at less than 20 km from the hypothetic center of the magma reservoir.
Geohazards 05 00017 g001
Figure 2. Relative sea level in Mayotte (red crosses) compared to the sea level curve constructed using data from Tahiti (green triangles and crosses, dark blue triangles) and Barbados (light blue squares). Data from Mayotte: Zinke et al. (2003) [57] recalibrated using Marine20 and SHcal20 curves (2σ). Data from Tahiti: Bard et al. (1990, 1996, 2010) [88,89,90]; Hallman et al. (2018) [92]; Deschamps et al. (2012) [91]; and Pirazzoli et al. (1985) [97]. Data from Barbados: Peltier and Fairbank (2006) [80]; and Abdul et al. (2016) [1]. Before 6 kyr B.P., the subsidence rate in Tahiti is corrected with an uplift rate of 0.25 mm/yr, and afterward, it is corrected using a subsidence rate of 0.15 mm/yr. Before 11.18 kyr, the uplift rate is corrected with an uplift rate of 0.34 mm/yr in Barbados, and after 11.18 kyr B.P., an uplift rate of 0.8 mm/yr is used. The reference sea level curve from Lambeck et al. (2014) [67] is represented by a green line for comparison.
Geohazards 05 00017 g002
Figure 3. Comparison of the relative sea level variation in Mayotte (data represented by red crosses, and interpretation by a light violet curve) together with a reconstructed reference sea level curve (light blue curve; see methods for details). Abrupt depressurization of the magma reservoir occurred at 9.7 ± 0.3 kyr B.P. and caused ~6–10 m subsidence. A progressive pressure increase in the magma reservoir occurred from 8.1 to 7 kyr B.P., causing an uplift. During the last few thousand years, new volcanic edifices loaded the lithosphere. The red crosses represent coral data (from Mayotte), light blue squares data (from Barbados); other symbols, yellow circles, green triangles and crosses, red squares and triangles, and dark blue triangles are all data from Tahiti and Barbados. For comparison, the reference sea level curve from Lambeck et al. (2014) [67] is represented by a green line. The horizontal grey rectangles represent an area without data for Mayotte.
Geohazards 05 00017 g003
Figure 4. Modeling the vertical displacement Uz caused by magma reservoirs with various overpressures ∆P. The magma reservoir (not to scale) has a radius rs and is located at a depth −Z at a distance R from the expansion source embedded at position ξ to point j. The shear modulus G = 15 GPa, ν = 0.25, rs = 20 km, and Z = 50 km. The observed uplift is 6–10 m. The vertical movement observed is around 10 m (highlighted in red). The vertical displacement data are located at a maximum distance of 20 km from the center of the magma reservoir (distance 0j).
Geohazards 05 00017 g004
Figure 5. Modeling the vertical displacement Uz caused by magma reservoir overpressure ∆P at a depth Z of 70 km with a radius rs of 25 km. The shear modulus G = 15 GPa, and ν = 0.25. The observed uplift is 6–10 m.
Geohazards 05 00017 g005
Figure 6. Isostatic adjustment modeling. (A) Isostatic adjustment modeling for different elastic thicknesses after loading by volcanic edifices located in Petite Terre and the offshore Mayotte archipelago are in gray. (B) Details of the modeling results. ν = 0.25, ρa =3179 kg/m3, ρv = 3000 kg/m3, E = 1010 Pa, and 35 km < Te < 45 km.
Geohazards 05 00017 g006
Figure 7. Isostatic adjustment modeling for different elastic thicknesses after loading by new volcanic edifices. ν = 0.25, ρa = 3179 kg/m3, ρv = 3000 kg/m3, E = 1010 Pa, and 35 km < Te < 45 km. The area observed is located in the red square of Figure 6A.
Geohazards 05 00017 g007
Figure 8. Tomography below Mayotte using the SEMum2 model of French et al., (2013) [106] and French and Romanovicz (2014) [102] implemented using Submachine software [110]. (A) from (−12.8°; 30°) represented by the black dot, to (−12.8°; 60°) represented by the white dot, (B) from (−8°; 49°) represented by the black dot to (−20°; 40°) represented by the white dot. In (A,B), Mayotte (−12.8°; 45.2°) is represented by a red triangle. The sections are from the surface to the core-mantle boundary and the dashed lines represent 410 km, 660 km and 1000 km depths. The black, green and white dots are used to show the position of the tomography on the map.
Geohazards 05 00017 g008
Figure 9. Modeling the vertical displacement Uz caused by magma reservoir overpressure ∆P at a depth Z of 50 km with a radius rs of 15 km, 20 km and 25 km. The shear modulus G = 15 GPa, and ν = 0.25. The observed uplift is 6–10 m.
Geohazards 05 00017 g009
Table 1. List of radiocarbon ages obtained from reef cores in the lagoon of Mayotte. Accurate location of the sample is showed in Zinke et al. (2003) [57].
ID Sample aDepth
(m) a
Age 14C
(yr BP) a
Calib. Age 14C
(yr BP)
Calib. Age 14C
(yr BP, 2σ)
KI 4,282,0212.2 ± 0.52550 ± 352045 b2238–1854 b
KI 4,385,0216.8 ± 0.56740 ± 457050 b7232–6872 b
KI 4,384,0219.0 ± 16780 ± 557090 b7268–6895 b
KI 4,383,0219.0 ± 17510 ± 557788 b7947–7620 b
KIA 11,56028.8 ± 08740 ± 459713 c9890–9543 c
KI 873934.73 ± 29020 ± 1009548 b9875–9284 b
KI 4,332,00134.75 ± 29150 ± 959711 b10,043–9451 b
KI 520639.97 ± 09420 ± 4010,648 c10,690–10,444 c
LGQ 60059.15 ± 0.59650 ± 19010,975 c11,617–10,304 c
LGQ 59958.50 ± 110,190 ± 19011,133 b11,724–10,567 b
LGQ 60160.00 ± 0.59860 ± 21010,684 b11,243–10,121 b
KIA 11,55859.30 ± 0.510,000 ± 4011,422 c11,628–11,208 c
KIA 11,55960.50 ± 0.510,070 ± 4511,515 c11,757–11,274 c
LGQ 60261.50 ± 0.510,270 ± 41011,906 c12,918–10,708 c
a 14C ages and depths estimated by Zinke et al. (2003) [57]. b Recalibration ages obtained using the Marine20 reference dataset [85]. c Recalibration age obtained using the SHcal20 reference dataset [86].
Table 2. Sea level data obtained from reef cores from the lagoon of Mayotte. U-Th [62] and 14C [57] ages are presented. 14C ages have been recalibrated for this study. Uncertainties on depth are those of Zinke et al. (2003) [57].
ID SampleDepth
(m)
Age
(yr BP)
Method
BRGM 00221.35 ± 11500 ± 100U-Th
KI 4,282,0212.2 ± 0.52588 ± 20014C
BRGM 00933.45 ± 13700 ± 200U-Th
KI 4,385,0216.8 ± 0.57050 ± 20014C
BRGM 00957.307200 ± 400U-Th
KI 4,384,0219.0 ± 17090 ± 20014C
KI 4,383,0219.0 ± 17788 ± 20014C
BRGM 00239.458200 ± 200U-Th
BRGM 009611.608200 ± 300U-Th
BRGM 009716.708600 ± 300U-Th
BRGM 001818.709300 ± 300U-Th
BRGM 009821.059600 ± 400U-Th
KIA 11,56028.8 ± 09657 ± 25014C
KI 873934.73 ± 29548 ± 30014C
KI 4,332,00134.75 ± 29711 ± 35014C
KI 520639.97 ± 010,613 ± 20014C
LGQ 60059.15 ± 0.510,932 ± 70014C
LGQ 59958.50 ± 111,133 ± 60014C
LGQ 60160.00 ± 0.510,684 ± 60014C
KIA 11,55850 ± 0.511,422 ± 21014C
KIA 11,55960.50 ± 0.511,515 ± 25014C
LGQ 60261.50 ± 0.511,906 ± 120014C
Table 3. Volcanic indices around Mayotte.
AgeVolcanic ActivityReference
2018Basalt[49]
2.225 ± 0.075 kyr B.P.Phonolite[57]
4.12 ± 0.04 kyr B.P.Pumice stone[56]
5.98 ± 0.14 kyr B.P.Volcanic mud[56]
6.950 ± 0.060 kyr B.P.Ash, trachytic pumice, altered phonolite[57,63]
7.965 ± 0.045 kyrPhonolite[57]
1.25 to 10.6 MaMain volcanic building[50]
1.49 ± 0.04 MaPhonolite[62]
7.7 ± 1.0 MaBasalt and nephelinites[62]
20.6 MaInitiation of the volcanism[51]
26.5 MaInitiation of the volcanism[52]
Disclaimer/Publisher’s Note: The statements, opinions and data contained in all publications are solely those of the individual author(s) and contributor(s) and not of MDPI and/or the editor(s). MDPI and/or the editor(s) disclaim responsibility for any injury to people or property resulting from any ideas, methods, instructions or products referred to in the content.

