


Abstract
Ground motion models (GMMs) constitute a fundamental component of the probabilistic seismic hazard analysis (PSHA) framework and represent one of the primary sources of epistemic uncertainty in seismic hazard estimates. This uncertainty largely stems from the availability of multiple candidate GMMs, with varying performance across different ground motion databases. The logic-tree framework is a well-established method for addressing this uncertainty by incorporating multiple GMMs with logic-tree branch weights. However, selecting an appropriate suite of GMMs is a non-trivial task. While often determined by expert judgment, the inherent subjectivity of this process has motivated the development of data-driven ranking methods. This study evaluates parametric and machine-learning-based GMMs for Türkiye using two information-theoretic ranking methods: the log-likelihood (LLH) and the deviance information criterion (DIC). The analysis uses an updated Turkish strong-motion database comprising 12,160 recordings from 1976 to 2023, including observations from the 2023 earthquakes. The DIC framework employs Markov chain Monte Carlo (MCMC) sampling to estimate the posterior distribution of the total residual standard deviation while keeping the median prediction functions and regression coefficients fixed. Ranking stability is further investigated across magnitude ranges and event-based subsets, alongside sensitivity of DIC to prior distributions.
1. Introduction
Probabilistic seismic hazard analysis (PSHA) provides a rigorous framework for quantifying the probability that a given level of ground motion will be exceeded at a site of interest. In PSHA, seismic intensity measures (IMs), such as peak ground acceleration (PGA), peak ground velocity (PGV), or spectral acceleration (PSa) at specified periods, serve as the key metrics estimated using ground motion models (GMMs). These models relate earthquake source, path, and site characteristics such as magnitude (Mw), source-to-site distance (RJB), and shear-wave velocity in the top 30 m (VS30), focal depth (FD), and fault mechanism (FM) to expected median ground motion intensity. GMMs are typically developed either through parametric regression analyses of seismic datasets [1,2,3,4,5] or via machine-learning-based approaches [6,7,8,9,10,11].
Empirical parametric models rely on regression analyses, in which specific functional forms are selected, and the ground motion data are fitted to these forms using predictor variables [5,12,13]. The number of regression variables may increase when the model accounts for nonlinearities or incorporates additional source-related and geometric characteristics to establish robust mathematical formulations. Consequently, a trade-off exists between the complexity of the functional form and the accuracy achieved by capturing nonlinearity and detailed characteristics. In contrast, nonparametric models use machine-learning algorithms trained on seismic data to predict ground motion intensities, without relying on predefined functional forms [10,14,15]. A key advantage of nonparametric models is their ability to capture complex, high-dimensional interactions between predictor variables (e.g., magnitude, source-to-site, distance, site conditions) that are difficult to represent through conventional parametric equations. However, nonparametric models require large, high-quality datasets to avoid overfitting and may lack physical interpretability compared to parametric models.
A major source of epistemic uncertainty in region-specific PSHA arises from the selection of appropriate GMMs. Multiple candidate models are typically available, with each model being developed using different datasets, assumptions, model parameters, and functional forms. Consequently, each model may possess specific advantages, capturing particular aspects of the tectonic setting. To account for the epistemic uncertainty and capture the full distribution of possible ground motions, PSHA commonly employs a set of GMMs represented as weighted branches within a logic-tree framework [16]. Epistemic uncertainty in PSHA arises from incomplete knowledge about the true physical processes governing ground motion generation and propagation. Unlike aleatory variability (inherent randomness in earthquake shaking), epistemic uncertainty can be reduced by acquiring more data or improving models. The logic-tree framework explicitly represents epistemic uncertainty by considering multiple alternative hypotheses (e.g., different GMMs, seismicity models, recurrence parameters) as branches, each assigned a weight proportional to its plausibility. The final hazard is computed as a weighted average of the results from each branch. Alternatively, the backbone model approach has been introduced to capture the center, body and range of ground-motion estimates properly, while modeling the epistemic uncertainty [17] and the selection of suitable models are still critical steps, as they exert a dominant influence on computed hazard levels [18,19,20].
The selection of GMMs has been typically conducted through expert judgment, considering tectonic characteristics, model types, and the prior model performance [21,22,23,24]. Alternatively, data-driven and information-theoretic methods have been developed for objective ranking and selection of GMMs for PSHA. The log-likelihood (LLH) method [20] has been widely applied in regional hazard studies [16,25,26,27]. The method provides a quantitative measure that estimates the Kullback–Leibler (KL) information distance among competing predictive distributions [20]. It offers a probabilistic framework for ranking models directly based on their ability to reproduce observed data. A relationship for deriving KL weights using LLH scores, which can be used in a logic tree when there is sufficient observed data, is also proposed in [20]. The LLH-based weighting has since been incorporated into PSHA studies [28,29].
When competing models tend to yield similar median predictions, LLH may favor those with larger standard deviations, particularly when the observed data is far from the median, as broader predictive distributions assign higher likelihood to outlying observations. This may lead to conservative seismic hazard estimates. To address this, Kale and Akkar [30] employed a new ranking method, called Euclidean distance-based ranking (EDR), which considers both the sigma and model bias when ranking the candidate models [31]. The two methods have been widely used in the literature for ranking GMMs against datasets from various regions, including, but not limited to, Korea [32], Greece [33], Iran [34,35], and Türkiye [25,36,37].
Kowsari et al. [38] proposed using the deviance information criterion (DIC) [39], a Bayesian model comparison metric that extends information-theoretic approaches by accounting for posterior parameter uncertainty. They noted that the total standard deviations of the ground motion residuals (hereafter, sigma) used in both LLH and EDR methods are derived under the ergodic assumption and reflect aleatory uncertainty from the calibration regions. They highlighted the importance of using a ranking method that can adequately account for the non-ergodicity of GMMs. The authors advocated treating the standard deviation, σ, as an unknown parameter to be estimated using the Bayesian approach based on the specific dataset used for ranking. Within this Bayesian framework, sigma is treated as an unknown parameter and updated using regional observations through Markov chain Monte Carlo (MCMC) sampling. By incorporating the posterior estimate of residual variability, DIC could remove the ergodic assumption from the GMM selection process, particularly when candidate GMMs originate from different datasets or tectonic regions [34]. In contrast to LLH, which uses the published ergodic standard deviation of each GMM, the DIC framework treats sigma as an unknown parameter and estimates it from the regional observations rather than fixing it at its calibration value. This approach is particularly relevant when evaluating GMMs developed for different tectonic regions, because the residual variability observed in the target region may differ from that reported for the original calibration region.
Türkiye is located in a seismically active region. Several PSHA studies have been conducted in this region, employing the logic-tree approach to address epistemic uncertainty in GMM selection [40,41,42,43]. Some studies have evaluated the suitability of the selected GMMs against regional strong-motion observations using data-driven methods [25,31,36]. Since then, the regional strong motion database has been significantly updated to include additional recordings, particularly those from the two catastrophic 2023 Türkiye earthquake sequences, which produced a large number of near-field and high-amplitude recordings. A subset of this updated dataset has previously been used by [37] to rank GMMs for the region.
In addition to the updated dataset, recent studies have introduced data-driven and region-specific ground motion modeling strategies for Türkiye. For example, Mohammadi et al. [10] developed machine-learning-based GMMs using artificial neural network (ANN) and Extreme Gradient Boosting (XGBoost) algorithms for predicting PGA, PGV and PSa in Türkiye, while Karimzadeh et al. [7] proposed an ANN-based GMM trained on region-specific stochastic simulations to support ground motion prediction and scenario-based applications for Türkiye. More recently, Banimahd and Karimzadeh [44] developed ANN-based non-parametric ground motion models for multiple intensity measures in Türkiye, explicitly incorporating the expanded Turkish strong-motion dataset, including records from the 2023 earthquake sequence.
Despite previous studies evaluating GMMs for Türkiye, several aspects remain insufficiently investigated. First, the Deviance Information Criterion (DIC) has not been applied to GMM ranking for Türkiye to examine the implications of explicitly accounting for regional total residual variability. Conventional ranking approaches that use the published ergodic standard deviations of candidate GMMs may not adequately represent the residual variability of the target region, particularly when models developed for other regions are applied to Türkiye. Estimating the total residual standard deviation using the Turkish strong-motion database provides an alternative basis for comparing model performance while accounting for regional differences in aleatory variability. Second, the stability of LLH- and DIC-based rankings across different subsets of the same database has not been systematically examined with respect to dataset size, magnitude range, and record selection. Such analyses are necessary to assess the robustness of model rankings and determine the extent to which dataset characteristics influence comparative performance. Third, the sensitivity of DIC-based GMM rankings to the choice of prior distribution for the total residual standard deviation warrants further investigation. In particular, MCMC sampling provides a framework for estimating the posterior distribution of this parameter and examining the influence of alternative prior specifications on the resulting rankings. Finally, recently developed machine-learning-based GMMs have not been comprehensively compared with conventional empirical models, including both Türkiye-specific and global models, against the comprehensive, updated strong-motion database.
To address the aforementioned gaps, this study employs the LLH and DIC approaches to evaluate and rank a suite of GMMs for Türkiye, including conventional empirical models and recently developed regional and machine-learning-based models. The evaluation uses an updated Turkish strong-motion database [45], comprising 12,160 recordings from 1976 to 2023, including observations from the 2023 earthquakes. This expanded dataset provides an updated basis for comparing model performance against previous evaluations. Ranking stability is investigated by examining subsets defined by magnitude range and by conducting an event-based sensitivity analysis in which one record is randomly selected from each event. The DIC analysis employs a Bayesian framework with MCMC-based estimation of the total residual standard deviation, while the median prediction functions and regression coefficients of the candidate GMMs are held fixed. The sensitivity of the resulting rankings to alternative prior distributions is also assessed. The rankings obtained using LLH and DIC are subsequently compared to examine the consistency of the two approaches. In addition, residual plots against key predictor variables are examined to identify potential systematic trends and provide supplementary diagnostic evidence of model performance.
The main contributions of this study are, therefore: (i) Comparative evaluation of a suite of GMMs for Türkiye using an updated database including the 2023 earthquakes; (ii) evaluating conventional empirical and machine-learning-based models within a common ranking framework; (iii) applying DIC with MCMC-based estimation of regional total residual variability and assessing sensitivity to prior specification; (iv) investigating ranking stability across magnitude ranges and event-based subsets; (v) providing intensity-measure-specific rankings; and (vi) using residual diagnostics to complement the quantitative rankings.
The remainder of this paper is organized as follows. Section 2 describes the GMMs evaluated in this study, the characteristics of the ground-motion dataset used for ranking, and the methodologies underlying the LLH and DIC approaches. Section 3 presents the ranking results, residual analyses, and sensitivity analyses examining the robustness of the rankings across event-based and magnitude-restricted datasets. The conclusions are provided in Section 4.
2. Materials and Methods
To evaluate and rank the candidate ground motion models, this study employs two complementary information-theoretic approaches: the Log-Likelihood (LLH) method and the Deviance Information Criterion (DIC). The LLH method is based on the likelihood concept, which represents how likely a model is, given the testing data. It quantifies the average information loss of each model relative to the observations, with smaller values indicating a superior fit. The DIC is a model comparison method applied within a Bayesian framework when the posterior distribution of a model parameter is available. The main advantage of the DIC over the LLH is its ability to estimate the aleatory variability (standard deviation) directly from the testing dataset. This approach facilitates a non-ergodic ranking scheme, as models are compared using region-specific standard deviations, thereby supporting non-ergodic PSHA [38].
2.1. Ground Motion Models
Numerous ground motion models (GMMs) have been developed for Türkiye, including both parametric [1,2,5,46,47] and non-parametric models [7,8,10,44]. The initial set of GMMs is selected among those commonly adopted for Türkiye, including parametric, non-parametric, region-specific, and global GMMs, considering the exclusion criteria discussed in [48]. The criteria include: (1) the model is from a clearly irrelevant tectonic regime, (2) the model is not published in an international peer-reviewed journal, (3) the documentation of the model and its underlying dataset is insufficient, (4) the model has been superseded by more recent publications, (5) the frequency range of the model is not appropriate for engineering application, (6) the model has an inappropriate functional form, and (7) the regression method or regression coefficients are judged to be inappropriate [48].
The classical empirical GMMs used in this study include: (i) AC10 [1], developed using the Turkish ground motion database [49]; (ii) KAAH15 [46], developed for Türkiye and Iran using a subset of the strong-motion database of the earthquake model of the Middle East region (EMME) project [50]; (iii) ASB14 [51], developed using a subset of the reference database for seismic ground motion in Europe (RESORCE) for the seismic ground motion assessment (SIGMA) project [52]; (iv) BSSA21 [3], developed using a wide database of uniformly processed strong-motion data recorded in Greece [53]; and (v) BA08 [54], developed using the Pacific earthquake engineering research center (PEER) next generation attenuation (NGA) strong-motion database [55]. The selection of both global and regional GMMs is due to their widespread application in previous hazard assessment studies in Türkiye and therefore, they represent models that are relevant to the regional seismotectonic setting [25,40]. The present comparison may also provide useful guidance for their consideration in future regional hazard assessment studies. In addition, recent nonparametric ML-based models, including MKBOL23 [10] and BK26 [44], are considered. MKBOL23 was developed using a small subset of the Turkish ground motion dataset employed in this study, comprising 1166 recordings available up to 2022. Therefore, recordings from earthquakes occurring after 2022, which are included in the present 1976–2023 catalog, were not available during its development. The more recent ML-based model, BK26, was developed using the same dataset considered in this study, with a test set of 2432 recordings excluded from its training [45]. The GMMs used in this study are listed in Table 1.
Table 1.
Description of the ground motion models used in this study.
2.2. Ground Motion Dataset
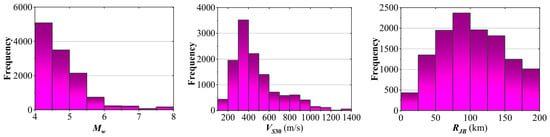
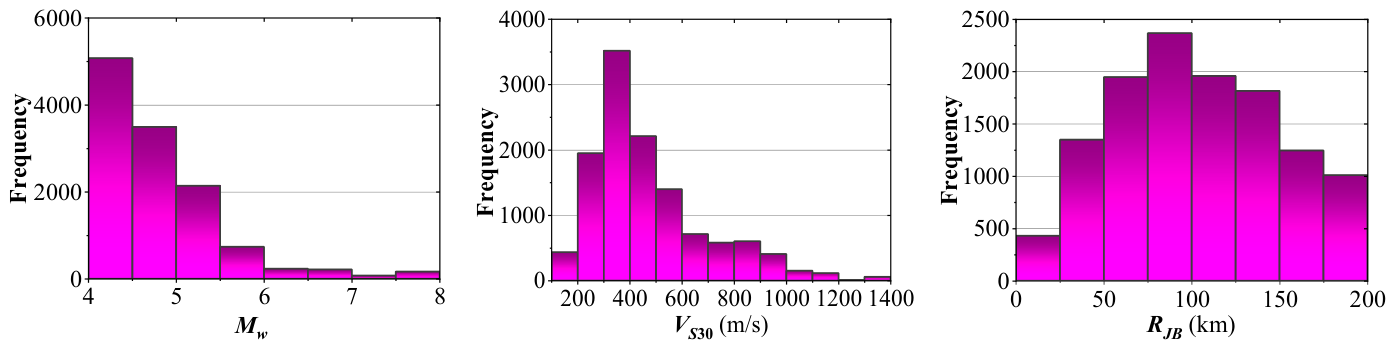
In this study, an updated and comprehensive strong motion dataset is utilized, primarily sourced from the Disaster and Emergency Management Presidency of Türkiye (AFAD) [56], and subsequently processed and compiled within the updated Turkish strong motion database (SMD-TR) framework described in [45]. The dataset includes accelerograms from seismic events occurring in Türkiye between 1976 and 2023 and encompasses both mainshocks and fore-/aftershocks, comprising 95,890 three-component waveforms from 55,375 records across 6710 events and 1022 stations. These events cover a magnitude range from 3.0 to 7.8 and include Joyner and Boore distance (RJB) of up to 772 km. The stations represent diverse site conditions, with shear-wave velocity averaged over the upper 30 m (VS30) values extending up to 1822 m/s. To ensure the compatibility of the dataset with the application domain of GMMs, samples associated with earthquakes of magnitude Mw less than 4.0, VS30 values exceeding 1500 m/s, focal depth FD greater than 35 km, or RJB beyond 200 km were excluded. Samples with missing or poor-quality metadata were also discarded. After applying these criteria, a total of 12,160 high-quality recordings across 974 events remained for use in the data-driven ranking. Figure 1 illustrates the histogram of seismic characteristics in terms of Mw, RJB, and VS30.
Figure 1.
Histograms of seismological features of the Turkish ground motion records (note the difference in scale of the vertical axes).
As shown in Figure 1, some records in the regional dataset may also fall outside the stated applicability ranges of candidate GMMs in terms of Mw, RJB, and VS30. For example, the magnitudes of the records in the regional dataset range from 4.0 to 8.0, with most events having magnitudes between 4.0 and 5.0. According to Table 1, the magnitude ranges of the datasets used to develop AC10 and BA08 begin at 5.0; therefore, records with magnitudes below this threshold fall outside their published magnitude ranges. Such cases represent extrapolation beyond the models’ stated ranges, which is encountered in PSHA, where the scenarios controlling hazard may extend beyond the ranges of the datasets used to develop empirical GMMs. Table 2 provides the number and percentage of records falling outside the stated applicability ranges of each candidate GMM.
Table 2.
Number and percentage of records outside the applicability ranges of the GMMs.
The objective of this study is to evaluate the relative performance of candidate GMMs using a common regional dataset representative of the magnitude, distance, and site condition space relevant to the study region. Accordingly, the resulting rankings therefore reflect model performance over the full regional dataset, including extrapolation performance where applicable. To assess ranking stability, the comparison is also repeated using only records that fall within the intersection of the applicability ranges of all candidate GMMs.
Among the GMMs in this study, BK26 [44] is the most recent and was developed on the updated Turkish strong motion dataset used in this study. The ranking is additionally performed using a subset of 2432 recordings corresponding to the test set used during the development of BK26. The resulting rankings are then compared with those obtained using the full dataset. It should be noted that BK26 was developed using a record-wise split, so the same events and stations may appear in both training and test sets. Furthermore, the 2432-record test subset was also used for hyperparameter tuning and therefore serves as a validation set rather than an independent hold-out set. This limitation should be considered when interpreting the ranking results presented in Section 3.
2.3. Log-Likelihood (LLH) Method
The LLH method is an information-theoretic framework for evaluating and ranking models based on KL divergence, representing the loss of information between two models [20]. It quantifies how well a candidate model (e.g., a GMM) reproduces observations (e.g., observed ground motion data) by computing the average log-likelihood of the observations under the model’s predictive probability density function. Let g(x) denote the predictive probability density function of a candidate model, and let represent a set of N observed ground motion records. The average sample log-likelihood is defined as:
The use of a base-2 logarithm allows interpretation of information loss in physically meaningful units. It represents the empirical estimate of the expected information loss, measured in bits. The negative average of the sample log-likelihood between two models is the key metric for ranking GMMs [20].
The theoretical foundation of the LLH method demonstrates that differences in average log-likelihood values between competing models approximate differences in KL divergence with respect to the true data-generating distribution [20]. Consequently, models can be ranked according to their relative LLH values, where the model with the smallest LLH is interpreted as having the smallest estimated information loss, thereby providing a better statistical fit. In the application of the LLH method to GMMs, the probability density function is constructed using the model prediction as the mean and the standard deviation originally reported by the GMM developers.
It is important to note that evaluating models on their calibration data can lead LLH-based rankings to underestimate the true information loss and may disproportionately reward sample fit rather than capturing true predictive performance [20].
2.4. Deviance Information Criterion (DIC) and Bayesian Recalibration of Residual Variability
The DIC was introduced by [39] as a Bayesian model comparison metric in the context of MCMC-based inference. It is particularly useful for models whose posterior distributions are obtained through simulation. The DIC is based on the deviance , defined as:
where is the likelihood function, denotes the observed data, and represents the vector of unknown model parameters. The DIC is then defined as:
where is the posterior mean of the deviance,
DIC automatically accounts for model complexity through the effective number of parameters estimated within the Bayesian formulation.
In Equation (3) is the effective number of parameters, given by:
where denoted the posterior mean of θ. An equivalent expression for DIC is:
The DIC provides a trade-off between model fit and model complexity. While the posterior mean of the deviance reflects goodness-of-fit, the effective parameter term penalizes model complexity.
For model comparison, smaller DIC values indicate a more favorable trade-off between goodness-of-fit and model complexity for the observed data.
For GMM comparison, the predictive relationship is expressed in logarithmic space as:
where denotes the observed logarithm of the ith ground motion intensity measure, is the median prediction of model m evaluated at a vector of characteristics of earthquake record , and is the residual, representing the discrepancy between the observation and the model prediction. Residuals are assumed to follow a normal distribution,
where denotes the residual variance of model m. Within the standard LLH framework, this term is taken as the published model sigma (hereafter referred to as prior sigma), a quantity typically derived under the ergodic assumption and representative of variability in the calibration region. As discussed in [38], using the prior sigma may introduce regional variability effects into model comparison. To address this, the residual variance is treated as an unknown parameter to be estimated from the observed data using a Bayesian framework. Accordingly, the parameter vector reduces to:
while the median prediction is held fixed. Under this assumption, the likelihood for a dataset of N observations is:
In this particular implementation, is the single effective parameter estimated through Bayesian recalibration. Although DIC generally includes a penalty for model complexity, in the present study, this penalty is limited to the parameter estimated within the Bayesian recalibration. Thus, the DIC complexity penalty pertains only to the estimation of , rather than to differences in the structural complexity of the candidate GMMs.
To ensure consistency in relative model comparison, the observations are assumed to be conditionally independent, although ground motion datasets may include multiple records from the same event and therefore exhibit residual correlation. Posterior uncertainty in sigma may be slightly underestimated due to ignoring such dependence. The posterior mean of sigma is therefore interpreted as a regionally recalibrated measure of total residual scatter, rather than as a decomposition of variance into distinct aleatory components. Using the definition of deviance in Equation (2), the deviance for model m becomes:
Posterior samples are obtained via MCMC simulation. The posterior mean deviance is approximated by:
while the posterior mean parameter is:
The DIC for model m is then computed as:
where is the mean value predicted by the GMM. This formulation enables a consistent comparison of GMMs under a common likelihood framework while allowing the residual variance to be updated according to the observed regional data.
Under Bayes’ theorem, the posterior distribution of is proportional to the product of the likelihood and prior:
A weakly informative, non-conjugate half-normal prior, with scale 1, is adopted for . Alternative scale parameters and prior distributions, including the half-Student-t and half-Cauchy distributions, are considered to assess the sensitivity of the DIC-based rankings to prior specification.
The posterior is sampled using a random walk Metropolis–Hastings algorithm [57,58]. Proposed values for are accepted with the Metropolis acceptance probability as follows:
where is the current state, and is the proposed value. 5000 iterations are generated for each GMM and intensity measure. The first 20 percent of the samples (1000 iterations) are discarded as burn-in, resulting in 4000 posterior samples for inference. Also, four independent chains are run to assess convergence. The proposal standard deviation is set 0.02, resulting in acceptance rates of approximately 0.36. The potential scale reduction factor (), also known as the Gelman–Rubin convergence diagnostic, ranges from 1.001 to 1.003 across the models and intensity measures, indicating satisfactory convergence of the MCMC chains.
The MCMC algorithm is used to sample the posterior distribution of the sigma, (), while the functional form and median predictions of each GMM were kept fixed. The use of one-dimensional MCMC is computationally simple and allows the posterior distribution of the sigma to be explicitly characterized across all candidate GMMs and provides the posterior samples required for evaluating the likelihood-based DIC. Accordingly, the DIC values reported in this study should be interpreted as conditional on the published GMM coefficients and median predictions, with the residual standard deviation being the only estimated parameter.
3. Results and Discussion
3.1. GMM Ranking Using Information-Theoretic Methods
The GMMs were ranked based on the LLH and DIC methods. Since BK26 was developed using the same overall database used for the evaluation, its performance may be influenced by in-sample fitting.
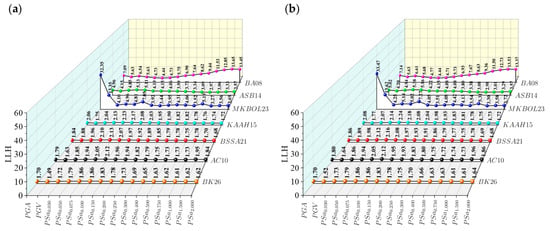
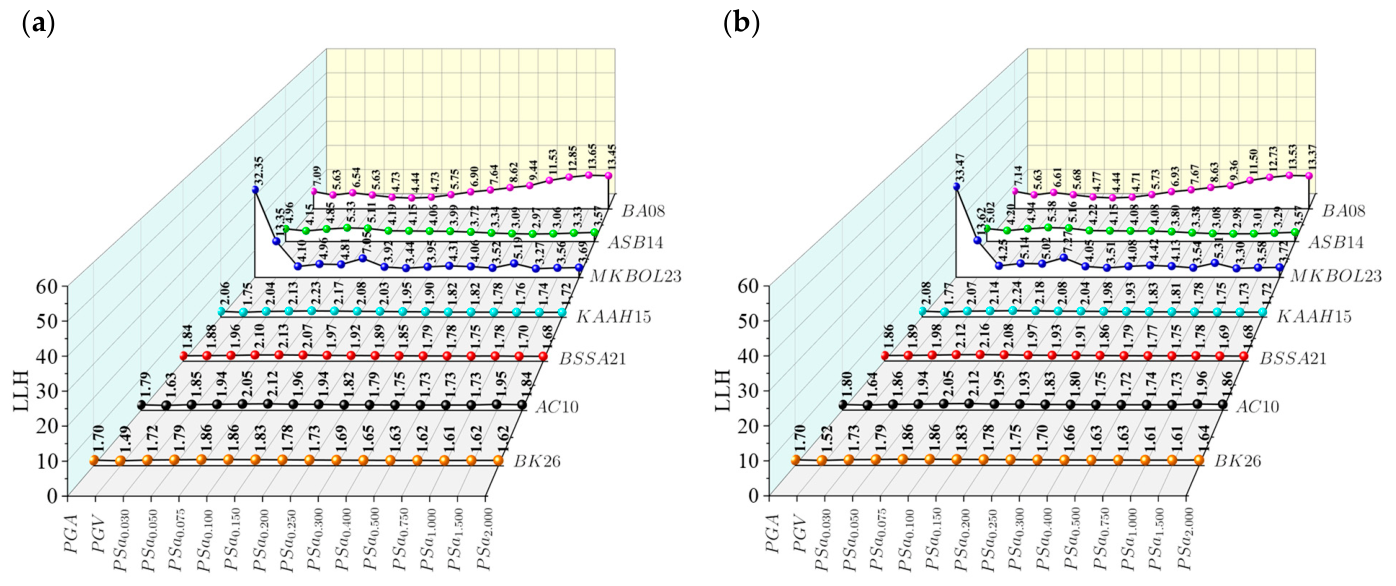
The LLH scores across intensity measures, including PGA, PGV, and spectral acceleration PSa at a period T from 0.03 to 2.00 s, are presented in Figure 2. As previously discussed in the former section (indicated in Equation (1)), smaller LLH values indicate better agreement with the data and, consequently, superior model performance. The corresponding LLH scores for different GMMs are listed in Table 3. The scores represent models’ performances based on the agreement between predicted medians and observed data. Consequently, LLH favors models that exhibit both small median residuals and dispersion levels consistent with the observed variability. Results reveal that the models can be categorized into distinct groups according to their LLH scores. The first group includes four models, BK26, KAAH15, AC10, and BSSA21, which demonstrate relatively similar performance and achieve the lowest scores for spectral acceleration ordinates. The second group consists of ASB14 and MKBOL23, which exhibit overall performance inferior to that of the first group. These models exhibit comparable LLH values over most spectral acceleration periods, indicating a similar level of performance for spectral acceleration prediction. However, MKBOL23 yields substantially higher LLH values for PGA and PGV, particularly for PGA, resulting in poorer performance than ASB14 for these intensity measures. Finally, BA08 displays the weakest performance and highest misfit with the dataset, ranking last in most IMs. At short periods, its performance is comparable to ASB14 and MKBOL23. However, it worsens over longer periods.
Figure 2.
Average negative log-likelihood (LLH) scores of candidate ground motion models (GMMs) across intensity measures (PGA, PGV, and PSa at different spectral periods) (a) using the full dataset and (b) using a subset.
Table 3.
Values of the average negative log-likelihood (LLH) scores, as shown in Figure 2a.
As shown in Figure 2a, BK26 consistently achieves the first position with the lowest score across all intensity measures (1.60–1.85, see Table 3). This result is predictable, as the model was developed on the same dataset and therefore exhibits the smallest median misfit relative to the observations.
AC10 generally occupies the second position across most periods; however, it drops to fourth rank at some long periods (1.5 s and 2.0 s) (see Table 3). BSSA21 is typically ranked third, although the relative ordering between BSSA21 and AC10 occasionally reverses, indicating comparable performance. Their LLH values fall within a narrow range (approximately 1.70–2.12), suggesting similar levels of agreement with the dataset. KAAH15 holds the fourth rank in most IMs.
The models ASB14 and MKBOL23 interchangeably occupy the fifth and sixth ranks across most IMs. At longer periods (T > 0.3 s), ASB14 consistently achieves lower LLH scores and slightly outperforms MKBOL23. Despite their fundamentally different approaches, being one parametric empirical and the other machine learning-based, they exhibit similar performance for spectral accelerations. For PGA and PGV, MKBOL23 shows markedly weaker performance than ASB14, as LLH values are substantially higher. Finally, BA08 demonstrates the weakest performance and the highest misfit with the dataset across most intensity measures. Its performance consistently worsens over longer periods. BA08′s poor performance could be attributed to the systematic differences between the global PEER NGA dataset and the Turkish dataset.
Figure 2b presents the LLH scores of the candidate GMMs evaluated using a subset of 2432 recordings, as described in Section 2.2. The results indicate that the relative rankings remain broadly consistent with those obtained using the full regional dataset. However, this analysis does not constitute an independent validation of BK26, as the test subset was also used for hyperparameter tuning during model development.
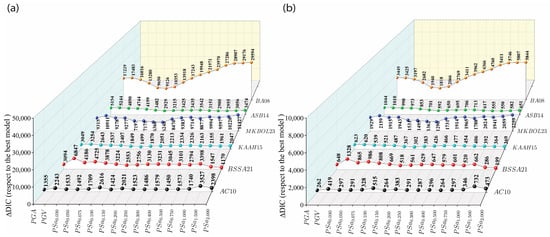
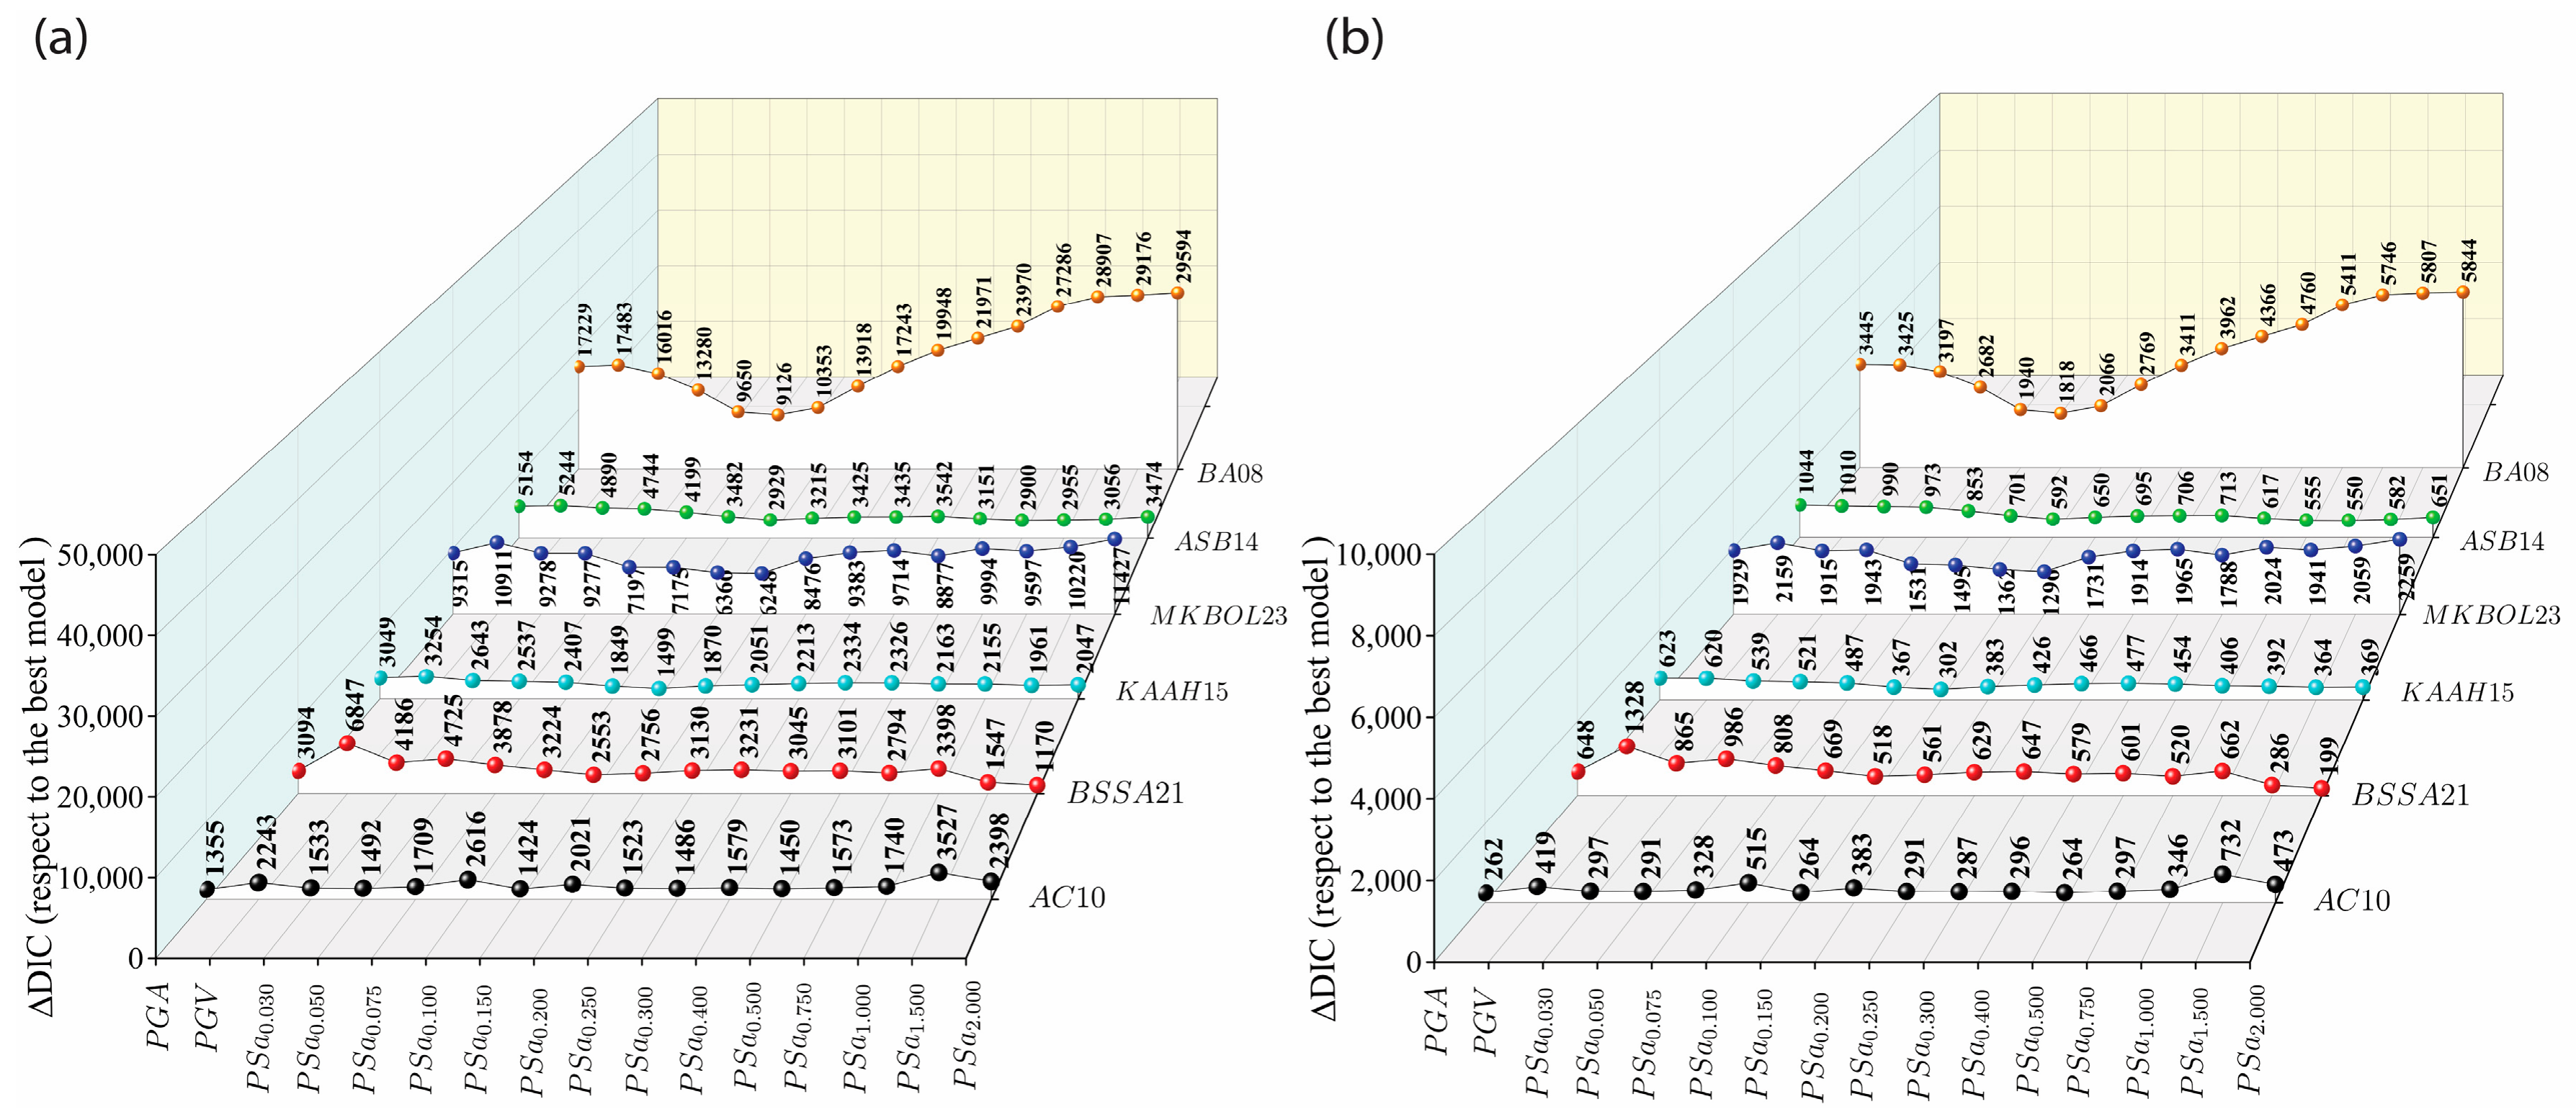
As discussed previously, DIC provides an alternative ranking framework, particularly appropriate when the GMM standard deviation σ is recalibrated and its posterior distribution is available. For GMMs developed outside the region of the evaluation dataset, Kowsari et al. [38] recommended recalibrating σ to account for potential regional differences in aleatory variability. In this study, all candidate models are evaluated by the DIC metric using recalibrated σ estimates. The σ values are obtained from posterior distributions derived from MCMC sampling. Since the absolute DIC values are large and scale with the total number of observations, Figure 3 and Table 4 report ΔDIC values relative to the best-performing model, BK26. Lower ΔDIC values indicate better model performance. Therefore, BK26 has ΔDIC = 0, which is omitted from Figure 3 and Table 4.
Figure 3.
Relative DIC values of candidate ground motion models (GMMs) across intensity measures (PGA, PGV, and PSa at different spectral periods) (a) using the full dataset and (b) using a subset.
Table 4.
ΔDIC values relative to the BK26 model, as shown in Figure 3a.
It consistently identifies the BK26 model as the best-performing GMM across all intensity measures and spectral periods. Following BK26, AC10 and KAAH15 demonstrate competitive performance. Similar to LLH, DIC ranks AC10 as the second-best model in most periods. Although the overall ranking structure remains broadly consistent between LLH and DIC for both the full dataset (Figure 3a) and the subset of 2432 recordings (Figure 3b), some differences are observed in the relative assessment of candidate GMMs. For example, KAAH15 outperforms BSSA21 in several cases. Another difference between the two criteria is observed in the relative assessment of ASB14 and MKBOL23. Although these models exhibit comparable LLH scores for several spectral acceleration ordinates, DIC consistently ranks ASB14 above MKBOL23. Furthermore, under DIC, the difference between ASB14 and BSSA21 is generally smaller than that between ASB14 and MKBOL23. These findings illustrate differences in model ranking associated with the treatment of residual variability, rather than demonstrating an inherent advantage of DIC in ranking capability. Furthermore, the gap between ASB14 and the lowest-ranked model among the top four performers in DIC (i.e., BSSA21) is smaller than the gap between ASB14 and MKBOL23. In contrast, MKBOL23 and BA08 are consistently separated from the higher-ranked models and occupy the sixth and seventh ranks, respectively, across the spectral acceleration ordinates. Since DIC is based on total deviance and depends on sample size, whereas LLH is averaged per observation, their numerical differences should not be directly compared as a measure of ranking capability.
The sensitivity of the DIC-based rankings to prior specification is investigated by varying the scale parameter of the half-normal prior and considering alternative half-Student-t and half-Cauchy priors. For the full dataset of 12,160 records, the rankings remain unchanged across all tested prior specifications, with only minor variations in the corresponding DIC values. This limited sensitivity may reflect the substantial information provided by the large dataset, which can increase the influence of the likelihood relative to the prior. An additional analysis using a 2432-record subset yields similarly stable rankings, with only two rank exchanges: BSSA21 and ASB14 exchanged positions for PSA at 0.05 s, while AC10 and KAAH15 exchanged positions for PSA at 0.2 s. These exchanges occurred consistently across the tested prior specifications. Overall, the results indicate that the comparative GMM rankings based on DIC are robust to the prior specifications considered in this study.
The overall agreement between LLH and DIC rankings indicates that the relative performance of the candidate GMMs is broadly consistent across the two evaluation criteria for the available Turkish ground-motion dataset. This agreement reflects consistency between the two criteria rather than independent validation of the selected GMMs. Both criteria clearly distinguish BK26 as the top-performing model and consistently identify AC10, BSSA21, and KAAH15 as the next-best candidates for spectral accelerations, with minor variations in their relative positions. BK26′s superior performance cannot be considered independent evidence of its predictive capability, as the dataset used for this evaluation was also used in its development.
Table 5 depicts the rankings from both approaches. The DIC method accounts for region-specific aleatory variability by allowing σ to be estimated directly from the dataset. This results in more reasonable uncertainty estimates for model comparison that can further be used in non-ergodic or partially non-ergodic PSHA [38]. For PSHA applications, the dataset should ideally reflect the seismotectonic conditions of the target site (e.g., similar magnitude range, distance distribution, site classes). In this study, the updated Turkish dataset is considered representative of tectonic conditions across Anatolia, making the resulting DIC rankings applicable to regional hazard assessments.
Table 5.
Ground motion model rankings based on LLH and DIC.
Table 6 presents the prior and posterior σ values for each model. The posterior sigma is the mean of the posterior distribution of sigma. Accordingly, well-performing models (BK26, BSSA21, KAAH15, AC10) exhibit smaller differences between prior and posterior sigma than models with inferior performance. For example, BA08 has a large posterior sigma across all IMs (1.230–2.450), which increases at longer periods. Similarly, MKBOL23 and ASB14 have considerable gaps between their prior and posterior sigma. This may indicate that a higher sigma is needed to accommodate discrepancies between model predictions and observations.
Table 6.
Prior and posterior residual standard deviation (σ) values for the evaluated ground motion models across intensity measures. Δ is the relative difference between prior and posterior.
3.2. Residual Analysis
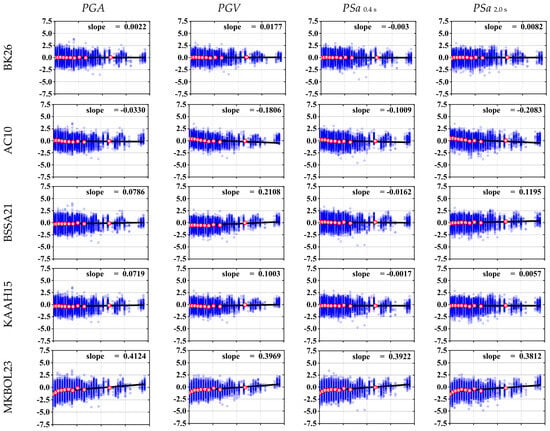
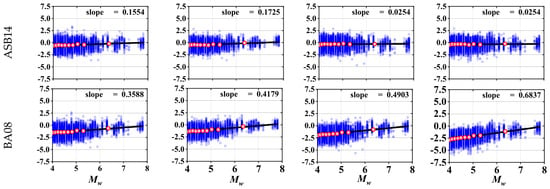
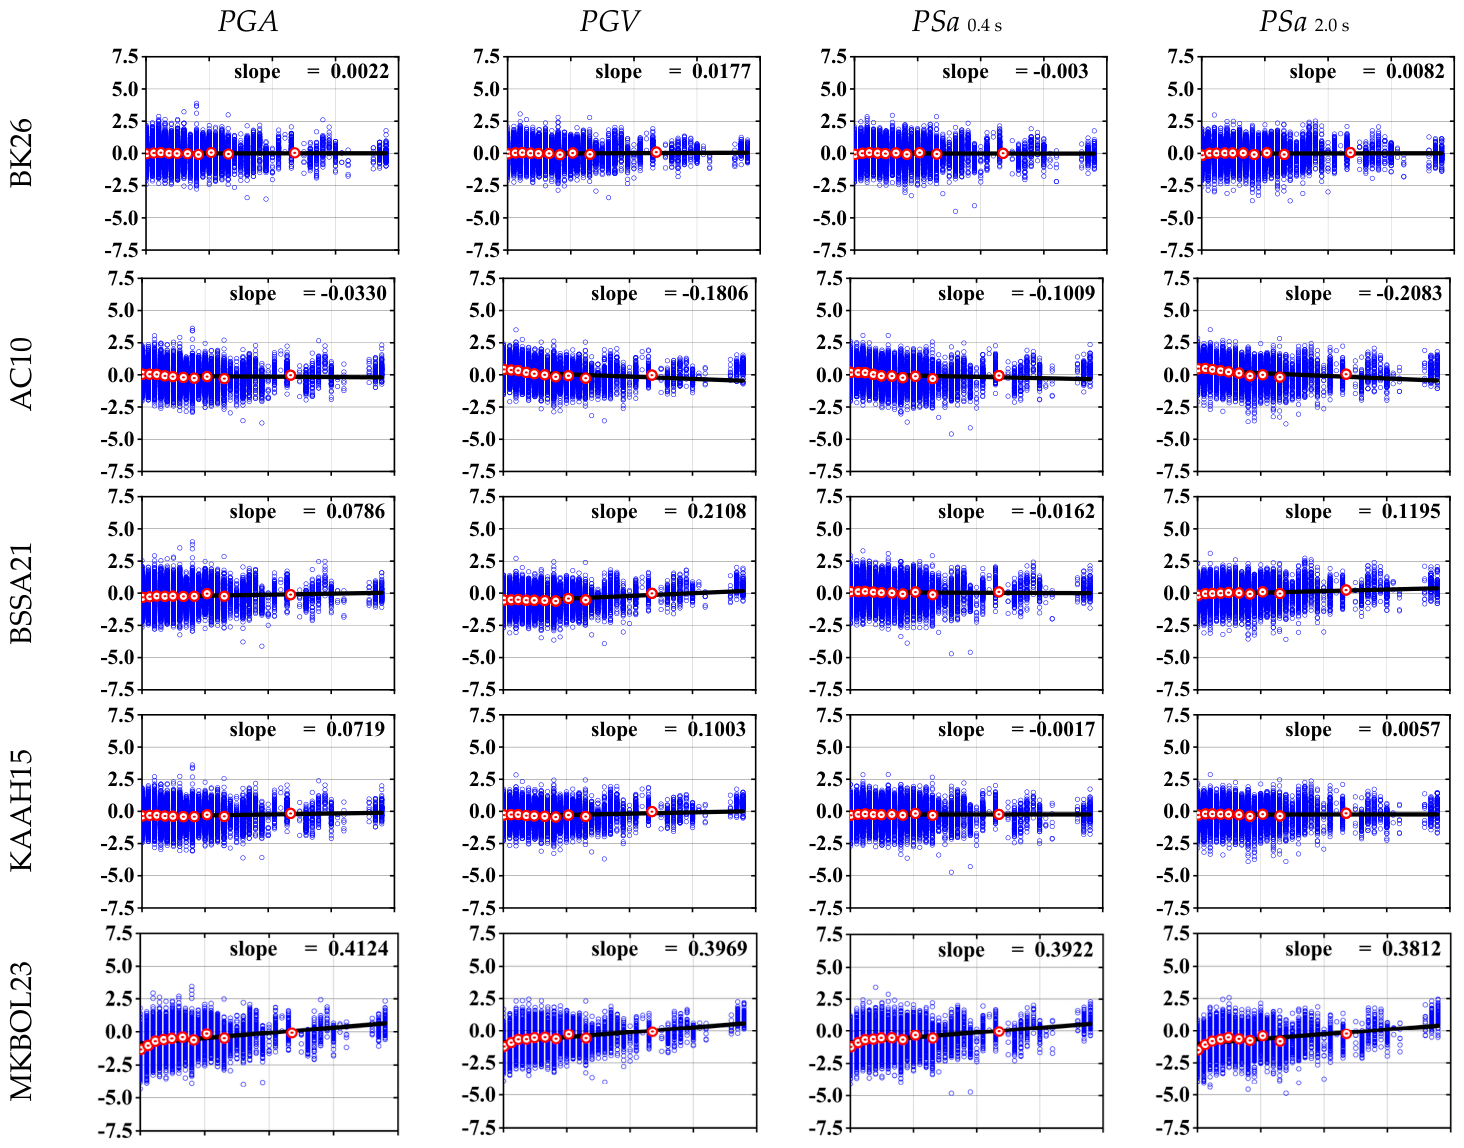
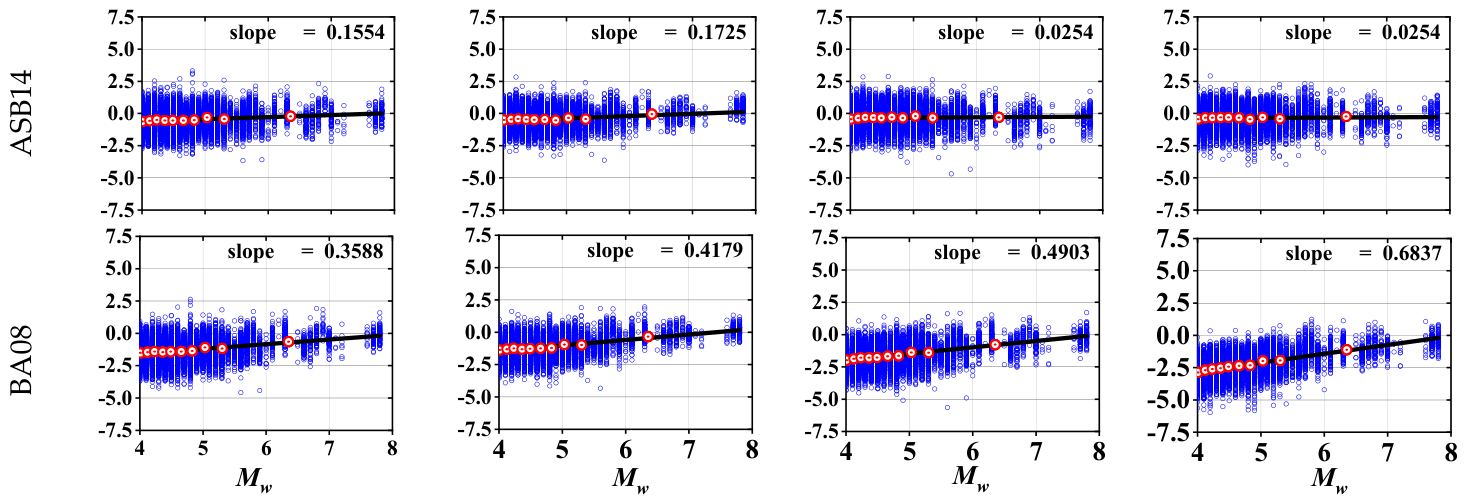
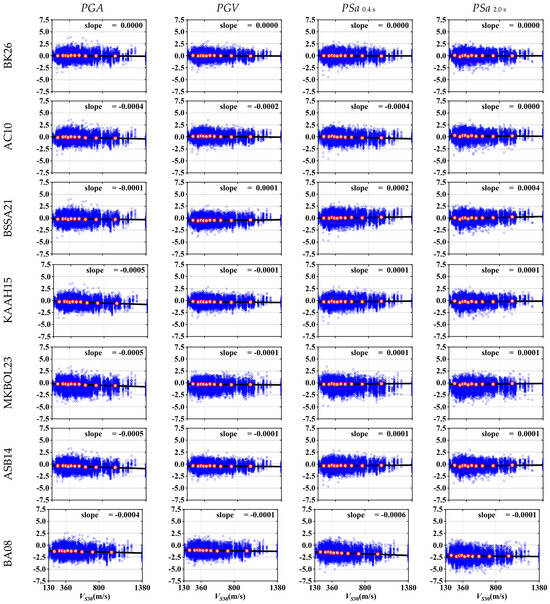
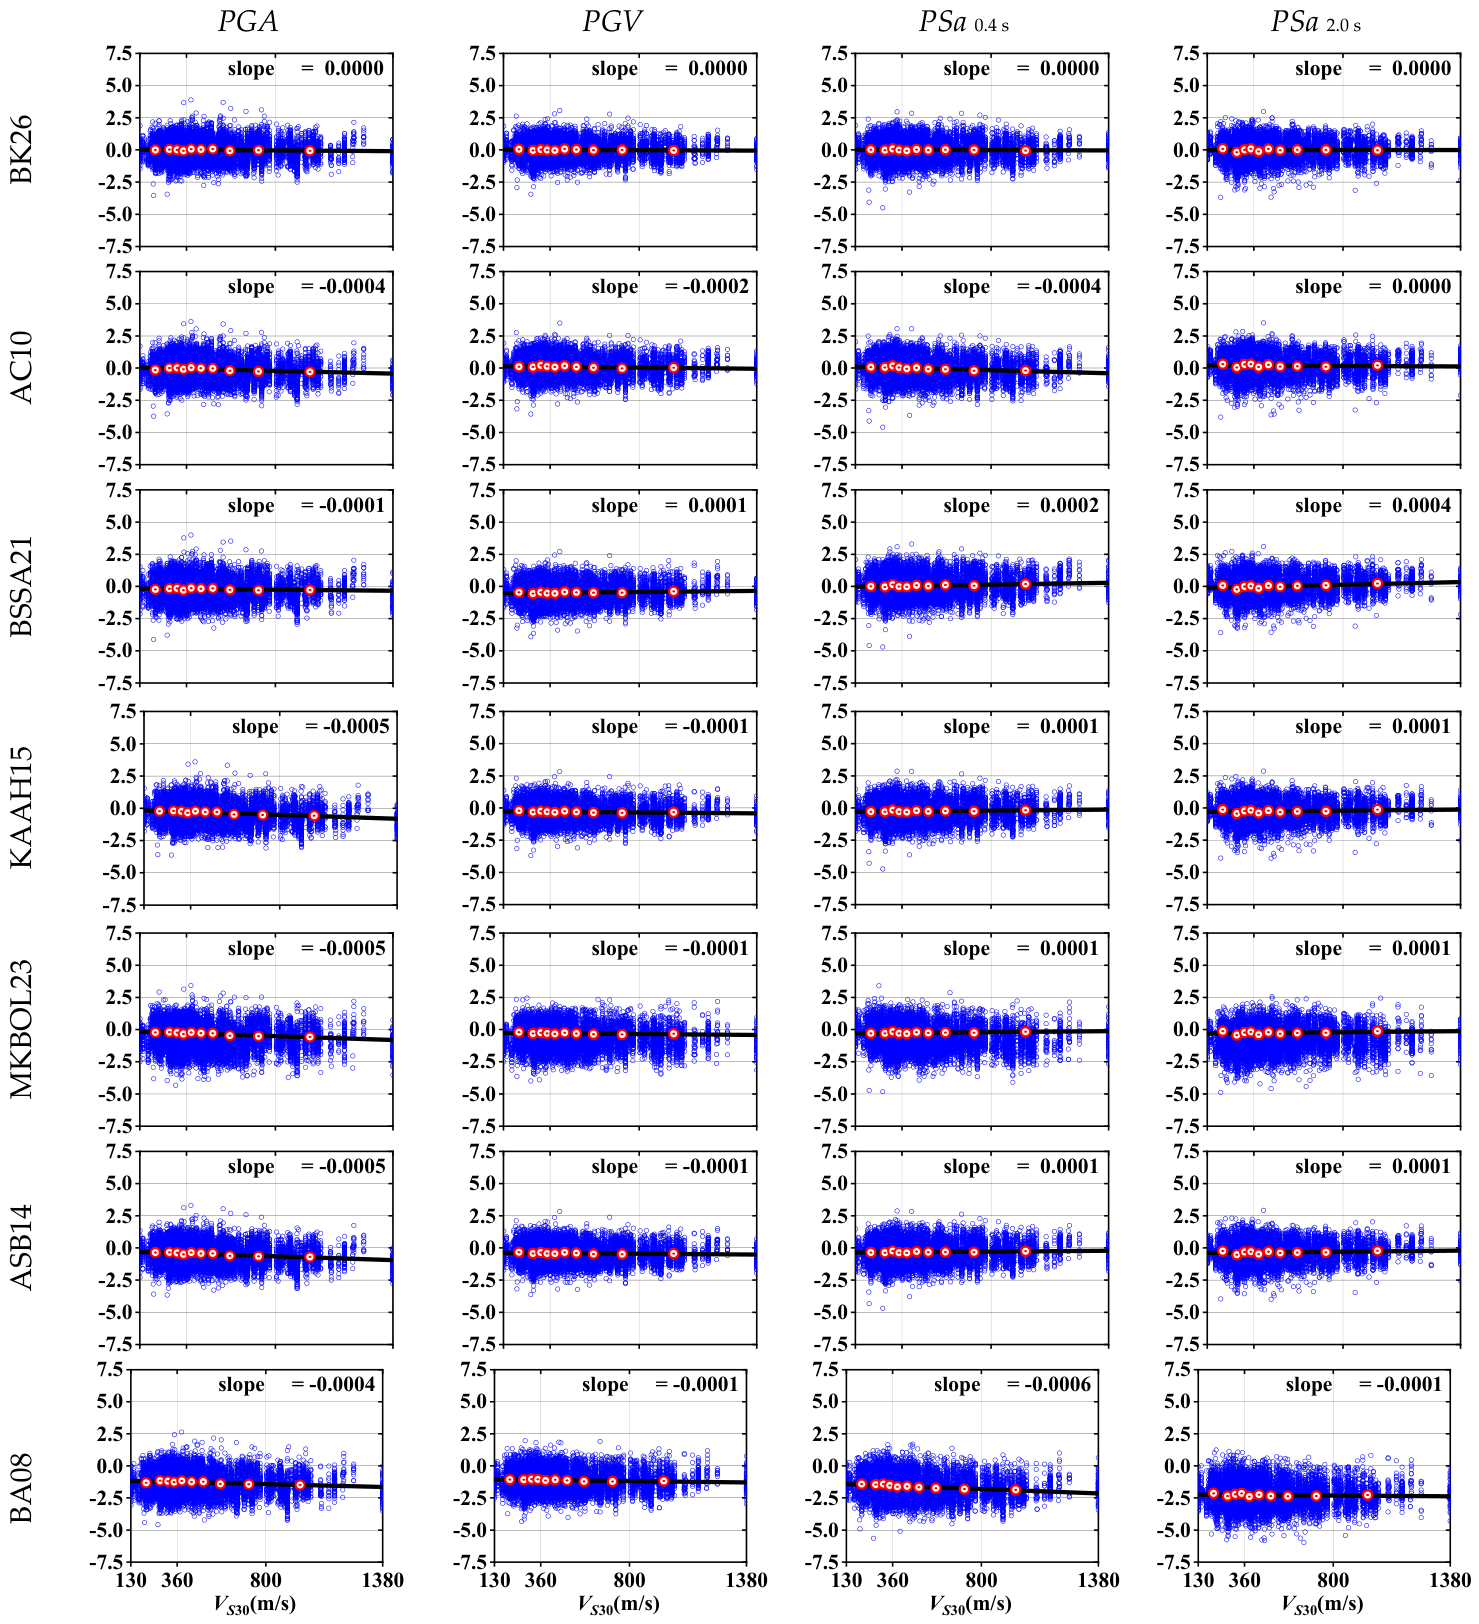
The residual distributions provide a visual diagnostic for assessing model bias. Figure 4, Figure 5 and Figure 6 represent the trends of total residuals as a function of Mw, RJB, and VS30, respectively, for PGA, PGV, and for the sake of brevity, only spectral accelerations at 0.4 s and 2 s. Figure 4 presents the residual distributions for the selected IMs with respect to Mw. For the BK26, residuals remain generally centered around zero over the dominant magnitude range of the dataset and do not exhibit pronounced monotonic trends. This behavior suggests that its magnitude-scaling terms are reasonably consistent with Turkish source scaling. AC10 shows relatively small slopes at short periods but increasingly negative slopes at longer periods. It exhibits a small downward trend at these longer periods. However, at magnitudes Mw greater than 7.0, the model begins to show greater scatter and mild upward residual shifts. Positive residual bias in the large-magnitude range means observed motions tend to exceed model predictions, implying that some models may underestimate strong-event spectral demand. The increasing residual trend with magnitude further implies that this underestimation becomes more pronounced as Mw increases. BSSA21 exhibits a similar pattern at greater magnitudes, although with larger positive slopes at PGA and PGV, followed by a gradual reduction toward near-zero values at intermediate periods. KAAH15 has similar trends to BSSA21, but it has smaller slopes and the trend is more near zero. KAAH15 and BSSA21 exhibit generally small-to-moderate residual trends, with their relative behavior varying among the intensity measures. For the remaining models (BA08, MKBOL23, and ASB14), the magnitude dependence appears more systematic. In particular, BA08 shows persistent positive residual bias at low-to-moderate magnitudes, especially for PGV and long-period PSa, followed by a gradual upward shift toward zero or positive values as magnitude increases. This indicates that the model overpredicts smaller events and relatively underpredicts larger events. The residual pattern for ASB14 appears slightly less randomly distributed, although this behavior is not readily discernible in the full scatter plot, given the high density of data points. MKBOL23 also shows a relatively less uniform centering of residuals and a broader scatter across magnitude, suggesting weaker scaling stability compared with the better-performing models.
Figure 4.
Total residuals as a function of moment magnitude (Mw).
Figure 5.
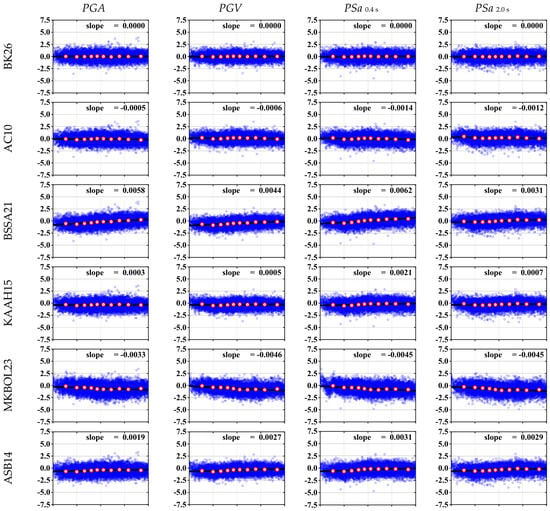
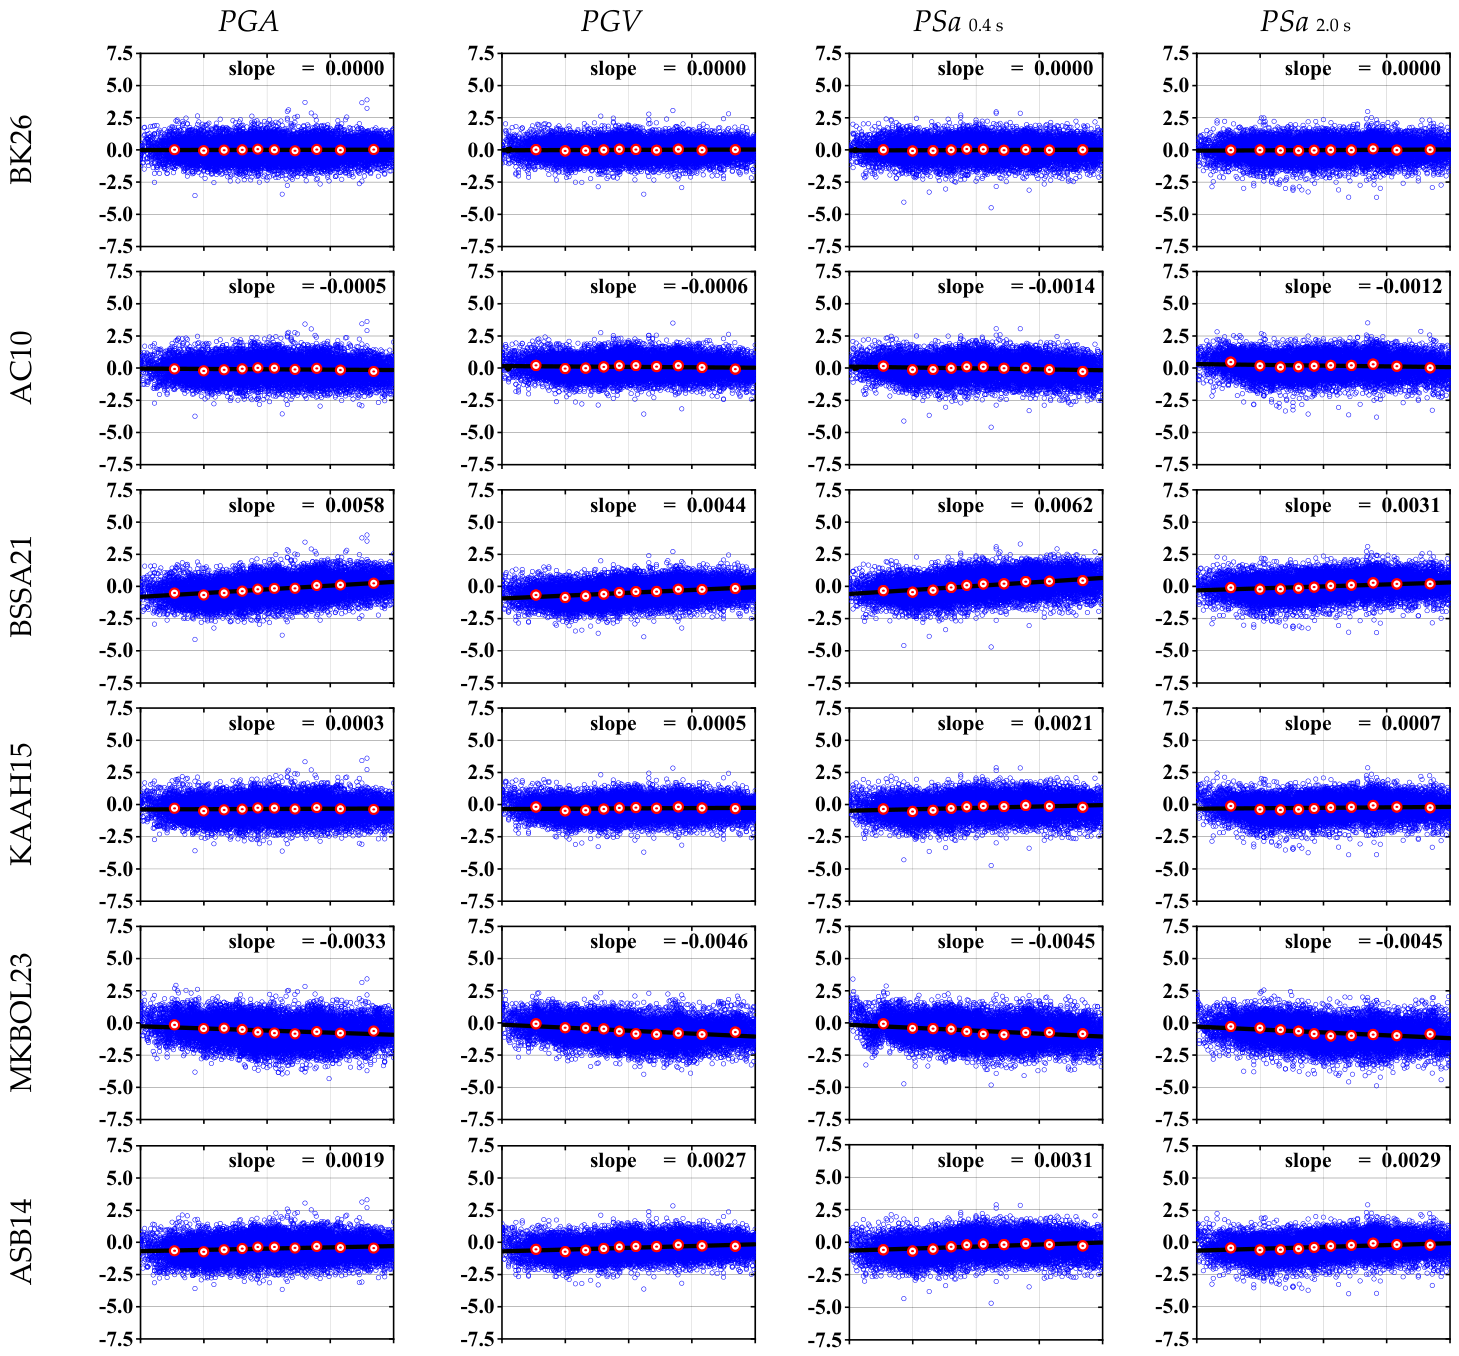
Total residuals as a function of distance (RJB).
Figure 6.
Total residuals as a function of VS30.
Figure 5 and Figure 6 present total residual distributions against RJB and VS30, respectively. Overall, the residual trends associated with these two explanatory variables are less pronounced than those observed with magnitude, indicating comparatively smaller systematic biases.
For RJB, BK26 generally exhibits residuals centered close to zero across the examined distance range and for all four intensity measures, with no pronounced systematic trend. AC10 and KAAH15 also show relatively symmetric residual distributions, with limited systematic drift in the mean residual as distance increases. These patterns indicate that the models provide a relatively consistent representation of the distance dependence in the Turkish strong-motion dataset. In contrast, BSSA21 and MKBOL23 show residual distributions that are more frequently shifted from zero and exhibit mild distance-dependent trends for some intensity measures. The corresponding residual slopes are also relatively larger, with BSSA21 generally showing an upward trend and MKBOL23 a downward trend with increasing distance. BA08 likewise exhibits systematic residual trends for several intensity measures, indicating a comparatively stronger distance-dependent bias.
The residuals against VS30 show generally weaker systematic trends than those observed against magnitude and RJB. Most models exhibit relatively small slopes and residual distributions that remain broadly centered around zero across the examined shear-wave velocity range. This suggests that the models introduce comparatively limited site-condition-dependent bias for the Turkish dataset.
3.3. Sensitivity of Rankings to Dataset Subsets
3.3.1. Sensitivity to Magnitude Ranges
The main dataset includes records with magnitudes outside the applicability ranges of AC10 and BA08. To investigate the influence of these records on the rankings, the analysis is repeated for two subsets: records with Mw < 5.0, which fall below the applicability ranges of both models, and records restricted to the common magnitude range of 5.0 < Mw < 7.6, within which both models are applicable.
For the Mw < 5.0 subset, the rankings remain largely consistent with those obtained using the full dataset (see Figure 7 and Figure 8). The observed changes are minor, involving occasional exchanges in LLH-based rank between BSSA21 and KAAH15 and between MKBOL23 and ASB14 for a limited number of IMs. This consistency may partly reflect the predominance of low-magnitude records in the full dataset (8581 recordings), which gives this magnitude range substantial influence on the overall rankings.
Figure 7.
LLH rankings against the dataset with magnitudes below 5.
Figure 8.
DIC rankings against the dataset with magnitudes below 5.
In contrast, restricting the analysis to 5.0 < Mw < 7.6 results in changes in the relative rankings (see Figure 9 and Figure 10). In this magnitude range, the dataset contains 2709 recordings. In LLH-based rankings, BSSA21 generally outperforms AC10, replacing it in most IMs. Also, MKBOL23 predominantly ranks fifth at longer periods, indicating improved performance relative to its ranking in the full dataset. Similarly, in the DIC-based rankings, BSSA21 outperforms KAAH15 and AC10 at longer periods. The rankings for BK26, MKBOL23, ASB14, and BA08 remain stable and consistent with the full-dataset results.
Figure 9.
LLH rankings against the dataset with magnitudes between 5 and 7.6.
Figure 10.
DIC rankings against the dataset with magnitudes between 5 and 7.6.
3.3.2. Sensitivity to Event-Based Data-Selection
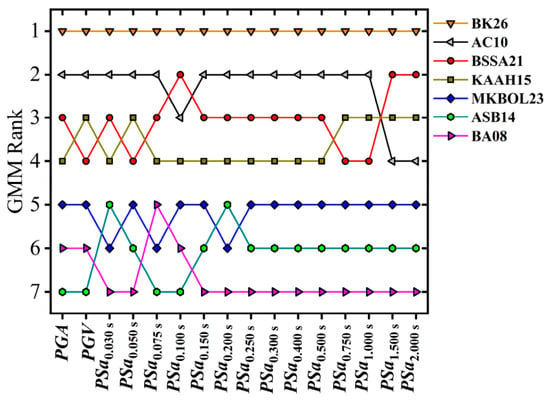
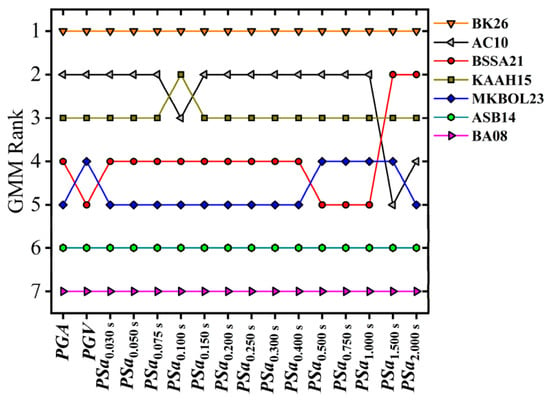
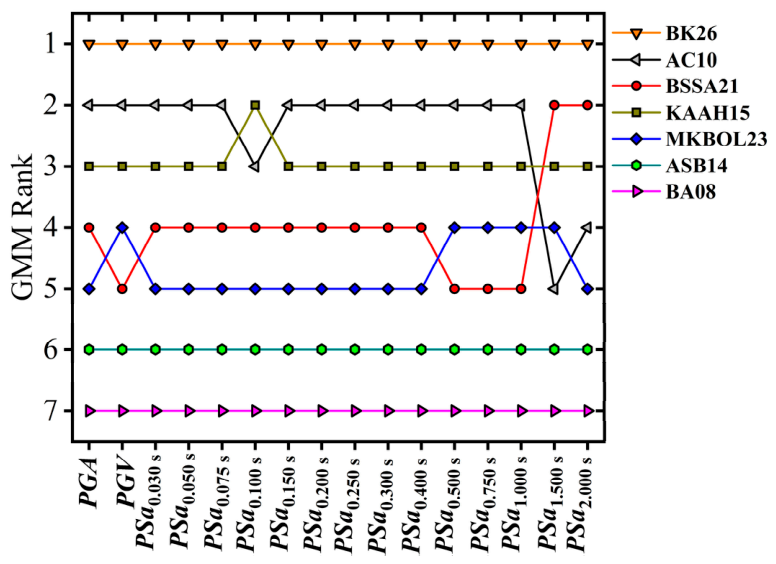
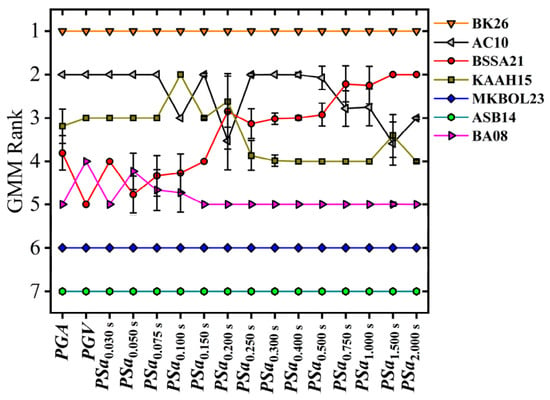
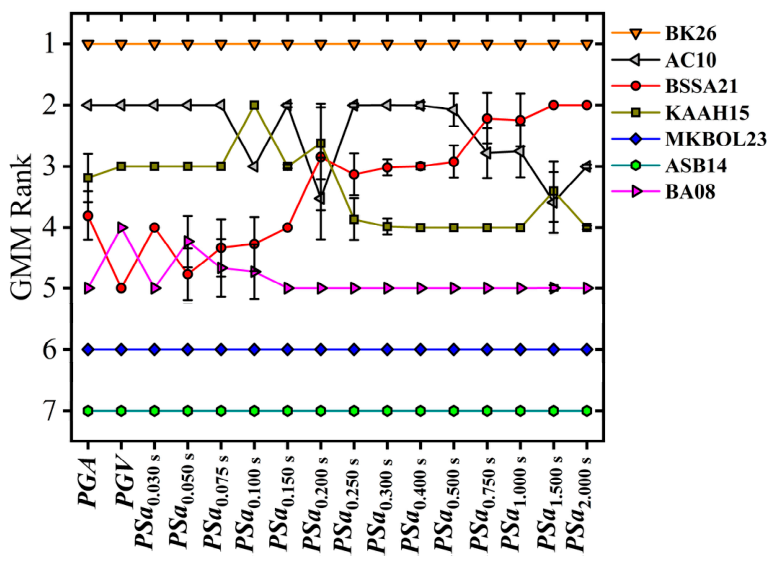
The assumption that observed ground-motion records are independent may not be appropriate for evaluating the relative performance of GMMs, as multiple records may originate from the same seismic event. Furthermore, events with larger numbers of recordings may disproportionately influence the overall rankings. To assess the sensitivity of the rankings to these factors, a random event-based ranking analysis is performed. In each realization, one record is randomly selected from each event, yielding a subset of 974 records representing 974 distinct events. This procedure is repeated 1000 times, with the LLH- and DIC-based rankings recalculated for each realization. The frequency with which each model attains each rank is then determined to characterize the variability of the rankings and assess the sensitivity of the relative performance comparisons to record selection at the event level.
The LLH and DIC rankings against the random event-based dataset largely preserve the overall ranking structure obtained from the full dataset at short periods. However, differences in the relative ordering of models emerge at specific IMs, particularly at longer periods. In LLH (see Figure 11), BK26 achieves rank 1 across all 1000 realizations for PGA, PGV, and PSA periods up to 0.40 s. However, at longer periods, its ranking becomes less stable, with BSSA21 occasionally outperforming it. In particular, BSSA21 achieves rank 1 in 43.7%, 67.7%, 43.0%, 87.5%, and 71.0% of realizations at periods of 0.50, 0.75, 1.00, 1.50, and 2.00 s, respectively. The superiority of BK26 in the full-dataset analysis is largely due to the fact that the model is developed using the same dataset. However, the event-level analysis, which reduces the influence of some individual events, indicates that this apparent superiority does not consistently extend to longer periods.
Figure 11.
Event-based LLH ranking.
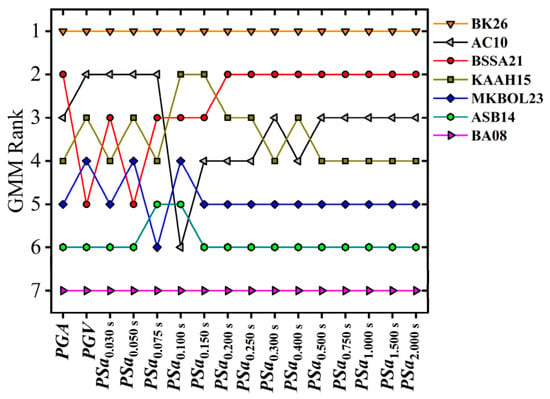
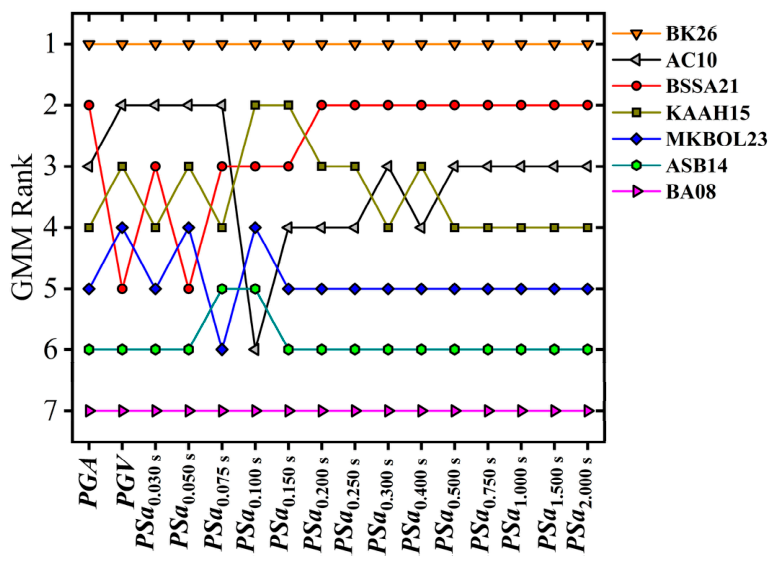
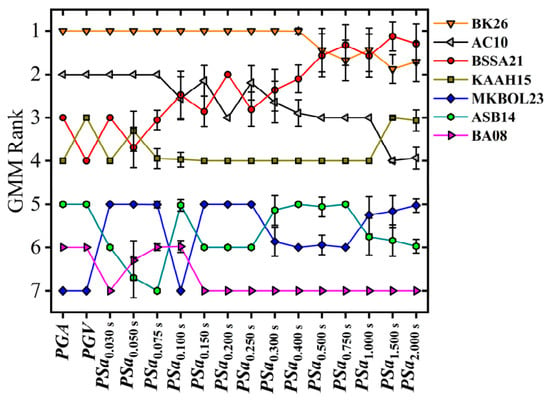
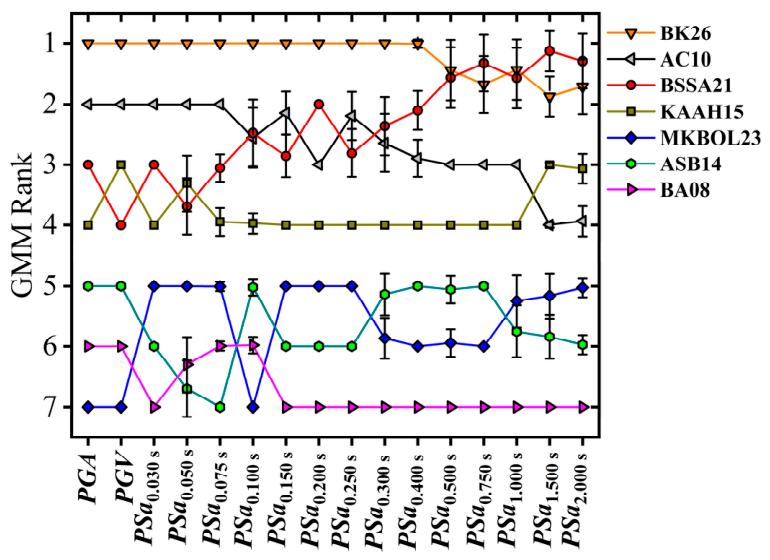
The relative ordering of AC10, BSSA21, and KAAH15 also exhibits period-dependent variability. AC10 consistently ranks second for PGA, PGV, and PSA periods up to 0.075 s, but alternates between ranks 2 and 3 at intermediate periods and between ranks 3 and 4 at longer periods (1.5 and 2 s). Similarly, BSSA21 and KAAH15 exchange ranks across several periods, with BSSA21 generally performing better at intermediate and long periods, whereas KAAH15 retains a relatively stable position at rank 4 over much of the spectrum. The lower-ranked models show comparatively stable rankings relative to the full-dataset rankings. BA08 consistently occupies rank 6 or 7, while ASB14 and MKBOL23 exhibit some exchanges between ranks 5 and 6, and occasionally between ranks 6 and 7.
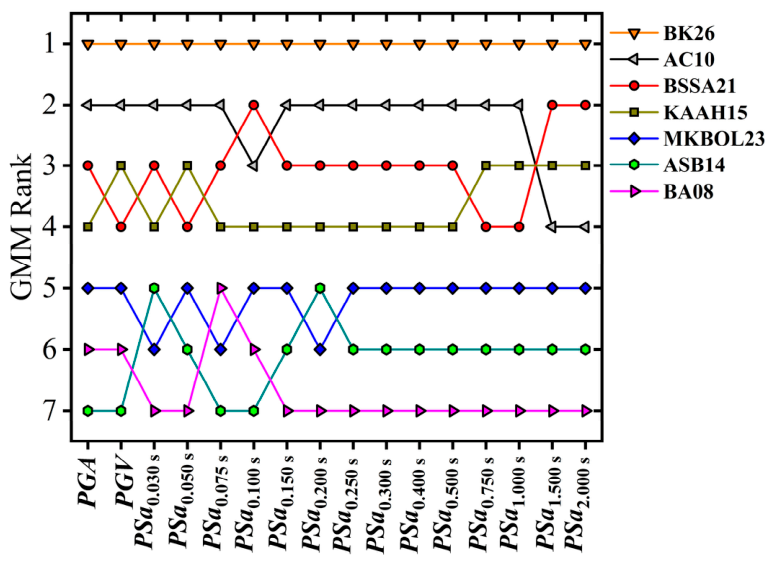
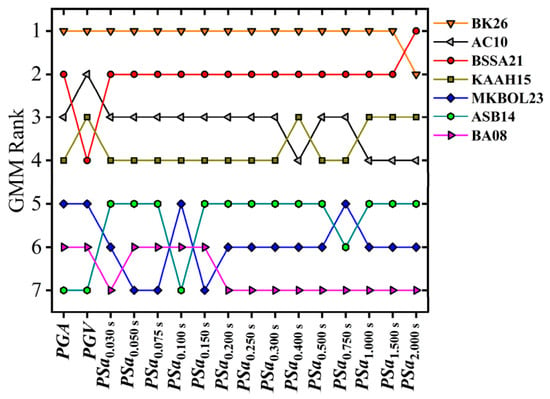
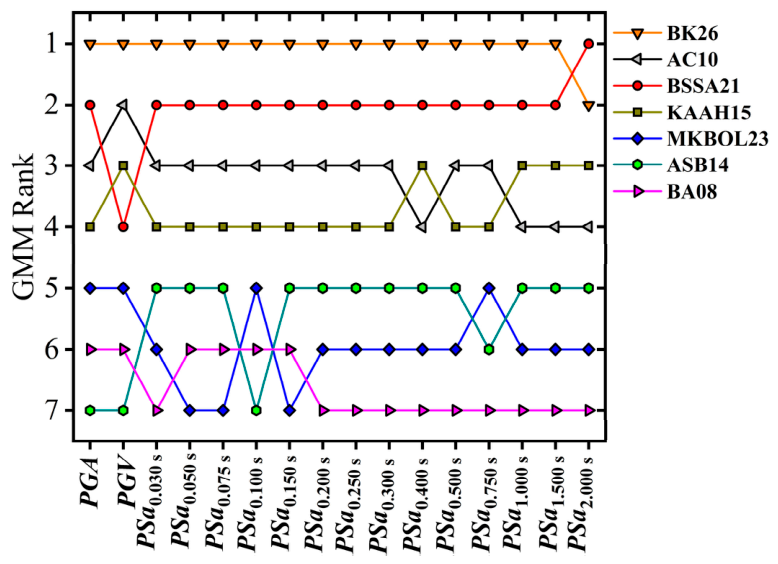
In this manner, DIC demonstrates strong stability in the relative positions of the BK26 (first), MKBOL23 (sixth), and BA08 (seventh) under event-based sampling, indicating that their positions under the DIC is insensitive to the random event-based selection of records (see Figure 12).
Figure 12.
Event-based DIC ranking.
The relative performance of AC10, BSSA21, and KAAH15, however, varies with spectral period. AC10 consistently ranks second for PGA, PGV, and PSA periods up to 0.075 s, and maintains this position for most intermediate periods. At 0.20 s, its ranking is less stable, with ranks 2, 3, and 4 occurring in 10.0%, 27.2%, and 62.8% of realizations, respectively. At 1.50 s, AC10 most frequently ranks fourth (58.7%), followed by rank 3 (41.1%). In contrast, BSSA21 performs relatively poorly at short periods, ranking fifth for PGV and fourth for PSA at 0.03 s, but its ranking improves at longer periods. It consistently achieves rank 2 at periods of 1.50 and 2.00 s, while ranking second in 78.4% and 75.4% of realizations at 0.75 and 1.00 s, respectively. KAAH15 exhibits a complementary period-dependent pattern, generally performing well at short periods but ranking fourth across much of the intermediate- and long-period range. These variations indicate that the relative ordering of AC10, BSSA21, and KAAH15 is more sensitive to event selection than the positions of BK26, MKBOL23, and BA08. ASB14 also exhibits some variability, primarily exchanging ranks 4 and 5 with BSSA21 at short periods. It ranks fourth for PGV and PSA at 0.05 s in 76.8% of realizations, whereas BSSA21 ranks fifth in 76.8% of realizations at the same period. For periods at and above 0.15 s, ASB14 ranks fifth, and its relative position is largely stable over much of the response spectrum.
Overall, the event-based analysis supports the broad conclusions of the full-dataset ranking, particularly the consistently stronger performance of BK26, AC10, BSSA21, and KAAH15 and comparatively weaker performance of MKBOL23, ASB14, and BA08. However, the changes in some ranking frequencies at longer periods demonstrate that the relative performance of models may be sensitive to event selection. This analysis therefore complements the full-dataset ranking by showing which conclusions remain consistent when each event contributes only one randomly selected record, thereby reducing the disproportionate influence of events with many recordings. Nevertheless, the results should be interpreted as a sensitivity analysis of event representation rather than independent validation of model performance.
4. Conclusions
In this study, a suite of parametric and machine-learning-based ground motion models (GMMs) developed for Türkiye is evaluated and ranked against an updated Turkish strong-motion database to support the preliminary evaluation of GMMs for scenario events in the region, in the context of probabilistic seismic hazard analysis (PSHA). Two information-theoretic approaches were employed for model comparison: the classical log-likelihood (LLH) method and the Bayesian deviance information criterion (DIC). In addition to establishing a ranking, the DIC framework enabled the recalibration of aleatory variability through Bayesian updating of the residual standard deviation, thereby allowing consistent comparison of models originally developed for different tectonic regions. The updated parameter represents the total residual scatter, rather than a separately identified non-ergodic aleatory variability component.
The rankings against the full dataset demonstrate a broadly consistent ranking structure across both the LLH and DIC criteria when applied to the same dataset. However, this agreement does not constitute independent validation, as both criteria evaluate model performance using the same observations. The BK26 model emerges as the best-performing GMM within the considered model set and dataset, which is expected given that it was developed using the same regional database. Further validation using independent datasets would be required to assess the model’s broader regional performance. The AC10 model ranks as the second-best-performing model for the most intensity measures. The BSSA21 and KAAH15 models are consistently ranked among the next-best models, with only minor variations in ordering depending on the intensity measure and spectral period. ASB14 and MKBOL23 exhibit comparable performance and generally occupy the next ranking group. However, their difference is more pronounced in the DIC results, where ASB14 is shown to perform noticeably better. BA08 is consistently the lowest-ranked model, exhibiting high LLH and DIC scores together with remarkable residual bias. The results also demonstrate that the DIC rankings are robust to the choice of prior distributions considered in this study.
Residual plots provide a useful visual assessment of median predictive performance and complement the quantitative LLH and DIC metrics used for model comparison. Considering both quantitative metrics and residual diagnostics provides a more comprehensive assessment of model performance for the selected regional dataset. In particular, residual plots can reveal systematic biases in median predictions as a function of explanatory variables that may not be apparent from the overall ranking metrics alone.
Furthermore, comparison of the prior and posterior standard deviations indicates that lower-performing models tend to underestimate the actual predictive uncertainty associated with the current dataset. Although the overall rankings obtained from the two methods are largely consistent, highlighting the dominant role of median prediction accuracy, in some cases, recalibration of the standard deviation improves model ranking (e.g., KAAH15 and ASB14 at short periods), whereas in others it leads to a lower ranking (e.g., MKBOL23 at short periods). This observation demonstrates that model dispersion can influence performance evaluation in addition to median prediction capability.
To assess the sensitivity of the rankings, the analysis is repeated using three subsets of the full dataset: (1) records with magnitudes restricted to the common applicability range of all models (5.0 < Mw < 7.6); (2) records with magnitudes below 5.0, which contains a substantial proportion of the dataset but requires extrapolation beyond the applicability range of some models; and (3) a subset containing one randomly selected record per earthquake event to assess the influence of event selection. The rankings obtained for the subset with 4.0 < Mw < 5.0 are generally consistent with those from the full dataset. For the subset restricted to the common applicability range (5.0 < Mw < 7.6), the relative performance of some models is sensitive to event selection. Notably, BSSA21 ranks second for nearly all IMs under LLH and at longer periods in DIC.
This study presents a data-driven framework for GMM selection and ranking, employing two information-theoretic methods alongside supplementary residual analysis. These results are intended to inform, rather than replace, expert judgment in GMM selection for PSHA for Türkiye. The rankings obtained in this study should not be interpreted as PSHA logic-tree weights or as evidence of their effects on hazard curves, as these aspects were not evaluated herein. Rather, they reflect the relative agreement of the considered GMMs with the analyzed strong-motion database and may provide supporting information for future GMM selection and logic-tree development in regional PSHA applications. Future work may extend this framework by incorporating hierarchical variance decomposition to explicitly account for event-level residual correlations, thereby further refining the treatment of aleatory variability.
Author Contributions
Conceptualization, S.K., S.A.B. and F.S.; methodology, S.K., F.S. and S.A.B.; software, S.A.B. and F.S.; validation, S.K., S.A.B. and F.S.; formal analysis, S.A.B. and F.S.; investigation, S.K., S.A.B. and F.S.; resources, S.K., S.A.B. and F.S.; data curation, S.K., S.A.B. and F.S.; writing—original draft preparation, S.K., S.A.B. and F.S.; writing—review and editing, S.K., S.A.B., A.A., P.B.L. and F.S.; visualization, S.A.B. and F.S.; supervision, S.K. and S.A.B.; project administration, S.K.; funding acquisition, S.K. and P.B.L. All authors have read and agreed to the published version of the manuscript.
Funding
This research received no external funding.
Data Availability Statement
The data presented in this study are available on request from the corresponding author. The source code developed for model evaluation, Bayesian updating, and ranking analyses, is available at: [https://github.com/FatemehSharafii/gmmrank (accessed on 27 September 2026)].
Acknowledgments
This work is financed by national funds through FCT—Foundation for Science and Technology, under grant agreement [2023.08982.CEECIND/CP2841/CT0033] attributed to the third author (https://doi.org/10.54499/2023.08982.CEECIND/CP2841/CT0033). This work was also supported by FCT/Ministério da Ciência, Tecnologia e Ensino Superior (MCTES) under the R&D Unit Institute for Sustainability and Innovation in Structural Engineering (ISISE), under the references UID/4029/2025 (https://doi.org/10.54499/UID/04029/2025) and UID/PRR/04029/2025 (https://doi.org/10.54499/UID/PRR/04029/2025), and under the Associate Laboratory Advanced Production and Intelligent Systems (ARISE) under reference LA/P/0112/2020.
Conflicts of Interest
The authors declare no conflicts of interest.
References
- Akkar, S.; Cagnan, Z. A Local Ground-Motion Predictive Model for Turkey, and Its Comparison with Other Regional and Global Ground-Motion Models. Bull. Seismol. Soc. Am. 2010, 100, 2978–2995. [Google Scholar] [CrossRef] [Scilit]
- Bindi, D.; Parolai, S.; Grosser, H.; Milkereit, C.; Durukal, E. Empirical Ground-Motion Prediction Equations for Northwestern Turkey Using the Aftershocks of the 1999 Kocaeli Earthquake. Geophys. Res. Lett. 2007, 3, 4. [Google Scholar] [CrossRef] [Scilit]
- Boore, D.M.; Stewart, J.P.; Skarlatoudis, A.A.; Seyhan, E.; Margaris, B.; Theodoulidis, N.; Scordilis, E.; Kalogeras, I.; Klimis, N.; Melis, N.S. A Ground-Motion Prediction Model for Shallow Crustal Earthquakes in Greece. Bull. Seismol. Soc. Am. 2021, 111, 857–874. [Google Scholar] [CrossRef] [Scilit]
- Campbell, K.W.; Bozorgnia, Y. A Ground Motion Prediction Equation for JMA Instrumental Seismic Intensity for Shallow Crustal Earthquakes in Active Tectonic Regimes. Earthq. Eng. Struct. Dyn. 2011, 40, 413–427. [Google Scholar] [CrossRef] [Scilit]
- Yaghmaei-Sabegh, S.; Karimzadeh, S.; Ebrahimi, M.; Ozsarac, V.; Du, W. A New Region-Specific Empirical Model for Prediction of Ground Motion Significant Duration in Turkey. Bull. Earthq. Eng. 2022, 20, 4919–4936. [Google Scholar] [CrossRef] [Scilit]
- Dhanya, J.; Raghukanth, S.T.G. Ground Motion Prediction Model Using Artificial Neural Network. Pure Appl. Geophys. 2018, 175, 1035–1064. [Google Scholar] [CrossRef] [Scilit]
- Karimzadeh, S.; Mohammadi, A.; Hussaini, S.M.S.; Caicedo, D.; Askan, A.; Lourenço, P.B. ANN-Based Ground Motion Model for Turkey Using Stochastic Simulation of Earthquakes. Geophys. J. Int. 2024, 236, 413–429. [Google Scholar] [CrossRef] [Scilit]
- Karimzadeh, S.; Mohammadi, A.; Salahuddin, U.; Carvalho, A.; Lourenço, P.B. Backbone Ground Motion Model through Simulated Records and XGBoost Machine Learning Algorithm: An Application for the Azores Plateau (Portugal). Earthq. Eng. Struct. Dyn. 2024, 53, 668–693. [Google Scholar] [CrossRef] [Scilit]
- Meenakshi, Y.; Vemula, S.; Alne, A.; Raghukanth, S. Ground Motion Model for Peninsular India Using an Artificial Neural Network. Earthq. Spectra 2023, 39, 596–633. [Google Scholar] [CrossRef] [Scilit]
- Mohammadi, A.; Karimzadeh, S.; Banimahd, S.A.; Ozsarac, V.; Lourenço, P.B. The Potential of Region-Specific Machine-Learning-Based Ground Motion Models: Application to Turkey. Soil Dyn. Earthq. Eng. 2023, 172, 108008. [Google Scholar] [CrossRef] [Scilit]
- Sreenath, V.; Podili, B.; Raghukanth, S.T.G. A Hybrid Non-Parametric Ground Motion Model for Shallow Crustal Earthquakes in Europe. Earthq. Eng. Struct. Dyn. 2023, 52, 2303–2322. [Google Scholar] [CrossRef] [Scilit]
- Ji, K.; Karimzadeh, S.; Yaghmaei-Sabegh, S.; Hou, R.; Carvalho, A.; Lourenço, P.B. Ground Motion Model Using Simulated Scenario Earthquake Records in Azores Plateau (Portugal) at Bedrock. Soil Dyn. Earthq. Eng. 2025, 197, 109521. [Google Scholar] [CrossRef] [Scilit]
- Kotha, S.R.; Bindi, D.; Cotton, F. Partially Non-Ergodic Region Specific GMPE for Europe and Middle-East. Bull. Earthq. Eng. 2016, 14, 1245–1263. [Google Scholar] [CrossRef] [Scilit]
- Kuran, F.; Tanırcan, G.; Pashaei, E. Developing Machine Learning-Based Ground Motion Models to Predict Peak Ground Velocity in Turkiye. J. Seismol. 2024, 28, 1183–1204. [Google Scholar] [CrossRef] [Scilit]
- Yerlikaya-Özkurt, F.; Askan, A.; Weber, G.-W. An Alternative Approach to the Ground Motion Prediction Problem by a Non-Parametric Adaptive Regression Method. Eng. Optim. 2014, 46, 1651–1668. [Google Scholar] [CrossRef] [Scilit]
- Delavaud, E.; Cotton, F.; Akkar, S.; Scherbaum, F.; Danciu, L.; Beauval, C.; Drouet, S.; Douglas, J.; Basili, R.; Sandikkaya, M.A.; et al. Toward a Ground-Motion Logic Tree for Probabilistic Seismic Hazard Assessment in Europe. J. Seismol. 2012, 16, 451–473. [Google Scholar] [CrossRef] [Scilit]
- Atkinson, G.M.; Adams, J. Ground Motion Prediction Equations for Application to the 2015 Canadian National Seismic Hazard Maps. Can. J. Civ. Eng. 2013, 40, 988–998. [Google Scholar] [CrossRef] [Scilit]
- Bommer, J.J.; Scherbaum, F.; Bungum, H.; Cotton, F.; Sabetta, F.; Abrahamson, N.A. On the Use of Logic Trees for Ground-Motion Prediction Equations in Seismic-Hazard Analysis. Bull. Seismol. Soc. Am. 2005, 95, 377–389. [Google Scholar] [CrossRef] [Scilit]
- Bommer, J.J.; Abrahamson, N.A. Why Do Modern Probabilistic Seismic-Hazard Analyses Often Lead to Increased Hazard Estimates? Bull. Seismol. Soc. Am. 2006, 96, 1967–1977. [Google Scholar] [CrossRef] [Scilit]
- Scherbaum, F.; Delavaud, E.; Riggelsen, C. Model Selection in Seismic Hazard Analysis: An Information-Theoretic Perspective. Bull. Seismol. Soc. Am. 2009, 99, 3234–3247. [Google Scholar] [CrossRef] [Scilit]
- Edwards, B.; Cauzzi, C.; Danciu, L.; Fäh, D. Region-Specific Assessment, Adjustment and Weighting of Ground Motion Prediction Models: Application to the 2015 Swiss Seismic Hazard Maps. Bull. Seismol. Soc. Am. 2015, 106, 1840–1857. [Google Scholar] [CrossRef] [Scilit]
- Gögen, B.; Karimzadeh, S.; Lourenço, P.B. Probabilistic Seismic Hazard Assessment of Lisbon (Portugal). GeoHazards 2024, 5, 932–970. [Google Scholar] [CrossRef] [Scilit]
- Rezaeian, S.; Powers, P.M.; Shumway, A.M.; Petersen, M.D.; Luco, N.; Frankel, A.D.; Moschetti, M.P.; Thompson, E.M.; McNamara, D.E. The 2018 Update of the US National Seismic Hazard Model: Ground Motion Models in the Central and Eastern US. Earthq. Spectra 2021, 37, 1354–1390. [Google Scholar] [CrossRef] [Scilit]
- Rezaeian, S.; Petersen, M.D.; Moschetti, M.P. Ground Motion Models Used in the 2014 U.S. National Seismic Hazard Maps. Earthq. Spectra 2015, 31, S59–S84. [Google Scholar] [CrossRef] [Scilit]
- Akkar, S.; Kale, O.; Yakut, A.; Çeken, U. Ground-Motion Characterization for the Probabilistic Seismic Hazard Assessment in Turkey. Bull. Earthq. Eng. 2017, 16, 3439–3463. [Google Scholar] [CrossRef] [Scilit]
- McNamara, D.E.; Petersen, M.D.; Thompson, E.M.; Powers, P.M.; Shumway, A.M.; Hoover, S.M.; Moschetti, M.P.; Wolin, E. Evaluation of Ground-Motion Models for USGS Seismic Hazard Forecasts: Induced and Tectonic Earthquakes in the Central and Eastern United States. Bull. Seismol. Soc. Am. 2019, 109, 322–335. [Google Scholar] [CrossRef] [Scilit]
- Woessner, J.; Laurentiu, D.; Giardini, D.; Crowley, H. The 2013 European Seismic Hazard Model: Key Components and Results. Bull. Earthq. Eng. 2015, 13, 3553–3596. [Google Scholar] [CrossRef] [Scilit]
- Anbazhagan, P.; Bajaj, K.; Patel, S. Seismic Hazard Maps and Spectrum for Patna Considering Region-Specific Seismotectonic Parameters. Nat. Hazards 2015, 78, 1163–1195. [Google Scholar] [CrossRef] [Scilit]
- Kaviris, G.; Zymvragakis, A.; Bonatis, P.; Kapetanidis, V.; Spingos, I.; Mavroulis, S.; Kotsi, E.; Lekkas, E.; Voulgaris, N. A Logic-Tree Approach for Probabilistic Seismic Hazard Assessment in the Administrative Region of Attica (Greece). Appl. Sci. 2023, 13, 7553. [Google Scholar] [CrossRef] [Scilit]
- Kale, O.; Akkar, S. A New Procedure for Selecting and Ranking Ground-Motion Prediction Equations (GMPEs): The Euclidean Distance-Based Ranking (EDR) Method. Bull. Seismol. Soc. Am. 2013, 103, 1069–1084. [Google Scholar] [CrossRef] [Scilit]
- Kale, Ö. Practical Tools for Ranking and Selection of Groundmotion Prediction Equations (GMPEs) for Probabilistic Seismic Hazard Assessment and Development of a Regional GMPE. Doctoral Dissertation, Middle East Technical University, Ankara, Türkiye, 2014. [Google Scholar]
- Nizamani, Z.A.; Park, D. Testing Ground-Motion Prediction Equations against Moderate Magnitude Earthquake Data Recorded in Korea. Bull. Seismol. Soc. Am. 2020, 111, 321–338. [Google Scholar] [CrossRef] [Scilit]
- Sotiriadis, D.; Margaris, B. Evaluation of the Predictive Performance of Regional and Global Ground Motion Predictive Equations against Greek Strong Motion Data. Soil Dyn. Earthq. Eng. 2023, 165, 107656. [Google Scholar] [CrossRef] [Scilit]
- Farajpour, Z.; Kowsari, M.; Pezeshk, S.; Halldorsson, B. Ranking of Ground-Motion Models (GMMs) for Use in Probabilistic Seismic Hazard Analysis for Iran Based on an Independent Data Set. Bull. Seismol. Soc. Am. 2021, 111, 242–257. [Google Scholar] [CrossRef] [Scilit]
- Farhadi, A.; Farajpour, Z.; Pezeshk, S. Assessing Predictive Capability of Ground-Motion Models for Probabilistic Seismic Hazard in Iran. Bull. Seismol. Soc. Am. 2019, 109, 2073–2087. [Google Scholar] [CrossRef] [Scilit]
- Kale, Ö. Some Discussions on Data-Driven Testing of Ground-Motion Prediction Equations under the Turkish Ground-Motion Database. J. Earthq. Eng. 2019, 23, 160–181. [Google Scholar] [CrossRef] [Scilit]
- Mabrouk, A.H.A.S.H. Performance of Alternative Ground Motion Models with Strong Motion Data from Moderate to Large Events in Different Seismotectonic Regions in Türkiye. Master’s Thesis, Middle East Technical University, Ankara, Türkiye, 2024. [Google Scholar]
- Kowsari, M.; Halldorsson, B.; Hrafnkelsson, B.; Jónsson, S. Selection of Earthquake Ground Motion Models Using the Deviance Information Criterion. Soil Dyn. Earthq. Eng. 2019, 117, 288–299. [Google Scholar] [CrossRef] [Scilit]
- Spiegelhalter, D.J.; Best, N.G.; Carlin, B.P.; Van Der Linde, A. Bayesian Measures of Model Complexity and Fit. J. R. Stat. Soc. Ser. B Stat. Methodol. 2002, 64, 583–639. [Google Scholar] [CrossRef] [Scilit]
- Askan, A.; Karimzadeh, S.; Asten, M.; KILIÇ, N.; Sisman, F.; Erkmen, C. Assessment of Seismic Hazard in the Erzincan (Turkey) Region: Construction of Local Velocity Models and Evaluation of Potential Ground Motions. Turk. J. Earth Sci. 2015, 24, 529–565. [Google Scholar] [CrossRef] [Scilit]
- Demircioglu, M.B.; Sesetyan, K.; Duman, T.Y.; Can, T.; Tekin, S.; Ergintav, S. A Probabilistic Seismic Hazard Assessment for the Turkish Territory: Part II—Fault Source and Background Seismicity Model. Bull. Earthq. Eng. 2017, 16, 3399–3438. [Google Scholar] [CrossRef] [Scilit]
- Sianko, I.; Ozdemir, Z.; Khoshkholghi, S.; Garcia, R.; Hajirasouliha, I.; Yazgan, U.; Pilakoutas, K. A Practica Probabilistic Earthquake Hazard Analysis Tool: Case Study Marmara Region. Bull. Earthq. Eng. 2020, 18, 2523–2555. [Google Scholar] [CrossRef] [Scilit]
- Wang, W.; Hu, J. Updated Hazard and Risk Assessment for Middle-Southern Turkiye by PSHA Methods after Two Damaged Earthquakes in 2023. Eng. Geol. 2025, 358, 108391. [Google Scholar] [CrossRef] [Scilit]
- Banimahd, A.; Karimzadeh, S. Artificial Neural Network-Based Non-Parametric Ground Motion Models for Multiple Intensity Measures in Türkiye. Eng. Appl. Artif. Intell. 2026, 175, 114599. [Google Scholar] [CrossRef] [Scilit]
- Sandıkkaya, M.; Güryuva, B.; Kale, Ö. An Updated Strong-Motion Database of Türkiye (SMD-TR). Earthq. Spectra 2023, 40, 847–870. [Google Scholar] [CrossRef] [Scilit]
- Kale, Ö.; Akkar, S.; Ansari, A.; Hamzehloo, H. A Ground-Motion Predictive Model for Iran and Turkey for Horizontal PGA, PGV, and 5% Damped Response Spectrum: Investigation of Possible Regional Effects. Bull. Seismol. Soc. Am. 2015, 105, 963–980. [Google Scholar] [CrossRef] [Scilit]
- Kalkan, E.; Gulkan, P. Site-Dependent Spectra Derived from Ground Motion Records in Turkey. Earthq. Spectra 2004, 20, 1111–1138. [Google Scholar] [CrossRef] [Scilit]
- Cotton, F.; Scherbaum, F.; Bommer, J.J.; Bungum, H. Criteria for Selecting and Adjusting Ground-Motion Models for Specific Target Regions: Application to Central Europe and Rock Sites. J. Seismol. 2006, 10, 137–156. [Google Scholar] [CrossRef] [Scilit]
- Sandıkkaya, M.A.; Yılmaz, M.T.; Bakır, B.S.; Yılmaz, Ö. Site Classification of Turkish National Strong-Motion Stations. J. Seismol. 2010, 14, 543–563. [Google Scholar] [CrossRef] [Scilit]
- Akkar, S.; Kale, Ö.; Ansari, A.; Durgaryan, R.; Askan Gündoğan, A.; Hamzehloo, H.; Harmandar, E.; Tsereteli, N.; Waseem, M.; Yazjeen, T.; et al. EMME Strong-Motion Database Serving for Predictive Model Selection to EMME Ground-Motion Logic-Tree Applications. In Proceedings of the Second Conference on Earthquake Engineering and Seismology, Istanbul, Türkiye, 25–29 August 2014. [Google Scholar]
- Akkar, S.; Sandıkkaya, M.A.; Bommer, J.J. Empirical Ground-Motion Models for Point- and Extended-Source Crustal Earthquake Scenarios in Europe and the Middle East. Bull. Earthq. Eng. 2014, 12, 359–387. [Google Scholar] [CrossRef] [Scilit]
- Akkar, S.; Sandıkkaya, M.; Senyurt, M.; Azari, S.; Ay, B. Reference Database for Seismic Ground-Motion in Europe (RESORCE). Bull. Earthq. Eng. 2013, 12, 311–339. [Google Scholar] [CrossRef] [Scilit]
- Margaris, B.; Athanasopoulos, G.; Mylonakis, G.; Papaioannou, C.; Klimis, N.; Theodulidis, N.; Savvaidis, A.; Efthymiadou, V.; Stewart, J.P. The 8 June 2008 Mw 6.4 Achaia–Elia, Greece Earthquake: Source Characteristics, Ground Motions, and Ground Failure. Earthq. Spectra 2010, 26, 399–424. [Google Scholar] [CrossRef] [Scilit]
- Boore, D.M.; Atkinson, G.M. Ground-Motion Prediction Equations for the Average Horizontal Component of PGA, PGV, and 5%-Damped PSA at Spectral Periods between 0.01 s and 10.0 s. Earthq. Spectra 2008, 24, 99–138. [Google Scholar] [CrossRef] [Scilit]
- Chiou, B.; Darragh, R.; Silva, W. An Overview of the NGA Database. Earthq. Spectra 2008, 24, 23–44. [Google Scholar] [CrossRef] [Scilit]
- AFAD Turkish Accelerometric Database and Analysis System. Disaster Emerg Manag Pres; 2020. Available online: https://tadas.afad.gov.tr (accessed on 19 January 2026).
- Hastings, W. Monte Carlo Sampling Methods Using Markov Chains and Their Application. Biometrika 1970, 57, 97–109. [Google Scholar] [CrossRef] [Scilit]
- Metropolis, N.; Rosenbluth, A.; Rosenbluth, M.; Teller, A.; Teller, E. Equations of State Calculations by Fast Computing Machines. J. Chem. Phys. 1953, 21, 1087–1092. [Google Scholar] [CrossRef] [Scilit]



Disclaimer/Publisher’s Note: The statements, opinions and data contained in all publications are solely those of the individual author(s) and contributor(s) and not of MDPI and/or the editor(s). MDPI and/or the editor(s) disclaim responsibility for any injury to people or property resulting from any ideas, methods, instructions or products referred to in the content. |
© 2026 by the authors. Licensee MDPI, Basel, Switzerland. This article is an open access article distributed under the terms and conditions of the Creative Commons Attribution (CC BY) license.