Article

Impacts of a Toll Information Sign and Toll Lane Configuration on Queue Length and Collision Risk at a Toll Plaza with a High Percentage of Heavy Vehicles

Department of Civil and Environmental Engineering, University of Windsor, Windsor, ON N9B 3P4, Canada
*
Author to whom correspondence should be addressed.
Vehicles 2024, 6(3), 1249-1267; https://doi.org/10.3390/vehicles6030059
Submission received: 9 June 2024 / Revised: 13 July 2024 / Accepted: 20 July 2024 / Published: 23 July 2024
(This article belongs to the Special Issue Emerging Transportation Safety and Operations: Practical Perspectives)

Abstract

:
This study assessed the impacts of a toll information sign with different toll lane configurations on queue length and collision risk at a toll plaza with an estimated high percentage of heavy vehicles (HVs). The toll information sign displays information about different toll payment methods for cars and HVs upstream of the toll booth. The impacts were assessed for the toll plaza of the Gordie Howe International Bridge under construction at the Windsor–Detroit international border crossing using a traffic simulation model. Results show that the toll information sign upstream of the toll plaza and converting the toll lanes with multiple toll payment methods to electronic toll collection (ETC)-only lanes reduced queue length and collision risk. However, increasing the number of HV-only lanes for a higher percentage of HVs increased lane-change collision risk. Thus, it is recommended that toll lane configurations be changed based on the percentage of HVs to reduce collision risk at a toll plaza.

1. Introduction

Toll plazas are a critical component of a roadway system for capital financing and ongoing infrastructure maintenance revenue. Although toll plazas have been designed and constructed for a long time, there are no widely accepted design standards for toll plaza uniformity or safety. Due to a lack of standards, there is a growing concern about safety at toll plazas. For instance, some crashes have occurred on toll roads in Canada. They were mostly high-speed-related crashes and lane-change-related crashes at toll plazas which caused death and injury.
According to the U.S. National Traffic Safety Board, toll plazas are the most dangerous locations on highways. In 2006, 49% of crashes on expressways in Illinois occurred at toll plazas and the fatality of these crashes was three times higher than the fatality of crashes on the rest of the expressways [1]. In addition, 30% of crashes on the Pennsylvania Turnpike and 38% of crashes on New Jersey toll highways occurred at toll plazas [1]. A noticeable increase in the number of crashes at toll plazas, particularly upstream of toll plazas, has generated the need to study drivers’ behavior as drivers approach toll plazas [2].
To reduce the delay at toll plazas, new tolling technologies such as electronic toll collection (ETC) have been in operation at toll plazas. ETC is an automated system that allows drivers to pay tolls without stopping. ETC consists of a transponder placed inside the vehicle and is activated when the vehicle passes a roadside sensor at the toll booth [3]. ETC has numerous benefits such as lower transaction time, improved throughput, and reduced air pollution and fuel consumption [4]. However, some drivers still manually pay tolls using cash or credit cards. These drivers may be distracted when they search for cash or cards and take time to change to toll lanes which accept manual payment. These behaviors affect drivers’ perception and reaction time, and consequently road safety [5]. Moreover, when there are both ETC and manual toll collection lanes in the toll plaza, drivers are more likely to abruptly change lanes to select the toll lane of their preference.
In this regard, a toll information sign that displays toll lane configurations (e.g., the method of toll payment and the type of vehicle) ahead of the toll plaza can help drivers prepare to move to the correct lane or path to the open toll booths with their preferred payment method. Thus, it is important to examine whether the toll information signs can help drivers choose the toll lane of their preference in advance and avoid abrupt speed reductions and lane changes near the toll booth, which disrupt traffic flow and increase collision risk [6].
In particular, the toll information signs and toll lane configuration might have differential effects on traffic performance and safety when the percentage of heavy vehicles (HVs) is high. Since HVs are longer in length and have lower speed and acceleration than cars, car drivers are more likely to change lanes to avoid following HVs while trying to choose toll lanes with shorter queue lengths (e.g., toll lanes with a lower number of HVs). However, there is a lack of studies on the impacts of toll information signs and toll lane configurations on traffic performance and the conflicts between cars and HVs at toll plazas with a high percentage of HVs.
To fill this research gap, this study analyzes the movements of cars and HVs at a toll plaza with toll information signs at different locations and different toll lane configurations. This study also predicts lane-change collision risk by the type of lane-changing vehicle and trailing vehicle in the target lane (car and HV) to investigate the impact on the severity of conflicts. This study could contribute to the development of operational strategies of a toll plaza to improve efficiency and safety based on the varying traffic demands of cars and HVs. Thus, the objective of this study is to assess the impacts of toll information signs and toll lane configuration on the queue length and collision risk at a toll plaza with various toll payment methods.

2. Literature Review

This section reviews the past studies on the impacts of toll information systems and toll lane configuration on lane changes, collisions, the risk of collision, and traffic performance, and describes their research gaps.

2.1. Impacts on Lane Changes

Past studies assessed the impact of static and variable toll information signs on lane changes at a toll plaza. For instance, Valdés et al. [5] found that showing the manual toll collection (MTC) and ETC lanes in overhead static signs at a toll plaza in Puerto Rico allowed smoother lane changes and reduced the number of lane changes at lower speeds. Saad et al. [7] assessed how real-time information for ramp traffic provided via a portable variable message sign (VMS) affected driver behavior at a toll plaza using a driving simulator. They found that VMS effectively kept the vehicles from the on-ramp to the toll plaza in the rightmost lane and reduced lane changing before the toll plaza.

2.2. Impacts on Collisions

Several studies assessed the safety of toll plazas using historical crash data. For instance, Abdelwahab and Abdel-Aty [2] studied traffic safety at toll plazas using the 1999 and 2000 traffic crash reports of the Central Florida expressway system. The results showed that vehicles equipped with ETC devices, especially trucks, were more likely to be involved in crashes at the toll plaza than vehicles without ETC devices. This is potentially because ETC users cannot avoid crashes when ETC lanes are blocked by non-ETC users, while they do not anticipate that they should reduce speed or stop at the toll booth. The study also found that ETC users are more likely to be severely injured than non-ETC users. Abuzwidah and Abdel-Aty [8] found that the risk of crashes was 19% higher for ETC lanes in the mainline and separate manual toll collection lanes to the side than manual toll collection on the mainline and separate ETC lanes to the side. Chakraborty et al. [9] reported that converting Hybrid Toll Plazas to an All-Electronic Toll Collection system considerably reduced the number of crashes.

2.3. Impacts on Risk of Collision

Some researchers analyzed the safety of toll plazas based on the risk of collision predicted using vehicle trajectories and surrogate safety measures. For instance, Xing et al. [10] investigated traffic conflicts in the upstream diverging area of a toll plaza using trajectory data extracted from unmanned aerial vehicle (UAV) videos and extended time-to-collision (TTC). They found that a mix of vehicles with different toll payment methods (MTC and ETC) increased collision risk upstream of the toll plaza. Jehad et al. [11] also assessed the safety impacts of different toll lane configurations on collision risk using trajectory data from a VISSIM simulation and a Surrogate Safety Assessment Model (SSAM). They found that all ETC lanes were safer than toll lane configurations with different toll payment methods because they showed the lowest number of crossing and lane-changing conflicts.

2.4. Impacts on Traffic Performance

Past studies analyzed the impacts of toll plaza configurations on traffic performance. McKinnon [12] found from VISSIM simulation results that toll lanes with multiple forms of toll payment helped disperse traffic demand during peak hours. However, accepting both manual and electronic payment degraded the level of service and increased delays for all drivers. Moreover, drivers were sensitive to slower-moving vehicles and tried to avoid queued HVs in both cash and ETC lanes. Bains et al. [13] also found from VISSIM simulation results that separate lanes for cars and HVs decreased throughput volume and increased queue length at toll plazas. Although the separation of HVs from cars is generally expected to reduce conflicts between different vehicle types and improve traffic performance, this benefit was not observed due to the high volume of cars in the studied toll plaza. Moreover, it was found that traffic volumes and types of toll service affected traffic operations at the toll plaza [14]. Mittal and Sharma [15] found from VISSIM simulation results that queue length more significantly increased as the traffic volume increased for MTC lanes than ETC lanes. However, the difference in queue length between MTC and ETC lanes was relatively smaller for HVs. Bari et al. [16] also found from VISSIM simulations that an ETC system reduced the queue delay by up to 95% compared to an MTC system as the percentage of HVs increased from 25% to 45% at a toll plaza in India. However, this study did not consider the difference in service time between cars and HVs in the simulation. Moreover, the study only calibrated differences in car-following behavior between cars and HVs in the simulation, not lane-changing behavior.

2.5. Research Gaps

In summary, these studies did not explicitly consider differences in both car-following and lane-changing behaviors between cars and HVs for evaluating the impacts of toll information signs and lane configuration. Since the percentage of HVs is generally high at toll plazas on freeways, it is important to consider the interactions between cars and HVs while they approach toll booths and their impacts on the queue length at different toll lanes and the conflicts between cars and HVs. Moreover, although microsimulation models can be used for testing various traffic conditions at a toll plaza, these past simulation-based studies did not examine the effects of the varying demand of HV traffic on the effectiveness of toll information signs and toll lane configuration in reducing conflicts and delay. Thus, this study will use a simulation-based approach to reflect the differences in behaviors between cars and HVs, and extensively analyze the effects of HVs on performance and safety in various operational strategies regarding toll information signs and toll lane configurations.

3. Methods and Data

3.1. Description of Data

In this study, the impacts of toll information signs on traffic performance and safety were assessed for the toll plaza at the Gordie Howe International Bridge between Windsor, Ontario, Canada and Detroit, Michigan, USA. The Gordie Howe International Bridge is a cable-stayed international bridge across the Detroit River and the bridge is currently under construction. The preliminary design plans, including preliminary drawings of the design layout of the toll plaza for both Canada-bound and U.S.-bound bridges, were provided by the Windsor-Detroit Bridge Authority (WDBA) in 2021. The preliminary design plans for the Canada-bound toll plaza propose a four-lane entry road for passenger cars and a three-lane entry road for heavy vehicles upstream of the toll plaza, and these entry roads merge to the toll lane as shown in Figure 1 and Figure 2. The distance between the merge point and the entry gate of the toll plaza is 160 m. The entry gate is located 75 m upstream of the toll booth. The entry gate will be closed only when the toll booth is closed due to low traffic volume. These details are subject to change.
According to the WDBA, it is anticipated that the following three methods of toll payment will be accepted at the tollbooth: (1) Manual toll collection (MTC)—payment in cash, (2) Electronic toll collection (ETC)—payment with a transponder, and (3) Automatic toll collection (ATC)—non-cash payment without a transponder (e.g., credit card). In the case of ETC, as the toll payment is processed via wireless communication between a transponder and the toll booth, vehicles can pass through the toll booth without reducing their speed or stopping. In each toll lane, only specific toll payment methods (e.g., ETC and ATC only) or all toll payment methods will be accepted.
A proposed lane assignment scenario (subject to change) including eight toll lanes with the assigned payment method and type of vehicle at the Canada-bound toll plaza is shown in Figure 3. The same lane configuration scenario is also proposed for the U.S.-bound toll plaza. The lane number starts from the innermost lane. Lanes 1–3 are only open to cars whereas Lanes 7–8 are only open to HVs for all toll payment methods. Lanes 4 and 5 are only open to ETC and ATC for both cars and HVs, where the presence of toll collectors is not required. Only Lane 6 is open to all vehicles and all toll payment methods.

3.2. VISSIM Traffic Simulation

As the Gordie Howe International Bridge is currently under construction, there is no observed traffic data for the toll plaza on the bridge. Thus, the VISSIM microscopic traffic simulation model [18] was used to replicate traffic at the bridge toll plaza with the proposed toll lane configuration shown in Figure 3. Among different microsimulation models, the VISSIM model was selected because the model is an effective tool to assess the operation at toll plazas [13] and it has been used to simulate vehicle movements at a toll plaza in previous studies [11,12,14,15,16]. The VISSIM model was used to predict the changes in driver behavior due to the toll information sign and assess the impacts of the sign on queue length and collision risk. The VISSIM model was developed as follows.
A VISSIM road network consists of various links, stop signs at the toll booth, and reduced speed areas. In the reduced speed areas, vehicles reduce their speed to 5 km/h after passing the entry gate and then stop at the toll booth. Peak-hour traffic demand of 300 cars and 300 HVs was used based on the assumption that 10% of total daily traffic volume, i.e., the forecasted daily traffic demand of approximately 3000 cars and 3000 HVs in 2025 according to the 2018 border crossing origin-destination surveys [19], occurs during the peak hour.
Service time is the time during which a vehicle pays a toll at the tollbooth and exits from the toll plaza, not including the waiting time in the queue. The actual service time depends on the method of toll payment. First, the service time for MTC is generally longer than ATC because of the longer transaction time for cash payments compared to non-cash payments. Bari et al. [16] observed that the median service time for MTC vehicles was about 12 s. Wang et al. [20] also found that the mean service times for cars and HVs in MTC lanes were about 11 s and 15 s, respectively, at a toll plaza in China. Similarly, Al-Deek et al. [21] found that the service time was relatively longer for HVs than cars (about 2 s) because HVs accelerate more slowly than cars after toll payment.
Second, the variability of service time is larger for MTC than ATC because the service time varies with the toll collector’s experience [22]. Therefore, a higher standard deviation was assumed for the service time of manual payments. Traffic congestion also affects the service time because when toll collectors are under greater pressure from a growing queue, they tend to process transactions faster [21]. Thus, the service time for MTC will be shorter in peak hours than off-peak hours.
Based on these observed service times from past studies, the service times were determined for MTC and ATC for cars and HVs as follows: Mean service times for MTC and ATC for cars are 10 s (standard deviation (SD) = 10 s) and 5 s (SD = 5 s), respectively, and mean service time for MTC and ATC for HVs are 12 s (SD = 10 s) and 7 s (SD = 5 s), respectively. The distribution of service time was assumed to be normal distribution and the ranges of service time were generated by VISSIM.
Different proportions of toll payment methods were also assumed for cars and HVs. For HVs, a significantly higher proportion of electronic toll payments (80%) compared to manual and automatic toll payments (10% and 10%, respectively) was assumed because they are more likely to be equipped with transponders due to the law—HVs without a valid transponder are charged under the Highway Traffic Act [23]. In addition, according to the 2008 survey study for the new Windsor–Detroit border crossing, car drivers considered electronic toll payments without stopping at a toll plaza less important than HV drivers [24]. This is potentially because car drivers generally use the toll plaza less frequently than HV drivers. Due to the lower likelihood of electronic toll payments by car drivers than HV drivers and a similar likelihood of manual and automatic toll payments by car drivers, the proportions of manual, automatic, and electronic toll payments were assumed to be the same (33%).
Proportions of toll lane use for different toll payment methods were assumed for cars and HVs separately. It was assumed that cars and HVs are more likely to use the toll lanes that are exclusively open to cars and HVs, respectively—Lanes 1, 2, and 3 for cars and Lanes 7 and 8 for HVs. In the case of manual toll payments, this tendency is particularly higher for cars than HVs because car drivers are less likely to choose the toll lane with a higher proportion of HVs [16] or a higher number of large vehicles [25]. Thus, the proportions of toll lane use for cars and HVs with different toll payment methods were determined, as shown in Table 1.
To restrict each vehicle type (i.e., car or HV with specific toll payment methods) to using only the above-designated toll lanes, the vehicle routes for each vehicle type were separately created in VISSIM. To reflect the fact that drivers are more likely to choose the toll lane with a shorter queue length to reduce waiting time, the “queue counter” was placed at each toll booth in VISSIM. This allows drivers to compare the queue length among different toll lanes and choose the lane with the shortest queue length. This reflects drivers’ actual lane choice behavior at toll plazas in the real world—they are more likely to choose the toll lane with a shorter queue length, as observed in past studies [24,25,26].
As the real-world behaviors of drivers at the bridge could not be observed, the existing calibrated VISSIM driving behavior parameters (car-following and lane-changing) from previous studies were used. A set of 10 car-following parameters calibrated using the observed vehicle trajectories from the US-101 freeway in California [27] and a set of nine calibrated lane-changing parameters [28] were used, as shown in Table 2. The description of each parameter is also shown in Table 2. Note that the car-following parameters (CC0-CC9) are the parameters used in the Wiedemann 99 car-following model. In particular, these car-following parameters were separately set for cars and HVs to reflect the difference in their car-following behaviors. For instance, HVs maintained longer distances from the lead vehicle and applied lower acceleration and deceleration during car-following compared to cars [27].
The same range of desired speed distribution (48–58 km/h) was used for both cars and HVs as they were required to substantially reduce their speed when approaching the toll plaza. However, different default desired acceleration/deceleration functions were used for cars and HVs. Default functions were used since the functions could not be calibrated using the observed data. Similarly, default values were used for all other VISSIM parameters (e.g., vehicle models).
Considering drivers’ workload for comprehending information and making decisions, it is recommended that the toll information sign be located within a half-mile (805 m) of the toll plaza [5]. Thus, to determine candidate locations for the toll information sign, it is important to ensure that drivers have enough time to decide which tollbooth or toll lane they want to use after they see messages and before they arrive at the tollbooth [7].
To evaluate the impacts of toll information signs and toll lane configurations on traffic performance and safety, three simulation experiments were conducted as shown in Figure 4. First, in Experiment 1, the impacts of the presence and location of the toll information sign were assessed for the current proposed toll lane configuration and traffic demand. With the best scenario found in Experiment 1, the impacts of alternative toll lane configurations for the current traffic demand were assessed in Experiment 2 and the impacts of alternative toll lane configuration for different percentages of HVs were assessed in Experiment 3. Different toll lane configurations were considered because of potential safety problems with the proposed toll lane configuration. For instance, as Lane 6 is open to all vehicles with all toll payment methods, it may increase conflicts between cars and HVs. In addition, Lanes 4 and 5 are open to both ETC and ATC vehicles, although ETC vehicles are not required to stop, unlike ATC vehicles. Moreover, ATC vehicles are not likely to use the innermost and outermost toll lanes (Lanes 1 and 8, respectively) because many lanes near the center of the road are open to ATC vehicles.
In Experiment 1, three scenarios (Scenario 1-1: No sign, Scenario 1-2: Sign 140 m from the entry gate, and Scenario 1-3: Separate signs for cars and HVs 75 m before the merge point) were compared, as shown in Figure 5. The purpose of this comparison is to assess whether placing the sign further upstream of the toll plaza and providing toll information in advance can reduce delays and improve the safety of the toll plaza. In the case of no sign, it was assumed that drivers could only see the toll lane sign at each toll booth and choose the toll lane 40 m before the entry gate. To reflect driver reactions to the sign in different locations, the locations of “route decision points” were changed in different scenarios. Although the drivers can see the sign before the location of the sign, in reality, it takes time to understand the messages on the sign and choose the toll lane [29]. Thus, it was assumed that drivers made route decisions at the location of the sign in this study. It was also assumed that all drivers can see the sign and choose the toll lane accordingly, although some drivers may not see the sign or may not choose the toll lane based on the sign even if they see the sign. However, due to uncertainty regarding the proportion of these drivers, this effect was not considered in the simulation.
In Experiment 2, the following two alternative toll lane configurations—(1) Scenario 2-1: Convert Lanes 4 to 6 to ETC-only lanes and (2) Scenario 2-2: Convert Lanes 1 and 8 to MTC/ETC-only lanes—were compared with the best scenario in Experiment 1 (Base case), as shown in Figure 6. The toll lane configuration in Scenario 2-1 can reduce the delay more effectively as ETC vehicles do not have to stop at the toll booth and they can pass through the toll plaza without having to wait behind the lead MTC or ATC vehicles. It was assumed that 70% of ETC cars and 80% of ETC trucks will use ETC-only lanes. The toll lane configuration in Scenario 2-2 provides a higher number of lanes for MTC and ETC vehicles since the traffic demand for ATC vehicles is not much higher than ETC vehicles.
In Experiment 3, the impact of converting Lane 6 to an HV-only lane was assessed for two different percentages of HVs (60% and 70%), which are higher than the current percentage of HVs (50%), as shown in Figure 7. The following scenarios were tested: Scenario 3-1: Current toll lane configuration for 60% HVs, Scenario 3-2: Convert Lane 6 to an HV-only lane for 60% HVs, Scenario 3-3: Current toll lane configuration for 70% HVs, and Scenario 3-4: Convert Lane 6 to an HV-only lane for 70% HVs. These scenarios were compared because the number of HVs on the bridge is expected to increase faster than the number of cars by the year 2040 according to the forecasted travel demand provided by the 2018 border crossing origin-destination surveys [19].
Each simulation scenario was run five times to consider random variations in the results. The input and output data of the VISSIM model are summarized in Table 3.

3.3. Estimation of Collision Risk

The results from the above scenarios were compared in terms of queue length and collision risk. Individual vehicle trajectories from VISSIM and surrogate safety measures were used to determine two types of collision risk: (1) rear-end collision risk and (2) lane-change collision risk. First, rear-end collision risk was estimated using Time-to-collision (TTC) [30] during car-following conditions. TTC is the minimum time for the following vehicle to reach the position of the lead vehicle with the initial constant speed at the time instant when the following vehicle begins braking to avoid collision with the lead vehicle. TTC is calculated using the following equation:
TTC ( t ) = S i ( t ) V i ( t ) V i 1 ( t ) ,           i f   V i ( t ) V i 1 ( t )
where Si(t) is the spacing between the rear of the lead vehicle i − 1 and the front of the following vehicle i at time t, and Vi(t) and Vi−1(t) = speed of the following vehicle i and the lead vehicle i − 1, respectively, at time t. A lower value of TTC indicates a higher rear-end collision risk.
Lane-change collision risk was estimated using surrogate safety measures developed by Wang and Stamatiadis [31] called the “Aggregate Conflict Propensity Metric (ACPM)”. The ACPM assumes that lane-change conflicts may lead to a sideswipe collision or a rear-end collision. For instance, the Required Braking Rate (RBR) to avoid a sideswipe collision during lane changes (RBRLC-SS) is calculated using the following equation:
R B R L C - S S = 2 V 2 l 1 V 1 + l 2 l 1 × c o s θ w 1 s i n θ w 2 t a n θ T T C + l 1 V 1 x 2
where TTC = time to collision, x = reaction time of driver, V2 = speed of the trailing vehicle in the target lane, V1 = speed of the lane-changing vehicle, l2 = length of the trailing vehicle in the target lane, l1 = length of the lane-changing vehicle, w2 = width of the trailing vehicle in the target lane, w1 = width of the lane changing-vehicle, and θ = the conflict angle, which is illustrated in Figure 8.
The RBR to avoid a rear-end collision during lane changes (RBRLC-RE) is calculated as follows:
R B R L C - R E = V 2 V 1 2 2 V 2 × ( T T C x ) + V 1 × x + w 1 2 s i n θ + w 2 2 t a n θ + ( l 1 c o s θ l 2 ) 2 l 1  
The ACPM predicts that a sideswipe crash will occur if the RBRLC-SS is greater than the Maximum Available Braking Rate (MABR) of a given vehicle. The model also predicts that a rear-end crash will occur if the RBRLC-RE is greater than the MABR and RBRLC-SS. The predicted conflicts by the ACPM were compared with annual crash frequencies by type (crossing, rear-end, and lane-change). A higher value of RBR indicates higher lane-change collision risk.
It was found that the predicted conflicts by the ACPM were strongly correlated with annual crash frequencies by type (crossing, rear-end, and lane-change) [31]. Thus, the ACPM is a reliable surrogate safety measure that can accurately predict the number of actual crashes by type. In this study, the conflict angle was assumed to be 45 degrees given that the range of conflict angles for lane-changing conflicts is 30 to 85 degrees [32]. The reaction time of the driver was assumed to be 2 s because the range of perception–reaction times for various types of highways was 1.5 to 3 s in past studies [33]. The length and width of cars were assumed to be 4 m and 2 m, respectively, and the length and width of HVs were assumed to be 10 m and 2.5 m, respectively.

4. Results and Discussion

VISSIM simulations were run for the three experiments. For each experiment, the averages of the values from five simulation runs were calculated for each scenario. The results for the three experiments are presented and discussed as follows.

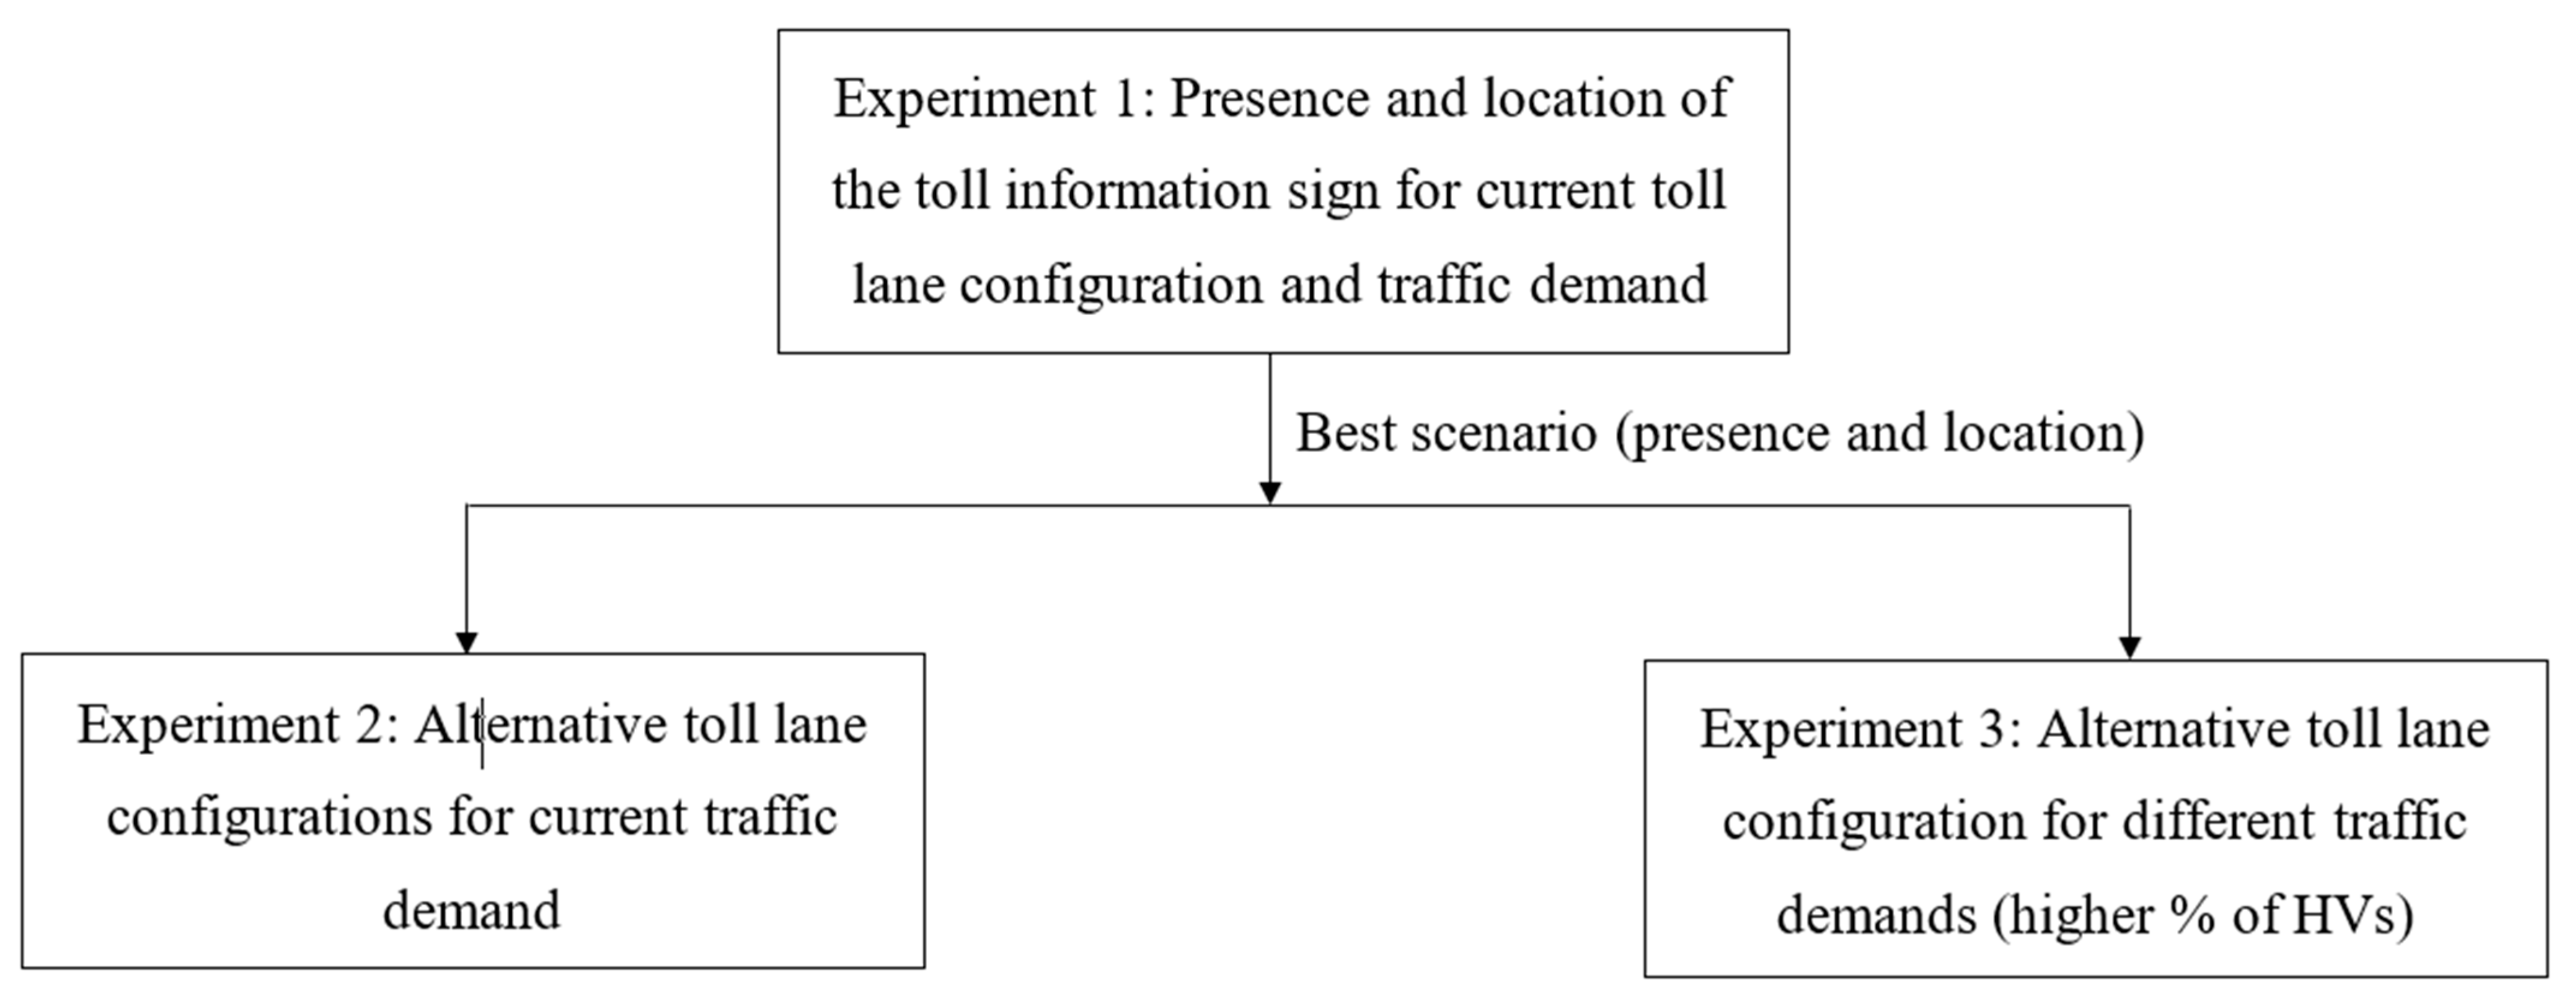
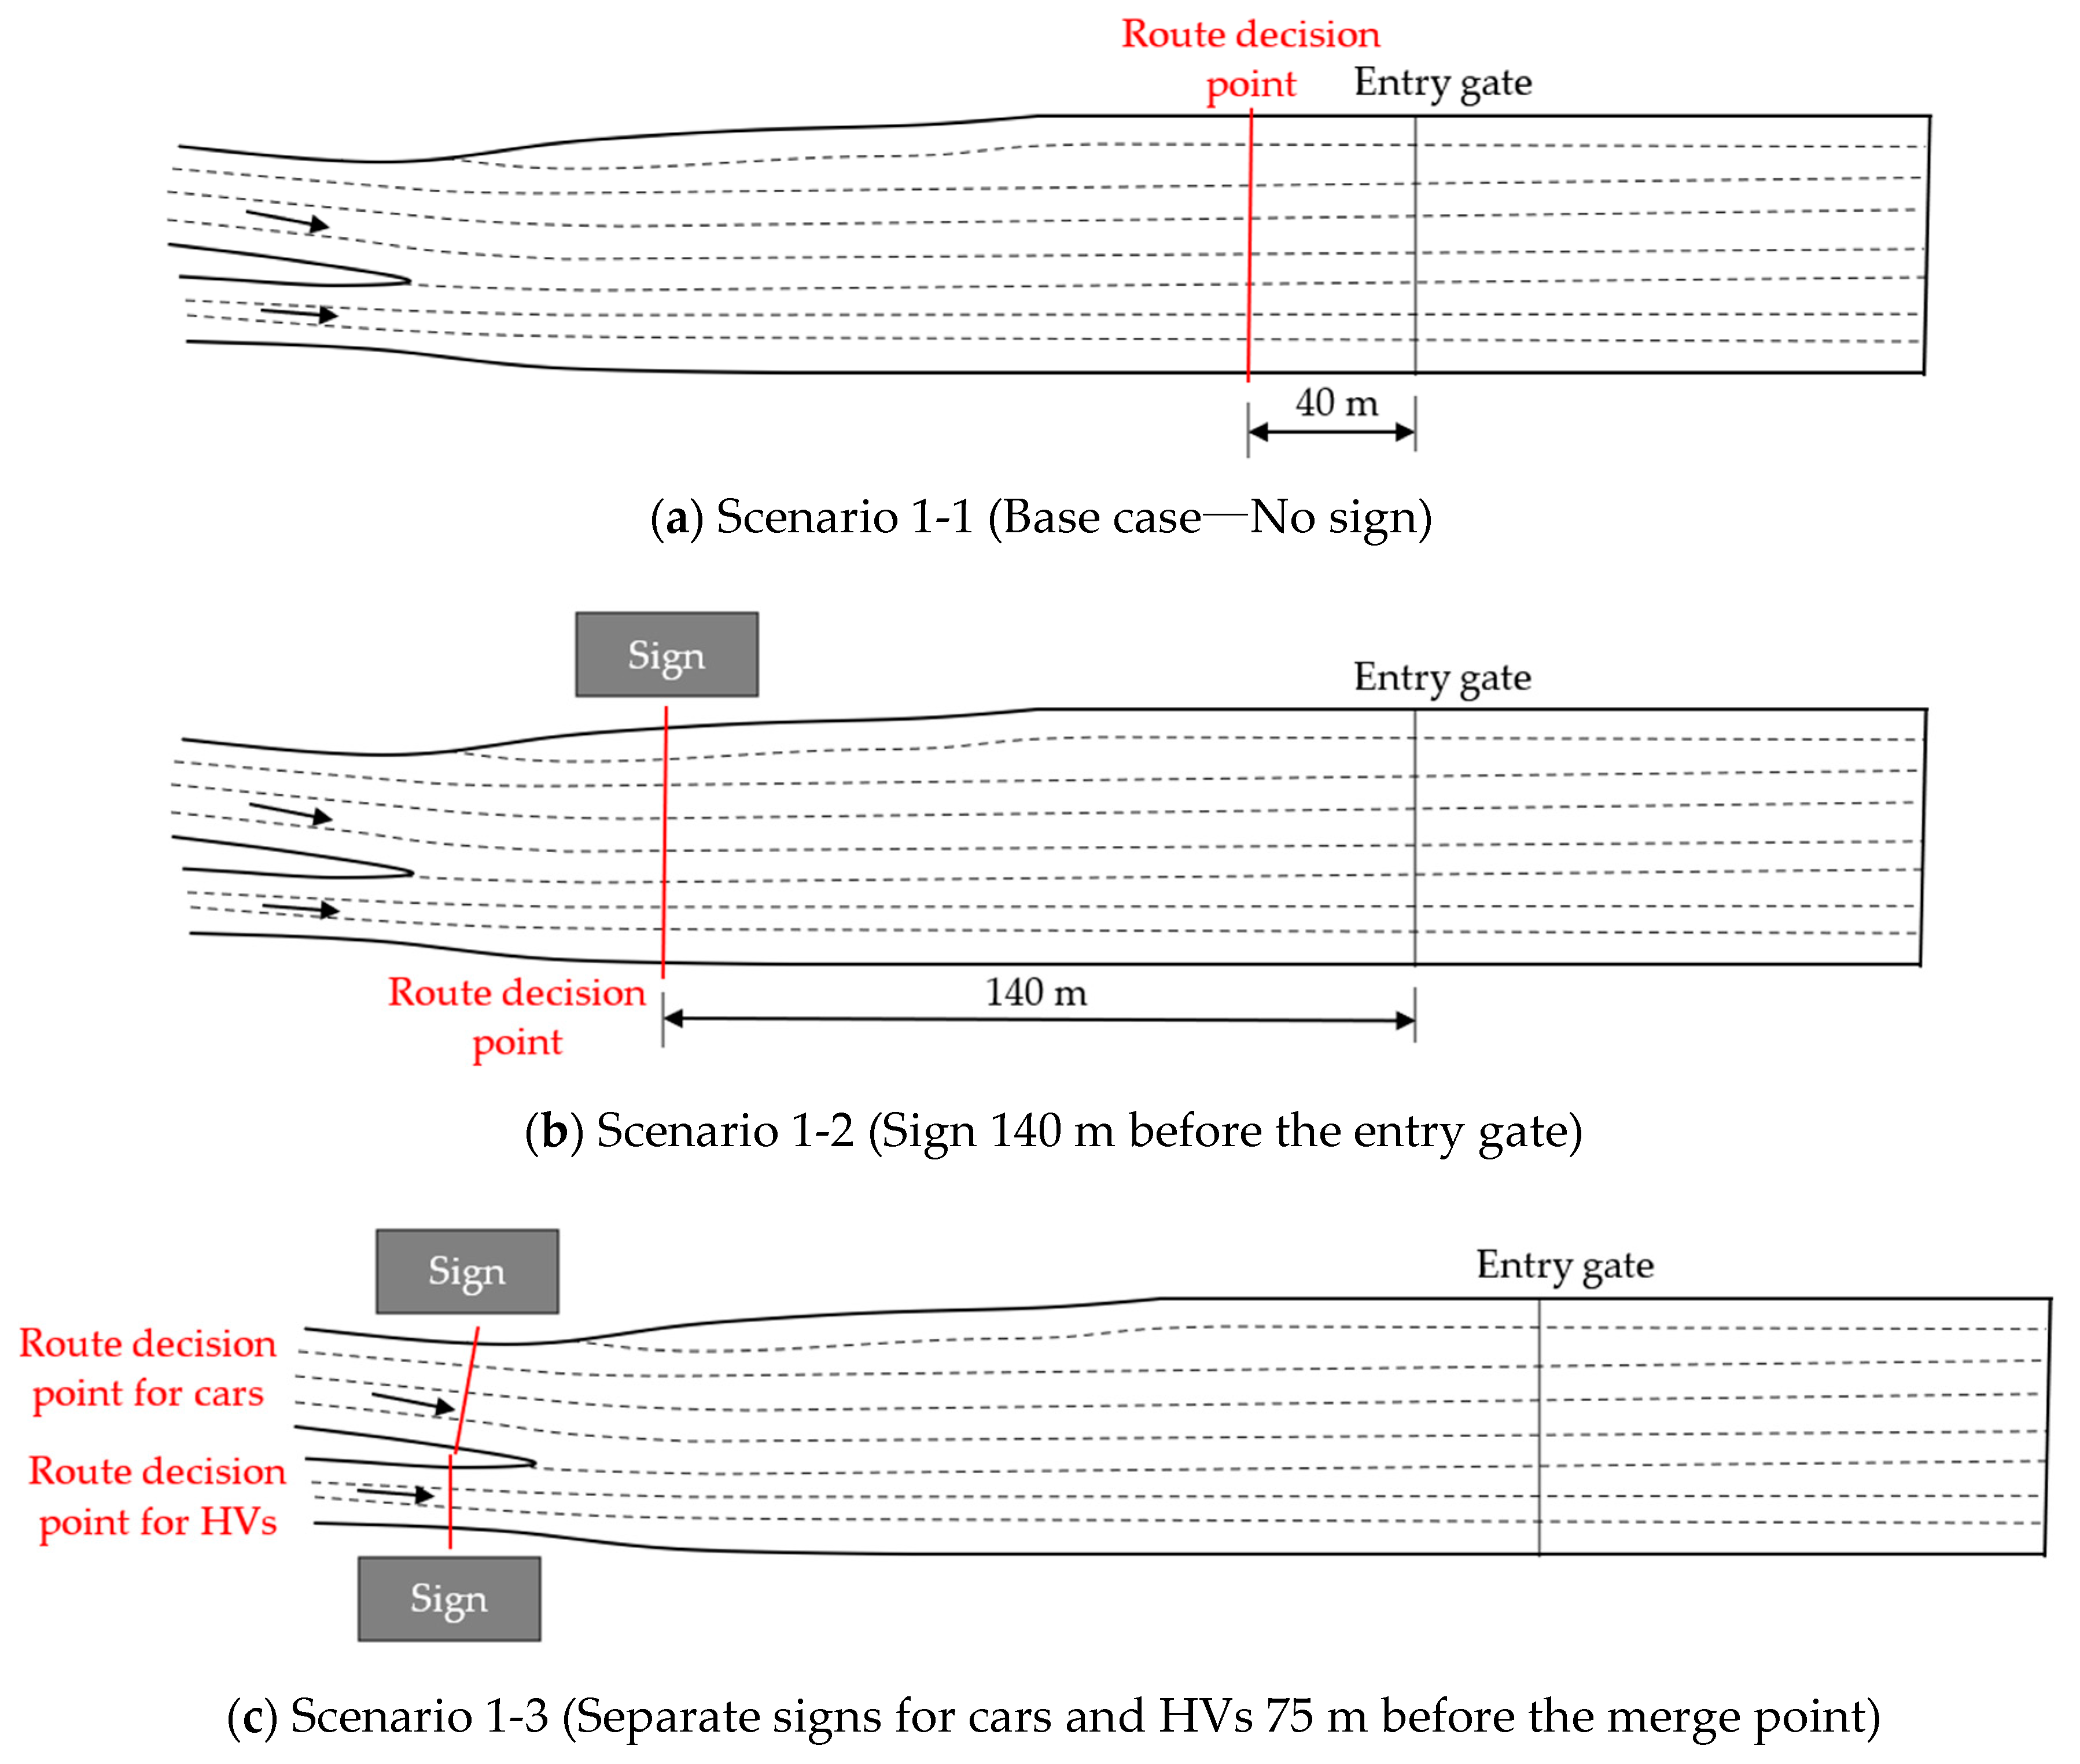
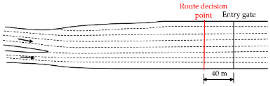
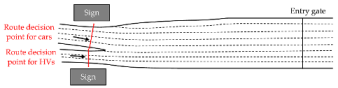
4.1. Experiment 1—Impacts of the Presence and Location of the Toll Information Sign

Average queue length and maximum queue length for the entire road network were compared among the three scenarios, as shown in Table 4a. The table shows that Scenario 1-3 (separate signs for cars and HVs 75 m before the merge point) had a shorter average queue length than the other two scenarios for all toll lanes, which resulted in less delay.
Table 4b shows that Scenarios 1-2 and 1-3 had longer average TTCs than Scenario 1-1 in most lanes (lanes 3, 4, 5, 6, and 7). This indicates that the toll information sign can reduce rear-end collision risk. Table 4c shows that Scenarios 1-2 and 1-3 had lower average RBRs to avoid sideswipe collisions and rear-end collisions during lane changes than Scenario 1-1.
The RBR was also compared for the following four types of lane-changing vehicles and trailing vehicles in the target lane: (1) Car–Car: lane-changing car and trailing car, (2) Car–HV: lane-changing car and trailing HV, (3) HV–Car: lane-changing HV and trailing car, and (4) HV–HV: lane-changing HV and trailing HV. The conflicts between cars and HVs (Car–HV or HV–Car) are considered the more severe conflicts because the impact of a collision between vehicles of different sizes and weights on the vehicle body is generally higher. In particular, a Car–HV collision is more severe than an HV–Car collision because cars are more likely to be severely damaged when a lead car is hit by a following HV in the rear.
It was found that Scenarios 1-2 and 1-3 generally showed lower RBRs for both sideswipe and rear-end conflicts during lane changes compared to Scenario 1-1 for all vehicle types except Car–Car. This is mainly because the total number of lane changes was lower for Scenarios 1-2 and 1-3 than for Scenario 1-1. As the number of lane changes increases, the risk of lane-change collisions also increases. In particular, Scenarios 1-2 and 1-3 showed much lower RBRs for Car–HV and HV–Car collisions. Thus, the toll information sign is effective in reducing the number of severe conflicts during lane changes.
In summary, Scenario 1-3 showed the benefits of a shorter average queue length and a lower risk of rear-end and lane-change collisions than Scenario 1-1, unlike Scenario 1-2. Thus, separate toll information signs for cars and HVs before the merge point (Scenario 1-3) was selected as the best scenario in this experiment. This indicates that providing information on toll lane configuration further upstream of the toll plaza not only helps drivers’ toll lane choice but also reduces collision risk.

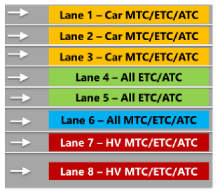
4.2. Experiment 2—Impacts of New Toll Lane Configurations on Estimated Traffic Demand

In this experiment, two new toll lane configuration designs were tested and compared with Scenario 1-3 (Base Case), which was the best scenario in Experiment 1. Table 5a shows that Lanes 1 to 3 and Lane 6 had longer average queue lengths in Scenario 2-1 (Convert Lanes 4 to 6 to ETC-only lanes) and Scenario 2-2 (Convert Lanes 1 and 8 to MTC/ETC-only lanes) than the Base Case. On the other hand, Lanes 4, 5, 7, and 8 had shorter average queue lengths in Scenarios 2-1 and 2-2 than the Base case. Overall, the proposed two toll lane configurations resulted in a more even distribution of queue length across different lanes than the Base case. Similar queue lengths in different toll lanes are more likely to reduce the number of lane changes. This result suggests that the current toll lane configuration needs to be changed to reduce the delay for the estimated traffic demand.
Table 5b also shows that Scenario 2-1 had a longer average TTC than Scenarios 1-3 and 2-2. This indicates that converting Lanes 4 and 6 to ETC-only lanes can more effectively reduce rear-end collision risk for all lanes except Lane 3 compared to the current toll lane configuration and converting Lanes 1 and 8 to MTC/ETC-only lanes.
Table 5c shows that both Scenarios 2-1 and 2-2 had lower RBRs for sideswipe conflict during lane changes than Scenario 1-3. In particular, the RBR for severe sideswipe conflict (i.e., Car–HV and HV–Car) was lower for Scenario 2-1 than Scenario 2-2. This indicates that converting Lanes 4 and 6 to ETC-only lanes can more effectively reduce lane-change collision risk than the current toll lane configuration and converting Lanes 1 and 8 to MTC/ETC-only lanes. However, both new toll lane configurations increased the average RBR for rear-end conflict during lane changes, although they still reduced the RBR for HV–Car conflicts compared to the current toll lane configuration.
In summary, Scenario 2-1 made the distribution of queue length across toll lanes more even and reduced both rear-end and lane-change collision risk (for sideswipe conflict only). This shows that more ETC-only lanes can enhance the safety benefit of the toll information sign by separating ETC vehicles from MTC and ATC vehicles, reducing their conflicts.

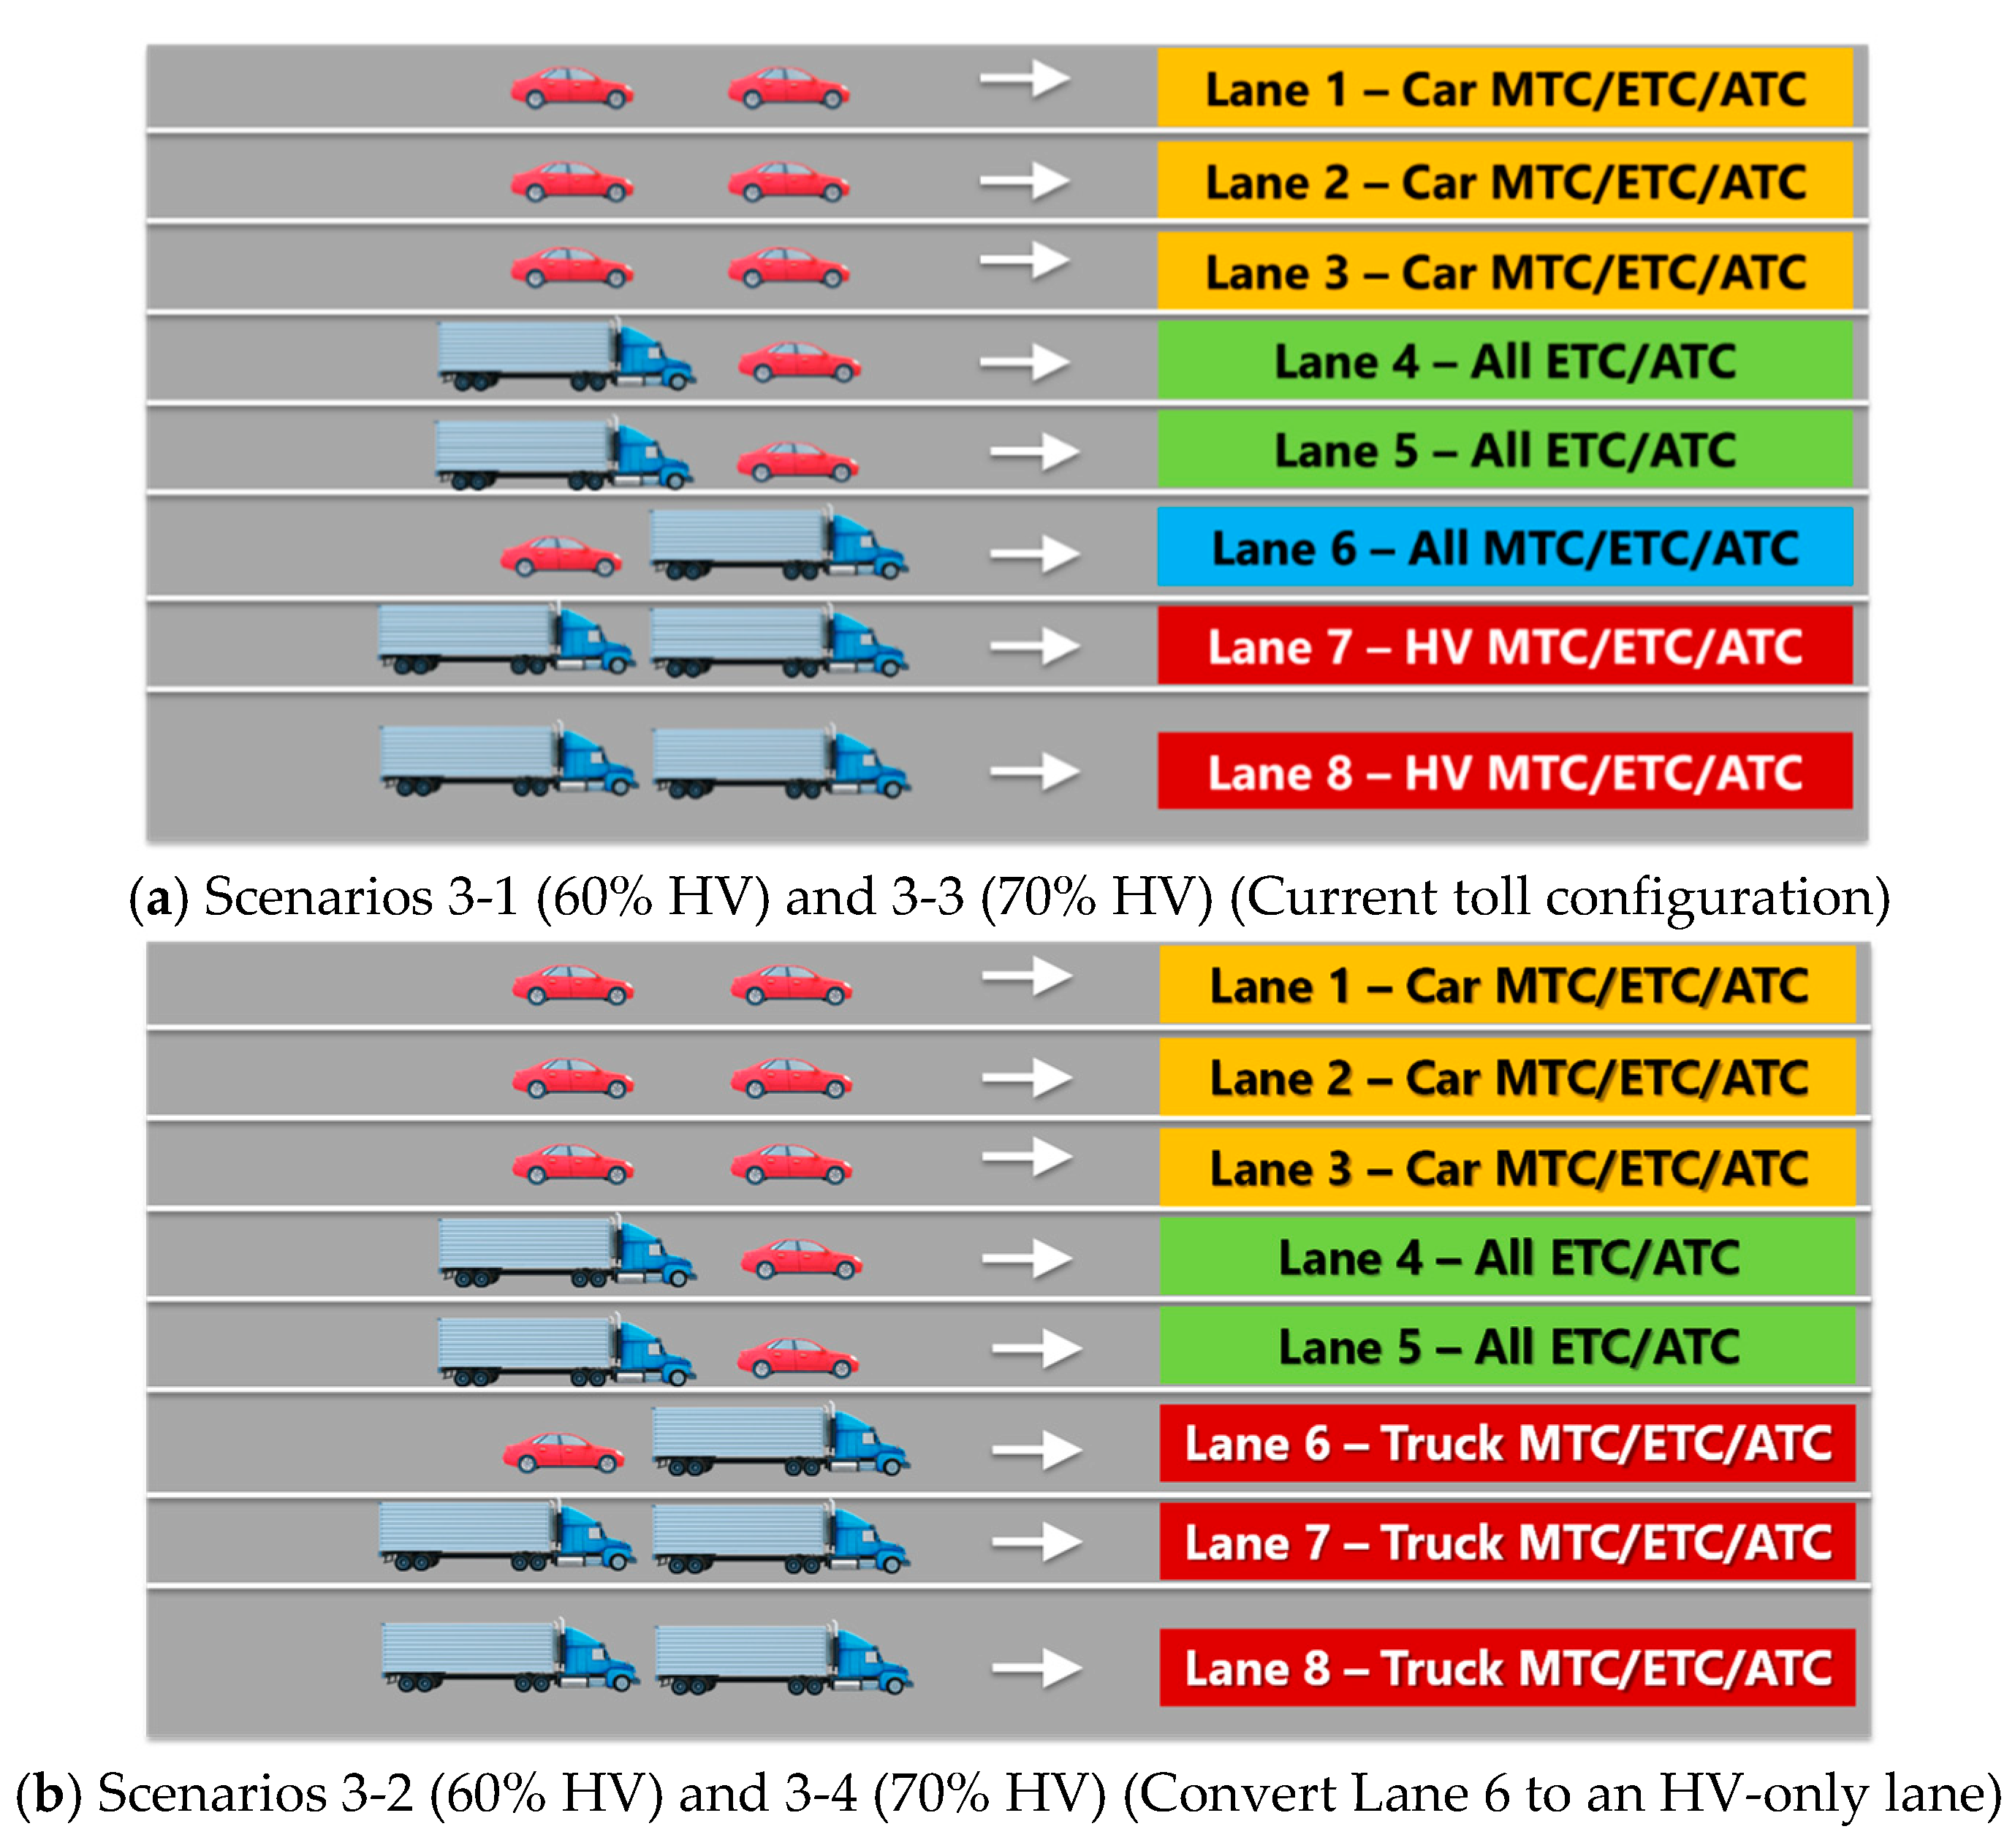
4.3. Experiment 3—Impacts of Current and New Toll Lane Configurations for Different Percentages of HVs

This scenario assessed the impacts of the current and new toll lane configurations with the toll information sign for 60% and 70% HVs, which are higher than the current percentage (50%). In the new toll lane configuration, Lane 6 was converted to an HV-only lane with all toll payment methods to accommodate the higher traffic demand of HVs. Table 6a shows that Lane 6 had a longer average queue length in Scenario 3-2 than in Scenario 3-1 for 60% HVs. Similarly, Mahdi et al. [34] also found that the queue length at a toll plaza increased as the percentage of HVs increased. This is due to higher HV demand for Lane 6 in Scenario 3-2 as this lane was open to only one type of vehicle. The average queue length in the other lanes was similar in the two scenarios. A similar result was found for 70% HVs (Scenarios 3-3 and 3-4). In spite of the longer average queue length in Lane 6, the average delay per vehicle was similar between the current and new toll lane configurations for 60% and 70% HVs.
Table 6b shows that the average TTC for different lanes was similar between Scenarios 3-1 and 3-2 for 60% HVs. However, the average TTC was relatively longer for Scenario 3-4 than Scenario 3-3 for 70% HVs, particularly in HV-only lanes (Lanes 6 to 8). This indicates that opening additional HV-only lanes can reduce rear-end collision risk for a higher percentage of HVs.
Table 6c shows that the average RBR for sideswipe conflict during lane changes was lower for Scenario 3-2 than Scenario 1, particularly for HV–HV conflict, whereas the average RBR for rear-end conflicts was similar between the two scenarios for 60% HV. Thus, converting Lane 6 to an HV-only lane was effective in reducing lane-change collision risk for 60% HVs.
Table 6c also shows that Scenario 3-4 has higher average RBRs for both sideswipe and rear-end conflicts during lane changes than Scenario 3-3 for 70% HVs. In particular, RBRs for HV–Car and HV–HV conflicts were higher for Scenario 3-4 than Scenario 3-3. This indicates that converting Lane 6 to an HV-only lane increased lane-change collision risk for 70% HVs, unlike 60% HVs. This indicates that as the percentage of HVs increases, the number of lane-changing HVs and the risk of lane-change collision with the trailing car or HV in the target lane also increases. Thus, converting Lane 6 to an HV-only lane has mixed effects on severe lane-change conflicts as it reduces the collision risk for Car–HV collisions but increases the collision risk for HV–Car collisions.
In summary, converting Lane 6 to an HV-only lane increased the queue length for higher percentages of HVs than the current toll lane configuration as Lane 6 was closed for cars and more HVs used HV-only lanes. However, converting Lane 6 to an HV-only lane reduced rear-end collision risk but increased lane-change collision risk for higher percentages of HVs. This indicates that opening additional HV-only lanes to accommodate higher HV demand can have a negative effect on queue length and lane-change collision risk.

5. Conclusions and Recommendations

This study investigated the impacts of a toll information sign on queue length and collision risk using preliminary designs and lane configurations for a toll plaza on the Gordie Howe International Bridge—a new bridge under construction at the Windsor–Detroit international border crossing. This study also investigated the impacts of different toll lane configurations with the toll information sign for estimated traffic demand and different percentages of heavy vehicles (HVs). The proposed toll information sign displays the toll lane configuration with different toll payment methods and vehicle types (cars and HVs) upstream of the toll booth. There are three toll payment methods—manual toll collection (MTC), automatic toll collection (ATC), and electronic toll collection (ETC). To evaluate the impacts, the traffic flow at the toll plaza was simulated using VISSIM microscopic traffic simulation. The main findings are summarized as follows:
First, the toll information sign reduced queue length and collision risk at the toll plaza when the sign was located further upstream of the toll plaza. Separate signs for cars and HVs 75 m before the merge point at the Canada-bound bridge led to shorter average queue lengths and lower rear-end and lane-change collision risks than placing the sign after the merge point or closer to the toll booth. In particular, the sign led to a lower risk of collision between lane-changing cars and trailing HVs in the target lane. This indicates that the toll information sign helped drivers make an earlier decision to choose the toll booth with their preferred toll payment methods, avoid abrupt lane changes, and avoid severe lane-change conflicts.
Second, the effectiveness of the toll information sign in distributing queue length across toll lanes more evenly and reducing collision risk was further increased by implementing different toll lane configurations. With the toll information sign, the installation of ETC-only lanes significantly reduced rear-end and lane-change collision risk. This shows that ETC-only lanes not only allow ETC vehicles to pass the toll booth more smoothly without stopping but also decrease risky car-following and lane-change behaviors.
Third, the effectiveness of the toll information sign in reducing the queue length and collision risk varied as the percentage of HVs increased. With the toll information sign, increasing the number of HV-only lanes to accommodate the increased HV traffic demand reduced rear-end collision risk but increased queue length and lane-change collision risk at higher percentages of HVs. This shows that when the toll lane configuration is changed for varying traffic demand, it is important to consider the effects of the change on queue length and collision risk.
This study demonstrates that the toll information sign can potentially reduce the queue length and collision risk, particularly regarding more severe conflicts involving HVs during lane changes, at a toll plaza by helping drivers make earlier route decisions to choose the toll lane. In addition, the toll information sign with changeable toll lane configurations, which accommodate different traffic demands, can improve traffic performance and safety more effectively. In practice, the best toll lane configurations by time of day can be identified based on hourly car and HV traffic patterns and the toll lanes can be adjusted to match the expected demand by time of day, minimizing both rear-end and lane-change collision risk.
However, this study has some limitations. First, only a limited number of scenarios were tested in this study. Thus, more scenarios (different traffic demand for cars and HVs and different toll lane configurations) need to be tested to observe the general pattern of impacts of traffic demand and toll lanes on traffic performance and safety. Second, surrogate safety measures used for the assessment of lane-change collision risk in this study have some limitations such as not considering the trailing vehicles that have lower speed than the lane-changing vehicles. Thus, lane-change collision risk for various lane-change situations needs to be captured using a new surrogate safety measure. Third, as this study only focused on the traffic upstream of the toll booth and immediately after the toll booth, the effect of traffic conditions downstream of the toll booth on drivers’ lane choice was not considered. Lastly, the severity of collisions was evaluated only based on the types of vehicles involved in conflicts (car or HV), not the speeds of vehicles at the time of collision.
In future studies, it is recommended to collect real-world driver behavior data after the bridge is open and use the validated simulation model to evaluate the impacts of the toll information sign on queue length and collision risk. It is also recommended to analyze the effect of drivers’ familiarity with toll lane configuration on their toll lane choice. Since the drivers who regularly or frequently cross the bridge (e.g., commuters) will have better knowledge of the toll lane configuration from their experience, their lane choice behaviors are likely to be different from the other drivers. It is also worth investigating the impacts of car and HV drivers’ different compliance rates with the toll information sign and different HV classes on traffic performance and safety. Lastly, economic analysis is recommended to examine the cost-benefit ratio of implementing the recommended toll information sign and toll lane configuration, including the cost of ETC systems and the economic impact of collisions.

Author Contributions

Conceptualization, F.Z. and C.L.; methodology, F.Z.; software, F.Z.; investigation, F.Z. and C.L.; data curation, F.Z.; formal analysis, F.Z.; writing—original draft, F.Z.; writing—review & editing, C.L.; supervision, C.L.; funding acquisition, C.L. All authors have read and agreed to the published version of the manuscript.

Funding

This research was funded by Natural Sciences and Engineering Research Council of Canada [Grant number: RGPIN-2019-04430].

Data Availability Statement

The primary research data can be accessed upon request.

Acknowledgments

The authors thank Anas Abdulghani for developing the VISSIM simulation model and Windsor-Detroit Bridge Authority (WDBA) for providing the data used in this study.

Conflicts of Interest

The authors declare no conflicts of interest. The funders had no role in the design of the study; in the collection, analyses, or interpretation of data; in the writing of the manuscript; or in the decision to publish the results.

References

  1. National Transportation Safety Board. 2023. Available online: http://www.ntsb.gov (accessed on 22 June 2022).
  2. Abdelwahab, H.T.; Abdel-Aty, M. Artificial neural networks and logit models for traffic safety analysis of toll plazas. Transp. Res. Rec. J. Transp. Res. Board 2022, 1784, 115–125. [Google Scholar] [CrossRef]
  3. Coelho, M.C.; Farias, T.L.; Rouphail, N.M. Measuring and modeling emission effects for toll facilities. Transp. Res. Rec. J. Transp. Res. Board 2005, 1941, 136–144. [Google Scholar] [CrossRef]
  4. Yang, H.; Ozbay, K.; Bartin, B.; Ozturk, O. Assessing the safety effects of removing highway mainline barrier toll plazas. J. Transp. Eng. 2014, 140, 04014038. [Google Scholar] [CrossRef]
  5. Valdés, D.; Colucci, B.; Fisher, D.L.; Ruiz, J.; Colón, E.; García, R. Driving simulation of the safety and operation performance at a freeway toll plaza. Transp. Res. Rec. J. Transp. Res. Board 2016, 2602, 129–137. [Google Scholar] [CrossRef]
  6. Zhang, H.; Zhang, C.; Zhang, Y.; Ma, J.; He, J.; Liu, Z.; Yan, X.; Hong, Q. Calculation model of preposition distance of electronic toll collection signs based on lane changing behavior. MATEC Web Conf. 2020, 325, 01003. [Google Scholar] [CrossRef]
  7. Saad, M.; Abdel-Aty, M.; Lee, J. Analysis of driving behavior at expressway toll plazas. Transp. Res. Part F Traffic Psychol. Behav. 2019, 61, 163–177. [Google Scholar] [CrossRef]
  8. Abuzwidah, M.; Abdel-Aty, M. Crash risk analysis of different designs of toll plazas. Saf. Sci. 2018, 107, 77–84. [Google Scholar] [CrossRef]
  9. Chakraborty, M.; Stapleton, S.Y.; Ghamami, M.; Gates, T.J. Safety effectiveness of all-electronic toll collection systems. Adv. Transp. Stud. 2020, 2, 127–142. [Google Scholar]
  10. Xing, L.; He, J.; Abdel-Aty, M.; Cai, Q.; Li, Y.; Zheng, O. Examining traffic conflicts of upstream toll plaza using vehicles’ trajectory data. Accid. Anal. Prev. 2019, 125, 174–187. [Google Scholar] [CrossRef]
  11. Jehad, A.E.; Ismail, A.; Borhan, M.N.; Ishak, S.Z. Modelling and optimizing of Electronic Toll Collection (ETC) at Malaysian toll plazas using microsimulation models. Int. J. Eng. Technol. 2018, 7, 2304–2308. [Google Scholar] [CrossRef]
  12. McKinnon, I. Operational and Safety-Based Analyses of Varied Toll Lane Configurations. Master’s Thesis, University of Massachusetts, Amherst, MA, USA, 2013. [Google Scholar]
  13. Bains, M.S.; Arkatkar, S.S.; Anbumani, K.S.; Subramaniam, S. Optimizing and modeling tollway operations using microsimulation. Transp. Res. Rec. J. Transp. Res. Board 2017, 2615, 43–54. [Google Scholar] [CrossRef]
  14. Hamid, A.H.A. Simulation of traffic operation and management at Malaysian toll plazas using VISSIM. Malays. Univ. Transp. Res. Forum Conf. 2011, 13–21. [Google Scholar]
  15. Mittal, H.; Sharma, N. Operational optimization of toll plaza queue length using microscopic simulation VISSIM model. J. Algebr. Stat. 2022, 13, 418–425. [Google Scholar]
  16. Bari, C.; Gupta, U.; Chandra, S.; Antoniou, C.; Dhamaniya, A. Examining the effect of the Electronic Toll Collection (ETC) system on queue delay using a microsimulation approach at toll plaza—A case study of Ghoti toll plaza, India. In Proceedings of the 7th IEEE International Conference on Models and Technologies for Intelligent Transportation Systems (MT-ITS), Online, 16–17 June 2021; pp. 1–6. [Google Scholar]
  17. Windsor-Detroit Bridge Authority. Annual Report 2019–2020. 2022. Available online: https://www.gordiehoweinternationalbridge.com/en/corporate-reports (accessed on 22 June 2022).
  18. PTV AG. PTV VISSIM 2021 User Manual; PTV AG: Karlsruhe, Germany, 2021. [Google Scholar]
  19. WSP. Supplemental Travel Demand Modeling Technical Report Gordie Howe International Bridge; Michigan Department of Transportation: Lansing, MI, USA, 2018.
  20. Wang, H.; Zou, F.; Tian, J.; Guo, F.; Cai, Q. Analysis on lane capacity for expressway toll station using toll data. J. Adv. Transp. 2022, 2022, 9277000. [Google Scholar] [CrossRef]
  21. Al-Deek, H.M.; Mohammed, A.; Radwan, A.E. Operational benefits of electronic toll collection: Case study. J. Transp. Eng. 1997, 123, 467–477. [Google Scholar] [CrossRef]
  22. Woo, T.H.; Hoel, L.A. Toll plaza capacity and level of service. Transp. Res. Rec. 1991, 1320, 119–127. [Google Scholar]
  23. 407 Express Toll Route. 407 ETR Heavy Multiple Unit Vehicle Rate Chart. 2022. Available online: https://www.407etr.com/en/tolls/tolls/rate-chart-multi.html (accessed on 22 June 2022).
  24. IBI Group. Traffic and Revenue Forecaster: Windsor Gateway Project Origin-Destination Travel Surveys Summary Report; Transport Canada: Ottwa, ON, Canada, 2008.
  25. Liang, H.; Yang, S.; Pan, B. Probability model of driver’s choice behavior in toll plaza. IOP Conf. Ser. Earth Environ. Sci. 2019, 371, 052051. [Google Scholar] [CrossRef]
  26. Parmar, H.; Chakroborty, P.; Kunduc, D. Modelling automobile drivers toll-lane choice behaviour at a toll plaza using mixed logit model. In Proceedings of the 2nd Conference of Transportation Research Group of India (2nd CTRG), Kolkata, India, 12–15 December 2013. [Google Scholar]
  27. Durrani, U.; Lee, C.; Maoh, H. Calibrating the Wiedemann’s vehicle-following model using mixed vehicle-pair interactions. Transp. Res. Part C Emerg. Technol. 2016, 67, 227–242. [Google Scholar] [CrossRef]
  28. CDM Smith. US 231 Scottsville Road Scoping and Traffic Operations Study. Appendix B: VISSIM Development and Calibration Report; KYTC Item No. 3-8702.00; KKentucky Transportation Cabinet, Division of Planning: Warren County, KY, USA, 2014. [Google Scholar]
  29. Chrysler, S.T.; Williams, A.A.; Fitzpatrick, K. Driver Comprehension of Signing and Marking for Toll Facilities; Report No. FHWA/TX-08/0-5446-2; Texas Transportation Institute, The Texas A&M University System: College Station, TX, USA, 2008. [Google Scholar]
  30. Hydén, C. The Development of a Method for Traffic Safety Evaluation: The Swedish Traffic Conflict Techniques; Lund Institute of Technology, Department of Traffic Planning and Engineering: Lund, Sweden, 1987. [Google Scholar]
  31. Wang, C.; Stamatiadis, N. Surrogate safety measure for simulation-based conflict study. Transp. Res. Rec. J. Transp. Res. Board 2013, 2386, 72–80. [Google Scholar] [CrossRef]
  32. Gettman, D.; Pu, L.; Sayed, T.; Shelby, S. Surrogate Safety Assessment Model and Validation: Final Report; Report No. FHWA-HRT-08-051; Federal Highway Administration: McLean, VA, USA, 2008. [Google Scholar]
  33. Neuman, T.R. New approach to design for stopping sight distance. Transp. Res. Rec. 1989, 1208, 14–22. [Google Scholar]
  34. Mahdi, M.B.; Leong, L.V.; Sadullah, A.F.M. Use of Microscopic Traffic Simulation Software to Determine Heavy-Vehicle Influence on Queue Lengths at Toll Plazas. Arab. J. Sci. Eng. 2019, 44, 7297–7311. [Google Scholar] [CrossRef]
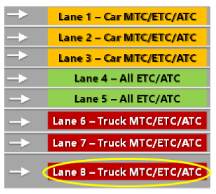
Figure 1. Conceptual design of the toll plaza at the Canada-bound Gordie Howe International Bridge. (Source: Windsor-Detroit Bridge Authority [17]).
Vehicles 06 00059 g001
Figure 2. Schematic drawing of the Canada-bound toll plaza.
Vehicles 06 00059 g002
Figure 3. Current proposed configuration of toll lanes at the Canada-bound toll plaza.
Vehicles 06 00059 g003
Figure 4. Study process of assessing the impacts of the toll information sign and toll lane configurations.
Vehicles 06 00059 g004
Figure 5. Scenarios on the presence and location of toll information signs in Experiment 1.
Vehicles 06 00059 g005
Figure 6. Scenarios of different lane configurations for the current traffic demand in Experiment 2.
Vehicles 06 00059 g006aVehicles 06 00059 g006b
Figure 7. Scenarios of different lane configuration for 60% and 70% HVs in Experiment 3.
Vehicles 06 00059 g007
Figure 8. Conflict angle during lane changes.
Vehicles 06 00059 g008
Table 1. Proportions of toll lane use by vehicle type and toll payment method.
Toll Lane
Car MTC/ETC/ATCAll ETC/ATCAllHV MTC/ETC/ATC
Vehicle Type12345678
MTC Car95%N/A5%N/A
ETC/ATC Car35%60%5%N/A
MTC HVN/AN/A30%70%
ETC/ATC HVN/A40%10%50%
Table 2. VISSIM calibrated parameters.
(a) Car-following parameters (Source: Durrani et al. [27])
Model ParametersUnitCarHeavy Vehicle
CC0m4.154.69
CC1m1.52.7
CC2m11.5814.02
CC3s−4−4.55
CC4m/s−1.65−2.07
CC5m/s1.652.07
CC6m/s11.4411.44
CC7m/s20.090.1
CC8m/s20.490.27
CC9m/s20.450.25
(b) Description of car-following parameters (Source: PTV AG [18])
ParametersDescription
CC0This is the average desired standstill distance between two vehicles and it has no variation.
CC1Time distribution of the speed-dependent part of the desired safety distance. Shows the number and name of the time distribution. Each time distribution may be empirical or normal. Each vehicle has an individual random safety variable which is considered as CC1.
CC2This restricts the distance difference (longitudinal oscillation) or how much further than the desired safety distance a driver allows before he intentionally moves closer to the car in front.
CC3This controls the start of the deceleration process, i.e., the number of seconds before reaching the safety distance. At this stage, the driver recognizes a preceding slower vehicle.
CC4This defines the negative speed difference during the following process. Low values result in a more sensitive driver reaction to the acceleration or deceleration of the preceding vehicle.
CC5This defines the positive speed difference. Enter a positive value for CC5 which corresponds to the negative value of CC4. Low values result in a more sensitive driver reaction to the acceleration or deceleration of the preceding vehicle.
CC6This is the influence of distance on speed oscillation. For value 0, the speed oscillation is independent of the distance and a larger value leads to greater speed oscillation with increasing distance.
CC7This is the oscillation during acceleration.
CC8This is the desired acceleration when starting from a standstill (limited by maximum acceleration defined within the acceleration curves).
CC9This is the desired acceleration at 80 km/h (limited by maximum acceleration defined within the acceleration curves).
(c) Lane-changing parameters (Source: CDM Smith [28])
UnitLane-change vehicleTrailing vehicle in the target lane
Maximum decelerationft/s2−10−8
−1 ft/s2 per distanceft100100
Accepted decelerationft/s2−3.28−3.28
Waiting time before diffusions60
Minimum front-to-rear headwayft1.64
Safety distance reduction factor-0.65
(d) Description of lane-changing parameters (Source: PTV AG [18])
ParametersDescription
Maximum DecelerationThi is the maximum deceleration for changing lanes based on the specified routes for own vehicle overtaking and the trailing vehicle.
Cooperative Lane changingIf vehicle A observes that a leading vehicle B on the adjacent lane wants to change to his lane A, then vehicle A will try to change lanes itself to the next lane in order to facilitate lane changing for vehicle B.
Front-to-rear headwayThis is the minimum distance between two vehicles that must be available after a lane change, so that the change can take place (default value 0.5 m). A lane change during normal traffic flow might require a greater minimum distance between vehicles in order to maintain the speed-dependent safety distance.
Safety distance reduction factorThis parameter concerns the safety distance of the trailing vehicle on the new lane for determining whether a lane change will be carried out, the safety distance of the lane changer itself, and the distance to the preceding, slower lane changer. During the lane change, Vissim reduces the safety distance to the value that results from the following multiplication:Original safety distance × safety distance reduction factorThe default value of 0.6 reduces the safety distance by 40%. Once a lane change is completed, the original safety distance is taken into account again.
Waiting time before diffusionThis period of time is defined as the time a car sits waiting for a gap to change lanes in order to stay on its route before it is removed from the network.
Table 3. VISSIM input and output data.
Input DataOutput Data
  • Demand: 300 cars and 300 HVs for one hour
  • Simulation duration: 1 h
  • Vehicle composition: 50% cars and 50% HVs (base case)
  • Traffic assignment/Route choice model: The VISSIM model assumes that car and HV drivers choose the route with the shortest queue length at toll lanes with their preferred method of toll payment.
  • Average and maximum queue length in each toll lane
  • Individual vehicle trajectories—these were used to calculate surrogate safety measures.
Table 4. Comparison of scenarios in Experiment 1.
Vehicles 06 00059 i001Vehicles 06 00059 i002Vehicles 06 00059 i003
Scenario 1-1
No Sign
Scenario 1-2
Sign 140 m before Gate
Scenario 1-3
Signs 75 m before Merge
(a) Queue length by toll lane
Scenario 1-1Scenario 1-2Scenario 1-3
Toll lanesAverage queue lengthMaximum queue lengthAverage queue lengthToll lanesAverage queue lengthMaximum queue length
Toll lanes14.394.816.8103.512.981.7
Car MTC/ETC/ATC lanes (Lanes 1, 2, 3)35.0108.735.2119.331.9100.7
All ETC/ATC lanes (Lanes 4, 5)7.093.58.296.16.271.8
All MTC/ETC/ATC lanes (Lane 6)27.4113.627.1112.924.1101.4
(b) Average TTC by toll lane (s)
Toll laneScenario 1-1Scenario 1-2Scenario 1-3
Lane 16.66.17.9
Lane 213.512.89.4
Lane 39.414.913.9
Lane 411.512.913.7
Lane 512.512.914.8
Lane 614.318.223.6
Lane 715.823.420.9
Lane 813.412.210.7
Average12.414.814.6
(c) Average required braking rates during lane changes (m/s2)
Lane-changing/trailing vehiclesSideswipe conflictRear-end conflict
Scenario 1-1Scenario 1-2Scenario 2-2Scenario 1-1Scenario 1-2Scenario 2-2
Car–Car0.240.210.260.230.140.27
Car–HV0.640.530.560.440.290.21
HV–HV0.470.260.400.260.280.24
HV–Car0.640.220.481.730.190.34
Average0.380.250.340.450.220.19
Table 5. Comparison of scenarios in Experiment 2.
Vehicles 06 00059 i004Vehicles 06 00059 i005Vehicles 06 00059 i006
Base Case (Scenario 1-3)
Current Toll Lane Configuration
Scenario 2-1
Convert Lanes 4 to 6 to ETC-Only Lanes
Scenario 2-2
Convert Lanes 1 to 8 to MTC/ETC-Only Lanes
(a) Queue length by toll lane
Base case (Scenario 1-3)Scenario 2-1Scenario 2-2
Toll lanesAverage queue lengthMaximum queue lengthAverage queue lengthMaximum queue lengthAverage queue lengthMaximum queue length
Lanes 1, 2, 312.981.716.37613.168.8
Lanes 4, 531.9100.724.092.724.690.7
Lane 66.271.810.481.87.567.5
Lanes 7, 824.1101.415.087.420.183.6
(b) Average TTC by toll lane
Toll laneScenario 1-3Scenario 2-1Scenario 2-2
Lane 17.925.915.7
Lane 29.428.227.3
Lane 313.911.321
Lane 413.720.211.1
Lane 514.82212
Lane 623.633.820.5
Lane 720.921.924.9
Lane 810.713.711.4
Average14.621.314.9
(c) Average required braking rates during lane changes (m/s2)
Lane-changing/trailing vehiclesSideswipe conflictRear-end conflict
Scenario 1-3Scenario 2-1Scenario 2-2Scenario 1-3Scenario 2-1Scenario 2-2
Car–Car0.260.160.130.270.140.12
Car–HV0.560.170.320.210.110.22
HV–HV0.400.410.320.240.490.48
HV–Car0.480.240.380.340.160.22
Average0.340.240.300.190.210.31
Table 6. Comparison of scenarios in Experiment 3.
Vehicles 06 00059 i007Vehicles 06 00059 i008Vehicles 06 00059 i009Vehicles 06 00059 i010
Scenario 3-1
Current Toll Lane Configuration
for 60% HV
Scenario 3-2
Convert Lanes 6 to HV-only Lanes for 60% HV
Scenario 3-3
Current Toll Lane Configuration
for 70% HV
Scenario 3-4
Convert Lanes 6 to HV-only Lanes for 70% HV
(a) Queue length by toll lane
Scenario 3-1
Current toll lane configuration for 60% HV
Scenario 3-2
Convert Lane 6 to an HV-only lane for 60% HV
Scenario 3-3
Current toll lane configuration for 70% HV
Scenario 3-4
Convert Lane 6 to an HV-only lane for 70% HV
Toll lanesAve. queue lengthMax. queue lengthAve. queue lengthMax. queue lengthAve. queue lengthMax. queue lengthAve. queue lengthMax. queue length
Lanes 1, 2, 310.78110.681.21083.110.283
Lanes 4, 532.7103.231.2107.634.6108.431.4109.8
Lane 6775.71086881.412.493.2
Lanes 7, 829.1105.730.5114.632.7111.333.2118
(b) Average TTC by toll lane
Toll laneScenario 3-1Scenario 3-2Scenario 3-3Scenario 3-4
Lane 1887.87.7
Lane 210.110.611.111
Lane 310.2128.68.5
Lane 4121211.912.5
Lane 515.611.616.816.8
Lane 620.619.225.226.3
Lane 726.23029.432.5
Lane 814.614.719.520.3
Average16.016.419.120.8
(c) Average required braking rates during lane changes (m/s2)
Lane-changing/trailing vehicles60% HV70% HV
Sideswipe conflictRear-end conflictSideswipe conflictRear-end conflict
Scenario 3-1Scenario 3-2Scenario 3-1Scenario 3-2Scenario 3-3Scenario 3-4Scenario 3-3Scenario 3-4
Car–Car0.120.130.070.090.120.070.120.07
Car–HV0.620.890.240.830.830.450.720.3
HV–HV0.480.370.450.260.540.560.871.12
HV–Car0.400.410.320.420.290.340.220.77
Average0.420.370.300.300.420.440.560.60
Disclaimer/Publisher’s Note: The statements, opinions and data contained in all publications are solely those of the individual author(s) and contributor(s) and not of MDPI and/or the editor(s). MDPI and/or the editor(s) disclaim responsibility for any injury to people or property resulting from any ideas, methods, instructions or products referred to in the content.

