Abstract
The transportation sector is witnessing a paradigm shift toward more sustainable and efficient propulsion systems, with a particular focus on public transportation vehicles such as buses. In this context, hybrid powertrains combining internal combustion engines with electric propulsion systems have emerged as prominent contenders due to their ability to offer significant fuel savings and CO2 emission reductions compared to conventional diesel powertrains. In this study, the simulation of a complete hybrid bus vehicle is carried out to evaluate the impact of two different hybrid powertrain architectures compared to the diesel reference one. The selected vehicle is a 12 m city bus that performs typical urban driving routes represented by real measured driving cycles. First, the vehicle model was developed using a state-of-the-art diesel powertrain (internal combustion engine) and validated against literature data. This model facilitates a comprehensive evaluation of system efficiency, fuel consumption, and CO2 emissions while incorporating the effects of driving cycle variability. Subsequently, two different hybrid configurations (parallel P1 and series) are implemented in the model and compared to predict the relative energy consumption and environmental impact, highlighting advantages and challenges.
1. Introduction
The transportation sector is witnessing a paradigm shift toward more sustainable and efficient propulsion systems, with a particular focus on public transportation vehicles such as buses. In this context, legislators are introducing increasingly stringent regulations on CO2 emissions. The European Commission, for instance, is aiming for net-zero greenhouse gas (GHG) emissions by 2050 [1]. Transport accounts for 35% of global energy consumption, with road transport alone contributing to 77% of greenhouse gas emissions in the European Union (EU) in 2020 [2,3]. Within this sector, buses, coaches, and trucks are responsible for more than a quarter of the GHG emissions within the European Union (accounting for over 6% of total EU greenhouse gas emissions) [4]. To meet these challenges, the EU has introduced more stringent CO2 emission standards for Heavy-Duty Vehicles (HDVs), requiring reductions of 45% by 2030, 65% by 2035, and 90% by 2040 compared to 2019–2020 levels [5]. These targets demand innovative propulsion solutions capable of balancing efficiency, environmental performance, and economic viability.
In this context, coupling decarbonized energy sources with the electrification of powertrains can provide a technically robust framework for directing public transport fleets toward sustainable mobility, in line with current legislative objectives. While traditional diesel buses offer long-range autonomy, they are plagued by pollution and noise problems. Furthermore, they face increasing challenges due to emission regulations, which could lead to increased maintenance needs and costs [6]. On the other hand, Battery Electric Vehicles (BEVs) are promising as an alternative to improve air quality in densely populated urban areas and to decarbonize the Light-Duty Vehicle (LDV) sector. BEVs represent the cleanest alternative in terms of local emissions, offering high drivetrain efficiency, reduced noise, and the potential for integration with renewable electricity [7,8]. Depending on the specific bus application, the total cost of ownership of BEVs is expected to decrease progressively [9]. Nowadays, BEVs also face limitations in heavy-duty applications: limited range due to the low energy density of current batteries, high upfront costs, and the need for extensive charging infrastructure [10]. In this context, thermal management has a high potential to decrease energy demand or to increase vehicle ranges [11]. This restricts their practical deployment for buses operating on long routes or requiring high passenger capacity [12,13], but advancements in battery technology, particularly in energy and power density, are projected to further enhance the competitiveness of BEVs for bus applications. Among potential alternatives for the HDV sector, hybrid architectures could play a key role in the EU energy transition [14].
Hybrid electric buses emerge as a compromise solution, combining the durability and long-range operation typical of internal combustion engines (ICEs) with the energy savings provided by electrification. Hybridization allows for regenerative braking, optimized engine operation, and reduced CO2 emissions compared to conventional diesel buses [15]. In the parallel hybrid configuration, the ICE and the electric motor (EM) are connected in parallel to deliver power to the wheel, and both participate in power generation [16,17]. In the series hybrid configuration, an engine–generator unit produces energy to recharge the battery, while the electric motor alone is used to provide all the tractive force required by the vehicle. Although the series configuration offers the benefit of separating the engine speed from the driving wheels, the powertrain tends to be heavier due to the increased number of components; furthermore, it requires a more powerful electric motor that alone can move the vehicle.
Despite the deployment of cleaner technologies in transportation, the rise in transport demand is counteracting the pollution reductions achieved through technological advancements [18]. Therefore, it is essential to thoroughly compare conventional, hybrid, and electric powertrains across representative urban driving cycles. Such analysis can support transport operators and policymakers in selecting technologies that best fit specific operating conditions. Choosing the appropriate powertrain always involves a trade-off between the benefits and drawbacks of various options, depending on the driving cycle [19]. Thus, it is essential to thoroughly understand all the aspects that must be taken into account when selecting powertrain technology [20,21].
The objective of this study is to model and compare conventional diesel and hybrid powertrains for a 12 m city bus in different typical urban driving cycles in order to evaluate efficiency, fuel consumption, and emissions. The novelty of this work lies in the simulation of complete powertrain configurations using GT-SUITE, the validation of the model against literature data, and a systematic sensitivity analysis of hybrid powertrains across diverse cycles. This study can provide the starting point the modeling of a complete fleet, offering a powerful tool for the management of services, the design of infrastructure, and the distribution of buses based on different routes. This study is organized into the following sections: subsequent to the introduction, the “Model Description” section highlights the characteristics of the vehicle and the corresponding model implementation, describing the conventional and hybrid powertrain architectures. In the subsequent section, the validation of the model is reported. Then, in the “Powertrain and Driving Cycle Sensitivity Analysis” section, simulation results are reported and discussed, highlighting the effect of the powertrain architecture for different driving cycles. Finally, conclusions and prospects for future work are presented.
2. Model Description
The vehicle selected for this study is a 12 m urban bus (Figure 1), and the vehicle’s technical specifications are listed in Table 1. Urban buses are ideal candidates for powertrain hybridization due to their frequent and dynamic operational cycles, characterized by numerous start–stop events and ample braking occurrences [22].
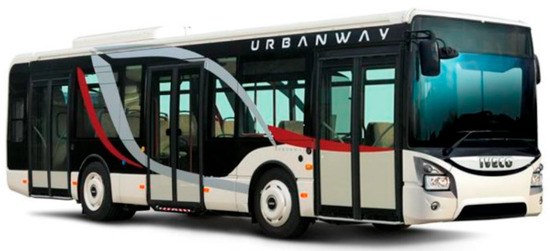
Figure 1.
A 12 m heavy-duty urban bus.

Table 1.
Bus specifications.
For this study, three different powertrain architectures are compared. The first is a conventional powertrain (Figure 2a) based on a 210 kW, 6-cylinder turbodiesel engine, the characteristics of which are shown in Table 2. Moreover, the BMEP map as a function of RPM and engine load is presented in Figure 3.
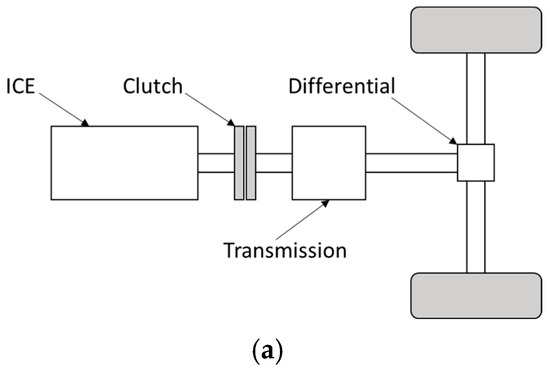
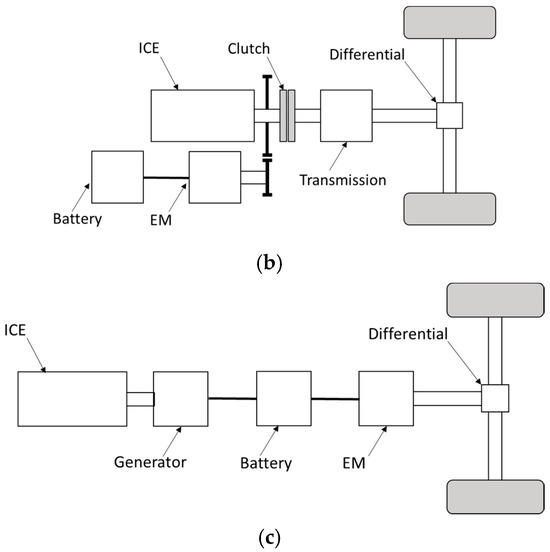
Figure 2.
Powertrain schematics: conventional (a), P1 hybrid (b), series hybrid (c).
Table 2.
Conventional powertrain specifications.
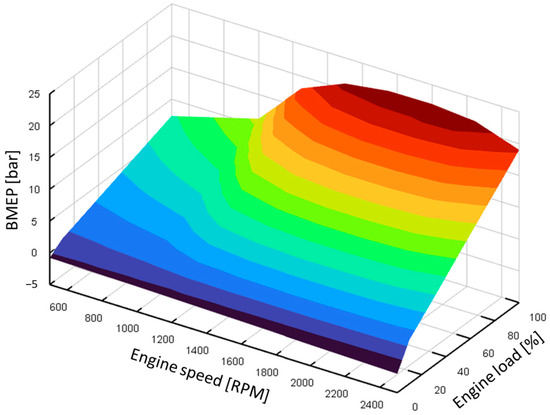
Figure 3.
ICE BMEP map as a function of RPM and engine load for the conventional diesel and for the P1 hybrid powertrains.
The second is a 48 V P1 hybrid architecture (Figure 2b): this solution is identified as optimal for the vehicle category, minimizing total cost of ownership by strategically balancing the potential for fuel consumption reduction against investment costs, as highlighted in the study by Marinoni et al. [20]. The P1 architecture is characterized by an electric machine connected directly to the crankshaft and by an ICE that is the same conventional diesel presented above. The EM works as a generator during vehicle deceleration, as an engine starter, and as a motor (to assist the ICE) during vehicle accelerations from rest. In particular, the EM works in parallel with the ICE for restarts from rest, up to the moment of gear changing; when the second gear is engaged, the EM turns off, and the traction remains completely dependent on the ICE. During braking, EM provides regenerative braking and works alone if the required braking torque is less than 200 Nm; when the braking torque exceeds this value, the mechanical brakes are also activated.
A low-voltage hybridization system was selected; in particular, the start–stop events due to bus stops and the low speed of the vehicle during the driving cycle allow for a constant supply of kinetic energy that can be recovered with a low-power electric machine. This avoids the increased costs and complications of an alternative high-voltage system, which would increase the vehicle’s total cost of ownership. Figure 4 shows the EM characteristic curves, selected from equivalent applications found in the literature [20,23] with a peak power of 26 kW. Based on the motor, a battery pack was chosen with 21 cells in series and 2 in parallel and a total capacity of 46 Ah, as in [20]. The characteristics of the parallel P1 hybrid powertrain are reported in Table 3.
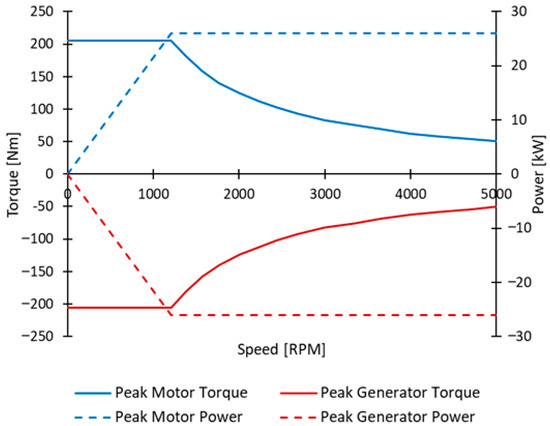
Figure 4.
EM curves for parallel P1 hybrid powertrain.
Table 3.
Parallel P1 hybrid powertrain specifications.
For the conventional diesel and P1 hybrid configurations, a rule-based automatic shifting strategy was implemented, where gears change when the engine speed exceeds a calibrated threshold or falls below a minimum limit under load. This ensures realistic operation comparable to commercial bus transmissions.
The last powertrain configuration is a series hybrid architecture (Figure 2c) that features a downsized diesel engine and a tractive electric motor as a power unit. The BMEP map of the downsized diesel engine, as a function of RPM and engine load, is presented in Figure 5. A simplified rule-based strategy is defined since the ICE-generator combination charges the battery based on the battery’s state of charge level. The diesel engine has a peak power of 100 kW, operating in fixed conditions depending on the battery state of charge (SOC), as shown in Figure 6: the ICE is kept off if the battery has an SOC > 0.52, working in a charge-depleting mode represented by state 1; then, a charge-sustaining mode starts to work: the more discharged the battery, the higher the operating speed imposed on the ICE. Specifically, the operating points chosen are 1500 (state 2, if 0.48 < SOC < 0.50), 2500 (state 3, if 0.46 < SOC < 0.48), and 3500 RPM (state 4, if SOC < 0.46). A gear connection with a constant gear ratio equal to 2 is used to link the ICE and the generator that can operate with maximum torque, reaching a maximum power of 81 kW when the ICE works at 3500 RPM. The use of a single constant gear ratio was chosen in accordance with the reference literature [17] because it provides comparable wheel torque between the powertrains, but this could result in a slight overestimation or underestimation of fuel consumption compared to a variable ratio system. Torque and power levels for charge-sustaining modes are shown in Table 4.
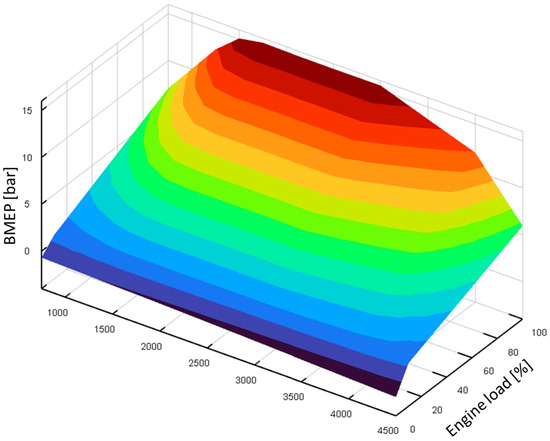
Figure 5.
ICE BMEP map as a function of RPM and engine load for the series hybrid powertrain.
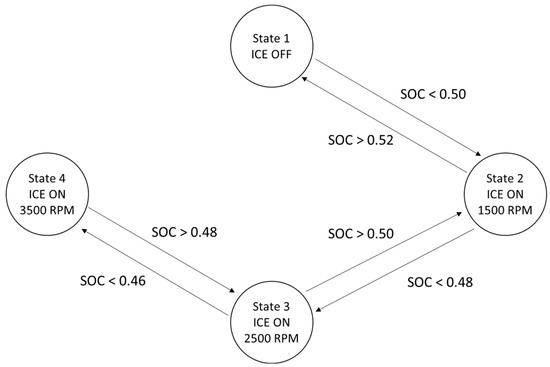
Figure 6.
Series hybrid control strategies.
Table 4.
Torque and power levels for charge-sustaining modes.
For this application, an EM with a peak power of 200 kW has been selected [17,23] for traction: its characteristic curves are shown in Figure 7a. The generator is an EM with a peak power of 90 kW, and its characteristic curves are shown in Figure 7b. To achieve the target power and capacity, a high-specific-power battery cell is selected for this hybrid series architecture [24] with 120 cells in series and 20 in parallel and a total capacity of 50 Ah, as in the study of Arsie et al. [17]. Since, for the series hybrid case, the transmission is not required, it was necessary to update the differential drive ratio value from the original 3.2 to 9.2 in order to guarantee the same torque transmitted to the wheels compared to the other powertrains. The characteristics of the series hybrid powertrain are reported in Table 5.
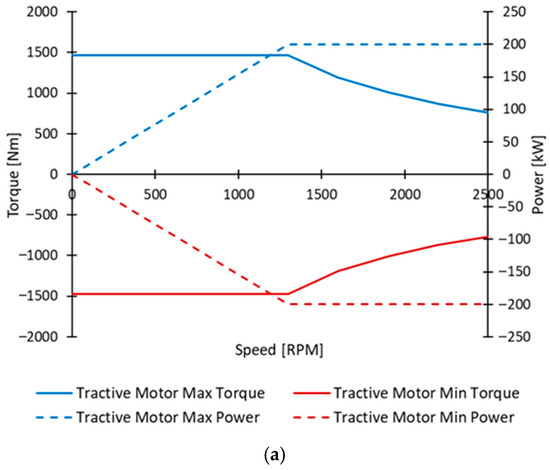
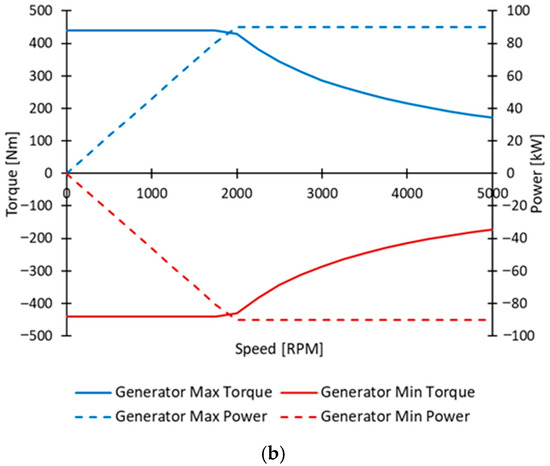
Figure 7.
Tractive motor (a) and generator (b) EM curves for series hybrid powertrain.
Table 5.
Series hybrid powertrain specifications.
For all considered powertrains, the transmission efficiency was modeled using a fixed efficiency factor (η = 0.95), based on literature data for heavy-duty automatic gearboxes. This accounts for mechanical and hydraulic losses in the driveline.
The vehicle model is implemented in the GT-ise software (v2023) provided by GT-SUITE [25], a leading multi-physics CAE system simulation program developed by Gamma Technologies, LLC (Westmont, IL, USA). Driver behavior is modeled through a feed-forward component that calculates the engine load torque (or wheel-braking torque) required to achieve a target vehicle speed. Once the reference load torque is determined, a standard proportional–integral (PI) controller adjusts the demanded torque from the engine or brakes to minimize the residual error between the target and instantaneous vehicle velocity. For hybrid powertrain architectures, the power flow is bidirectional: the battery delivers electrical energy, which is converted into kinetic energy to drive the vehicle, while mechanical energy is recuperated and converted back into electrical energy during regenerative braking. When the braking demand exceeds the available regenerative capacity of the electric motor system, the surplus energy is dissipated through conventional mechanical brakes.
The traction power at the driving wheels is subsequently computed based on the instantaneous wheel torque and rotational speed, accounting for drivetrain efficiency and any auxiliary power losses. This formulation allows the model to capture the dynamic interaction between the powertrain components and the vehicle, enabling accurate predictions of fuel consumption, energy recuperation, and overall system performance.
where is the rolling resistance coefficient, is the mass of the vehicle, is the gravity force, is the road grade, is the air density, is the frontal area of the vehicle, is the aerodynamic drag coefficient, and are the instantaneous vehicle speed and acceleration, and is equivalent mass representative of the inertia of the rotating components. Hence, the terms in the square brackets are the sums of the rolling resistance force, the aerodynamic force, the grading resistance force, and the linear acceleration force, respectively.
The vehicle inertia can be calculated as in the following equation:
Here, represents the torque output from the powertrain, is the total gear ratio, is the brake torque, represents the final drive efficiency, and indicates the wheel radius.
Road grade directly influences vehicle inertia and, consequently, fuel performance, since additional power is required to overcome both gravitational and frictional resistances on inclines. At steeper slopes, the gravitational component significantly increases the opposing force, while rolling resistance also rises as the tire load grows. Together, these forces demand higher engine torque to maintain constant speed, leading to greater fuel consumption and reduced efficiency. Ignoring road grade in fuel consumption analyses can thus introduce substantial errors, which in turn compromise the accuracy of emissions predictions, as higher fuel use generally correlates with higher pollutant emissions. For this reason, incorporating road grade effects is essential in comprehensive vehicle performance evaluations.
The developed model does not account for secondary drag effects, such as those arising from tire force generation (e.g., sideslip angle), since these effects become significant only under very high lateral accelerations—conditions typical of sports or racing vehicles and clearly irrelevant for the low-speed vehicle considered in this study. Additionally, the power consumption of auxiliary systems is neglected. Both the internal combustion engine and the electric motor are represented using a map-based modeling approach.
3. Model Validation
Model validation was performed by comparison with data reported in the literature, using the study from Marinoni et al. [20] as the reference. In this section, the conventional and P1 hybrid architectures have been compared using the urban cycle proposed by VECTO (Vehicle Energy Consumption calculation TOol) [26], as shown in Figure 8.
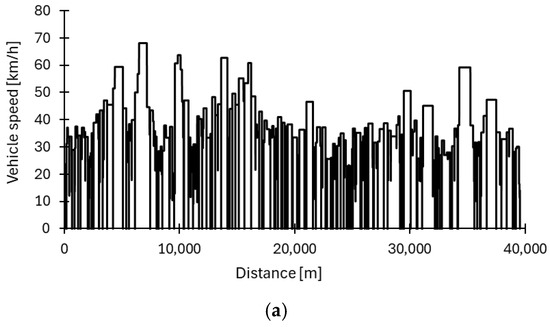
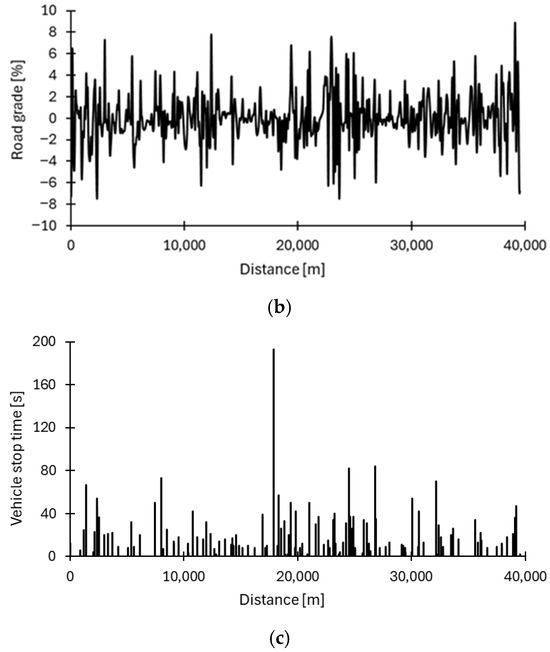
Figure 8.
Urban VECTO cycle: speed target (a), road grade (b), and vehicle stop (c) as a function of distance.
The VECTO mission speed target is provided as a function of the traveled distance, thereby resulting in a speed profile that depends on each vehicle’s performance and the driver model’s aggressiveness. To achieve a consistent profile independent of the powertrain setup, a pre-processing procedure has been carried out using the VECTO software to generate a time-dependent driving cycle, as depicted in Figure 9.
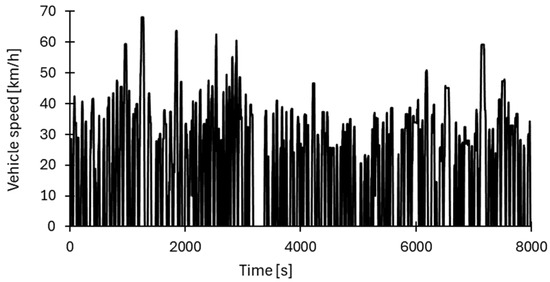
Figure 9.
Pre-processed urban VECTO cycle as a function of time.
For the P1 hybrid case, the system control unit disables EM operation during the first 10 min to allow the catalytic reduction system to reach the optimal temperature, as achieved in the reference study. It is possible to see this in Figure 10a, where the electrical power in the first period is negative, so the EM works only for regenerative braking. The battery was initialized with a state of charge (SOC) of 0.5, and in the first period, the SOC increases monotonically due to regenerative braking occurrences since the EM does not provide output power. As shown in Figure 10b, the model predicts the battery SOC progression over time. Moreover, Figure 10c shows the engine state (where 1 = ON and 0 = OFF) as a function of time: the controller switches off the internal combustion engine when the vehicle velocity reaches 0 m/s.
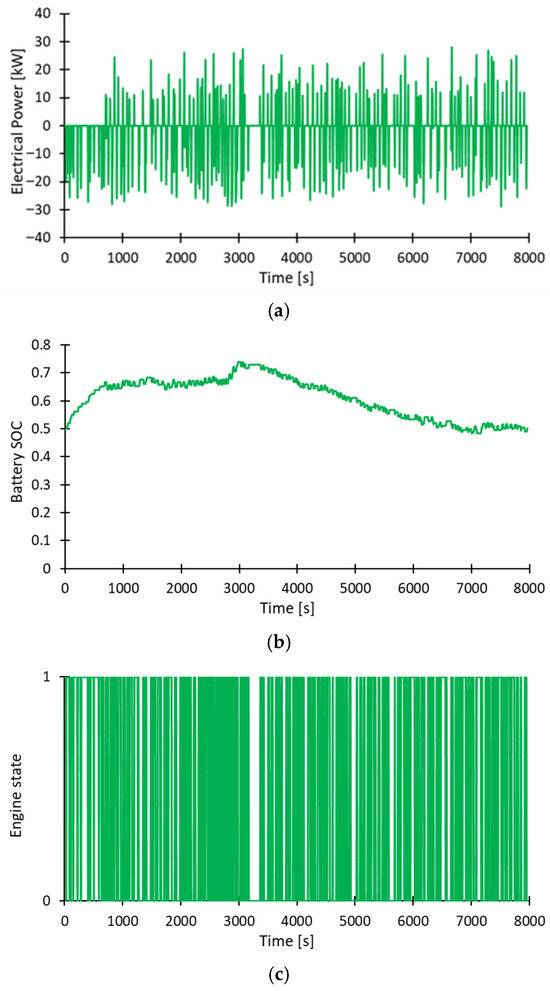
Figure 10.
Electrical power at the EM (a), battery state of charge (b), and engine state (c) as a function of time for a parallel P1 hybrid powertrain.
The fuel consumption rates, as a function of time for both cases, are shown in Figure 11. It is possible to see that the behavior is very similar until the EM is disabled, after which the curves begin to diversify: in particular for the hybrid case, the fuel consumption is null (Figure 11b—green curve) when the engine state is 0, while this does not happen for the conventional diesel case (Figure 11a—blue curve), for which the engine is always on.
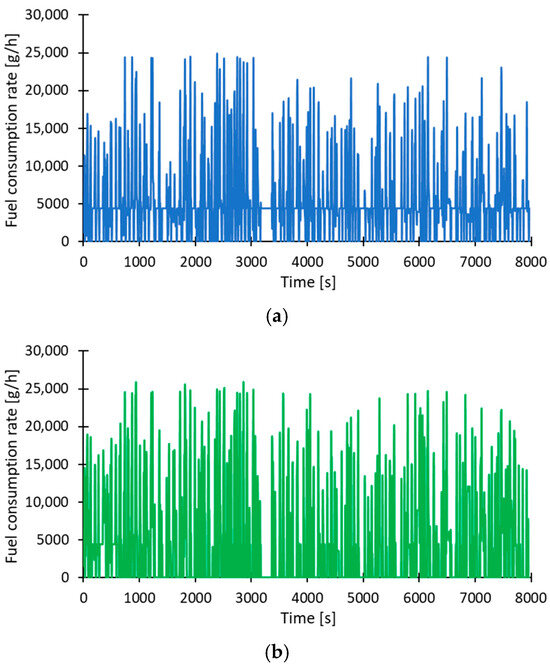
Figure 11.
ICE fuel consumption rate as a function of time for the conventional diesel case (a) and for the P1 hybrid case (b).
Table 6 and Table 7 summarize the fuel consumption of the two powertrain architectures, including both the total fuel consumed to complete the VECTO driving cycle (in [kg]) and the corresponding specific fuel consumption in [L/100 km]. The validation procedure involves comparing these quantities with the results presented in the reference study by Marinoni et al. [20]. In addition to a direct comparison of the obtained values, the percentage error with respect to the reference data is calculated both for the total fuel consumed and for the specific fuel consumption, defined as follows:
Table 6.
Conventional diesel powertrain model validation.
Table 7.
P1 hybrid powertrain model validation.
The model slightly overestimates the fuel consumption for the conventional diesel powertrain, but it has the opposite behavior for the hybrid P1 powertrain, for which there is a slight underestimation of the calculated consumption compared to the reference. In general, the developed model correctly represents the reduction in fuel consumption of the hybrid compared to the conventional diesel.
The conventional diesel configuration exhibits percentage errors, with respect to the reference, of 6.72% for total fuel consumed and 5.91% for specific fuel consumption. For the P1 hybrid, the difference is quantified as 3.93% for total fuel consumed and 1.17% for specific fuel consumption. The model can be considered validated given the limited divergence observed with respect to the reference study.
4. Powertrain and Driving Cycle Sensitivity Analysis
For this analysis, three different well-known real measured driving cycles are selected, typical for urban bus operation, namely, Braunschweig, Gillingham Uphill, and MLTB (Millbrook London Transport Bus), in addition to the VECTO already presented previously. The velocity profiles are represented in Figure 12, and their specifications are reported in Table 8. The Gillingham Uphill cycle is the only one to have a non-zero road grade, while the other two cycles have a constant road grade equal to 0 and are performed on flat terrain.
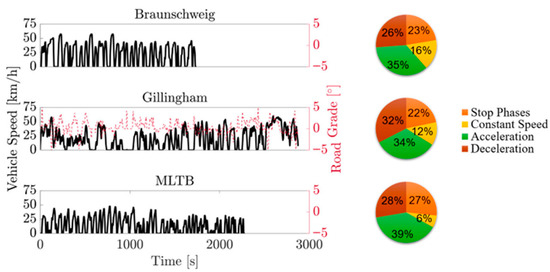
Figure 12.
Velocity and road grade profiles for the considered driving cycles.
Table 8.
Driving cycle specifications.
An extended comparison between the three different powertrains under examination is shown now for cycle Gillingham Uphill, which turns out to be more interesting due to the variability of the road grade.
Figure 13 shows the comparison between the three powertrains for the Gillingham Uphill cycle, focusing on internal combustion engine speed (in [RPM]) and fuel consumption (in [kg/h]). The conventional diesel case (blue curve) and the P1 Hybrid case (green curve) show very similar behaviors: since the ICE is the same for these two powertrains, and the degree of P1 hybridization is light, the contribution of the ICE remains predominant. The series hybrid architecture (red curve), on the other hand, shows very different behavior, as the controller activates the ICE only according to the battery SOC; furthermore, the alternation of the fixed speed operating points of the ICE (from 0 to 3500 RPM) can be noted in Figure 13a. Finally, the fuel consumption graph (Figure 13b) highlights how the series hybrid powertrain has very low consumption compared to the other cases, both because the ICE is turned off for a considerable part of the cycle and because the engine displacement is reduced.
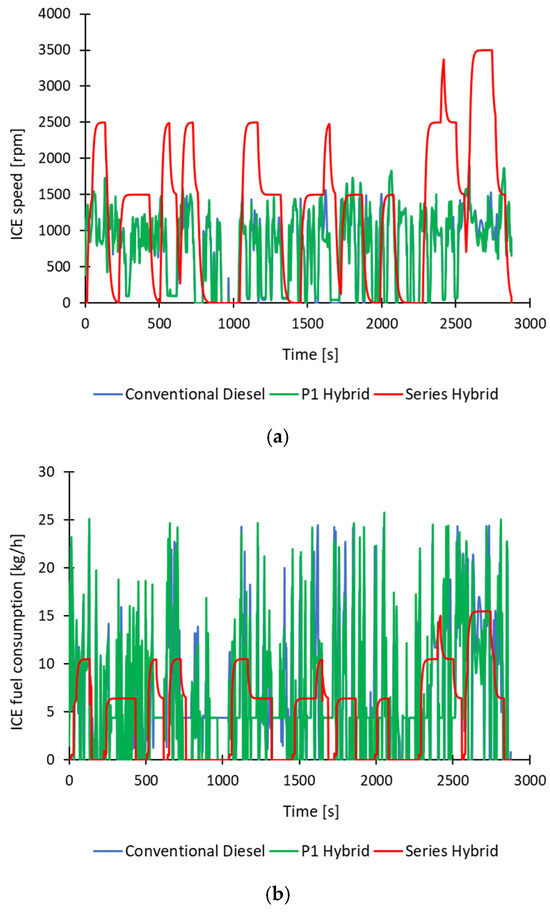
Figure 13.
ICE speed (a) and fuel consumption (b) as a function of time for the Gillingham Uphill cycle.
Figure 14 shows the performance of the battery SOC (green curve) together with the EM electrical power (gray curve) for the hybrid P1 powertrain. When the electrical power of the EM is negative, the battery is recharged, while the battery is discharged when the electrical power takes on positive values. Overall, the electrical contribution is marginal compared to that of the ICE; as a consequence, at the end of the driving cycle, the battery is more charged than at the beginning.
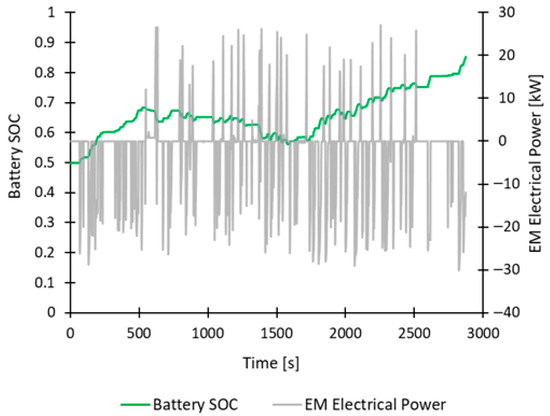
Figure 14.
Battery SOC (in green) and EM electrical power (in gray) as a function of time for the Gillingham Uphill cycle, for the P1 hybrid case.
Figure 15 and Figure 16 show the behavior of the battery SOC (red curve) and the EM electrical power: the tractive one is represented by the gray curve in Figure 15, while the generator is depicted by the gray curve in Figure 16. Here, the Tractive EM (Figure 15) shows considerable electrical power peaks compared to the other cases since it is only responsible for all the traction necessary to move the vehicle. Instead, the Generator EM (Figure 16) is directly affected by the fixed-point operation mode of the ICE, and it also works at fixed points to recharge the battery. It reaches a maximum peak power of −81 kW when it works at 3500 RPM in state 4 mode (see Table 4).
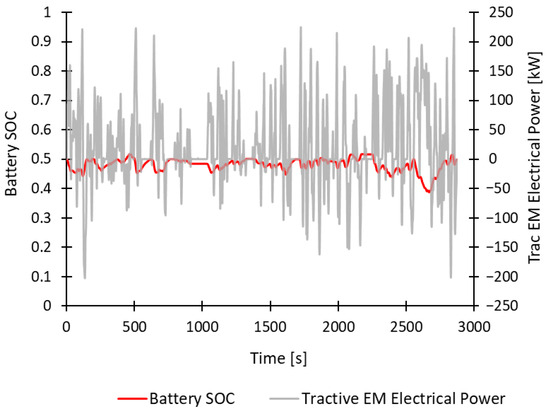
Figure 15.
Battery SOC (in red) and Tractive EM electrical power (in gray) as a function of time for the Gillingham Uphill cycle, for the series hybrid case.
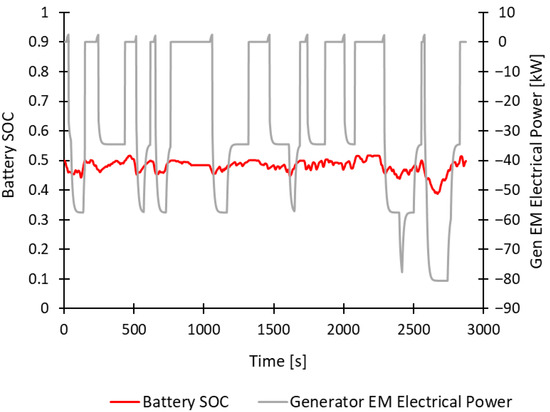
Figure 16.
Battery SOC (in red) and Generator EM electrical power (in gray) as a function of time for the Gillingham Uphill cycle, for the series hybrid case.
The following tables show the summary results of the comparison between different powertrains and different driving cycles. In particular, Table 9 shows the total fuel consumed to conclude a single driving cycle (in [kg]); Table 10 lists the specific fuel consumption in [L/100 km], while the amount of produced CO2 is shown in Table 11.
Table 9.
Comparison of total fuel consumed in [kg] for different cycles and different powertrain architectures.
Table 10.
Comparison of specific fuel consumption in [L/100 km] for different cycles and different powertrain architectures.
Table 11.
Comparison of produced CO2 in [kg] for different cycles and different powertrain architectures.
Table 9 indicates that the cycle with the least fuel consumed is the MLTB cycle with the conventional and series hybrid powertrains. The Braunschweig cycle, which is the shortest cycle of all, features a greater amount of fuel consumed than the MLBT (with the conventional and series hybrid powertrains) because it has fewer stop phases and more phases at higher speeds. This difference is canceled out using the P1 hybrid powertrain. The VECTO cycle produces the greatest fuel consumed, since it is 3–4 times longer than other cycles. The quantity of the produced CO2 (Table 11) follows the values of the fuel consumed almost linearly. Hence, on these routes, the P1 hybrid allows for fuel saving in all cycles except on Gillingham Uphill since the ICE is more stressed. The series hybrid, thanks to the downsizing and management logic of the ICE, produces a reduction in fuel consumption with respect to the other powertrains. The same trend is also depicted in the specific fuel consumption comparison in Table 10.
Since a simple rule-based energy management approach was used in this work, it is necessary to consider that the SOC of the battery at the end of the cycle is different from the initial one (which is set to 0.5 for all cases). One way to carry out an SOC correction is to calculate the total energy consumed as a sum of the energy consumed resulting from the combustion of fuel and the energy associated with the difference in the initial and final battery SOC.
The first contribution is demonstrated by the product between the total fuel consumed during the cycle (reported in Table 9) and the lower diesel fuel heating value (11.9 kWh/kg):
The second contribution is calculated from the energy depleted from or added to the battery, the function of the difference in initial and final battery SOC, and the battery energy capacity, and it is corrected with the average ICE efficiency, which is considered equal to 38%. This value represents the average indicated efficiency of a modern Euro VI diesel engine, based on manufacturer data. Considering that efficiency varies with load and speed, for the SOC correction, it is used as a representative mean value.
Table 12 reports the final battery SOC for all hybrid cases. For the P1 hybrid powertrain, the final SOC varies considerably as a function of the driving cycle. For the series hybrid powertrain, the energy management strategy working in charge-sustaining mode is able to maintain the final SOC very close to the initial one (equal to 0.5).
Table 12.
Comparison of final battery SOC for different cycles and different hybrid powertrain architectures.
Table 13 shows the presented total energy consumed to conclude a single driving cycle (in [kWh]) (from Equation (4)). For the conventional diesel powertrain, there is only one value representing the energy produced by the fuel combustion (from Equation (5)). For hybrid powertrains, both contributions (from Equations (5) and (6)) and the summed value (from Equation (4)) are reported. A positive value of the energy extracted from the battery indicates that electric energy is consumed, so the final SOC is lower than the initial one. A negative value of the energy extracted from the battery indicates that electric energy is generated, so the final SOC is higher than the initial one.
Table 13.
Comparison of total energy consumed in [kWh] for different cycles and different powertrain architectures.
Now, from the results in Table 14, it is possible to summarize and compare the total specific energy consumption (in [kWh/km]).
Table 14.
Comparison of total specific energy consumption in [kWh/km] for different cycles and different powertrain architectures.
Considering the SOC energy correction, the P1 hybrid allows for total energy savings of around 20–25% in all cycles except the Gillingham Uphill cycle, where the savings are only around 6% since the ICE is more stressed. The series hybrid, on the other hand, allows for energy savings of around 45–55% thanks to the downsizing and management logic of the ICE, except on the Gillingham Uphill driving cycle, where the total energy saving decreases until reaching a value of 25%. A further reduction is expected to be achieved by improving engine combustion and the energy management system.
The results obtained in this study are consistent with findings reported in recent works. Marinoni et al. [20] reported fuel savings of approximately 20% for light-hybrid bus configurations in urban cycles, in line with the 20–25% savings obtained here for the P1 hybrid. Arsie et al. [17] demonstrated that series hybrid architectures could achieve reductions of up to 50% in urban contexts, which agrees with the 45–55% energy savings predicted by our model. Kivekäs et al. [19] also highlighted the strong dependence of bus energy consumption on driving cycle characteristics, a trend confirmed in our analysis, where the Gillingham Uphill cycle reduced hybrid advantages.
These consistencies reinforce the robustness of the present results. Nonetheless, some discrepancies remain due to the implementation and simplification of the model. Validation against real driving cycles from bus fleets of the city of Perugia (Italy) is identified as the next step to strengthen applicability.
5. Conclusions
In this study, a 12 m city bus model was simulated to evaluate the impact of different powertrain architectures (conventional diesel, P1 hybrid, and series hybrid) across multiple urban driving cycles.
- The vehicle model was preliminarily validated using literature data as a reference for the VECTO urban driving cycle. The conventional diesel powertrain exhibits a maximum deviation of 6.71%, while the P1 hybrid powertrain shows a maximum deviation of 3.93% compared to the reference study. The resulting discrepancies are minimal, and given such small deviations, the model is considered validated. These results confirm the model’s ability to accurately predict vehicle performance under the specified driving conditions.
- Subsequently, a series hybrid powertrain has been implemented and compared to other selected architectures to predict the relative energy consumption and environmental impact. In addition to VECTO, three other well-known real measured driving cycles are simulated, namely, Braunschweig, Gillingham Uphill, and MLTB.
- The model provided data in terms of total fuel consumed to complete a single driving cycle, specific fuel consumption, the amount of CO2 produced, and the total energy consumption. A SOC correction is implemented to calculate the total energy consumed as a sum of the energy consumed from fuel combustion and the energy associated with the difference in the initial and final battery SOC.
- Total energy savings of around 20–25% are obtained with the parallel hybrid configuration in all cycles except the Gillingham Uphill cycle, where the ICE is more stressed. The fuel savings reach around 45–55% with the series hybrid configuration, thanks to the downsizing and management of the ICE, except for the Gillingham Uphill driving cycle, which produces total energy savings equal to 25%.
The series hybrid configuration emerges as the most promising solution, among the ones analyzed, for the decarbonization of the bus sector. This study validates the methodology and allows for the implementation of further models with different powertrain designs, driving cycles, and bus sizes. The results obtained are specific to the modeled 12 m bus, the selected driving cycles, and the applied rule-based energy management strategy. Real-world performance may differ due to additional losses, varying passenger loads, traffic conditions, or alternative control algorithms. Future developments will address these limitations, incorporating real, non-standardized driving cycles traveled along the bus routes of the city of Perugia (Italy), as well as the development of an optimized energy management strategy, such as Equivalent Consumption Minimization Strategy or Model Predictive Control, and the extension to fuel cell powertrains.
Author Contributions
Conceptualization, J.Z., G.C., and M.B.; methodology, J.Z., G.C., and M.B.; software, J.Z.; validation, J.Z.; formal analysis, J.Z.; investigation, J.Z.; resources, J.Z., G.C., and M.B.; data curation, J.Z.; writing—original draft preparation, J.Z., G.C., and M.B.; writing—review and editing, J.Z., G.C., and M.B.; visualization, J.Z.; supervision, G.C. and M.B.; project administration, G.C. and M.B. All authors have read and agreed to the published version of the manuscript.
Funding
This research received no external funding.
Data Availability Statement
The original contributions presented in this study are included in the article. Further inquiries can be directed to the corresponding author.
Conflicts of Interest
The authors declare no conflicts of interest.
Abbreviations
The following abbreviations are used in this manuscript:
| BEV | Battery Electric Vehicle |
| EM | Electric Motor |
| EU | European Union |
| GHG | Greenhouse Gas |
| HDV | Heavy-Duty Vehicle |
| ICE | Internal Combustion Engine |
| LDV | Light-Duty Vehicle |
| MLTB | Millbrook London Transport Bus |
| SOC | State of Charge |
| VECTO | Vehicle Energy Consumption calculation TOol |
References
- UNECE. European Green Deal: Commission Proposes Transformation of EU Economy and Society to Meet Climate Ambitions. 2021. Available online: https://ec.europa.eu/commission/presscorner/detail/en/IP_21_3541 (accessed on 10 April 2024).
- IEA. Largest End Uses of Energy by Sector in Selected IEA Countries. Available online: https://www.iea.org/data-and-statistics/charts/largest-end-uses-of-energy-by-sector-in-selected-iea-countries-2019 (accessed on 10 April 2024).
- EEA. Greenhouse Gas Emissions from Transport in Europe. 2023. Available online: https://www.eea.europa.eu/en/analysis/indicators/greenhouse-gas-emissions-from-transport (accessed on 10 April 2024).
- ACEA. Fact Sheet: CO2 Standards for Heavy-Duty Vehicles. 2023. Available online: https://www.acea.auto/fact/fact-sheet-co2-standards-for-heavy-duty-vehicles/ (accessed on 10 April 2024).
- European Commission. Proposal for a Regulation of the European Parliament and of the Council Amending Regulation (EU) 2019/1242 as Regards Strengthening the CO2 Emission Performance Standards for New Heavy Duty Vehicles and Integrating Reporting Obligations, and Repealing Regulation (EU) 2018/956; European Commission: Brussels, Belgium, 2023. [Google Scholar]
- Nylund, N.-O.; Koponen, P. Fuel and Technology Alternatives for Buses: Overall Energy Efficiency and Energy Performance; VTT: Espoo, Finland, 2012. [Google Scholar]
- Zhang, C.; Zhao, X.; Sacchi, R.; You, F. Trade-off between critical metal requirement and transportation decarbonization in automotive electrification. Nat. Commun. 2023, 14, 1616. [Google Scholar] [CrossRef] [PubMed]
- Ribeiro, P.J.G.; Dias, G.; Mendes, J.F.G. Public Transport Decarbonization: An Exploratory Approach to Bus Electrification. World Electr. Veh. J. 2024, 15, 81. [Google Scholar] [CrossRef]
- Di Vece, G.; Di Nunno, D.; Bilancia, M.; Verdino, V. Development of a Total Cost of Ownership Model to Compare BEVs, FCEVs and Diesel Powertrains on Bus Applications; SAE Technical Paper 2022-37-0030; SAE International: Warrendale, PA, USA, 14 June 2022. [Google Scholar] [CrossRef]
- Kaya, A.F.; Puglia, M.; Morselli, N.; Allesina, G.; Pedrazzi, S. Fuel consumption of diesel, natural gas, hybrid, full electric and hydrogen fuel cells based buses: A simulated comparison using standard road cycles and gradeability tests. Fuel 2025, 401, 135938. [Google Scholar] [CrossRef]
- Schäfer, H.; Meywerk, M.; Hellberg, T. Simulation-Based Investigation and its Experimental Validation of the Thermal Behaviour of a Battery Electric City Bus; SAE Technical Paper 2025-01-0266; SAE International: Warrendale, PA, USA, 2 July 2025. [Google Scholar] [CrossRef]
- Mareev, I.; Becker, J.; Sauer, D.U. Battery dimensioning and life cycle costs analysis for a heavy-duty truck considering the requirements of long-haul transportation. Energies 2018, 11, 55. [Google Scholar] [CrossRef]
- Çabukoglu, E.; Georges, G.; Küng, L.; Pareschi, G.; Boulouchos, K. Battery electric propulsion: An option for heavy-duty vehicles? Results from a Swiss case-study. Transp. Res. Part C Emerg. Technol. 2018, 88, 107–123. [Google Scholar] [CrossRef]
- Moriarty, P.; Honnery, D. Prospects for hydrogen as a transport fuel. Int. J. Hydrogen Energy 2019, 44, 16029–16037. [Google Scholar] [CrossRef]
- Carignano, M.; Adorno, R.; van Dijk, N.; Nieberding, N.; Nigro, N.; Orbaiz, P. Assessment of Energy Management Strategies for a Hybrid Electric Bus. In Proceedings of the 5th International Conference on Engineering Optimization, Iguassu Falls, Brazil, 19–23 June 2016; pp. 19–23. [Google Scholar]
- Ehsani, M.; Yimin, G.; Miller, J.M. Hybrid Electric Vehicles: Architecture and Motor Drives. Proc. IEEE 2007, 95, 719–728. [Google Scholar] [CrossRef]
- Arsie, I.; Battistoni, M.; Brancaleoni, P.P.; Cipollone, R.; Corti, E.; Di Battista, D.; Millo, F.; Occhicone, A.; Paradisi, B.P.; Rolando, L.; et al. A New Generation of Hydrogen-Fueled Hybrid Propulsion Systems for the Urban Mobility of the Future. Energies 2024, 17, 34. [Google Scholar] [CrossRef]
- García Sánchez, J.A.; López Martínez, J.M.; Lumbreras Martín, J.; Flores Holgado, M.N.; Aguilar Morales, H. Impact of Spanish electricity mix, over the period 2008–2030, on the Life Cycle energy consumption and GHG emissions of Electric, Hybrid Diesel-Electric, Fuel Cell Hybrid and Diesel Bus of the Madrid Transportation System. Energy Convers. Manag. 2013, 74, 332–343. [Google Scholar] [CrossRef]
- Kivekäs, K.; Lajunen, A.; Vepsäläinen, J.; Tammi, K. City Bus Powertrain Comparison: Driving Cycle Variation and Passenger Load Sensitivity Analysis. Energies 2018, 11, 1755. [Google Scholar] [CrossRef]
- Marinoni, A.M.; Onorati, A.; Manca Di Villahermosa, G.; Langridge, S. Real Driving Cycle Simulation of a Hybrid Bus by Means of a Co-Simulation Tool for the Prediction of Performance and Emissions. Energies 2023, 16, 4736. [Google Scholar] [CrossRef]
- Kim, H.; Hartmann, N.; Zeller, M.; Luise, R.; Soylu, T. Comparative TCO Analysis of Battery Electric and Hydrogen Fuel Cell Buses for Public Transport System in Small to Midsize Cities. Energies 2021, 14, 4384. [Google Scholar] [CrossRef]
- Liu, W. Hybrid Electric Vehicle System Modeling and Control; John Wiley & Sons: Hoboken, NJ, USA, 2017. [Google Scholar]
- ZeEUS EBus Report #2 An Updated Overview of Electric Buses in Europe. Available online: https://zeeus.eu/uploads/publications/documents/zeeus-ebus-report-2.pdf (accessed on 10 April 2024).
- Carlsson, L.O.; Larsson, D.; Sauer, A.; Speckens, F.W. High-performance Battery for Premium Class Hybrid Vehicles. MTZ Worldw. 2021, 82, 28–35. [Google Scholar] [CrossRef]
- Gamma Technologies Inc. GT-SUITE User’s Manual; Gamma Technologies Inc.: Westmont, IL, USA, 2024. [Google Scholar]
- Vehicle Energy Consumption Calculation TOol—VECTO. Available online: https://europa.eu (accessed on 10 April 2024).


Disclaimer/Publisher’s Note: The statements, opinions and data contained in all publications are solely those of the individual author(s) and contributor(s) and not of MDPI and/or the editor(s). MDPI and/or the editor(s) disclaim responsibility for any injury to people or property resulting from any ideas, methods, instructions or products referred to in the content. |
© 2025 by the authors. Licensee MDPI, Basel, Switzerland. This article is an open access article distributed under the terms and conditions of the Creative Commons Attribution (CC BY) license (https://creativecommons.org/licenses/by/4.0/).