Article

Application of YOLOv8 and Detectron2 for Bullet Hole Detection and Score Calculation from Shooting Cards

1
Data-Driven Smart Society (DDSS), Inholland University of Applied Sciences, 1817 MN Alkmaar, The Netherlands
2
Faculty of Engineering, Design & Computing, Inholland University of Applied Sciences, 2015 CE Haarlem, The Netherlands
*
Author to whom correspondence should be addressed.
AI 2024, 5(1), 72-90; https://doi.org/10.3390/ai5010005
Submission received: 1 October 2023 / Revised: 11 December 2023 / Accepted: 14 December 2023 / Published: 22 December 2023
(This article belongs to the Topic Advances in Artificial Neural Networks)

Abstract

:
Scoring targets in shooting sports is a crucial and time-consuming task that relies on manually counting bullet holes. This paper introduces an automatic score detection model using object detection techniques. The study contributes to the field of computer vision by comparing the performance of seven models (belonging to two different architectural setups) and by making the dataset publicly available. Another value-added aspect is the inclusion of three variants of the object detection model, YOLOv8, recently released in 2023 (at the time of writing). Five of the used models are single-shot detectors, while two belong to the two-shot detectors category. The dataset was manually captured from the shooting range and expanded by generating more versatile data using Python code. Before the dataset was trained to develop models, it was resized (640 × 640) and augmented using Roboflow API. The trained models were then assessed on the test dataset, and their performance was compared using matrices like mAP50, mAP50-90, precision, and recall. The results showed that YOLOv8 models can detect multiple objects with good confidence scores. Among these models, YOLOv8m performed the best, with the highest mAP50 value of 96.7%, followed by the performance of YOLOv8s with the mAP50 value of 96.5%. It is suggested that if the system is to be implemented in a real-time environment, YOLOv8s is a better choice since it took significantly less inference time (2.3 ms) than YOLOv8m (5.7 ms) and yet generated a competitive mAP50 of 96.5%.

1. Introduction

Automating the calculation of the total points from a shooting card is a tedious yet essential task of shooting sports. At a professional level, electronic targets or target-reading machines are validated and certified by the International Shooting Sport Federation (ISSF). At an amateur level, this is often carried out by manually counting the score of each bullet hole. This process can be time-consuming and subject to miscounting by human error. This paper, therefore, compared and used neural network (NN)-based object detection algorithms for calculating the total score of a target after training, validating, and testing the dataset on seven pre-trained object detection models. The selected pre-trained models were fine-tuned on a shooting card dataset. The proposed solution classified each bullet hole according to the score. This means that the models carried out the classification task based on the relative position of bullets on the shooting card and not the way a bullet hole appears.
NN models for object detection problems can be classified on a higher level as single-shot or two-shot detection models. For any object detection problem, choosing between them is a crucial decision. Two-shot object detection models are accurate, whereas single-shot detectors are computationally faster, compromising accuracy. So, models from both categories were chosen. Three models (variants) of YOLOv8 (You Only Look Once) from the single-shot detection category were selected, whereas four models were selected from detectron2. The two models from detectron2, namely Faster RCNN-50 and Faster RCNN-101, belong to the class of two-shot detectors, while the other two (RetinaNet-50 and RetinaNet-101) are considered single-shot detectors.
The paper primarily focuses on identifying an object detection model suitable for real-time application in terms of accuracy and speed. The entire methodology is presented in Figure 1, which starts with collecting and generating the dataset. The dataset was required to be in the desired shape of 640 × 640 to train all seven pre-trained models. Moreover, the dataset was expanded, and detectable objects in each image were labeled (including bullet holes and their corresponding scores). The third step was to split the dataset into train, validation, and test folders. The models were then trained on the training dataset, followed by testing on the test dataset. The last phase was to compare the performance of these models by using different metrics provided by these models. The purpose is to leverage the powerful features of the single-shot and two-shot detectors to achieve the highest average precision and recall values on the custom dataset.
The paper is organized as follows. Section 2 presents the related work, and Section 3 outlines the dataset, methods, and materials used. The results of the experiment are presented in Section 4. Section 5 provides a discussion, followed by the conclusion in Section 6.
The main contributions of this paper are summarized below:
  • Seven models from two architecturally different object detection domains are used for performance comparison.
  • The dataset was manually collected by capturing images from the shooting range.
  • The dataset was improved and made publicly available to be used by other researchers for the detection and classification of points from shooting cards.
  • Multiple performance evaluation metrics are used to gain a better insight into the performances of different models.

2. Related Work

Target or aim detection is a significant part of image processing and recognition [1]. Manual and automatic target scoring are the two main methods used for score calculation. Manual observation is still used for target scoring calculation in major shooting competitions. While automatic score calculation is time-efficient and less erroneous, it depends on how accurately bullet holes and the center of the target are detected [2]. Small objects have mostly low-resolution and noisy representations, making their detection (multiple occurrences) challenging [3]. The problem of detecting bullet holes with labels is an object detection task. The related work can be grouped into two primary object detection fields. The first field comprises the classical image-processing methods based on several steps starting with binarization, contour detection, and feature extraction techniques like Otsu threshold, scale-invariant feature transform (SIFT), and histograms of oriented gradient (HOG). With the developments of deep learning and convolutional neural networks (CNNs), a new field has been established in object detection which has outperformed the conventional methods by extracting more complex and advanced features.
Traditional methods for target detection include the background subtraction method [4] and the inter-difference method [5]. Implementing the subtraction algorithm has high imaging requirements for the conditions of bullet holes. It is vulnerable to irregular and fuzzy edge detection of bullet holes, eventually affecting the precision and accuracy of score calculation. Jie et al. [6] proposed a wavelets transform-based methodology using fusion rules for bullet hole detection to overcome the limitation of image difference technology. They first decomposed the image into different frequencies. Then, multiple fusion rules and processing methods in different frequencies were implemented to increase the wavelet transform coefficient of the target image. Compared with the subtraction detection algorithm and Gaussian model, their approach worked better by suppressing the noise and obtaining solid and unbroken edges of bullet holes.
Liu and Chen [7] used different image processing techniques like image binarization, segmentation, morphological processing, Hough transforms, and the bullet difference method to calculate the position of the bull’s eye and bullet holes. They managed to achieve a precision of 98.5% for the calculation of the firing score. Similarly, in another study for the recognition of bullet holes based on video image analysis, Roulin et al. [8] designed two approaches to compare the performances; the first approach is based on rough positioning, support vector machine (SVM), the histograms of oriented gradient (HOG) algorithm, and convolutional neural networks (CNNs) for the extraction and recognition of bullet holes. The second approach constitutes rough positioning followed by a deep CNN. They used classical image processing techniques like frame extraction, the Otsu method, morphological filtering, and the region labeling process for rough positioning. Their experiments show that the SVM-based approach performed better, with a precision value of 98.57%.
In the research by Ali and Mansoor [9], an approach for automatic scoring of shooting targets was designed which started with morphological processing to thicken the boundaries of bullet holes, followed by the segmentation of the target area via hysteresis thresholding. Likewise, Rudzinki and Luckner [10] proposed an approach that relied on image-handling methods like Prewitt edge detection and Hough Transformations. The approach detected holes with an accuracy of 92% after eliminating false positives. Zin et al. [11] worked on automating the scoring system of archery targets. They began with dilating the edges of arrow hits using morphological processing. Afterward, the target area was segmented using color and shape features. To handle illumination variations, they used dynamic thresholding. Su and Chen [12] presented an approach for extracting targets to automate the scoring system. They applied a perspective transformation to convert input into a standard rectangle. Then, the flood-filled algorithm was used to eliminate the interference information.
For real-time detection, integrated CNNs are used by researchers to enhance the detection performance of an algorithm. Continuous advancements in YOLO and SSD regression-based algorithms [13] exist. The accuracy of these algorithms for multiscale targets and small objects is not high. Using a lightweight model is another hot issue in the target detection domain [14]. So, to reduce the number of network computations, Ren and Bao [15] used MobileNet as a primary network, and standard convolution was replaced with inverse residual convolution in the SSD detection layer. Du et al. [3] trained two neural networks for bullet hole detection, i.e., one is the original Faster-RCNN, and the second is the improved model based on Faster-RCNN. The experiment showed that their improved model (based on Faster-RCNN) performed better than the original Faster-RCNN by enhancing the average precision by 20.3%. That study was published in the year 2019, and since then, there has been significant development in object detection algorithms. Different versions of the YOLO model have been released to balance speed and accuracy in the detection process; among them, YOLOv5 is the most popular model. It gained popularity because of its performance in terms of accuracy and speed. However, few studies used YOLOv5 and improvised its design by comparing it with the original model [16,17,18]. With better inference time and accuracy, YOLOv6 was introduced, followed by YOLOv7 during the same year. The YOLOv6 model’s performance and real-time capabilities were evaluated by a study [19] in which fire detection in Korea was carried out. The most recent addition to the YOLO family is YOLOv8, which was released in 2023. Figure 2 shows the development of YOLO over the years.
The related work shows that the classical approach for detecting bullet holes is based on multi-phase preprocessing algorithms that lead to significantly high inference times when running on a new test dataset (as they must be preprocessed before detection). Moreover, implementing these classical algorithms requires high imaging conditions of bullet holes. It makes the entire process vulnerable to irregular and fuzzy edge detection of bullet holes, eventually affecting the precision and accuracy of score calculation. On the other hand, modern CNN-based object detection algorithms do not require preprocessing, as the models are trained on all types of images. Initial versions of available object-detection algorithms detected objects in two stages and are named two-shot detectors. The two-shot detectors are usually heavyweight and computationally expensive. With time, new object detection algorithms, known as single-shot detection, were introduced to detect objects in one stage. Single-shot detectors are lightweight and computationally efficient. The algorithms/frameworks that are lightweight and have fast detection speeds are generally low in accuracy, making it hard to find a tradeoff between accuracy and computational load [20,21]. The choice of lightweight models is interconnected with real-time detection capabilities since they infer quickly while consuming the least computational resources [18]. It is also observed that the inference time is not significantly discussed as an evaluation metric in the related work. This could be because some two-shot object detection algorithms like Faster RCNN do not provide this information. However, single-shot detectors like YOLO have added speed (time) as an assessment metric.
For bullet hole detection, accuracy and speed are both needed. Single-shot detectors are lightweight, indicating higher inference speed, while two-shot detectors are recognized for accuracy. The three recent variants of YOLOv8 are used to investigate their precision on bullet holes and score detection. Furthermore, two-shot detectors, famous for their better accuracy, are also included. In a nutshell, seven different models are trained to explore whether single-shot detectors (e.g., YOLOv8n, YOLOv8s, YOLOv8m, RetinaNet-50, and RetinaNet-101) can perform better than two-shot detectors (e.g., Faster RCNN-50 and Faster RCNN-101) in terms of accuracy and precision in addition to being faster.

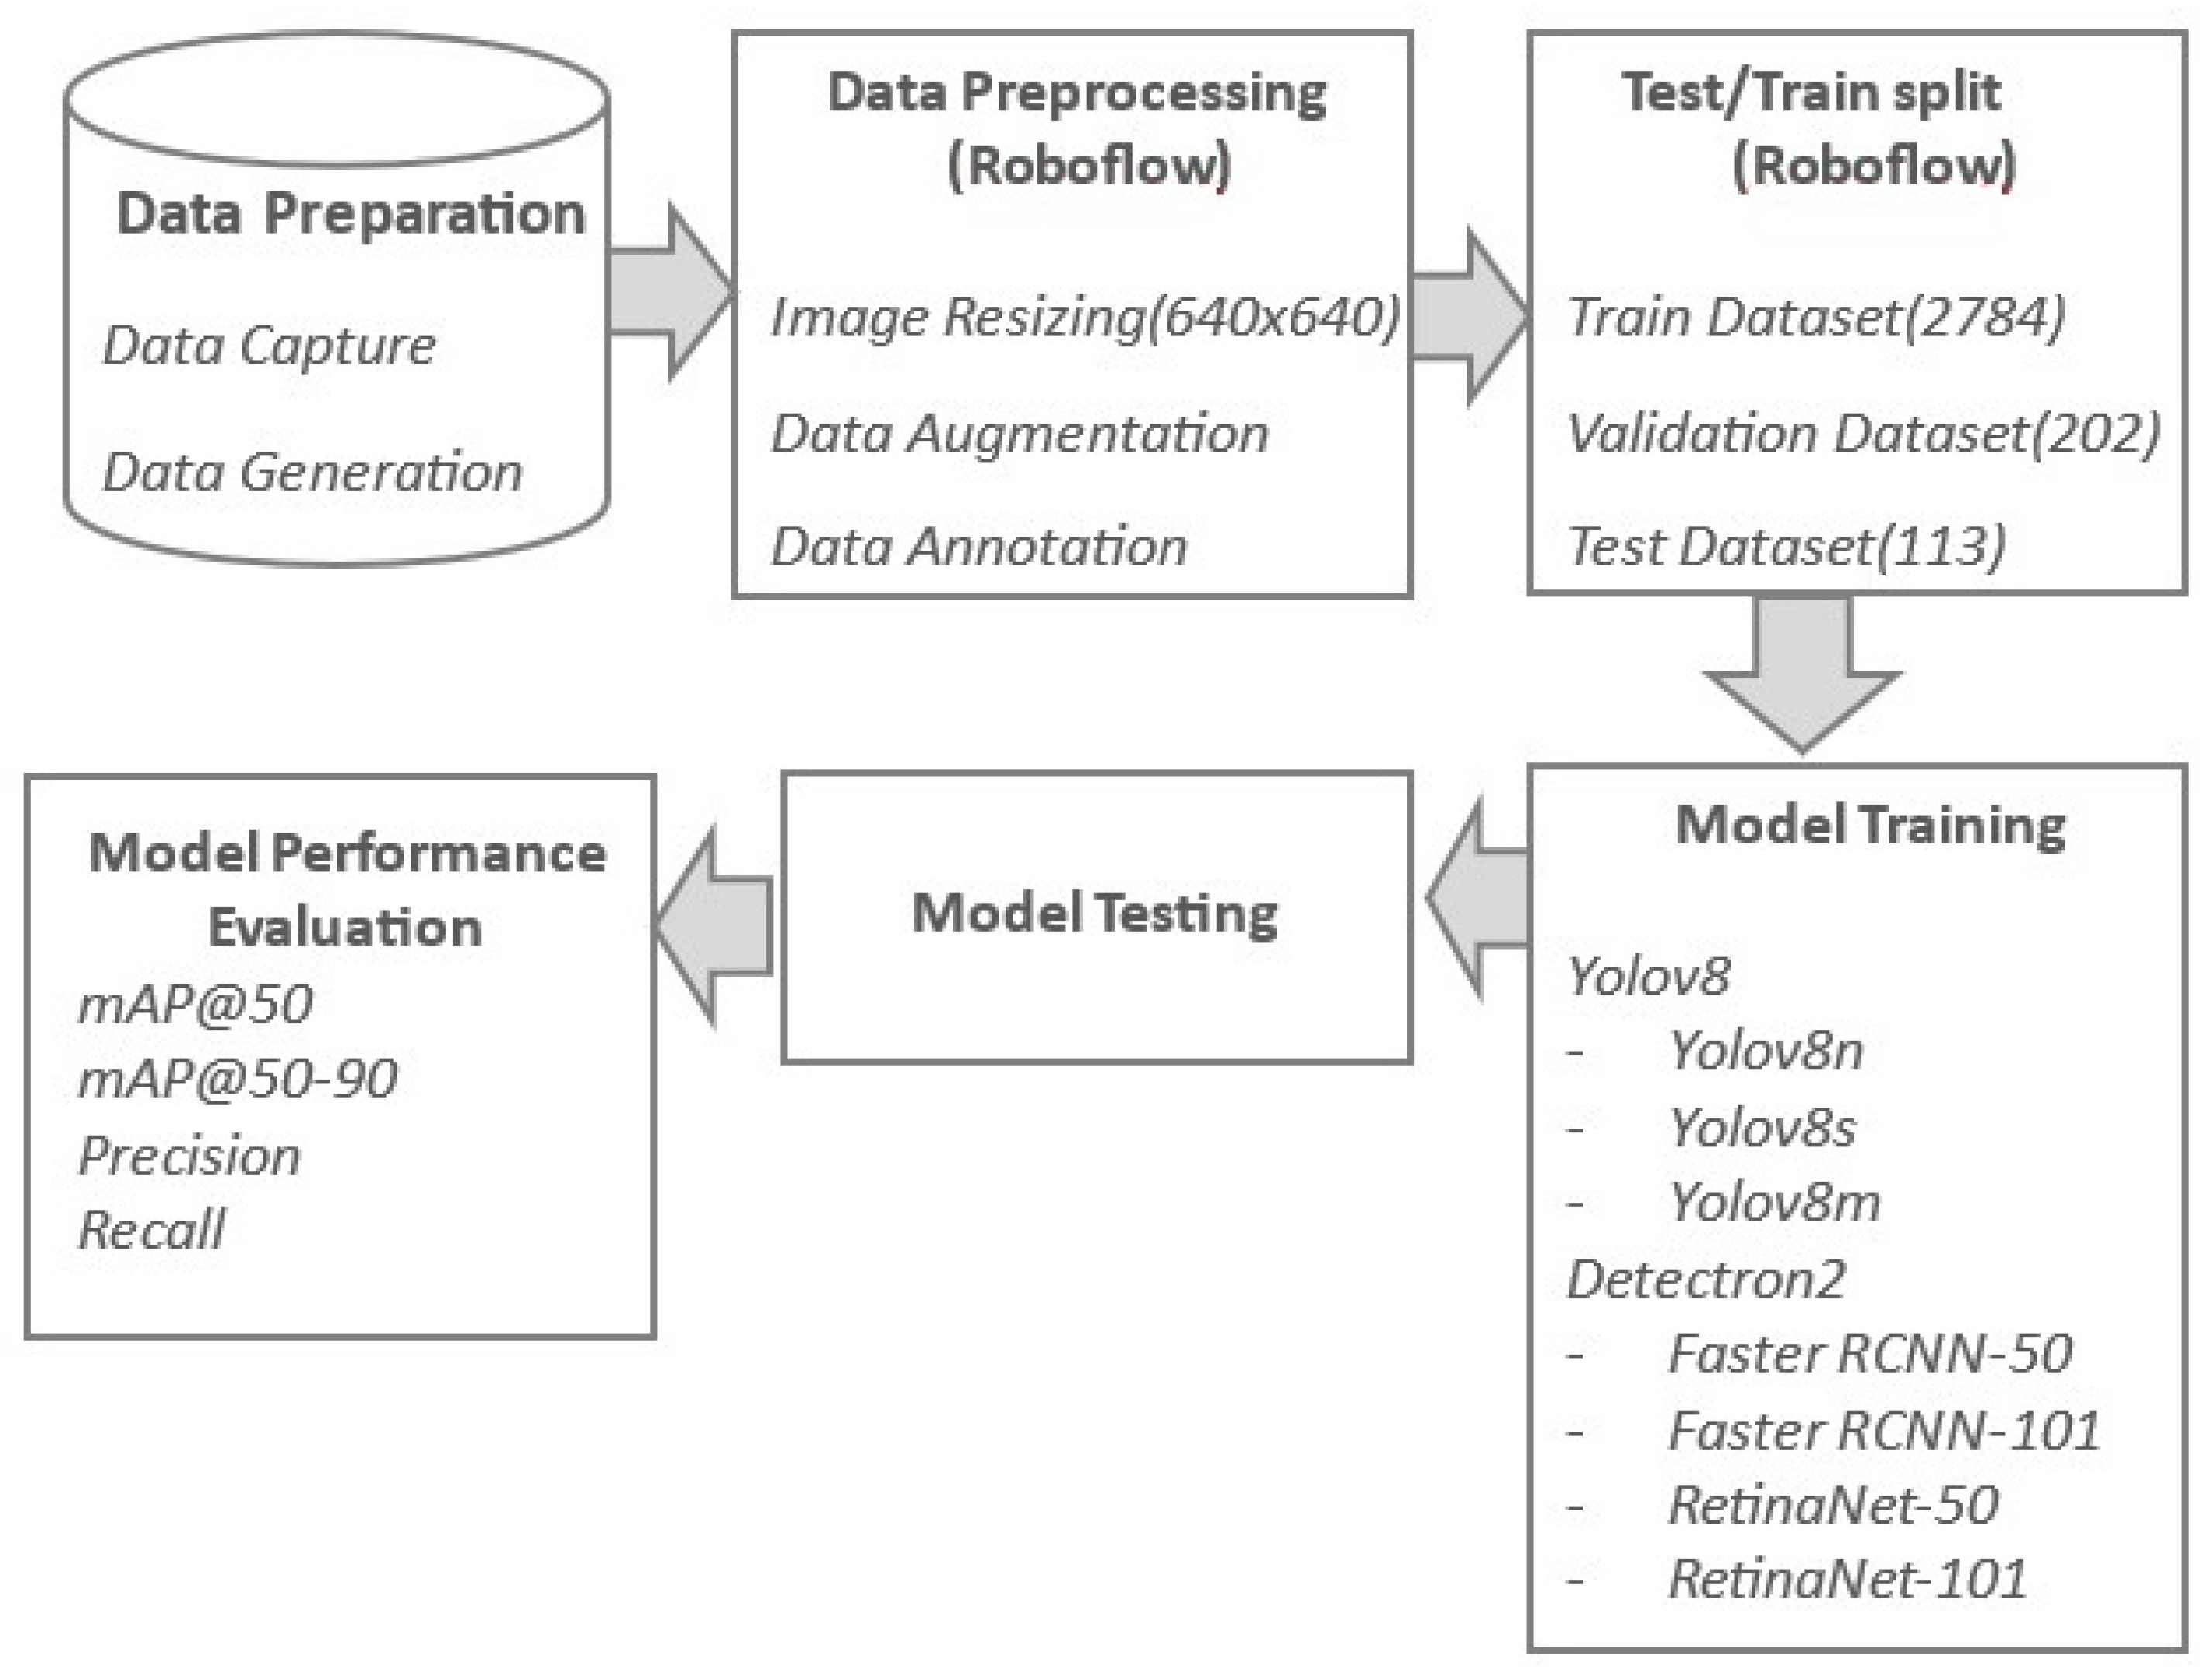
3. Materials and Methods

3.1. Dataset and Preprocessing

The collection and processing of data are crucial steps in any research. The section explains how the dataset was gathered, followed by some processing techniques to prepare it. The images were distributed into three folders: 2784 images for training, 202 images for validation, and 113 images were kept aside for final testing.

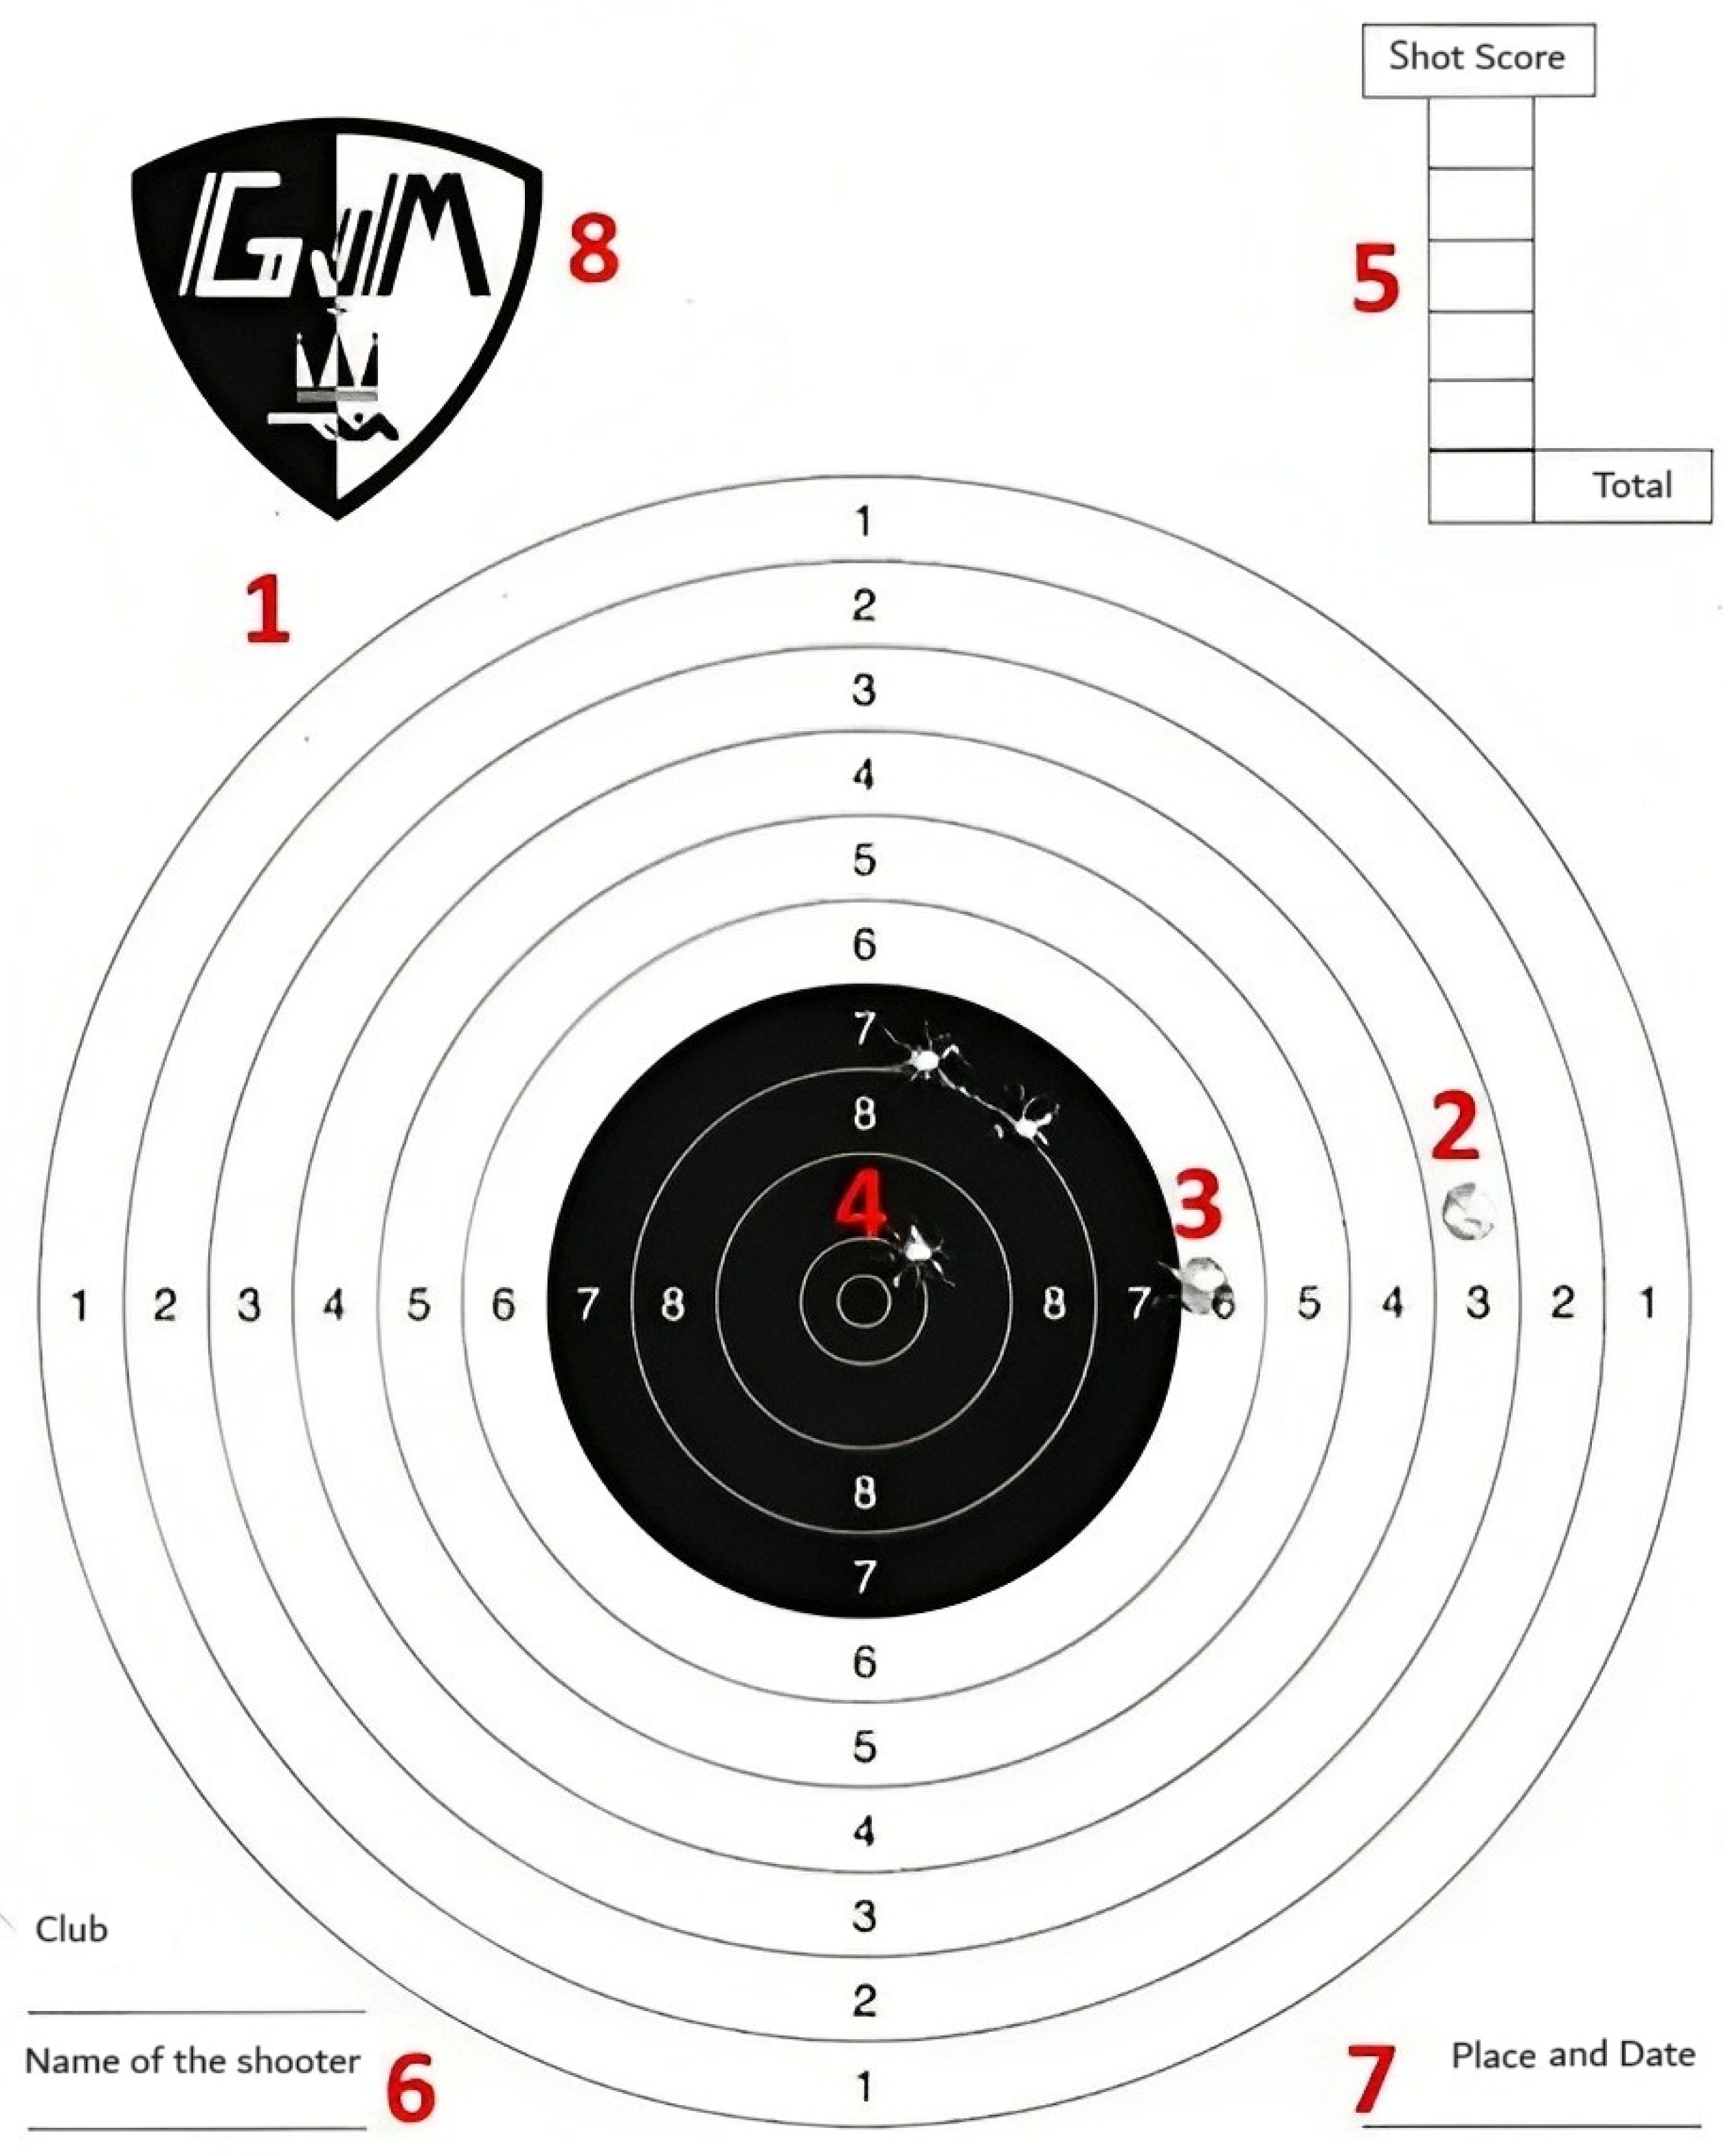
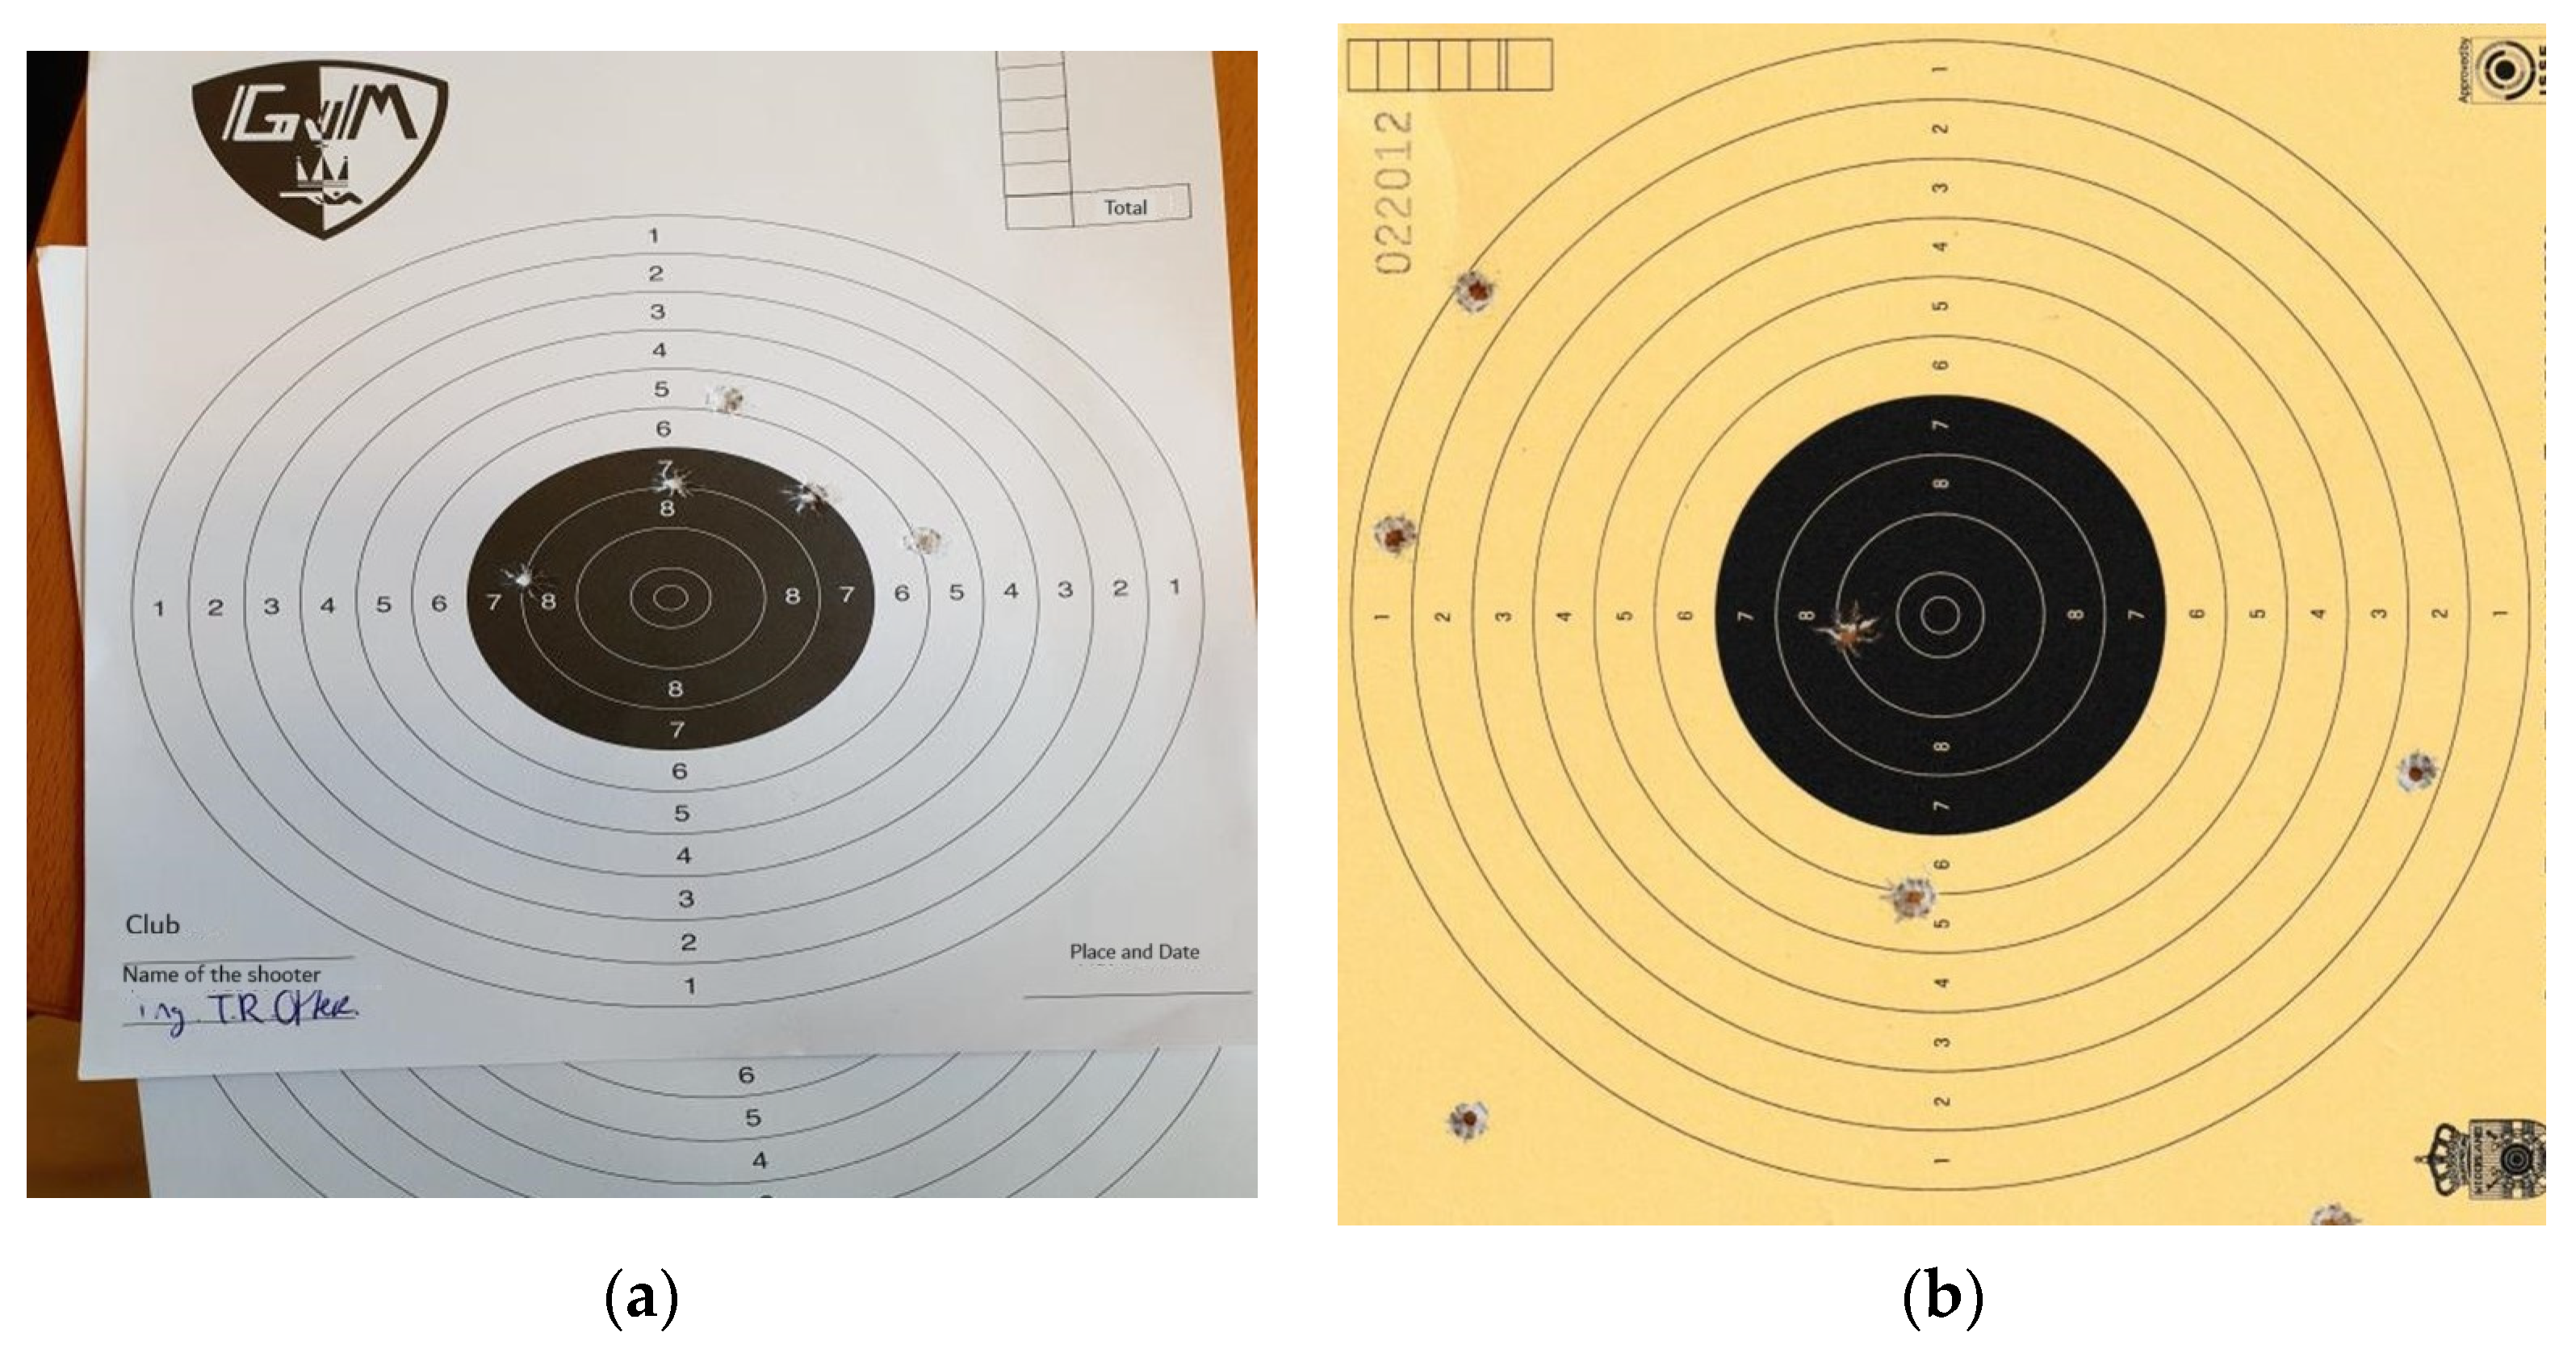
3.1.1. Initial Data Collection

The initial data for the paper were collected from shooters at a shooting range in Haarlem, the Netherlands. The dataset comprises ten unique cards, each of which is 26 by 26 cm in size and has ten different rings. These rings are assigned a score value ranging from 1 to 10, with a value of 0 assigned for a missed shot. If a shooter shoots inside the 7-ring but breaks the 8-ring’s line, a score of 8 is given for that shot. Similarly, if a shooter shoots the same bullet hole, the same score is assigned for that shot. Figure 3 shows an example of the shooting card obtained from the shooting range with annotations to provide a clear understanding of the various elements of the card.
The following is a numbered list of the different components and their respective meanings:
a.
Label 1 is the main target of 10 concentric rings, with the outer ring worth 1 point and the bull’s eye worth 10 points.
b.
Label 2 is a bullet hole representing a shot fired by a shooter with a score of 2.
c.
Label 3 is a bullet hole that crosses the next ring and refers to a bullet hole where the major part was shot in the 6-point area, but the mark touches the 7-point boundary. In such cases, a score of 7 is awarded to the shooter.
d.
Label 4 is a bullet hole that crosses the next ring and denotes a shot fired on the bullseye line, where the highest score ring is considered for scoring purposes. In this instance, the shooter hits the bullseye, and a score of 10 is assigned for this shot.
e.
Label 5 is the Shot score, where the shooter records the score for each of the five shots fired during the session. These scores are added to obtain the total score.
f.
Label 6 is the club’s and shooter’s names.
g.
Label 7 is where the shooter indicates the shooting range’s location and the session’s date.
h.
Label 8 is the logo of the shooting club.

3.1.2. Data Generation

To include samples in the dataset with shots from different locations on the shooting card, a Python script was written to generate more data. To create data, a series of images of a blank target was generated, and then, five times randomly, a spot within the target was chosen for a bullet hole to be placed. The generator has around sixty different bullet holes in total. These bullet holes are cut out from actual images of shooting cards and have had their background removed. The bullet holes were randomly rotated and regenerated based on the width and height of the detected target. If the randomly generated proposed bullet location is in the black circle, the bullet hole PNG kept it as realistic as possible. The generation of bullet holes on the target is shown in Figure 4.
In total, around forty percent of the dataset consists of generated data. An argument against using this type of generation could be that this could make the model too focused to detect a specific type of bullet hole. Still, the model predicts the bullet holes directly as classes. The model learns the class of the annotated bullet hole mainly based on the context of where it is located and not by the way it looks.

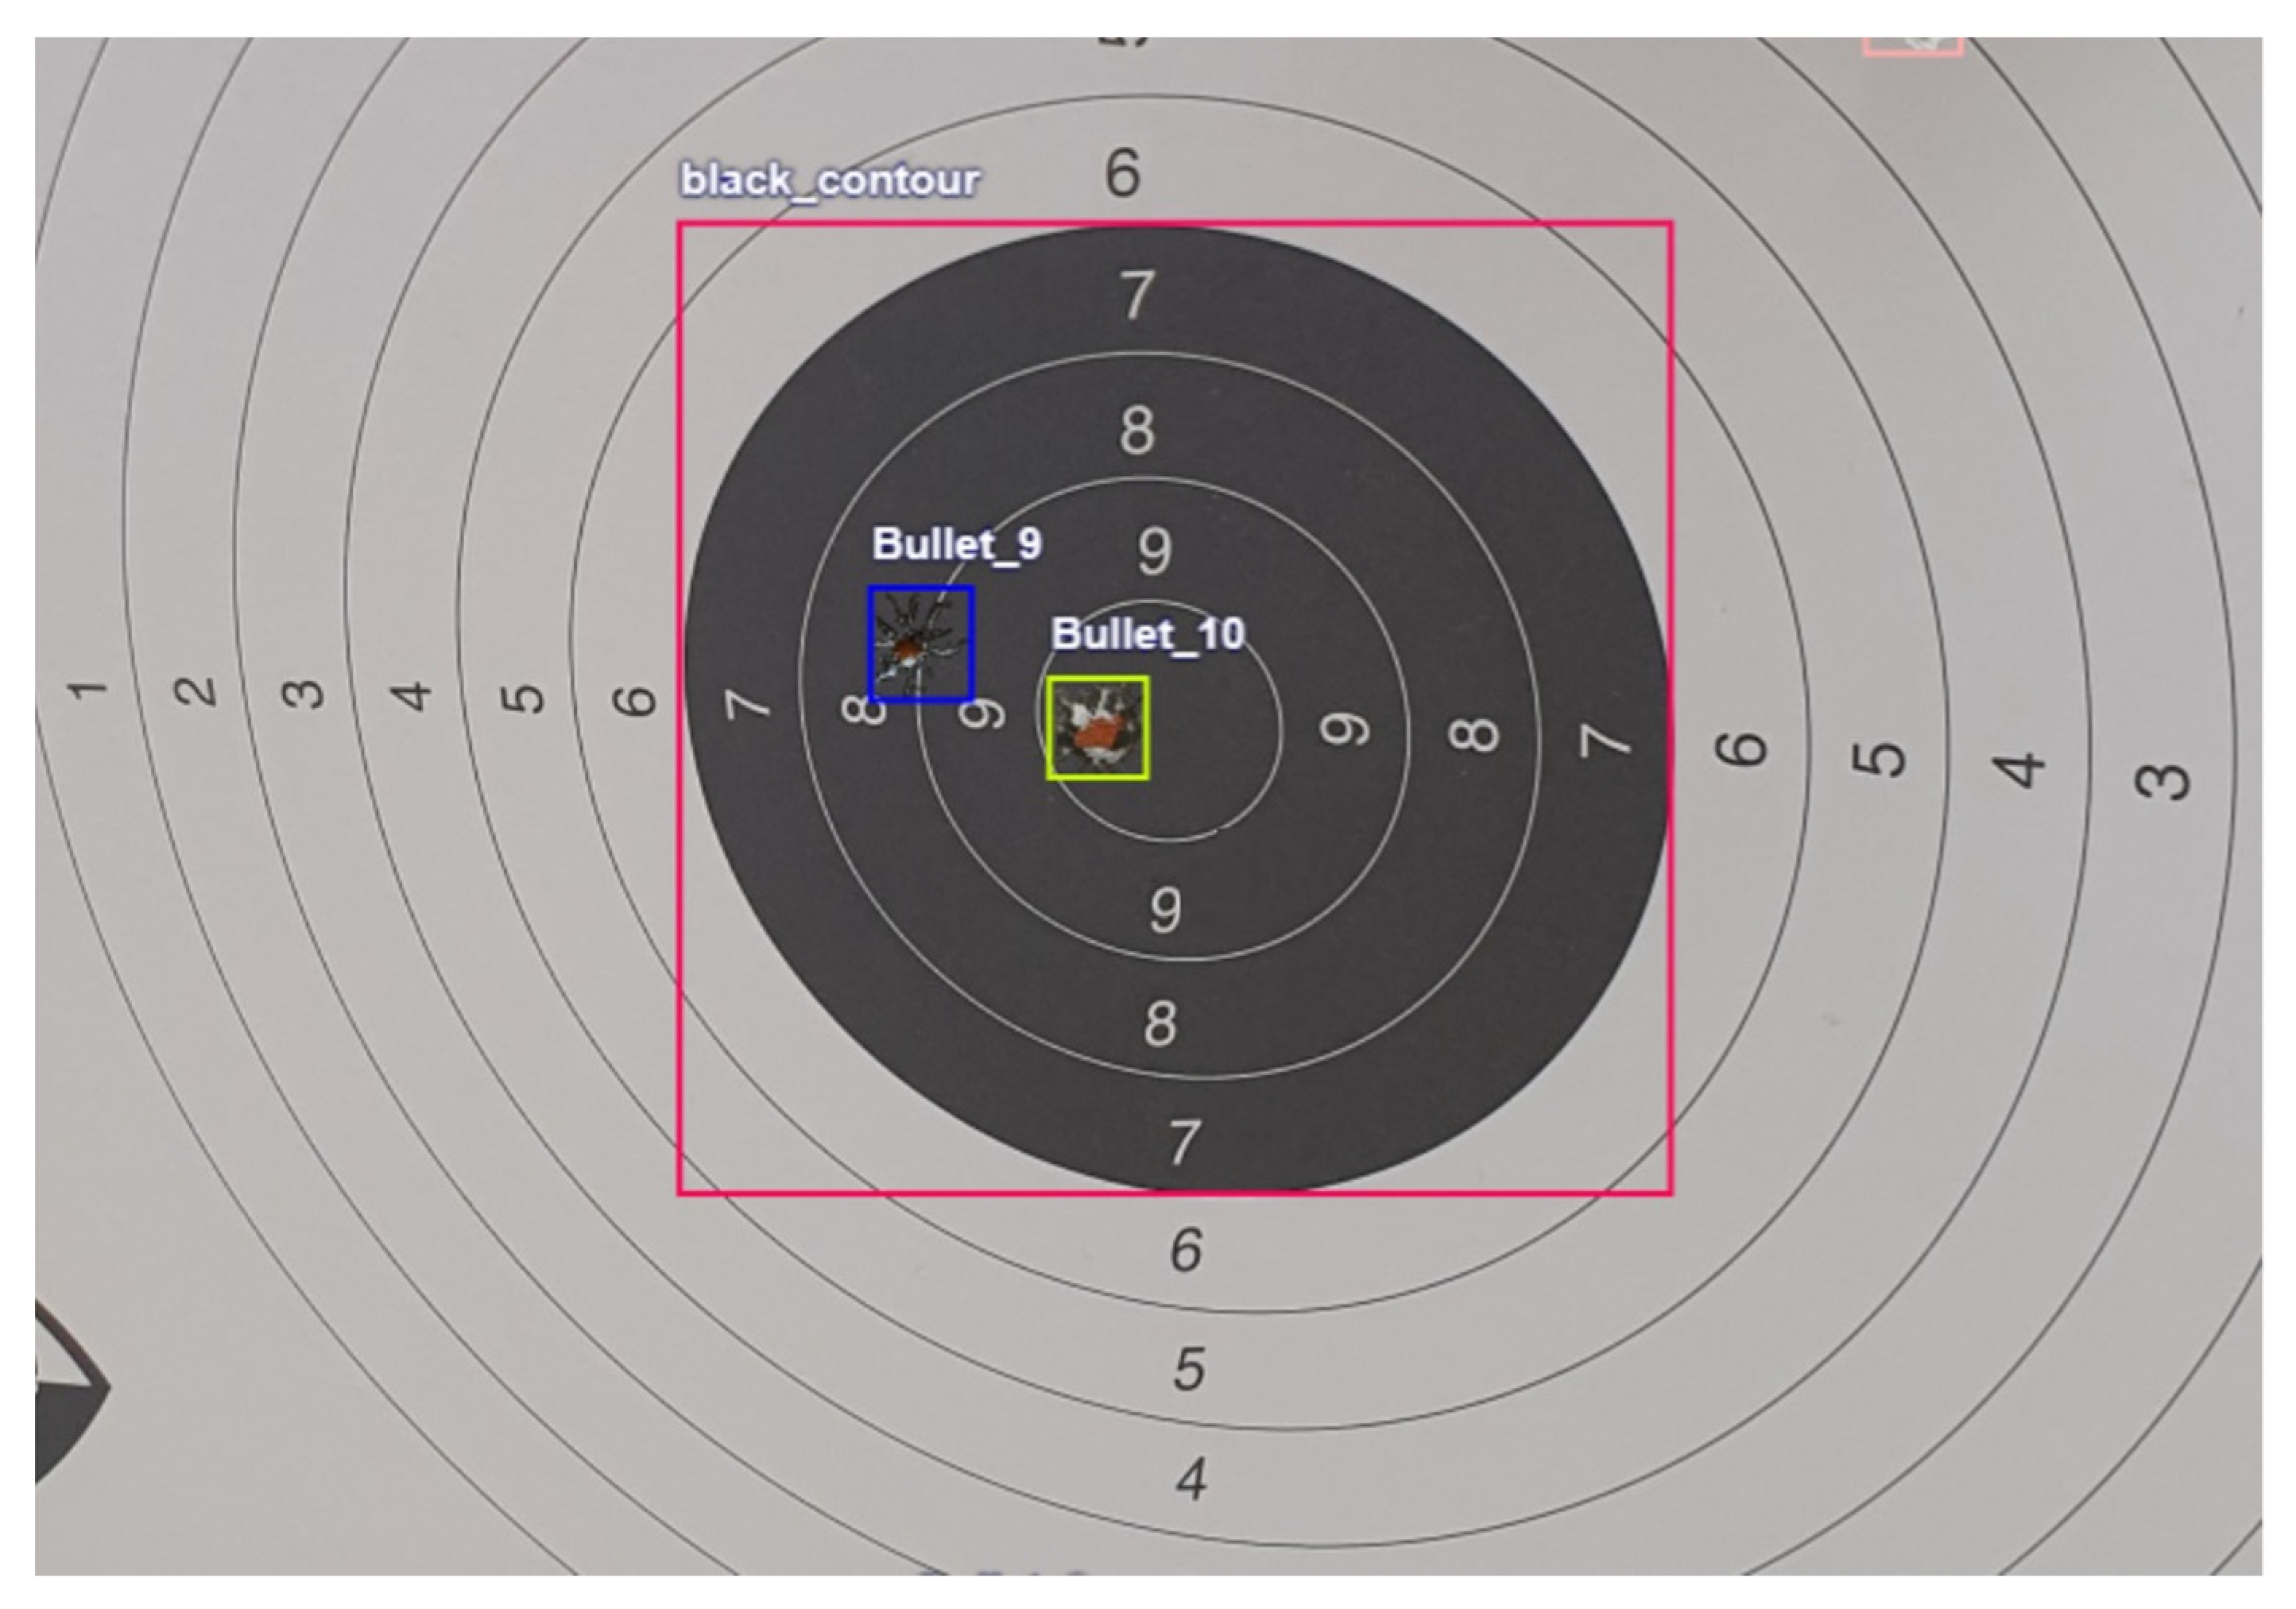
3.1.3. Data Annotation

A total of 1243 original images were annotated using Roboflow API. Table 1 shows all of the different classes annotated in the dataset. Technically, only the bullet hole classes are necessary to calculate the score, but the target and the black inner circle were also annotated. This can be a helpful feature when the photo taken has a shooting card at varied distances. The last column of the table represents how many times each class has been annotated in the dataset. Classes like the “Target” and the “Black contour” were most annotated because they appear on every image. The lowest annotated class is ten since this is the smallest area and the least likely to be hit by either random generation or actual humans.
An example of annotations is shown in Figure 5. Every bullet has a different class concerning the score. Figure 5 shows an edge case when a bullet hole touches the boundary. The hole appears to be more in ring eight than in ring nine. In the dataset, this is annotated as a nine. This is because corners of the bullet hole cross into ring nine, which means the advantage could be given to the shooter.

3.1.4. Data Augmentation

Before the annotated dataset was used for model training, images were resized to 640 × 640. The reason for resizing is to adjust images for the pre-trained models as they require the images in that shape. Secondly, the dataset was expanded to increase its size and avoid overfitting. The size of the dataset is developed by creating multiple copies of each original image. These numerous copies are made by applying operations (e.g., rotation, skew, flip, shift, etc.) on the original image. This dataset expansion technique is known as data augmentation. Table 2 shows all the implemented augmentations using Roboflow API.

3.2. Models

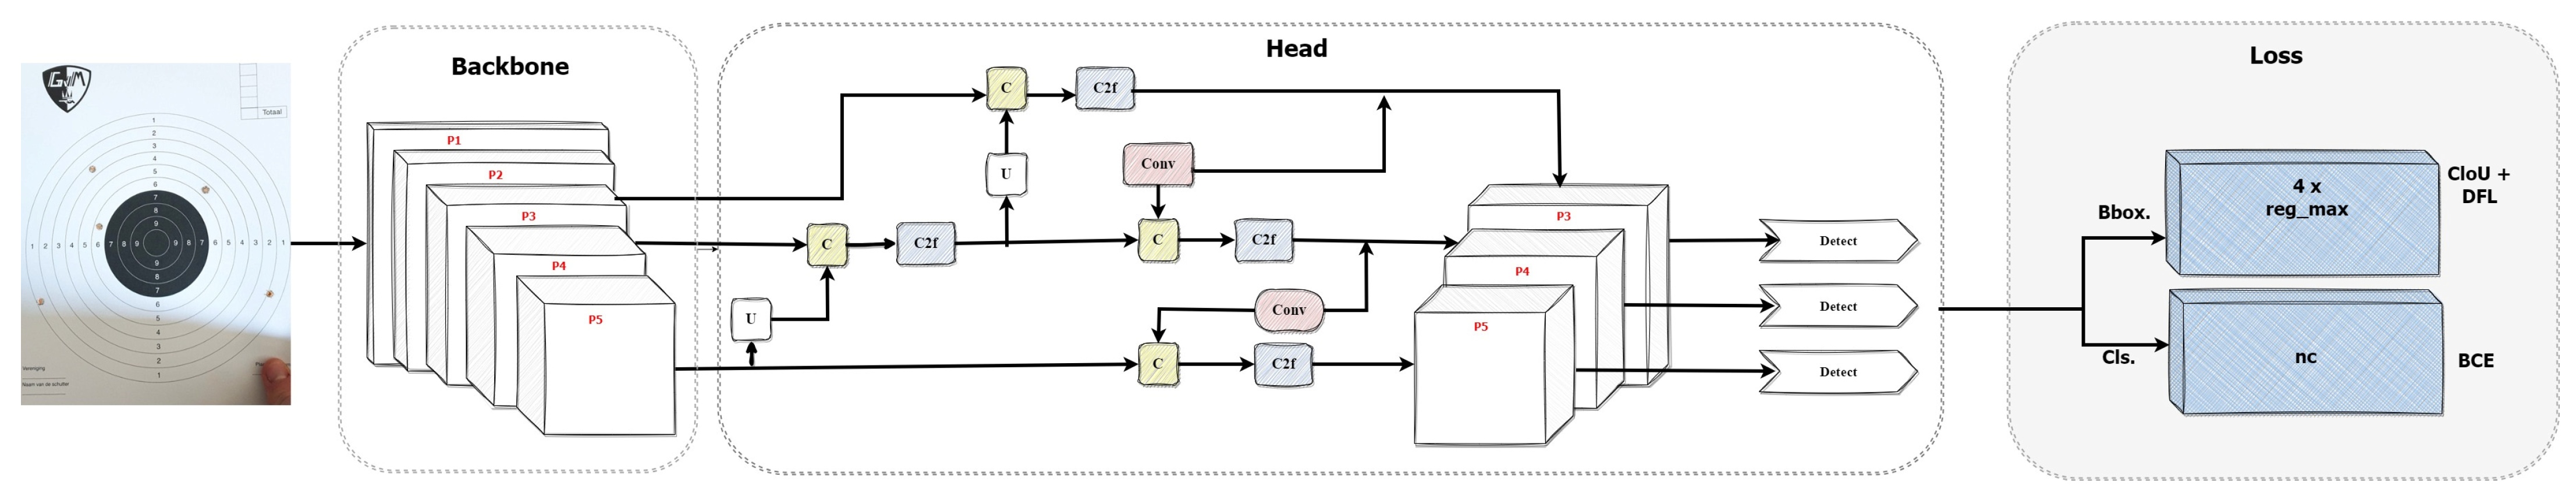
3.2.1. You Only Look Once (YOLO)

YOLO belongs to the single-shot detection category, and its first version was published in 2015 [22]. It carries out object detection by splitting the image into a k × k grid of equal dimensions. Each grid is responsible for detecting the object if its center falls inside the grid. A grid can predict a few bounding boxes with a specific confidence value. Each predicted bounding box comprises five values, i.e., x and y values for the center of the bounding box, width, height, and confidence value. To choose the most representative bounding box in the grid and remove the excess boundary boxes, YOLO uses the intersection over union (IoU) and non-max suppression (NMS) methods, respectively [23]. YOLOv8 is the latest version of the YOLO algorithm and was released by Ultralytics in July 2023. The entire architecture of YOLOv8 can be split into two main parts, the backbone and the head, as shown in Figure 6.
YOLOv8 uses a modified CSPDarknet53 as a backbone [24]. The backbone starts with two convolutional layers. Each convolutional layer consists of a convolutional layer and a batch normalization with the activation function SiLI (Sigmoid Linear Unit). YOLOv8 uses a spatial pyramid pooling fast (SPPF) module at the end of the backbone. The SPPF layer intends to speed up the computation by pooling features of different scales into a fixed-size feature map. An SPPF layer consists of one convolutional layer and three max pooling layers. The output of each pooling layer is then concatenated into a single output. Then, one more layer of convolution is applied.
YOLOv8 makes use of a decoupled head. This means that the classification and the object detection are treated separately. The activation function for object detection is sigmoid, representing the probability of a bounding box containing an object. The softmax function is used for the classification probability of each class. In Figure 4, the three outputs in the head region are for objectness, classification, and regression. The head of YOLOv8 is anchor-free, eliminating the need for anchor boxes and thus making the model easy to train on different datasets. YOLOv8 is also the first version to introduce soft NMS instead of NMS. This means overlapping bounding boxes are not entirely removed; the target information is preserved, eventually reducing cases like FP and FN [25].
YOLOv8 has five further variants ranging from nano-scale to extra-large models. The choice of these models is to be made based on the tradeoff between the required accuracy and the inference time [26]. In the case of finding the points scored on a shooting card, speed is of significant importance. For this reason, nano, small, and medium versions of YOLOv8 are used to identify the model that can provide a good combination of accuracy and speed.

3.2.2. Detectron2

Detectron was released by Facebook AI Research on 9 October 2019, as an upgrade to the original detectron2 framework. This framework is primarily designed for object detection and instance segmentation tasks. The framework is built on the PyTorch deep learning library, enabling integration with other neural network architectures and facilitating experimentation. Detectron2 consists of four main components: the backbone, the neck, the region proposal network (RPN), and the head.
Figure 7 shows the architecture of detectron2. The backbone is responsible for feature extraction from the input image, using various architectures such as ResNet, ResNeXt, and MobileNet. These architectures are often pre-trained on large-scale image datasets like ImageNet. The pretraining process involves training a network on many labeled images from ImageNet to learn general visual representations. ImageNet is an extensive dataset that leverages the hierarchical organization provided by WordNet, a lexical database. The backbone network consists of several convolutional layers organized hierarchically. These layers gradually down-sample the spatial dimensions of the feature maps while increasing the number of channels [27].
The neck component, implemented as the feature pyramid network (FPN), refines the feature maps obtained from the backbone. The FPN combines features from different scales to create a multiscale feature pyramid, enabling the detection of objects at various sizes and scales within the image. Feature pyramids are a fundamental element in recognition systems that enable the detection of objects at multiple scales [28]. However, specific modern deep learning-based object detectors, like YOLO, do not contain this part and are called single-shot detectors.
After analyzing multi-scale features, the region proposal network (RPN) generates approximately 1000 box proposals, each with a confidence score. These proposals represent potential bounding boxes encompassing objects of interest within the image. Detectron2 utilizes a box head to crop and wrap feature maps into multiple fixed-sized features. A maximum of 100 boxes are filtered out using NMS.
From the detectron2 framework, four models are selected. These models are Faster RCNN-50, Faster RCNN-101, RetinaNet-50, and RetinaNet-101, characterizing FPN and the backbone with either Resnet 50 or 101. Faster RCNN is a two-shot detector recognized as the first model that combines the features of region proposals with object classification [29]. It comprises two parts, i.e., the first is CNN-based, which proposes regions, and the second is the detector [30]. On the other hand, RetinaNet is a single-shot detector that uses an FPN backbone on the top of the feedforward Resnet to produce a multiscale feature pyramid [28]. RetinaNet is available in 2 sizes, a 50-layer and 101-layer network known as RetinaNet-50 and RetinaNet-101, respectively. RetinaNet uses a focal loss function, enabling it to achieve an accuracy comparable to the two-shot detector (e.g., Faster RCNN) while having a faster speed [31].

3.3. Evaluation Metrics

After training and validating the models, the performance of the trained models is measured by running the model on the test dataset. Choosing the right metrics for assessing the performance of object detection models can be challenging. Mostly, the models use precision, recall, and mean average precision (mAP) as metrics. These metrics are defined as follows.

3.3.1. Precision and Recall

Precision is the measurement of the correct predictions made by the model, indicating the model’s reliability for truthful predictions. However, recall refers to the number of measurements the model correctly predicted as relevant to the pertinent total predictions. Equations (1) and (2) present the expressions used to calculate these scores.
Precision (P) = TP/TP + FP
Recall (R) = TP/TP + FN
where TP refers to true positives (when the algorithm correctly detects a bullet hole with the bounding box), FP represents false positives (when the bounding box is generated on a location without having any bullet hole), and FN corresponds to false negatives (when a bullet hole is undetected). The IoU between the ground truth and the generated bounding box is calculated using Equation (4). In each image, for every object, if the value of IoU is above the predetermined threshold (mostly 0.5), then that is regarded as a TP; otherwise, the result is an FP. A trained model generates a TP by using the coordinates of the bounding box and the confidence score (the confidence for each detection made by the model).

3.3.2. Average Precision and Mean Average Precision

Average precision (AP) is the area under the precision–recall curve and is calculated as shown in Equation (3).
AP = k = 0 n 1 R e c a l l k R e c a l l k + 1 × P r e c i s i o n s ( k )
IoU = (Object ∩ Detected box)/(Object ∪ Detected box)
The value of AP is between 0 and 1 to summarize the different precision values into a single value representing the average of all precisions. Moreover, mean average precision (mAP) is calculated by taking the average of AP values for all classes and is shown in Equation (5).
mAP = 1 n i = 1 n A P i
Primarily, two different threshold values are used by object detection models, i.e., mAP50 (mean of AP with confidence values between 0 and 0.50) and mAP50-90 (the mean of AP with confidence scores between 0.50 and 0.95). For object detection models, precision, recall, mAP50, and mAP50-95 are considered the most common metrics [32]. The detectron2 framework generates some other metrics, as listed below:
  • AP75: This metric calculates the average precision at 75% overlap. It measures the precision at different recall values, considering a detection as TP if the IoU overlap is at least 75%.
  • APl: The “average precision (large)” calculates the precision at different recall values for objects with large sizes (area > 962). It focuses on evaluating the performance of detecting larger objects accurately.
  • APm: This metric is the average precision (medium) and measures the precision at different recall values for objects with medium sizes (322 > area > 962). It is used to assess the performance of detecting objects of moderate dimensions.
  • APs: The “average precision (small)” calculates the precision at different recall values for objects with small sizes (area < 322). It evaluates the model’s ability to detect smaller objects accurately
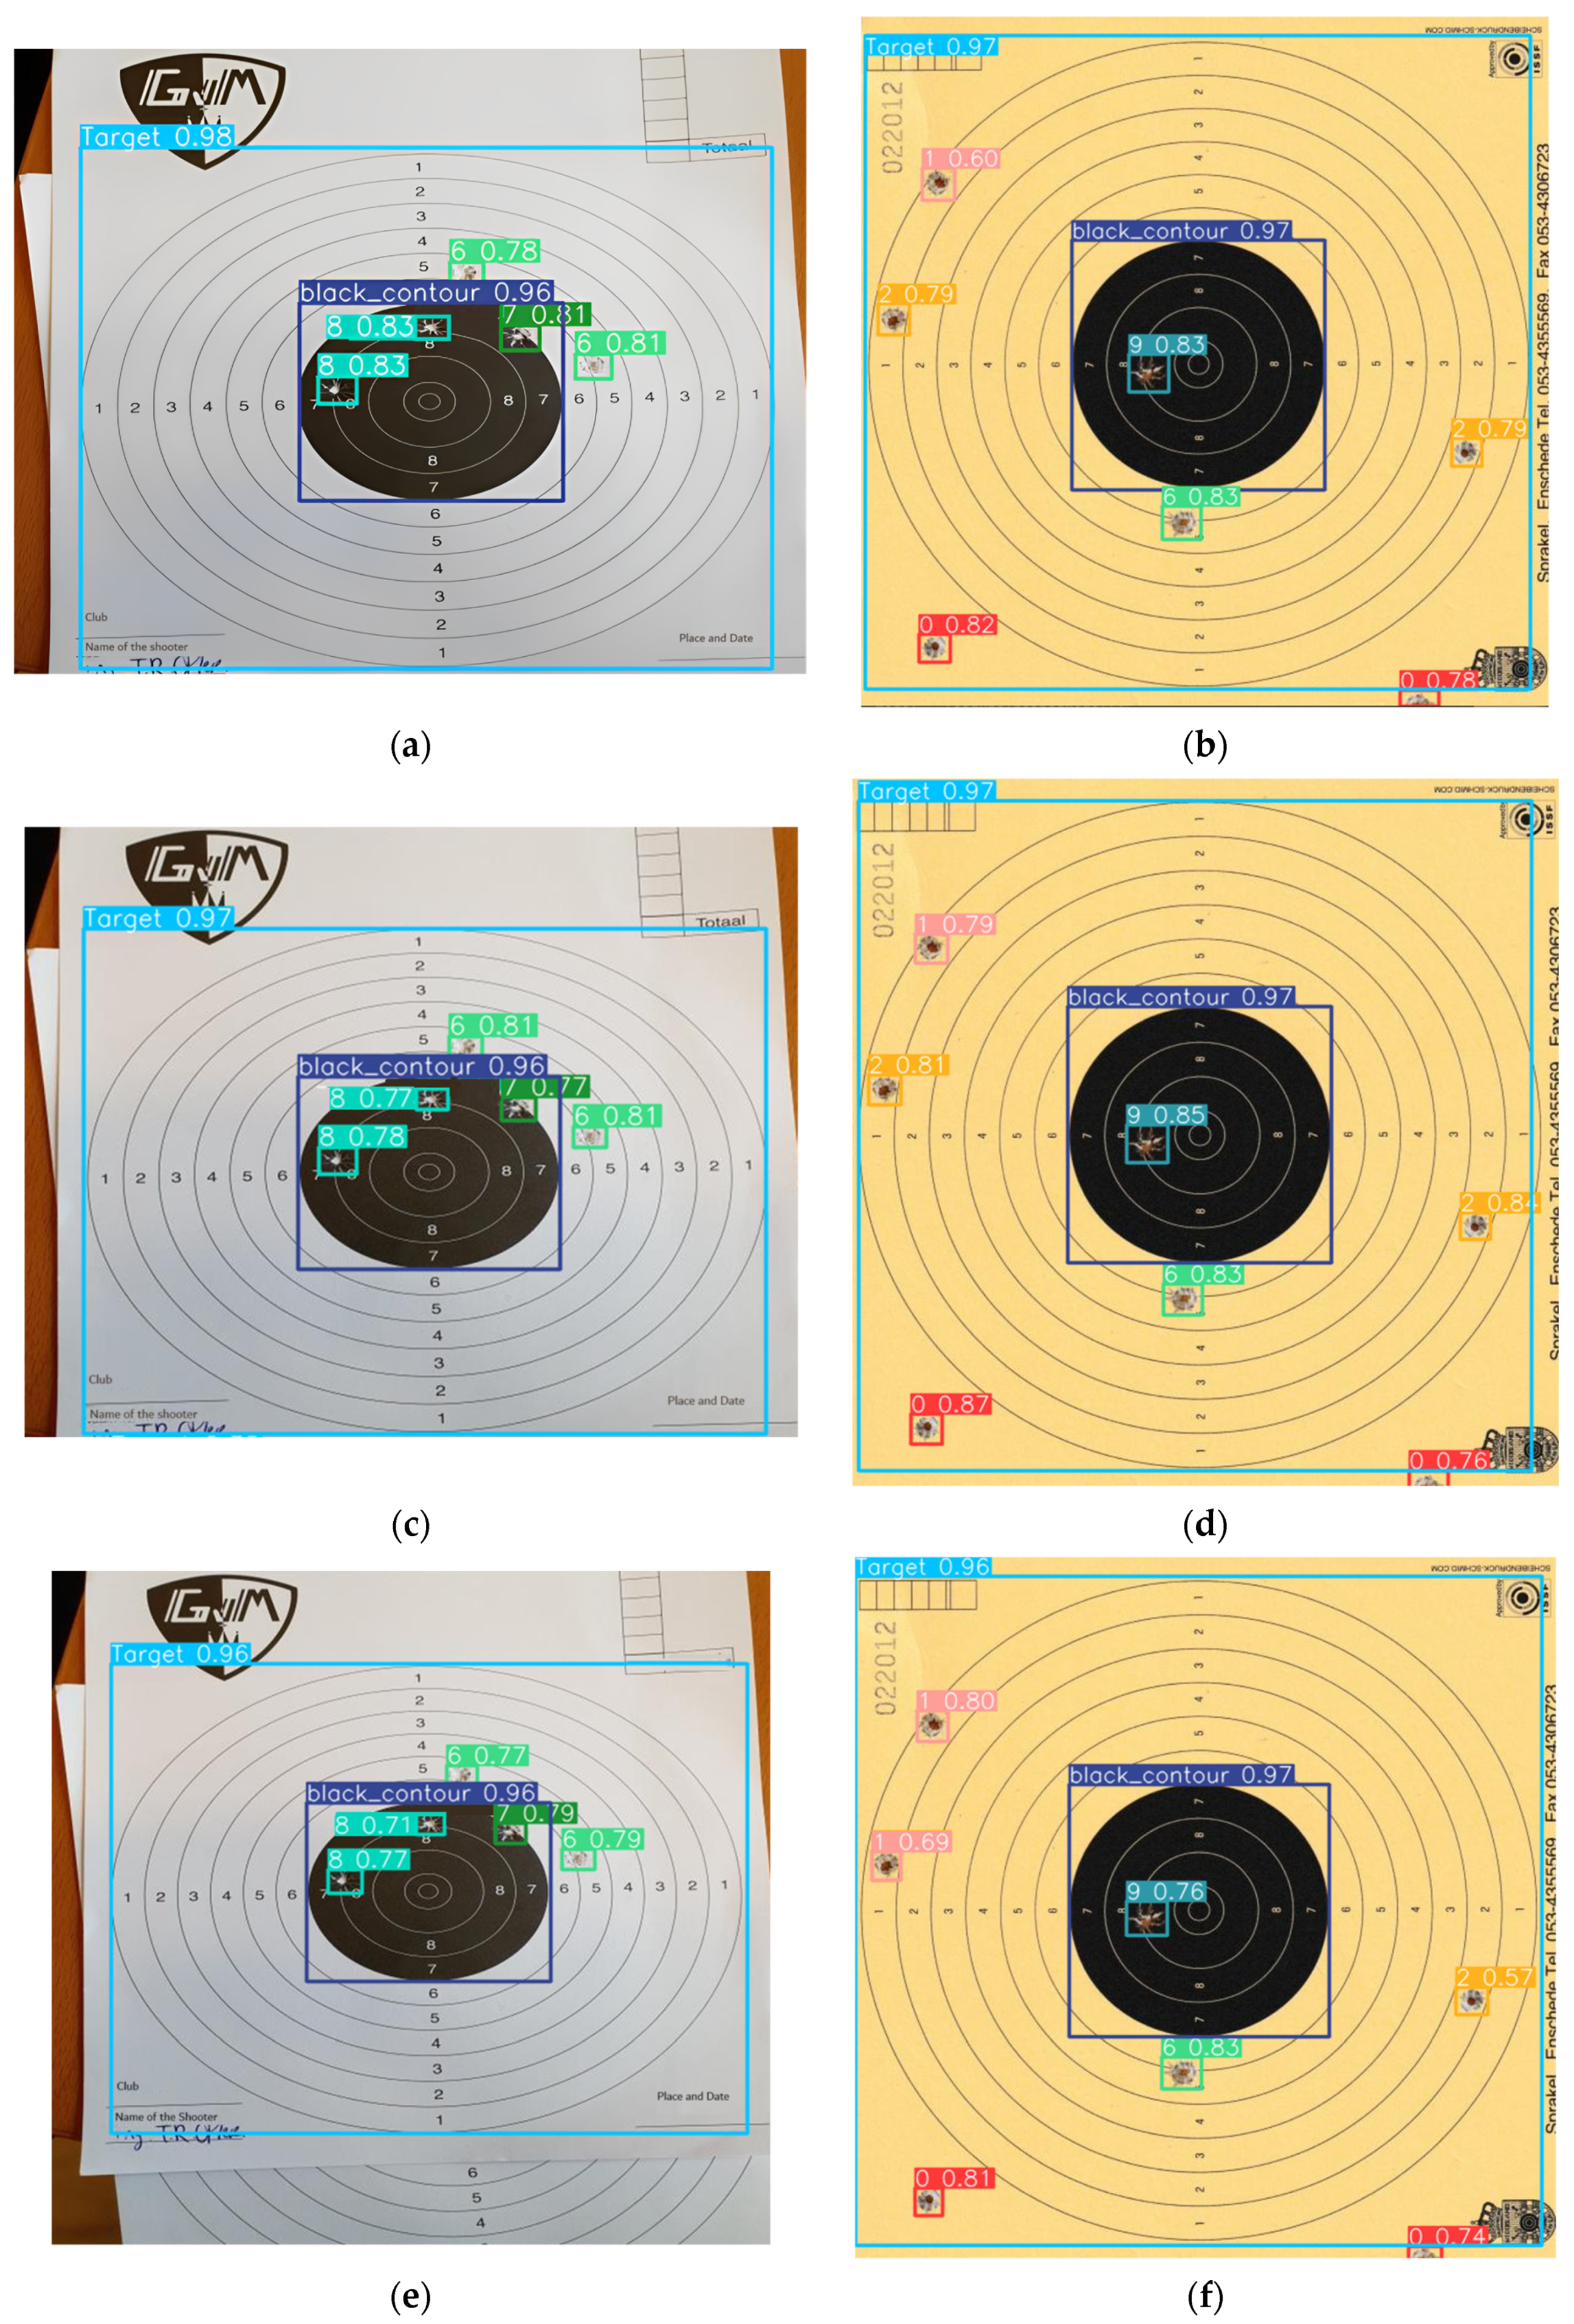
4. Results

The seven models trained on the custom dataset include RetinaNet-50, RetinaNet-101, Faster RCNN-50, Faster RCNN-101, and three variants of YOLOv8. Four models (RetinaNet-50, RetinaNet-101, Faster RCNN-50, and Faster RCNN-101) are trained using the detectron2 framework and based on the feature pyramid network (FPN) architecture. A test dataset comprising 113 images was used to assess the performance of the trained models. The AP scores from testing RetinaNet-50, RetinaNet-101, Faster RCNN-50, and Faster RCNN-101 across thirteen classes are shown in Table 3. The variations in the AP capture the models’ precision and recall capabilities at different IoU thresholds, providing insights into their ability to localize the target and bullet holes accurately.
Table 4 shows the different variations in the precision and recall scores of RetinaNet-50, RetinaNet-101, Faster RCNN-50, and Faster RCNN-101. The metrics in Table 4 include variations of average recall (AR). These variations of AR capture the models’ recall capabilities at various IoU thresholds, reflecting their abilities to localize the target and bullet holes accurately.
Table 5 shows the performance of three variant models of YOLOv8 across the detection of all thirteen classes. The three variant models of YOLOv8 are nano (YOLOv8n), small (YOLOv8s), and medium (YOLOv8m). The table includes the mAP scores of all three models at two different threshold values, i.e., 50 and 50–90. The three variants indicate the architectural size of the model, so their comparison facilitates finding a model that is good in accuracy and speed.
Table 6 shows the precision and recall metrics of YOLOv8 models. The speed metric is included because it is significant for the real-time application of bullet hole detection.

5. Discussion

The results shared in the previous section show the significant difference between the performance of detectron2 and YOLO models. The mAP50 scores of these models range from 71.8% to 97%. RetinaNet-101 obtained the lowest precision value of 66.41%, while YOLOv8m achieved the highest mAP value of 96.7%. All three YOLOv8 models outperformed the detectron2 models. The best-performing detectron2 model is the Faster RCNN-101, with an AP50 score of 89.8%. YOLO v8 models also generated the speed metrics, which indicates that though YOLOv8 performs the best (with the highest mAP value of 96.7%), the time taken by the model is 5.7 ms which is more than double the time taken by the YOLOv8s model (which also performed well, with an mAP value of 96.5%). So, if the inference time is the critical requirement in a real-time environment, then YOLOv8s is a better choice. To gain more insight into the performance of these models on the test dataset, two images from the test dataset are randomly chosen and are shown in Figure 8.
The bullet hole detection results from the two chosen test images by the detectron2 models are shown in Figure 9. The colored highlighted boxes show the detection outcome of the model. Two number values are located atop; the first integer indicates the shooter’s score, and the second decimal value is the confidence score. It can be seen that the localization of bullet holes is sound, with clear bounding boxes around the holes. RetinaNet models have lower confidence values of bullet hole scores than their Faster R-CNN counterparts. Another thing that should not be overlooked is that these models exhibit some errors in their classification capabilities regarding classes ranging from 2 to 10. The models classify one point/class higher than the actual value. This is something that all models trained via detectron2 share, and it is worth noting that this could be because the detectron2 models share the FPN architecture.
Figure 10 shows the bullet hole detection results of the YOLOv8n, YOLOv8s, and YOLOv8m models, respectively. Notably, all three models exhibit good results, accurately identifying and localizing objects within the images.
However, it is interesting to discuss one particular observation in the testing results (in test image-2), where the bullet is mainly in the ring 1 region, while a slight corner is touching the ring 2 region’s boundary. The YOLOv8 nano and small models classified it as a 2 with confidence scores of 0.79 and 0.81, respectively. This particular bullet hole could be more accurately classified as a 1, highlighting the potential limitation of YOLOv8n and YOLOv8s. YOLOv8m rightly detected and labeled it 1 with a 0.69 confidence score. Nevertheless, it is worth noting that, in most cases, the advantage is given to the competitor, meaning that a human eye might also make this error.
Table 7 shows the summarized performance of all seven models on the test dataset. As shown, there are two best candidates for better detection of bullet holes and score points. One is YOLOv8m, with the highest mAP50 value of 96.7%, recall value of 94%, and inference speed of 5.7 ms, while the other option is YOLOv8s, with the mAP50 value of 96.5%, the recall value of 93.6%, and the best inference speed of 2.3 ms. The study’s results are very similar to those achieved by Kubera et al. [33]. Though they used the older version of YOLO (YOLOv5) to detect three classes of pollen grains, YOLOv5l (large) performed the best, with an mAP50-95 value of 91.5%. Similarly, in another research on detecting three different types of tomatoes, i.e., ripe, unripe, and diseased tomatoes, the performance of different models was compared by Yang et al. [34]. The comparison showed that YOLOv8 performed significantly better than Faster RCNN with high precision, recall, and inference speed values.
The better performance of the most advanced YOLOv8 models over other models could be associated with its ability to use bigger feature maps and a newer backbone network (Darnet-53), which is more efficient. Big feature maps filter complex relationships among features and recognize patterns and objects. Due to better feature aggregation and improvised activation function, YOLOv8 variants achieved better accuracy and speed.

6. Conclusions

The study investigated whether automating the detection of bullet holes on a target from shooting cards can be made possible by using object detection models. The results demonstrated that it is possible to detect these scores correctly if the training and validation dataset annotations are performed carefully. In total, thirteen classes/objects were annotated from the shooting cards to train the model, and YOLOv8m, which is a single-shot detector, performed the best, with the highest mAP value of 96.7%. The poorest performance was given by RetinaNet-101, which is also a single-shot detector, with an mAP value of 66.4%. From the same single-shot category, three lightweight models from the YOLO family were also used, and it is seen that besides having fast inference speed, they can detect multiple objects. If the setup is implemented in a real-time environment, YOLOv8s can generate competitive accuracy (mAP value 96.5%) at a higher speed (more than double) than YOLOv8m. To further improve the accuracy of YOLOv8s and YOLOv8m models, it is suggested to involve images from all classes, including overlapped bullet holes, to have equally annotated instances for training. Moreover, during the annotations of complex cases (e.g., when the bullet holes reside on boundaries between two numbers or when multiple bullet holes overlap), help from some game experts to identify which class the spot belongs to may improve the performance. The dataset is intended to be expanded for future research, incorporating more complex cases of overlapped and boundary-shot holes for the model to detect holes and scores in real-time.

Author Contributions

Conceptualization, N.G., J.M. and R.S.; methodology, N.G., J.M. and R.S.; validation, N.G., J.M. and R.S.; formal analysis, N.G., J.M. and R.S.; investigation, N.G., J.M. and R.S.; data curation, N.G., J.M. and R.S.; writing—original draft preparation, M.B., N.G., J.M. and R.S.; resources, M.B.; writing—review and editing, M.B. and A.d.K.; visualization, N.G., J.M. and R.S.; supervision, M.B. and A.d.K. All authors have read and agreed to the published version of the manuscript.

Funding

No external funding or grant was received.

Institutional Review Board Statement

Not applicable.

Informed Consent Statement

Not applicable.

Data Availability Statement

The data used in this study are made available at Bullet hole object detection Dataset > Overview (roboflow.com). All details of the conducted experiments and used data can be found under the link https://universe.roboflow.com/project-bat-bullet-hole-detection/bullet-hole-object-detection accessed on 13 December 2023.

Acknowledgments

The authors thank Katrin Tazelaar and Thijs Otter for providing support and help.

Conflicts of Interest

The authors declare no conflict of interest.

References

  1. Jiang, H.; Wang, J.; Gong, Y.; Rong, N.; Chai, Z.; Zheng, N. Online Multi-Target Tracking with Unified Handling of Complex Scenarios. IEEE Trans. Image Process. 2015, 24, 3464–3477. [Google Scholar] [CrossRef] [PubMed]
  2. Issa, A.H.; Hasan, S.D.; Ali, W.H. Automation of Real-Time Target Scoring System Based on Image Processing Technique. J. Mech. Eng. Res. Dev. 2021, 44, 316–323. [Google Scholar]
  3. Du, F.; Zhou, Y.; Chen, W.; Yang, L. Bullet Hole Detection Using Series Faster-RCNN and Video Analysis. In Proceedings Volume 11041, Eleventh International Conference on Machine Vision (ICMV 2018), Munich, Germany, 1–3 November 2018; SPIE: Bellingham, WA, USA, 2019; Volume 11041. [Google Scholar] [CrossRef]
  4. Yu, Y.; Cao, M.W.; Yu, F. Evibe: An Improved Vibe Algorithm for Detecting Moving Objects. Chin. J. Sci. Instrum. 2014, 35, 925–932. [Google Scholar]
  5. Gao, Y.; Wang, A.M.; Wang, F.H. Application of Improved Wavelet Transform Algorithm in Image Fusion. Laser Technol. 2013, 37, 690–695. [Google Scholar]
  6. Luo, J.; Zhang, Z.; Zeng, G. A Bullet Holes Detection Algorithm Based on Wavelet Transform and Image Fusion. In Proceedings of the 2nd Information Technology and Mechatronics Engineering Conference (ITOEC 2016), Chongqing, China, 21–22 May 2016. [Google Scholar] [CrossRef]
  7. Liu, Q.; Chen, Y. Research on Automatic Target-Scoring Method Based on Video Image Analysis. Comput. Eng. 2019, 41, 212–215. [Google Scholar]
  8. Ruolin, Z.; Jianbo, L.; Yuan, Z.; Xiaoyu, W. Recognition of Bullet Holes Based on Video Image Analysis. IOP Conf. Ser. Mater. Sci. Eng. 2018, 261, 012020. [Google Scholar] [CrossRef]
  9. Ali, F.; Mansoor, A.B. Computer Vision Based Automatic Scoring of Shooting Targets. In Proceedings of the 2008 IEEE International Multitopic Conference, Karachi, Pakistan, 23–24 December 2008; pp. 515–519. [Google Scholar] [CrossRef]
  10. Rudzinski, J.; Luckner, M. Low–Cost Computer Vision Based Automatic Scoring of Shooting Targets. In Knowledge Engineering, Machine Learning and Lattice Computing with Applications; Graña, M., Toro, C., Howlett, R.J., Jain, L.C., Eds.; Springer: Berlin/Heidelberg, Germany, 2013; Volume 7828. [Google Scholar] [CrossRef]
  11. Zin, T.T.; Oka, I.; Sasayama, T.; Ata, S.; Watanabe, H.; Sasano, H. Image Processing Approach to Automatic Scoring System for Archery Targets. In Proceedings of the 2013 Ninth International Conference on Intelligent Information Hiding and Multimedia Signal Processing, Beijing, China, 16–18 October 2013; pp. 259–262. [Google Scholar] [CrossRef]
  12. Su, Z.; Chen, W. Effective Target Extraction of Automatic Target-Scoring System. In Proceedings of the 2019 IEEE 4th Advanced Information Technology, Electronic and Automation Control Conference (IAEAC), Chengdu, China, 20–22 December 2019; pp. 1402–1406. [Google Scholar] [CrossRef]
  13. Yun, J.; Jiang, D.; Liu, Y.; Sun, Y.; Tao, B.; Kong, J.; Tian, J.; Tong, X.; Xu, M.; Fang, Z. Real-Time Target Detection Method Based on Lightweight Convolutional Neural Network. Front. Bioeng. Biotechnol. 2022, 10, 861286. [Google Scholar] [CrossRef] [PubMed]
  14. Liu, Y.; Xiao, F.; Tong, X.; Tao, B.; Xu, M.; Jiang, G.; Chen, B.; Cao, Y.; Sun, N. Manipulator Trajectory Planning Based on Work Subspace Division. Concurr. Comput. 2022, 34, e6710. [Google Scholar] [CrossRef]
  15. Ren, F.; Bao, Y. A Review on Human-Computer Interaction and Intelligent Robots. Int. J. Info. Tech. Dec. Mak. 2020, 19, 5–47. [Google Scholar] [CrossRef]
  16. Zhan, W.; Sun, C.; Wang, M.; She, J.; Zhang, Y.; Zhang, Z.; Sun, Y. An Improved YOLOv5 Real-Time Detection Method for Small Objects Captured by UAV. Soft Comput. 2022, 26, 361–373. [Google Scholar] [CrossRef]
  17. Zhu, X.; Lyu, S.; Wang, X.; Zhao, Q. Tph-YOLOv5: Improved YOLOv5 Based on Transformer Prediction Head for Object Detection on Drone-Captured Scenarios. In Proceedings of the IEEE/CVF International Conference on Computer Vision, Montreal, QC, Canada, 11–17 October 2021; pp. 2778–2788. [Google Scholar]
  18. Chen, S.; Liao, Y.; Lin, F.; Huang, B. An Improved Lightweight YOLOv5 Algorithm for Detecting Strawberry Diseases. IEEE Access 2023, 11, 54080–54092. [Google Scholar] [CrossRef]
  19. Saydirasulovich, S.N.; Abdusalomov, A.; Jamil, M.K.; Nasimov, R.; Kozhamzharova, D.; Cho, Y.-I. A YOLOv6-Based Improved Fire Detection Approach for Smart City Environments. Sensors 2023, 23, 3161. [Google Scholar] [CrossRef] [PubMed]
  20. Jiang, D.; Li, G.; Sun, Y.; Kong, J.; Tao, B.; Chen, D. Grip Strength Forecast and Rehabilitative Guidance Based on Adaptive Neural Fuzzy Inference System Using sEMG. Pers. Ubiquit. Comput. 2019, 26, 1215–1224. [Google Scholar] [CrossRef]
  21. Liu, G.; Hu, Y.; Chen, Z.; Guo, J.; Ni, P. Lightweight Object Detection Algorithm for Robots with Improved YOLOv5. Eng. Appl. Artif. Intell. 2023, 123, 106217. [Google Scholar] [CrossRef]
  22. Redmon, J.; Divvala, S.; Girshick, R.; Farhadi, A. You Only Look Once: Unified, Real-Time Object Detection. In Proceedings of the 2016 IEEE Conference on Computer Vision and Pattern Recognition (CVPR), Las Vegas, NV, USA, 27–30 June 2016; pp. 779–788. [Google Scholar]
  23. Sportelli, M.; Apolo-Apolo, O.E.; Fontanelli, M.; Frasconi, C.; Raffaelli, M.; Peruzzi, A.; Perez-Ruiz, M. Evaluation of YOLO Object Detectors for Weed Detection in Different Turfgrass Scenarios. Appl. Sci. 2023, 13, 8502. [Google Scholar] [CrossRef]
  24. Reis, D.; Kupec, J.; Hong, J.; Daoudi, A. Real-Time Flying Object Detection with YOLOv8. arXiv 2023, arXiv:2305.09972. [Google Scholar]
  25. Meng, X.; Liu, Y.; Fan, L.; Fan, J. YOLOv5s-Fog: An Improved Model Based on YOLOv5s for Object Detection in Foggy Weather Scenarios. Sensors 2023, 23, 5321. [Google Scholar] [CrossRef]
  26. Kulkarni, U.; Naregal, K.; Farande, V.; Guttigoli, S.; Angadi, A.; Ujwane, R. An Object Detection Approach for Automated Detection of Groove Line in Tube Yoke. ITM Web Conf. 2023, 53, 01007. [Google Scholar] [CrossRef]
  27. Ju, R.Y.; Cai, W. Fracture Detection in Pediatric Wrist Trauma X-ray Images Using YOLOv8 Algorithm. arXiv 2023, arXiv:2304.05071. [Google Scholar] [CrossRef]
  28. Lin, T.-Y.; Dollar, P.; Girshick, R.; He, K.; Hariharan, B.; Belongie, S. Feature Pyramid Networks for Object Detection. In Proceedings of the IEEE Conference on Computer Vision and Pattern Recognition (CVPR), Honolulu, HI, USA, 21–26 July 2017. [Google Scholar]
  29. Ren, S.; He, K.; Girshick, R.; Sun, J. Faster R-CNN: Towards Real-Time Object Detection with Region Proposal Networks. In Proceedings of the Advances in Neural Information Processing Systems; Cortes, C., Lawrence, N., Lee, D., Sugiyama, M., Garnett, R., Eds.; Curran Associates, Inc.: Red Hook, NY, USA, 2015; Volume 28. [Google Scholar]
  30. Girshick, R. Fast R-CNN. In Proceedings of the IEEE International Conference on Computer Vision (ICCV), Santiago, Chile, 7–13 December 2015; pp. 1440–1448. [Google Scholar]
  31. Lin, T.-Y.; Goyal, P.; Girshick, R.; He, K.; Dollar, P. Focal Loss for Dense Object Detection. In Proceedings of the IEEE International Conference on Computer Vision, Venice, Italy, 22–29 October 2017; pp. 2980–2988. [Google Scholar]
  32. Dang, F.; Chen, D.; Lu, Y.; Li, Z. YOLOWeeds: A Novel Benchmark of Yolo Object Detectors for Multi-Class Weed Detection in Cotton Production Systems. Comput. Electron. Agric. 2023, 205, 107655. [Google Scholar] [CrossRef]
  33. Kubera, E.; Kubik-Komar, A.; Kurasiński, P.; Piotrowska-Weryszko, K.; Skrzypiec, M. Detection and Recognition of Pollen Grains in Multilabel Microscopic Images. Sensors 2022, 22, 2690. [Google Scholar] [CrossRef] [PubMed]
  34. Yang, G.; Wang, J.; Nie, Z.; Yang, H.; Yu, S. A Lightweight YOLOv8 Tomato Detection Algorithm Combining Feature Enhancement and Attention. Agronomy 2023, 13, 1824. [Google Scholar] [CrossRef]
Figure 1. Workflow of proposed methodology.
Ai 05 00005 g001
Figure 2. Development of YOLO over the years.
Ai 05 00005 g002
Figure 3. Target sample with regions of interest.
Ai 05 00005 g003
Figure 4. Clean target with generated bullet holes.
Ai 05 00005 g004
Figure 5. Bullet annotations.
Ai 05 00005 g005
Figure 6. YOLOv8 architecture.
Ai 05 00005 g006
Figure 7. The architecture of Detectron2.
Ai 05 00005 g007
Figure 8. Two random images from the testing set: (a) test image-1 with a white target; (b) test image-2 with a yellow target.
Ai 05 00005 g008
Figure 9. Results of bullet hole detection by detectron2 models: (a) performance of faster RCNN-101 on test image-1; (b) performance of faster RCNN-101 on test image-2; (c) performance of faster RCNN-50 on test image-1; (d) performance of faster RCNN-50 on test image-2; (e) performance of RetinaNet-50 on test image-1; (f) performance of RetinaNet-50 on test image-2; (g) performance of RetinaNet-101 on test image-1; (h) performance of RetinaNet-101 on test image-2.
Ai 05 00005 g009aAi 05 00005 g009b
Figure 10. Results of bullet hole detection by YOLOv8 models: (a) performance of YOLOv8n on test image-1; (b) performance of YOLOv8n on test image-2; (c) performance of YOLOv8s on test image-1; (d) performance of YOLOv8s on test image-2; (e) performance of YOLOv8m on test image-1; (f) performance of YOLOv8m on test image-2.
Ai 05 00005 g010
Table 1. Classes annotated in the dataset.
ClassDescriptionNumbers of Annotations
TargetBounding box around the biggest circle1257
Black_contourBounding box around the black
circle, which contains the 7, 8, 9, and 10
1250
Bullet_0A bullet hole on paper but not in any rings839
Bullet_1Bullet hole in the first ring376
Bullet_2Bullet hole in the second ring440
Bullet_3Bullet hole in the third ring506
Bullet_4Bullet hole in the fourth ring480
Bullet_5Bullet hole in the fifth ring555
Bullet_6Bullet hole in the sixth ring595
Bullet_7Bullet hole in the seventh ring712
Bullet_8Bullet hole in the eighth ring588
Bullet_9Bullet hole in the ninth ring541
Bullet_10Bullet hole in the tenth ring257
Table 2. Different annotations implemented on the dataset.
Techniques UsedValue
FlippingHorizontal, Vertical
Grayscale25% of all images
SaturationBetween −72% and +72%
BrightnessBetween −30% and +0%
Table 3. AP values of detectron2 models (at IoU0.50-0.95).
Category
(Classes)
Faster RCNN-50RetinaNet-50Faster RCNN-101RetinaNet-101
223.66624.45418.12218.720
550.96631.04953.82730.420
840.08541.22541.67535.022
Target97.38596.41196.24796.810
050.09646.97839.13445.852
344.57034.77857.49035.819
644.62328.23440.76728.667
933.35925.17740.14922.677
Black contour95.93097.09597.74097.630
151.01152.82850.45939.879
448.68840.16760.04238.381
737.61734.93438.74826.850
1024.60020.02716.76522.617
Table 4. AP and AR scores of detectron2 models.
ModelAP
IoU = 0.50–0.95
AP50AP75APsAPmAPlARARsARmARl
Faster RCNN-5049.43183.53145.33240.98155.11696.6160.6150.5460.6370.982
RetinaNet-5044.10471.33240.07134.69743.58297.1840.6100.5400.5420.986
Faster RCNN-10150.09083.55447.37941.54651.86697.0740.5960.5200.6120.981
RetinaNet-10141.48866.41638.72231.77541.37497.6360.6100.5410.4950.989
Table 5. AP scores of YOLOv8 models.
Category
(Classes)
YOLOv8n mAP50YOLOv8n
mAP50-95
YOLOv8s mAP50YOLOv8s mAP50-95YOLOv8m mAP50YOLOv8m
mAP50-95
00.9460.5240.9810.5350.9630.529
10.9340.5010.9580.5320.9640.555
100.9640.5540.9950.5930.9950.526
20.9260.5570.9290.5650.9180.586
30.9670.610.9820.6230.9850.634
40.9420.6060.9590.6210.9490.616
50.9320.5690.9430.570.9390.579
60.9410.5640.940.5930.9680.607
70.9620.5750.9520.5920.9720.601
80.840.4640.9390.5580.9380.555
90.9460.5690.980.6340.9870.615
Target0.9950.990.9950.9930.9950.993
Black contour0.9910.9870.9930.9890.9940.991
Table 6. Precision and recall metrics of YOLOv8 models.
ModelPrecisionRecallmAP50mAP50-95Speed (ms)
YOLOv8n0.9210.9120.9450.6212.69
YOLOv8s0.9470.9360.9650.6462.312
YOLOv8m0.9370.940.9670.6455.718
Table 7. Performance comparison of the models.
ModelAP50-95/mAP50-95 (%)AP50/mAP50(%)AR/Recall (%)Speed (ms)
Faster RCNN-5049.43183.53161.5--
Retinanet-5044.10471.33261.0--
Faster RCNN-10150.09083.55459.6--
Retinanet-10141.48866.41661.0--
YOLOv8n62.194.591.22.69
YOLOv8s64.696.593.62.312
YOLOv8m64.596.794.05.718
Disclaimer/Publisher’s Note: The statements, opinions and data contained in all publications are solely those of the individual author(s) and contributor(s) and not of MDPI and/or the editor(s). MDPI and/or the editor(s) disclaim responsibility for any injury to people or property resulting from any ideas, methods, instructions or products referred to in the content.

