Article

A Comparison of Convolutional Neural Network Transfer Learning Regression Models for Remote Photoplethysmography Signal Estimation

Department of Multimedia and Information-Communication Technology, University of Zilina, 010 26 Zilina, Slovakia
*
Author to whom correspondence should be addressed.
Submission received: 29 December 2024 / Revised: 22 January 2025 / Accepted: 23 January 2025 / Published: 1 February 2025
(This article belongs to the Section Medical & Healthcare AI)

Abstract

:
This study explores the extraction of remote Photoplethysmography (rPPG) signals from images using various neural network architectures, addressing the challenge of accurate signal estimation in biomedical contexts. The objective is to evaluate the effectiveness of different models in capturing rPPG signals from dataset snapshots. Two training strategies were investigated: pre-training models with only the fully connected layer being fine-tuned and training the entire network from scratch. The analysis reveals that models trained from scratch consistently outperform their pre-trained counterparts in extracting rPPG signals. Among the architectures assessed, DenseNet121 demonstrated superior performance, offering the most reliable results in this context. These findings underscore the potential of neural networks in advancing rPPG signal extraction, which has promising applications in fields such as clinical monitoring and personalized medical care. This study contributes to the integration of advanced imaging techniques and neural network-based analysis in biomedical engineering, paving the way for more robust and efficient methodologies.

1. Introduction

In the realm of remote patient monitoring and telemedicine, the advent of non-contact vital sign detection stands as a pivotal advancement [1]. The fusion of camera systems with advanced computer vision algorithms not only revolutionizes healthcare but also promises a host of practical benefits. By facilitating the extraction of crucial vital signs like heart rate, respiration rate, and oxygen saturation without the need for direct physical sensors, this technology not only reduces patient contact but also minimizes infection risks and enables large-scale deployment. Its potential impact is particularly pronounced in settings where infection control is of utmost importance, such as during pandemic outbreaks or in immunocompromised populations.
This paper embarks on an in-depth exploration of the progression from traditional Photoplethysmography (PPG) to its non-contact variant, Photoplethysmographic Imaging (PPGI), often referred to as Remote Photoplethysmography (rPPG) [2]. PPG, an optical technique grounded in the light absorption characteristics of skin tissues, has been a fundamental tool for monitoring cardiovascular function [3]. The method works by employing a light source and a photodetector to detect changes in blood volume, which correlate with physiological signals. While PPG is highly accurate and reliable in clinical environments, its requirement for direct skin contact limits its applicability in certain situations—such as with burn patients, neonates, or during surgeries—where skin contact may be undesirable or infeasible. These constraints have driven the shift towards the development of PPGI or rPPG. PPGI expands on the foundational principles of PPG by leveraging electromagnetic radiation, photodetectors, and camera systems to capture subtle variations in light intensity across larger skin surfaces [4]. This broader capability enables more diverse applications, including the monitoring of mucous membranes [5] and wound care [6], which would be difficult with traditional contact-based methods. By extending the spatial coverage and eliminating the need for physical sensors, PPGI introduces new flexibility in medical diagnostics.
In parallel with this technological evolution, neural networks have emerged as a crucial component in enhancing the accuracy and robustness of non-contact vital sign detection [7]. The capacity of neural networks to process complex visual data allows for more precise extraction of physiological signals from imagery, even in challenging conditions. For example, neural networks have demonstrated the ability to filter out noise caused by motion artifacts or variable lighting, which are significant hurdles in the practical implementations of rPPG [8]. However, despite their promise, neural networks are not without challenges. Their “black-box” nature raises questions about interpretability in medical contexts, where transparent and explainable models are essential for clinician trust [9]. Additionally, the accuracy of these models is heavily dependent on the quality and diversity of the training data, and they can be prone to biases if trained on narrow datasets.
Recent advancements in neural network architectures, such as convolutional neural networks (CNNs) and long short-term memory (LSTM) networks, have improved the state-of-the-art in non-contact signal processing [10]. These models are able to discern subtle temporal and spatial patterns in the visual data, refining the extraction of vital signs from video sequences. Nevertheless, future research must continue to focus on overcoming the limitations posed by real-world variability, ensuring that these systems are reliable across different patient populations and environmental settings. Furthermore, it is essential to distinguish between contact and non-contact signal acquisition methodologies. While traditional PPG requires direct contact with the skin to measure physiological signals, the focus of this research extends to non-contact methods, specifically PPGI and rPPG. Both rPPG and PPGI rely on camera-based systems to detect minute changes in skin color, which are indicative of underlying physiological processes.
Beyond clinical settings, non-contact vital sign detection holds promise in other fields, such as psychology. For instance, by evaluating physiological responses to external stimuli, this technology can offer new insights into stress levels, emotional reactions, and overall mental well-being [11]. This opens the door for applications in mental health monitoring, where continuous, unobtrusive assessments could complement traditional psychological evaluations [12]. While the technology is still in its early stages for these applications, the potential for non-invasive, objective data collection in this field could revolutionize the way mental health is understood and treated. The application of non-contact vital sign detection extends to various domains, including telehealth [13], neonatal care [14,15], and continuous patient monitoring [16]. In telehealth, these technologies enable remote diagnosis and monitoring, reducing the need for hospital visits and allowing healthcare professionals to track patient health in real time. In neonatal care, where minimizing physical contact is critical, non-contact monitoring provides a safe and effective solution for tracking vital signs in vulnerable infants.
Our study contributes to this growing body of literature by systematically comparing various CNN architectures that utilize transfer learning for regression tasks related to rPPG signal estimation. The significance of our research can be summarized as follows:
  • Exploration of Transfer Learning: By leveraging pre-trained models, we aim to reduce the need for large datasets while still achieving high performance in estimating rPPG signals. This is particularly important given the limited availability of high-quality datasets for training deep learning models in this domain.
  • Evaluation of Multiple Architectures: We rigorously assess different CNN architectures to identify which configurations yield the best performance for rPPG signal estimation. This comparative analysis not only highlights the strengths and weaknesses of each model but also provides insights into best practices for future research.
  • Addressing Practical Limitations: Our work emphasizes the practical limitations associated with existing methods, including issues related to generalizability and robustness under varying conditions. By focusing on transfer learning and model adaptation, we provide a pathway for developing more reliable rPPG estimation techniques that can be deployed in real-world scenarios.
  • Foundation for Future Research: The findings from our study serve as a foundation for further exploration into advanced techniques for rPPG signal extraction. By identifying effective models and methodologies, we pave the way for subsequent research aimed at enhancing the accuracy and applicability of non-invasive heart rate monitoring technologies.
The following section describes the current state of the problem. Section 3 introduces the concepts of neural networks, while Section 4 presents the achieved results. Finally, the last section concludes the paper and outlines future directions for further research.

2. State-of-the-Art

Remote Photoplethysmography (rPPG) has emerged as a promising tool for non-contact vital sign monitoring, with numerous studies advancing its applications. Wu et al. [17] proposed an Adaptive Neural Network Model Selection (ANNMS) approach to address luminance variations in outdoor scenarios for monitoring drivers’ heart rates. This approach reduces the effect of luminance, although it does not entirely eliminate it, as evaluated by metrics such as Mean Absolute Error (MAE). Here, the focus is on adapting neural models rather than specifying a particular architecture. This study focuses on facial rPPG signals but requires further research to overcome limitations like dependency on high-quality cameras.
Revanur et al. [18] made significant strides with the Vision for Vitals (V4V) Challenge, leveraging high-resolution videos synchronized with diverse physiological signals under naturalistic conditions. By providing varied scenarios, this work fosters the development and benchmarking of advanced video-based models, encouraging architectures that generalize spontaneous behavior, facial expressions, and lighting variations. This study identifies challenges in robust video-based physiological estimation, particularly under naturalistic conditions with spontaneous movements, illumination changes, and significant motion artifacts. Key limitations include inadequate evaluation protocols, data imbalances, and the inability to achieve frame-level accuracy for heart rate and respiration prediction. The authors suggest that future work should improve motion robustness, refine evaluation metrics, address data diversity, and enhance model generalizability to ensure better performance in real-world applications.
Pediatiditis et al. [19] introduced a method combining Eulerian magnification and a 3D convolutional neural network (CNN) to extract respiratory rate features from video data. This approach amplifies subtle skin-color changes and processes them through the CNN, achieving high accuracy in respiratory rate estimation, suitable for clinical environments. Several limitations were identified, including overfitting issues in two subjects, which affected model generalization, and a small sample size that limited the robustness of the results. Additionally, the method is computationally and memory demanding due to Eulerian motion magnification, highlighting the need for further optimization of the architecture, expansion of the dataset, and development of automatic video magnification techniques.
Wang H. et al. [20] developed a framework for cardio-respiratory monitoring in ICU settings using CCTV cameras. Their solution involves motion-intensity-focused quality metrics and Region-of-Interest optimization strategies, improving signal acquisition for heart rate and respiratory monitoring.
Molinaro et al. [21] proposed a camera-based methodology for respiratory rate estimation, focusing on facial and upper extremity signals, with applications in healthcare, occupational health, and sports. Although neural networks were not used, their novel algorithms and noise-reduction techniques effectively addressed motion-related challenges. This study highlights that careful algorithmic design and post-processing can enhance remote monitoring and serve as a foundation for integrating neural networks in future solutions.
Zhang et al. [22] utilized multimodal 3D imaging to address motion-related inaccuracies in vital sign monitoring. Their study suggests improvements in tracking head movements. By using advanced algorithms and evaluation metrics (e.g., mean absolute error, correlation coefficient) and leveraging 3D data, this research points toward sophisticated data processing pipelines that can support or be integrated with neural models to improve accuracy across healthcare, sports, and security applications.
Wang W. et al. [23] explored rPPG for cardiac triggering during MRI, presenting an algorithm for R-peak prediction. Relying on signal prediction and comparison, the camera-based PPG could be an alternative to ECG-bassed triggers. This study demonstrates the viability of the method in improving workflow efficiency and patient comfort. However, the method faces limitations, including motion sensitivity, lower signal quality under certain conditions, and challenges with arrhythmia and heart rate variability, which can affect prediction accuracy. Additionally, this study was conducted on a small group of healthy volunteers, limiting its generalizability to clinical settings with diverse patient populations. Further validation in real-world environments and improvements in robustness are needed to enhance the applicability of camera-based rPPG for cardiac triggering.
Lee et al. [24] introduce LSTC-rPPG, a deep learning framework using a 3D CNN with an hourglass structure and temporal attention. By compressing and reconstructing temporal features and combining time- and frequency-domain loss functions, their architecture captures both local and global temporal information crucial for robust rPPG signal prediction.
Xiong et al. [25] propose STGNet, leveraging Spatio-Temporal Graph Neural Networks (ST-GNNs) to model physiological signal periodicity and consistency. STGNet effectively reduces noise and focuses on physiologically affluent facial areas by introducing graph-denoising block and region selection strategies, representing a shift toward graph-based learning in rPPG. However, the model’s performance is still affected by motion artifacts and relies on computationally demanding hardware, which may limit deployment on edge devices. Additionally, more diverse datasets must be validated to ensure its robustness in real-world applications.
Lee et al. [26] introduce DSE-NN, a deep supervised efficient neural network that utilizes spectral deep supervision for learning periodic signals. Reducing parameters and visualizing intermediate representations, this architecture achieves fast convergence, interpretability, and strong performance with fewer computational resources. This study reduces computational complexity but still requires further optimization for real-time deployment on resource-constrained devices. Additionally, it faces challenges such as sensitivity to motion artifacts, reliance on controlled datasets, and the lack of validation in diverse real-world environments.
Zhao et al. [27] developed WTC3D, a specialized neural architecture explicitly designed for pulse acquisition in the Internet of Medical Things (IoMT). The Weighted Temporally Consistent 3D convolution and spatiotemporal preprocessing modules ensure temporal accuracy, efficiency, and resilience to noise. Hybrid loss functions help align learned features with physiological periodicity, supporting lightweight, real-time applications. Authors identified the need for larger and more diverse datasets, improved model generalization, integration of physiological principles, and further optimization for real-world deployment as areas for future improvement in the WTC3D framework.
Collectively, these studies highlight the evolving landscape of rPPG techniques, demonstrating that while some approaches integrate advanced neural network models like CNNs and other specialized architectures, others prioritize algorithmic refinements and signal processing strategies. Despite notable advancements, there remains a need for more systematic exploration and standardization of neural network architectures. Such efforts would enhance reproducibility, ensure robust performance across diverse conditions, and ultimately facilitate broader clinical and commercial adoption.

3. Materials and Methods

This chapter outlines the methodology employed to compare various Convolutional Neural Network (CNN) architectures for rPPG signal estimation. It describes the dataset, preprocessing steps, and the design of different CNN models. This chapter also details the metrics for evaluation of the model performance and description of the proposed architecture.

3.1. Neural Networks

Neural networks (NNs) are foundational to modern machine learning, designed to mimic the structure and functionality of biological neural systems. These computational models consist of interconnected layers of artificial neurons, each performing simple operations to extract patterns from data. The network’s architecture typically includes an input layer for raw data, one or more hidden layers for feature extraction, and an output layer for predictions or classifications [28,29].
The depth of an NN is determined by the number of hidden layers; this distinguishes shallow networks from deep neural networks (DNNs). Deep networks are particularly effective at capturing complex, hierarchical features in data, enabling breakthroughs in tasks such as image recognition and natural language processing [30]. Training an NN involves iteratively adjusting its weights to minimize the error between predicted and actual outputs. This is achieved through backpropagation, an algorithm that computes error gradients and updates weights accordingly using optimization methods like Stochastic Gradient Descent (SGD) or Adam [31,32]. During training, the dataset is processed over multiple epochs, with data divided into shuffled mini-batches to balance memory usage and computational efficiency [33]. A smaller batch size reduces memory requirements but increases the number of iterations needed to complete an epoch, requiring careful trade-offs based on hardware and dataset size. To ensure robust performance, the dataset is typically split into training, validation, and testing subsets. While the training set is used to adjust weights, the validation set monitors the model’s performance and helps detect overfitting or underfitting. Overfitting occurs when the model is overly tailored to the training data, resulting in poor generalization of new data. Conversely, underfitting indicates that the model needs to be more complex to capture meaningful patterns. Regularly evaluating performance on validation data helps optimize hyperparameters and avoid these pitfalls [34,35].
NNs are highly adaptable, enabling modular systems tailored to specific problems like classification, regression, or clustering. However, training can be computationally intensive and prone to challenges like vanishing gradients or local minima. Advances in training algorithms, regularization techniques, and hardware accelerators have mitigated many of these issues, allowing for more efficient and scalable models. With their ability to process complex data and uncover patterns, NNs have transformed fields ranging from healthcare to finance. By leveraging innovative architectures and robust optimization methods, these systems continue to expand the boundaries of machine learning.
By leveraging innovative architectures and robust optimization methods, these systems continue to expand the boundaries of machine learning. Leading corporations and universities have developed several successful NN models, many available in libraries such as Keras [36]. These models typically include pre-trained weights for tasks like classifying 1000 image categories, which can be further fine-tuned. Users can also add layers to adapt these architectures, leveraging features extracted in early layers for visual elements and later layers for abstract concepts (see Figure 1) [37]. To better understand the versatility and applications of neural networks, it is essential to explore the following notable architectures that have shaped the field:
  • VGG (Visual Geometry Group): This CNN is known for its simplicity and uniform deep structure, using 3x3 convolutional filters and max-pooling for downsampling [38]. Variants like VGG16 and VGG19, with 16 and 19 layers, respectively, are widely used for image classification but are computationally intensive.
  • ResNet (Residual Network): ResNet uses residual blocks with skip connections to mitigate vanishing gradients, enabling very deep networks like ResNet50 with 50 layers [39]. It excels in tasks such as image classification and object detection.
  • Inception (GoogLeNet): This architecture introduces inception modules with parallel convolutional filters of varying sizes to capture multi-scale features efficiently [40]. Variants like InceptionV3 improve computational efficiency and performance.
  • Xception: Inspired by Inception, Xception employs depthwise separable convolutions for efficient feature extraction, reducing parameters while maintaining accuracy [41].
  • MobileNet: Designed for mobile and resource-constrained environments, MobileNet uses depthwise separable convolutions to achieve lightweight, efficient models [42].
  • DenseNet: DenseNet introduces dense blocks with direct connections between layers, enhancing gradient flow and feature reuse while minimizing parameters [43]. The number in model names like DenseNet121 represents the total number of layers.
  • NasNet: NasNet uses reinforcement learning to automate the design of efficient, high-performing models for various vision tasks [44].
  • EfficientNet B0: EfficientNet [45] introduces a compound scaling method that balances network width, depth, and resolution using fixed scaling coefficients, enabling significantly higher accuracy with fewer parameters and FLOPs compared to architectures like ResNet and NASNet. The baseline model, EfficientNet-B0, designed using neural architecture search, employs mobile inverted bottleneck layers with squeeze-and-excitation optimization, offering a balance between accuracy and efficiency. Variants such as EfficientNet-B1 to B7 scale up these dimensions progressively, achieving state-of-the-art results in tasks like image classification and transfer learning while remaining computationally efficient.
  • EfficientNet V2: EfficientNetV2 [46] builds on EfficientNet by introducing Fused-MBConv layers for improved training efficiency and hardware utilization, along with progressive learning that dynamically adjusts image sizes and regularization during training to enhance speed and accuracy. The EfficientNetV2 family includes variants such as B0, S, M, L, and XL, designed to scale across tasks with up to 11× faster training and 6.8× fewer parameters compared to EfficientNet. These improvements make EfficientNetV2 highly versatile and efficient for applications ranging from lightweight mobile tasks to large-scale data processing.
  • ConvNeXt: ConvNeXt [47] is a modernized convolutional network architecture that builds upon the foundational ResNet design, incorporating features like larger kernels, LayerNorm, and depthwise convolutions inspired by vision transformers, while preserving the straightforward convolutional structure of ConvNets. This design emphasizes scalability and efficiency, with variants like ConvNeXt-Tiny and ConvNeXt-Base optimized for resource-constrained and balanced tasks, respectively, while larger models such as ConvNeXt-Large and ConvNeXt-XL focus on higher accuracy for complex and large-scale datasets.
While these architectures are commonly used for classification tasks, their modularity and adaptability also make them suitable for regression problems. For regression, the output layer can be modified to have a single neuron (or multiple neurons for multi-output regression) with a linear activation function to predict continuous values. For example, in tasks such as predicting physiological signals like heart rate or stress levels from images or videos, these models’ rich feature extraction capabilities can be leveraged to capture relevant patterns and correlations from the input data.

3.2. Metrics

In addition to visual assessment, quantitative evaluation of the model’s performance was conducted using several metrics, implemented via the scikit-learn library. For each metric, we define y i as the predicted value of the signal derived from remote photoplethysmography (rPPG) through facial imaging, and y i true as the corresponding ground truth value measured from a finger PPG sensor.
  • Max Error (ME): The maximum error represents the largest absolute deviation between the predicted and true values, indicating the peak error in the prediction. A value of zero corresponds to perfect prediction with no deviation. Mathematically, it is defined as
    ME = max y i y i true .
  • Explained Variance Score (EVS): This score reflects the proportion of variance in the true values captured by the predicted values, providing insight into the accuracy of the model’s predictions in explaining signal variance. A score of 1 indicates perfect overlap in variance, while lower values signify increasing error variance. It is defined as
    EVS = 1 Var ( y i true y i ) Var ( y i true ) .
  • Mean Absolute Error (MAE): The mean absolute error represents the average absolute difference between predicted and true values, making it sensitive to the range of data values. A lower MAE is preferred, with zero indicating perfect accuracy. It is calculated as
    MAE = 1 n i = 1 n y i y i true .
  • Mean Squared Error (MSE): A commonly used metric, MSE penalizes larger errors more heavily due to the squaring of differences, thus emphasizing substantial deviations. The optimal value is zero, representing no deviation between predicted and true values. It is expressed as
    MSE = 1 n i = 1 n y i y i true 2 .
  • R-squared Score ( R 2 ): The R 2 score quantifies the proportion of variance in the true values that is captured by the predictions, providing a measure of the goodness of fit. An R 2 value of 1 denotes a perfect fit, while values closer to zero indicate weaker predictive accuracy. It is defined as
    R 2 = 1 i = 1 n y i y i true 2 i = 1 n y i true y true ¯ 2 ,
    where y true ¯ = 1 n i = 1 n y i true represents the average (mean) of the true values over all observations.
  • Mean Poisson Deviance (MPD): Poisson deviance is useful for measuring predicted values that represent expected counts or frequency, and it evaluates the extent to which predictions align with the distribution of the observed values. An MPD of zero implies perfect alignment with the true data distribution. It is defined as
    MPD = 1 n i = 1 n y i y i true · ln y i true y i .
Each of these metrics provides a unique perspective on model performance, helping to assess accuracy, error magnitude, and alignment with the ground truth signals obtained from finger-based PPG measurements.

4. Results

This study investigates the extraction of remote Photoplethysmography (rPPG) signals from images using a range of extended neural network architectures. The objective is to evaluate how effectively different models capture rPPG values from static facial images from the dataset. The extended architecture is based on known architectures, such as ResNet or DenseNet. Onto these base architectures, there is an extension of a few dense layers with a decreasing number of neurons, resulting in one value as the output.

4.1. Dataset

The dataset employed for this study consists of a subset of recordings from a larger, ethically approved collection that is slated for publication, ensuring public access to support future research. This selected subset comprises a total of 18,000 samples, which include both photographic images and reference photoplethysmography (PPG) signals acquired from a finger-mounted sensor. Data were collected from three participants, aged 25 to 36, consisting of two females and one male. The main limitation of this dataset is the small number of participants. This reduces the generalizability of data and will be addressed in the future by expanding the number of participants. Each participant was seated in a controlled setting. Natural lighting was optimized by positioning a ZED camera opposite windows, allowing high-resolution capture of facial images under soft, ambient light. To ensure accuracy, the PPG sensor, affixed to the left hand, used a reflective measurement approach that detects subtle changes in blood volume at the skin’s surface, producing a reliable reference signal. This configuration allowed for capturing rPPG signals from the facial region, with PPG from the finger as a comparative benchmark. The ZED camera captured the participants’ upper body, including the face, neck, and upper torso, to capture a comprehensive field of physiological indicators. The facial region, rich in vascular activity, was isolated for rPPG extraction as it minimizes motion artifacts and provides consistent signal quality. To preprocess the images, the YOLO Neural Network was employed to detect and crop the facial region from the larger image, with each extracted face subsequently resized to 64 × 64 pixels and stored in PNG format, maintaining both quality and compatibility for analysis.
The choice of facial signals for rPPG extraction maximizes data fidelity due to consistent lighting and minimized motion and opens further exploration into physiological and potentially emotional responses captured from facial signals. During data collection, participants were given the flexibility to engage naturally, whether in conversation or silence, to replicate real-world conditions as closely as possible. Throughout this process, adherence to ethical guidelines was paramount. The data collection adhered to the university’s ethical standards, ensuring privacy, informed consent, and participant confidentiality. The university’s ethics board approved the collection protocols, with all participants fully briefed on the nature and scope of this study, confirming their consent to participate. The full dataset, encompassing participant demographics, technical specifications, and detailed data collection protocols, will be published independently in a dedicated article. This forthcoming publication will ensure broad access for the research community, enabling further progress in remote physiological monitoring methodologies.

Description of the System Architecture

The proposed system consists of two main blocks, as shown in Figure 2. The first one is called the “Base model”, and it represents known architectures described in Section 3.1. These networks were chosen due to their strong feature extraction capabilities and proven success in handling complex image data. Originally, these architectures had RGB image input with a resolution of 224 × 224 × 3. For the proposed system, the input layer’s data shape is changed to match facial images in the dataset. Resulting in a shape of 64 × 64 × 3 values. The output dense layers are not included in the Base model, so it will contain only the convolutional part. During training, convolution filters try to find statistically relevant features in the input data. Therefore, this part will act as the feature extraction part in the final model. The second block is called the “Extension” and represents the regression part of the final model. This extension is further divided into three blocks: Conversion, Dense, and Output. Conversion starts with an average pooling layer with a window size of 2 × 2. Followed by a Flatten layer to transform higher dimension data into a vector. Batch normalization finishes the conversion block. A dense block starts with a dense layer with a linear activation function. After that, 50% dropout is applied, and batch normalization is at the end. This block is repeated three times with a decreasing number of neurons (384, 256, 128). Finally, the Output block comprises a single dense layer with one neuron that represents the final output value for rPPG estimation. Like previous layers, this output layer employs a linear activation function to predict continuous values effectively.
  • Base Model: Feature Extraction
1
Input Image:
  • The model accepts input images in the RGB format with dimensions 64 × 64 × 3 (64 pixels height and width, with three color channels).
  • These images are processed as tensors for further computation.
2
Known Architecture:
  • The Base Model utilizes a predefined architecture (e.g., a convolutional neural network such as ResNet, VGG, …).
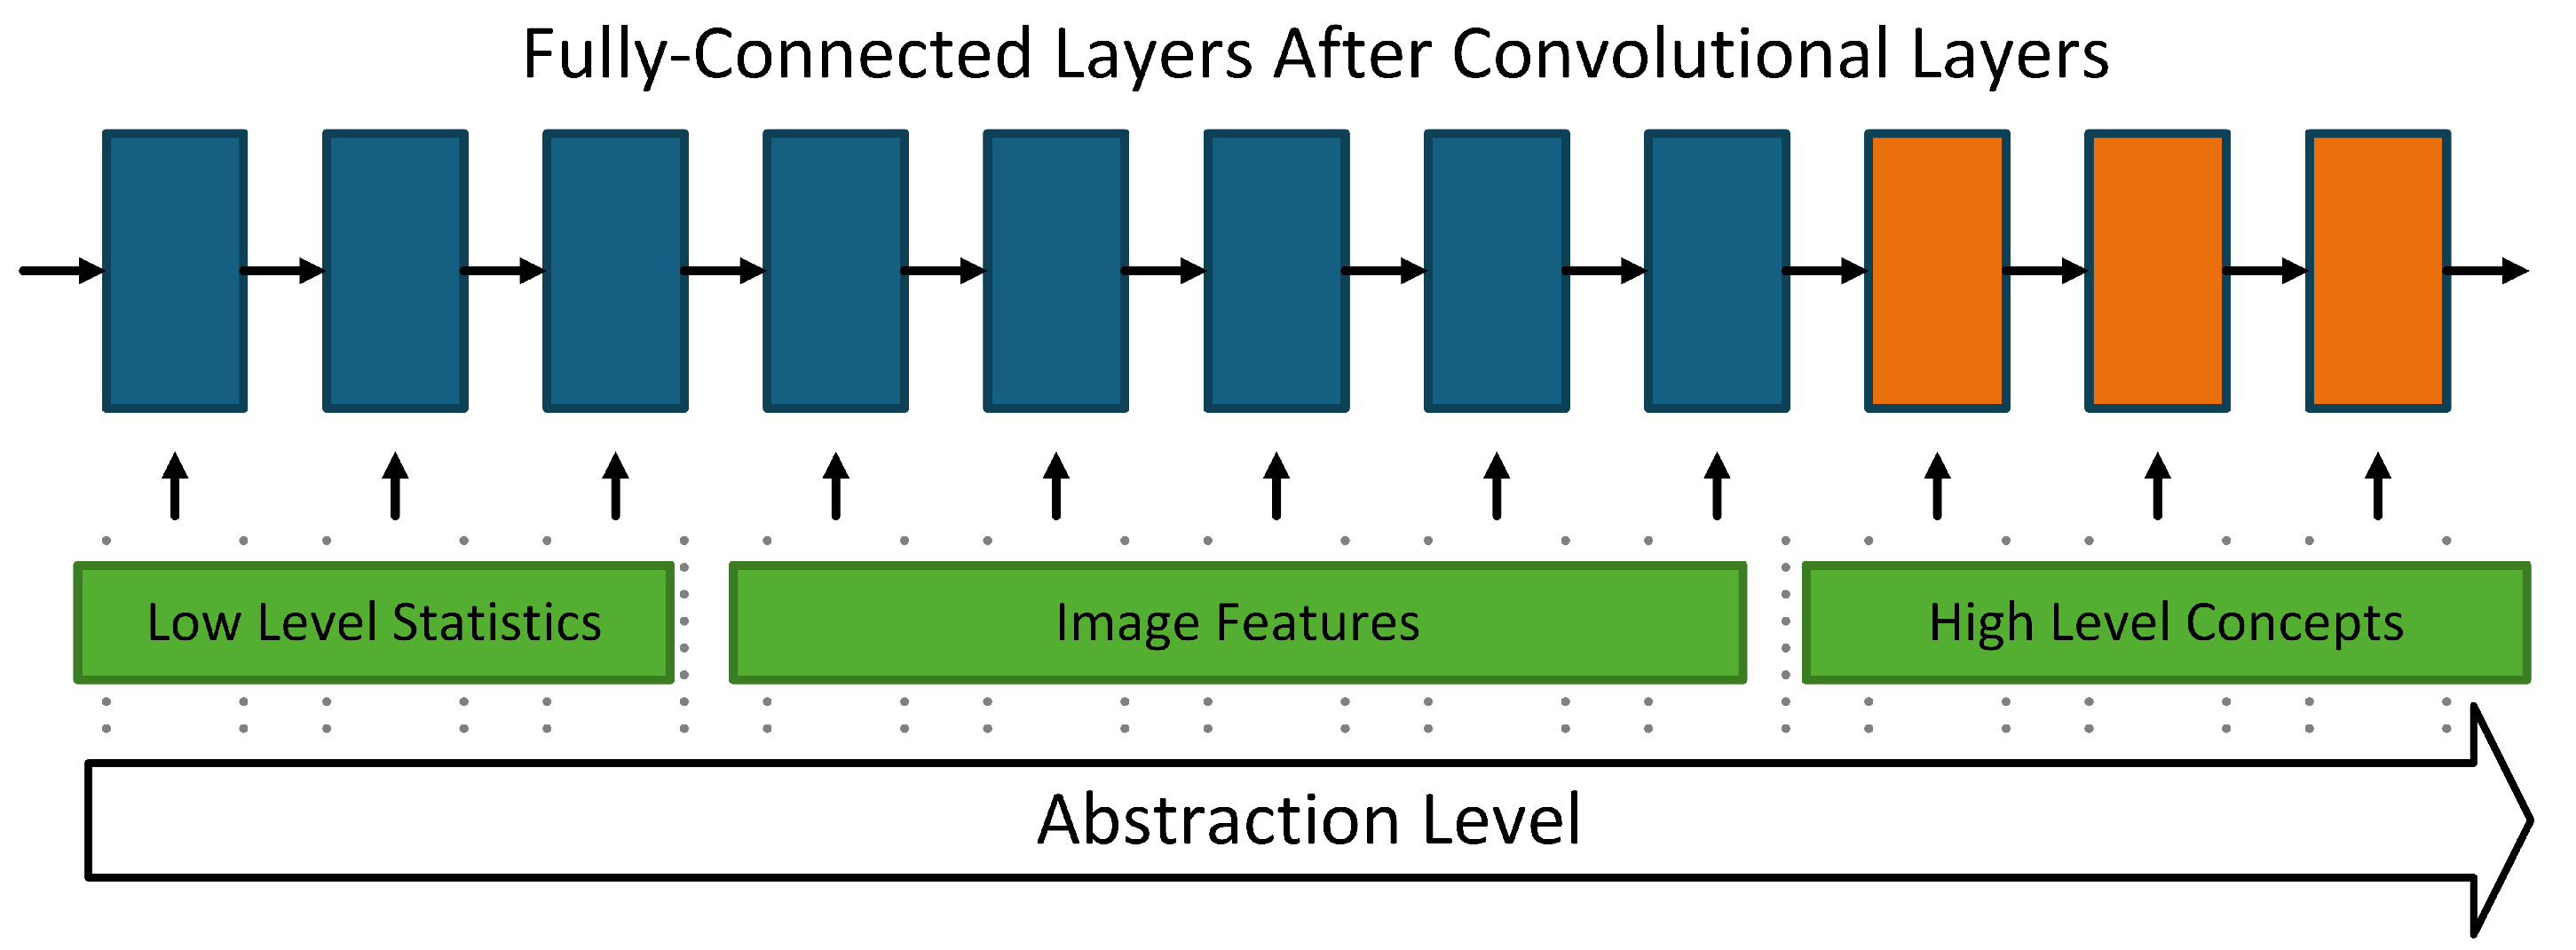
  • The architecture consists of several convolutional and pooling layers, forming a feature extractor.
  • These layers sequentially extract hierarchical features from the input image:
    Lower layers capture low-level features (e.g., edges, corners).
    Deeper layers encode high-level features (e.g., shapes, textures).
  • Outputs from this block are passed to a pooling layer.
  • Extension: Regression
1
Average Pooling and Flatten:
  • After feature extraction, the output feature maps from the base model undergo average pooling with a 2 × 2 kernel.
  • Pooling reduces the spatial dimensions, summarizing feature information.
  • A flattening layer converts the pooled feature maps into a 1D feature vector to be fed into the dense layers.
2
Dense Layers:
  • The flattened feature vector is passed through three fully connected layers, each with 128 units and a linear activation function.
  • Regularization techniques are employed to prevent overfitting:
    Dropout (0.5): Randomly drops 50% of the connections during training to promote generalization.
    Batch Normalization: Stabilizes the learning process by normalizing activations at each layer.
3
Output Layer:
  • The final output layer consists of a single neuron with a linear activation function.
  • This setup is typically used for regression tasks, where the model predicts a continuous scalar value.
  • Training Objective
  • The network appears to be designed for a regression task (e.g., predicting a numerical value based on input images).
  • During training, the model optimizes a loss function (such as Mean Squared Error) to minimize the difference between the predicted and true output.
To optimize the system’s performance, hyperparameters such as learning rate and network structure were carefully fine-tuned (Table 1). Adjusting these parameters played a critical role in enhancing convergence speed and avoiding suboptimal solutions. Modifications to the Base model included fine-tuning the number of layers and filter sizes, improving the network’s ability to detect intricate visual features. Each hyperparameter was pivotal in shaping the overall model’s effectiveness. Each hyperparameter plays a critical role in determining the model’s performance. For training and evaluation, the dataset was divided into training and testing sets at a 50:50 ratio, with an additional 80:20 split applied to the training set for model validation. This ensured balanced representation and systematic training while preserving the temporal integrity of the data, which is critical for evaluating model performance. The models were trained for 250 epochs with a batch size of 128, employing the Adam optimizer with a learning rate set at 0.0001. The mean squared error (MSE) loss function was chosen due to its suitability for regression-based predictions, minimizing the average squared differences between predicted and true values. The performance and effectiveness of machine learning models are significantly affected by various hyperparameters, each playing a crucial role in the model’s overall capability to achieve optimal results:
  • Learning Rate: The learning rate determines how much the model’s parameters are adjusted after each training step. It directly affects how quickly the model converges and whether it stabilizes in an optimal state. Selecting the appropriate learning rate is crucial to preventing issues like underfitting or overfitting.
  • Batch Size: Batch size refers to the number of training examples processed together in each iteration. It influences the speed of training, memory consumption, and the model’s ability to generalize. The optimal batch size depends on the hardware constraints and the characteristics of the dataset.
  • Activation Functions: Activation functions introduce non-linearity into the network, allowing it to model complex relationships. Functions such as ReLU, sigmoid, and tanh determine how neurons respond to input signals, affecting both the network’s ability to learn intricate patterns and its training behavior.
  • Dropout is a regularization technique that randomly deactivates a subset of neurons during the training process. This approach helps to prevent overfitting by encouraging the network to develop more robust features and reducing its dependence on specific neurons. The dropout rate determines the proportion of neurons that are deactivated in each forward pass through the network.
  • NN Architecture: The architecture of a neural network defines the structure of its layers, including the types (e.g., convolutional layer, pooling layer, fully connected layer) and their connectivity. The architecture must be chosen based on the complexity of the task and the computational resources available to optimize both performance and efficiency.
Deep knowledge and careful tuning of hyperparameters can significantly enhance the accuracy and performance of computer vision applications. The proposed system explores the extraction of remote Photoplethysmography (rPPG) signals from images using various neural network architectures, addressing the challenge of accurate signal estimation in biomedical contexts. The objective is to evaluate the effectiveness of different models in capturing rPPG signals from dataset snapshots. Two training strategies were investigated: pre-training models with only the fully connected layer being fine-tuned and training the entire network from scratch. The analysis reveals that models trained from scratch consistently outperform their pre-trained counterparts in extracting rPPG signals.
  • Advantages of the Proposed Model:
  • Transfer Learning Ready: By using a “known architecture” in the base model, pre-trained weights from a well-established model can be leveraged to improve feature extraction.
  • Regularization: Dropout and Batch Normalization ensure stability and reduce the likelihood of overfitting.
In summary, our modified network architecture effectively combines various neural network architectures with tailored components for regression tasks in rPPG signal estimation. By focusing on feature extraction through convolutional layers and implementing structured dense connections for regression, we aim to enhance both accuracy and efficiency in processing facial images for rPPG applications. This approach not only leverages existing knowledge in deep learning but also contributes novel insights into optimizing these architectures for specific signal estimation tasks.

4.2. Exprimental Part

This section outlines the experimental setup and the results derived from our experiments. The experiment was conducted on a computational system featuring an Intel Core i7-9700 processor, 32GB of RAM, and an NVIDIA RTX 2070 GPU with 8GB of dedicated memory. The software environment utilized included the Anaconda distribution, along with popular deep learning frameworks such as Torch, TensorFlow, and Keras. Each neural network architecture was enhanced by integrating four fully connected layers and three pooling layers, all utilizing linear activation functions. Optimization of the models was carried out using the Adam algorithm. The training spanned 250 epochs, with a batch size of 128 and a learning rate set to 0.0001. The Mean Squared Error (MSE) loss function was applied during the optimization process to minimize the average squared differences between predicted and actual values. The success of our experiments relies on the dataset used for training and evaluating our neural networks. We plan to publish the full dataset, including participant demographics and data collection methods, soon. This will ensure its availability to the research community, supporting further advancements in the field.
The experimental results were analyzed by grouping the tested architectures into families based on their structural similarities. A primary focus was placed on evaluating the resemblance between reconstructed photoplethysmogram (PPG) signals and the measured signals, particularly concerning the accuracy of peak positions critical for heart rate (BPM) estimation. This extension aims to explore the architectures and their respective performance further. For each epoch of training, a random batch of 128 images was selected from the training dataset. After preprocessing, which included facial extraction and normalization, an input data matrix of dimensions (128, 64, 64, 3) was generated. Correspondingly, the output was a vector of 128 PPG values, each linked to a single image. For the evaluation phase, continuous image sequences were utilized to visualize both the measured and predicted PPG signals, enabling a qualitative assessment of the models.

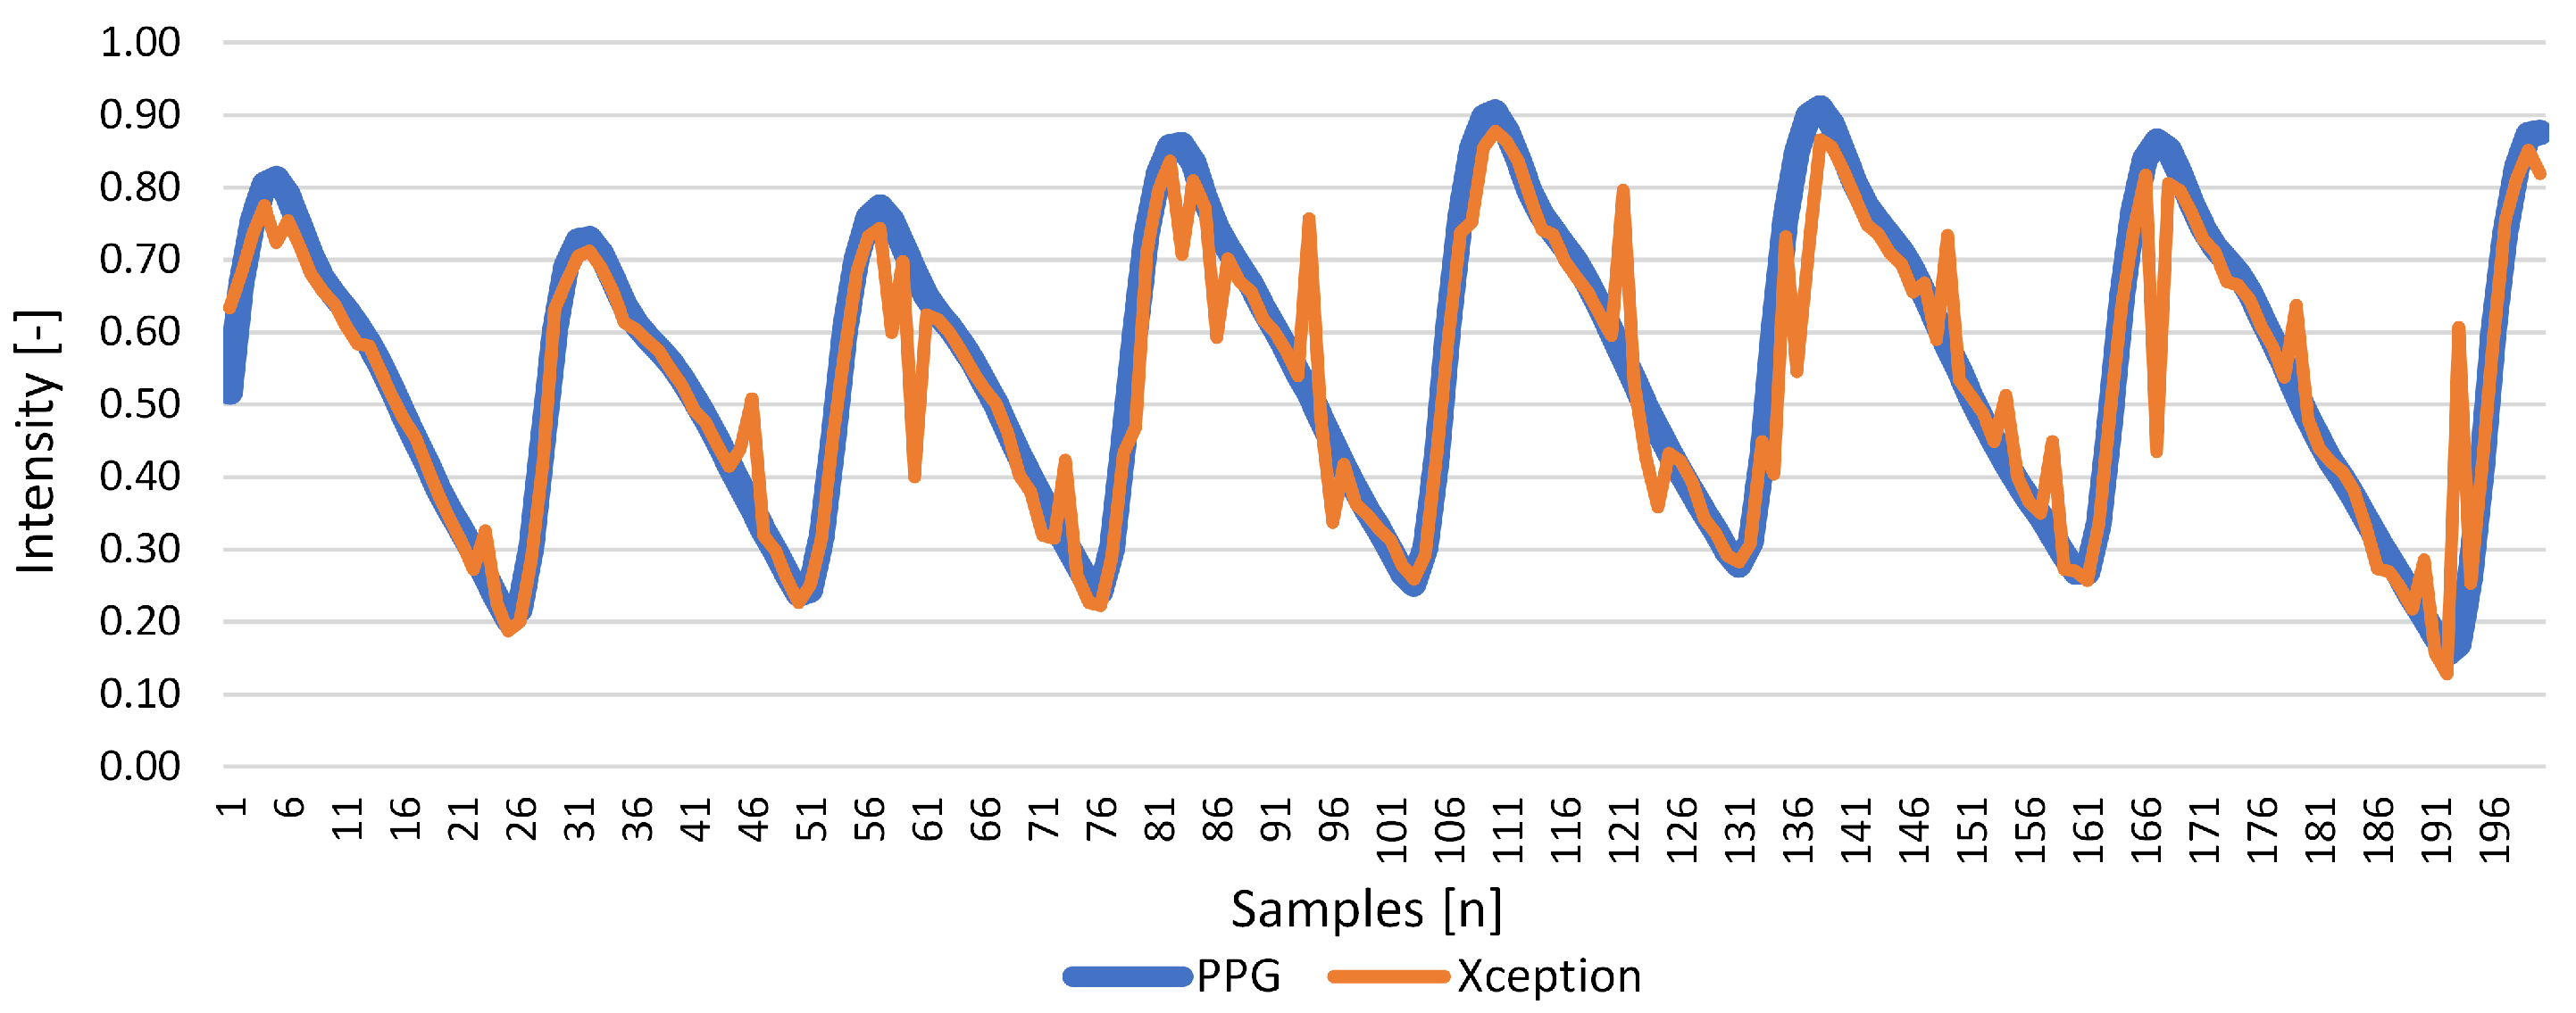
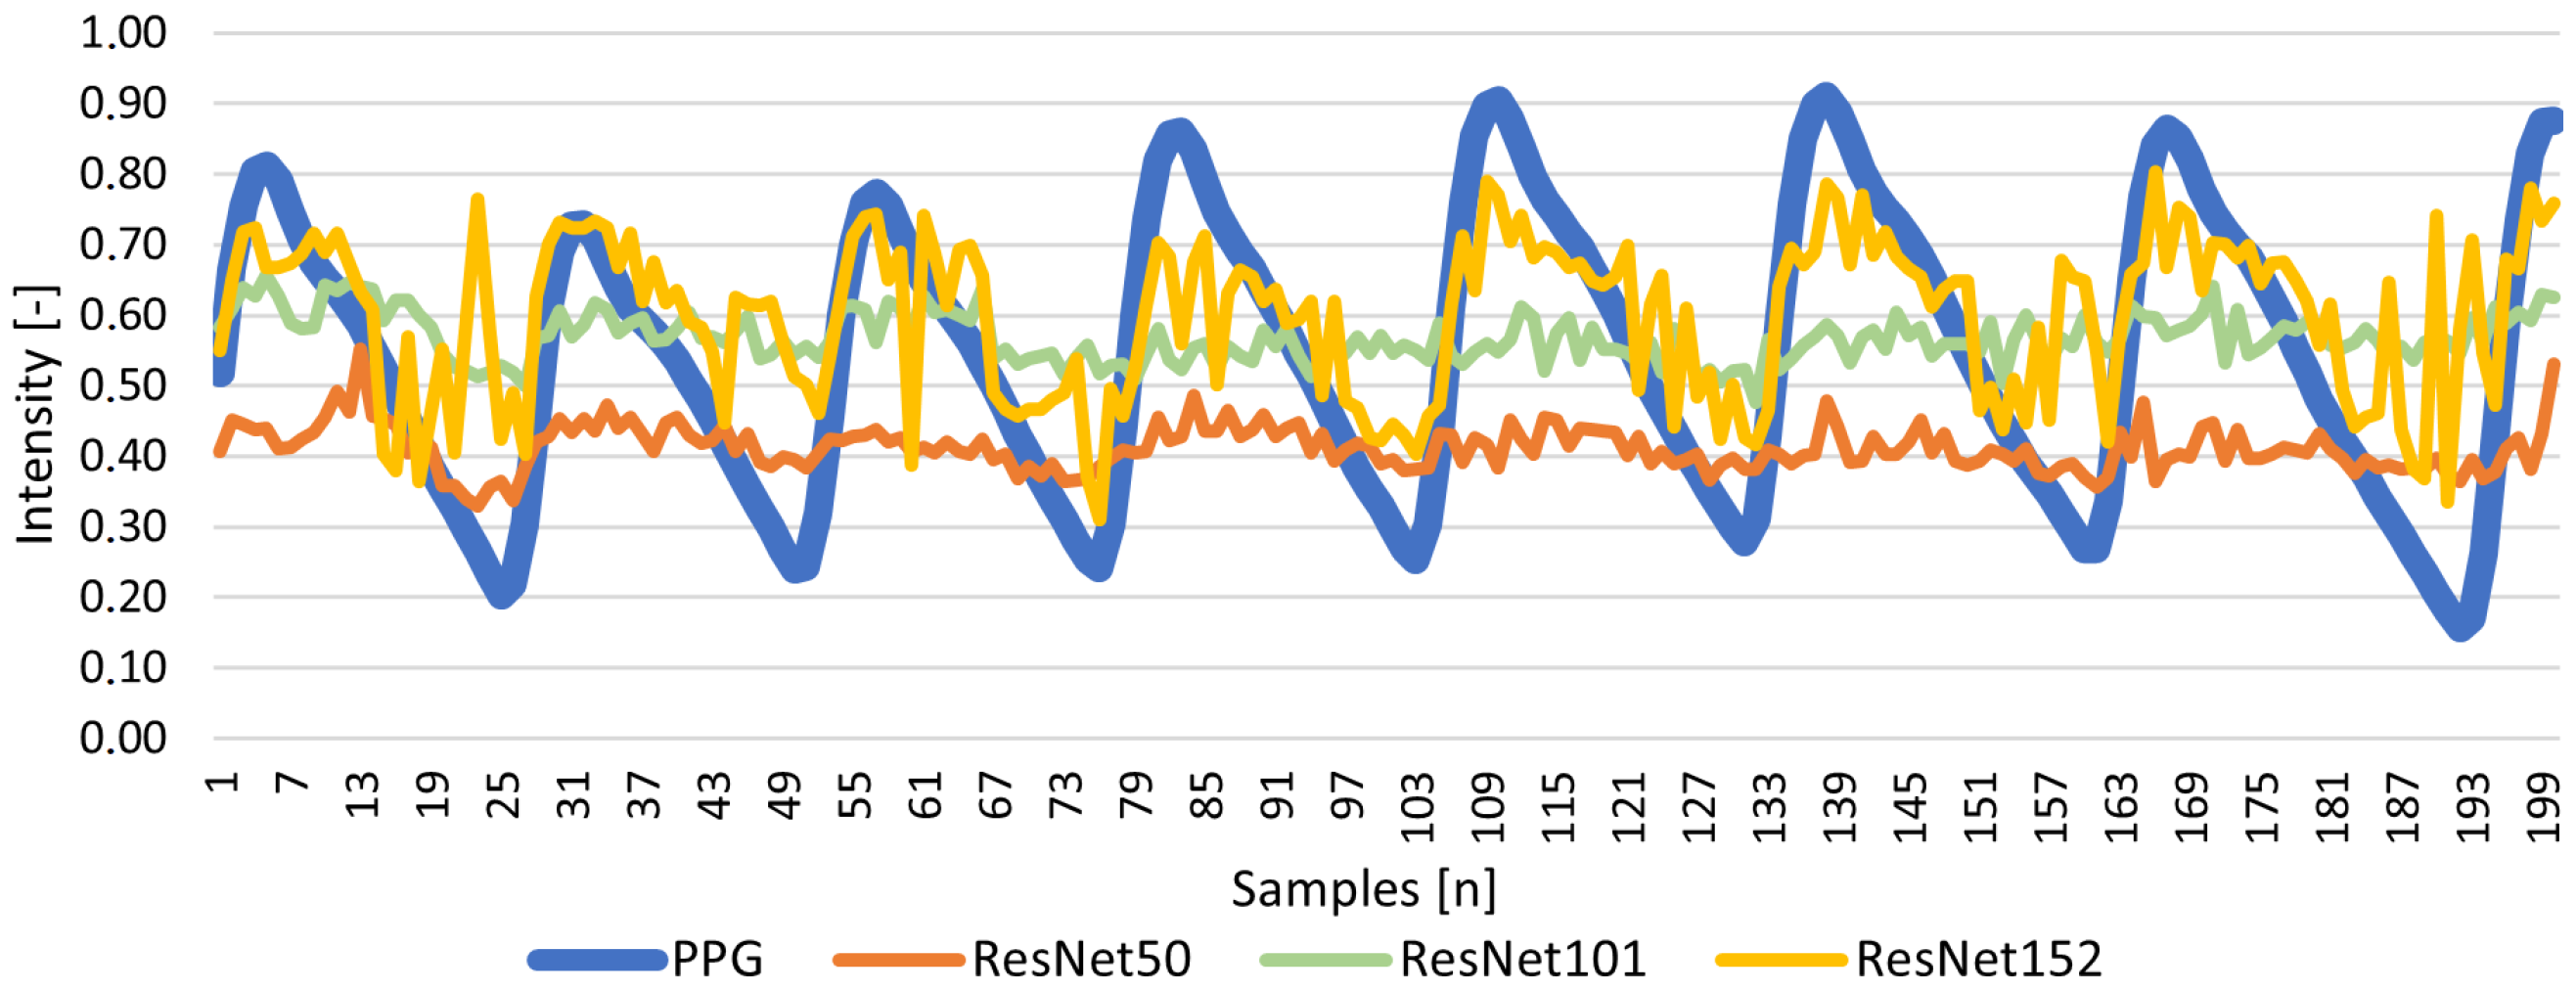
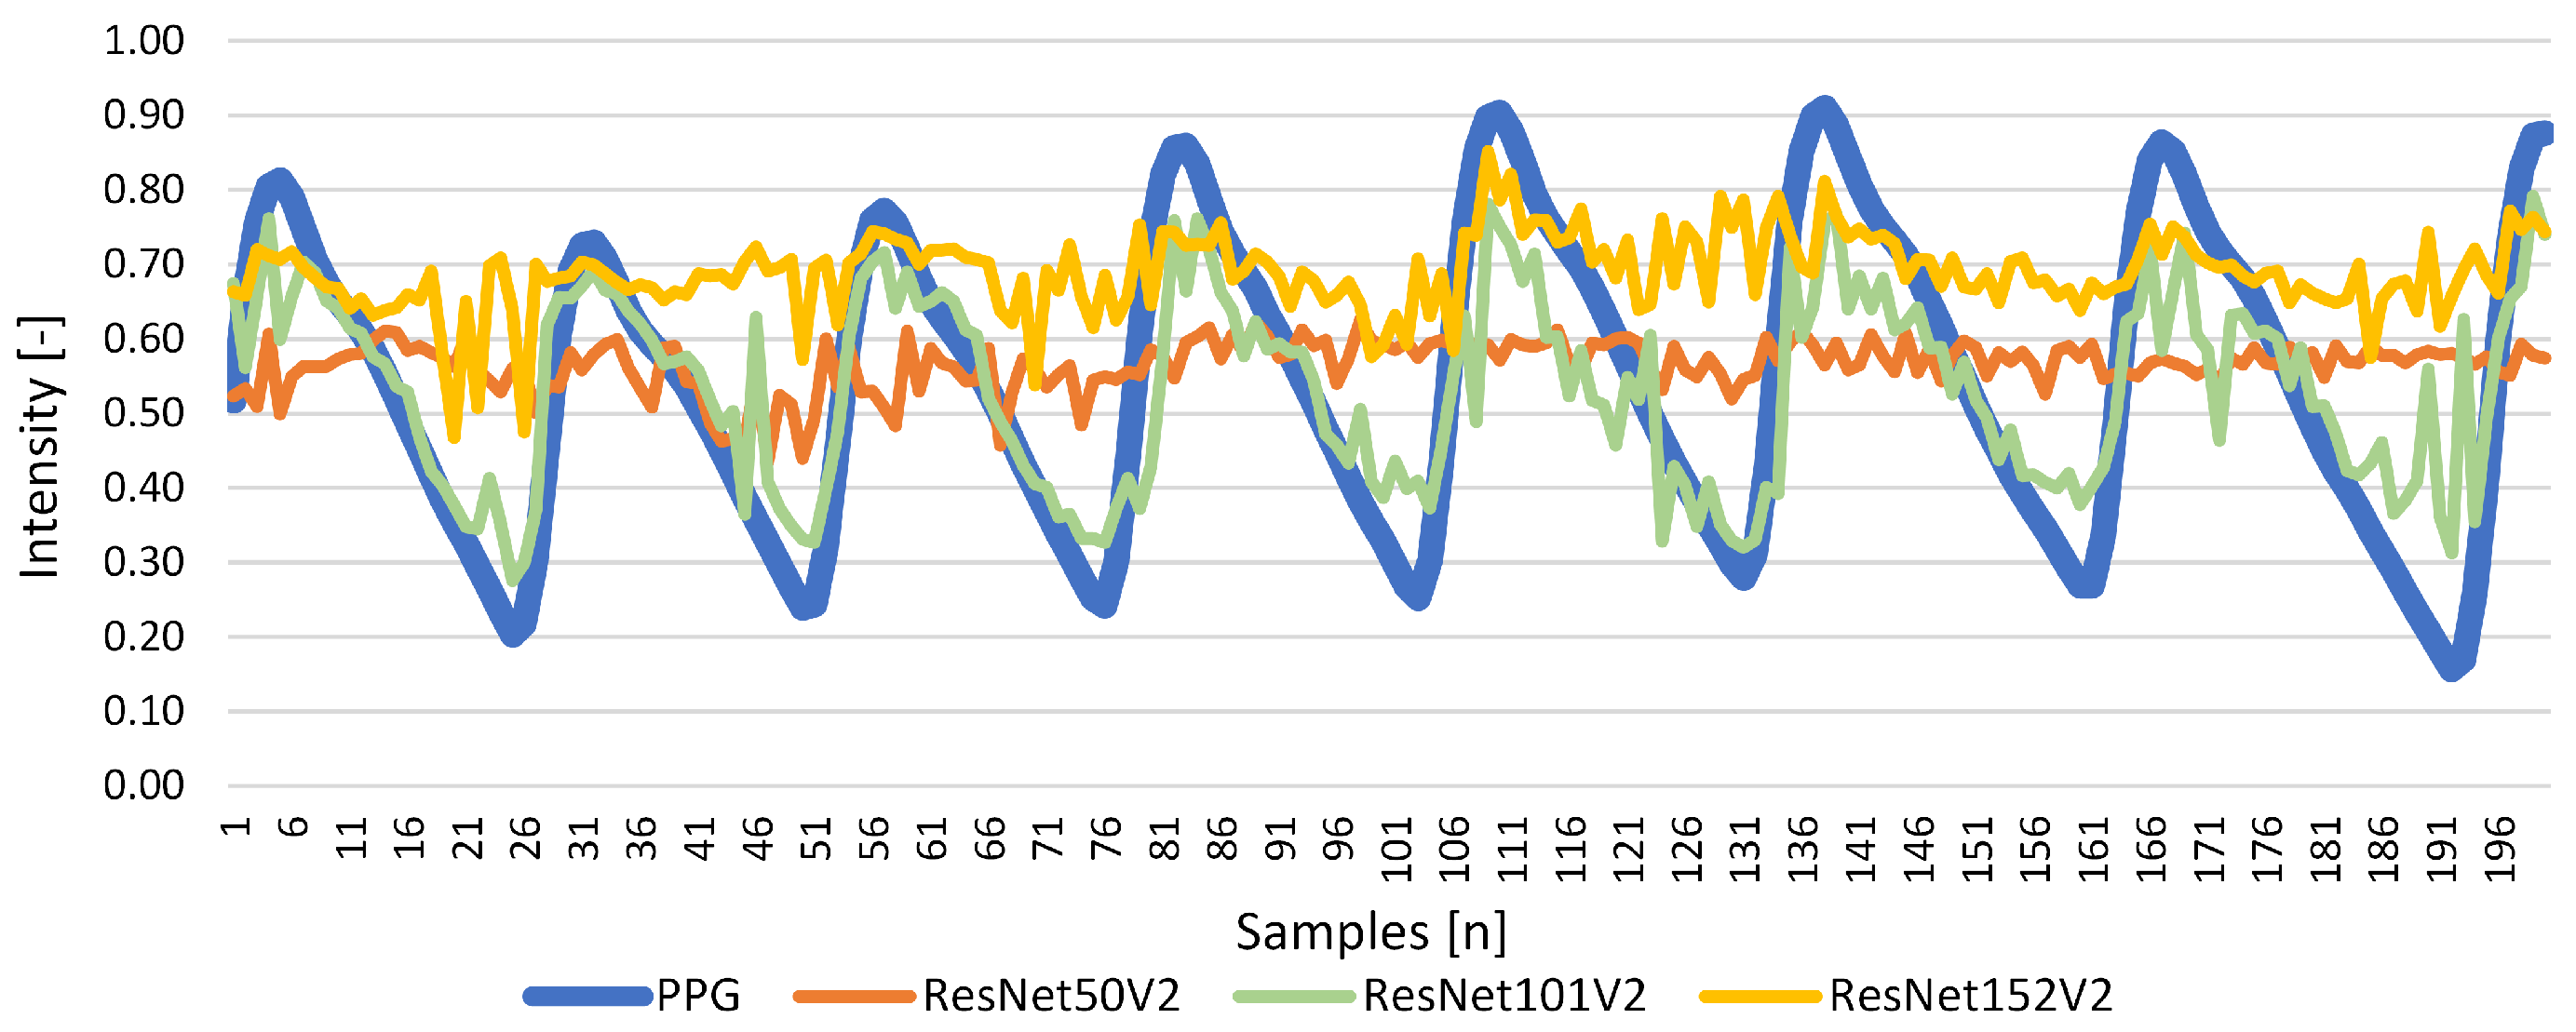
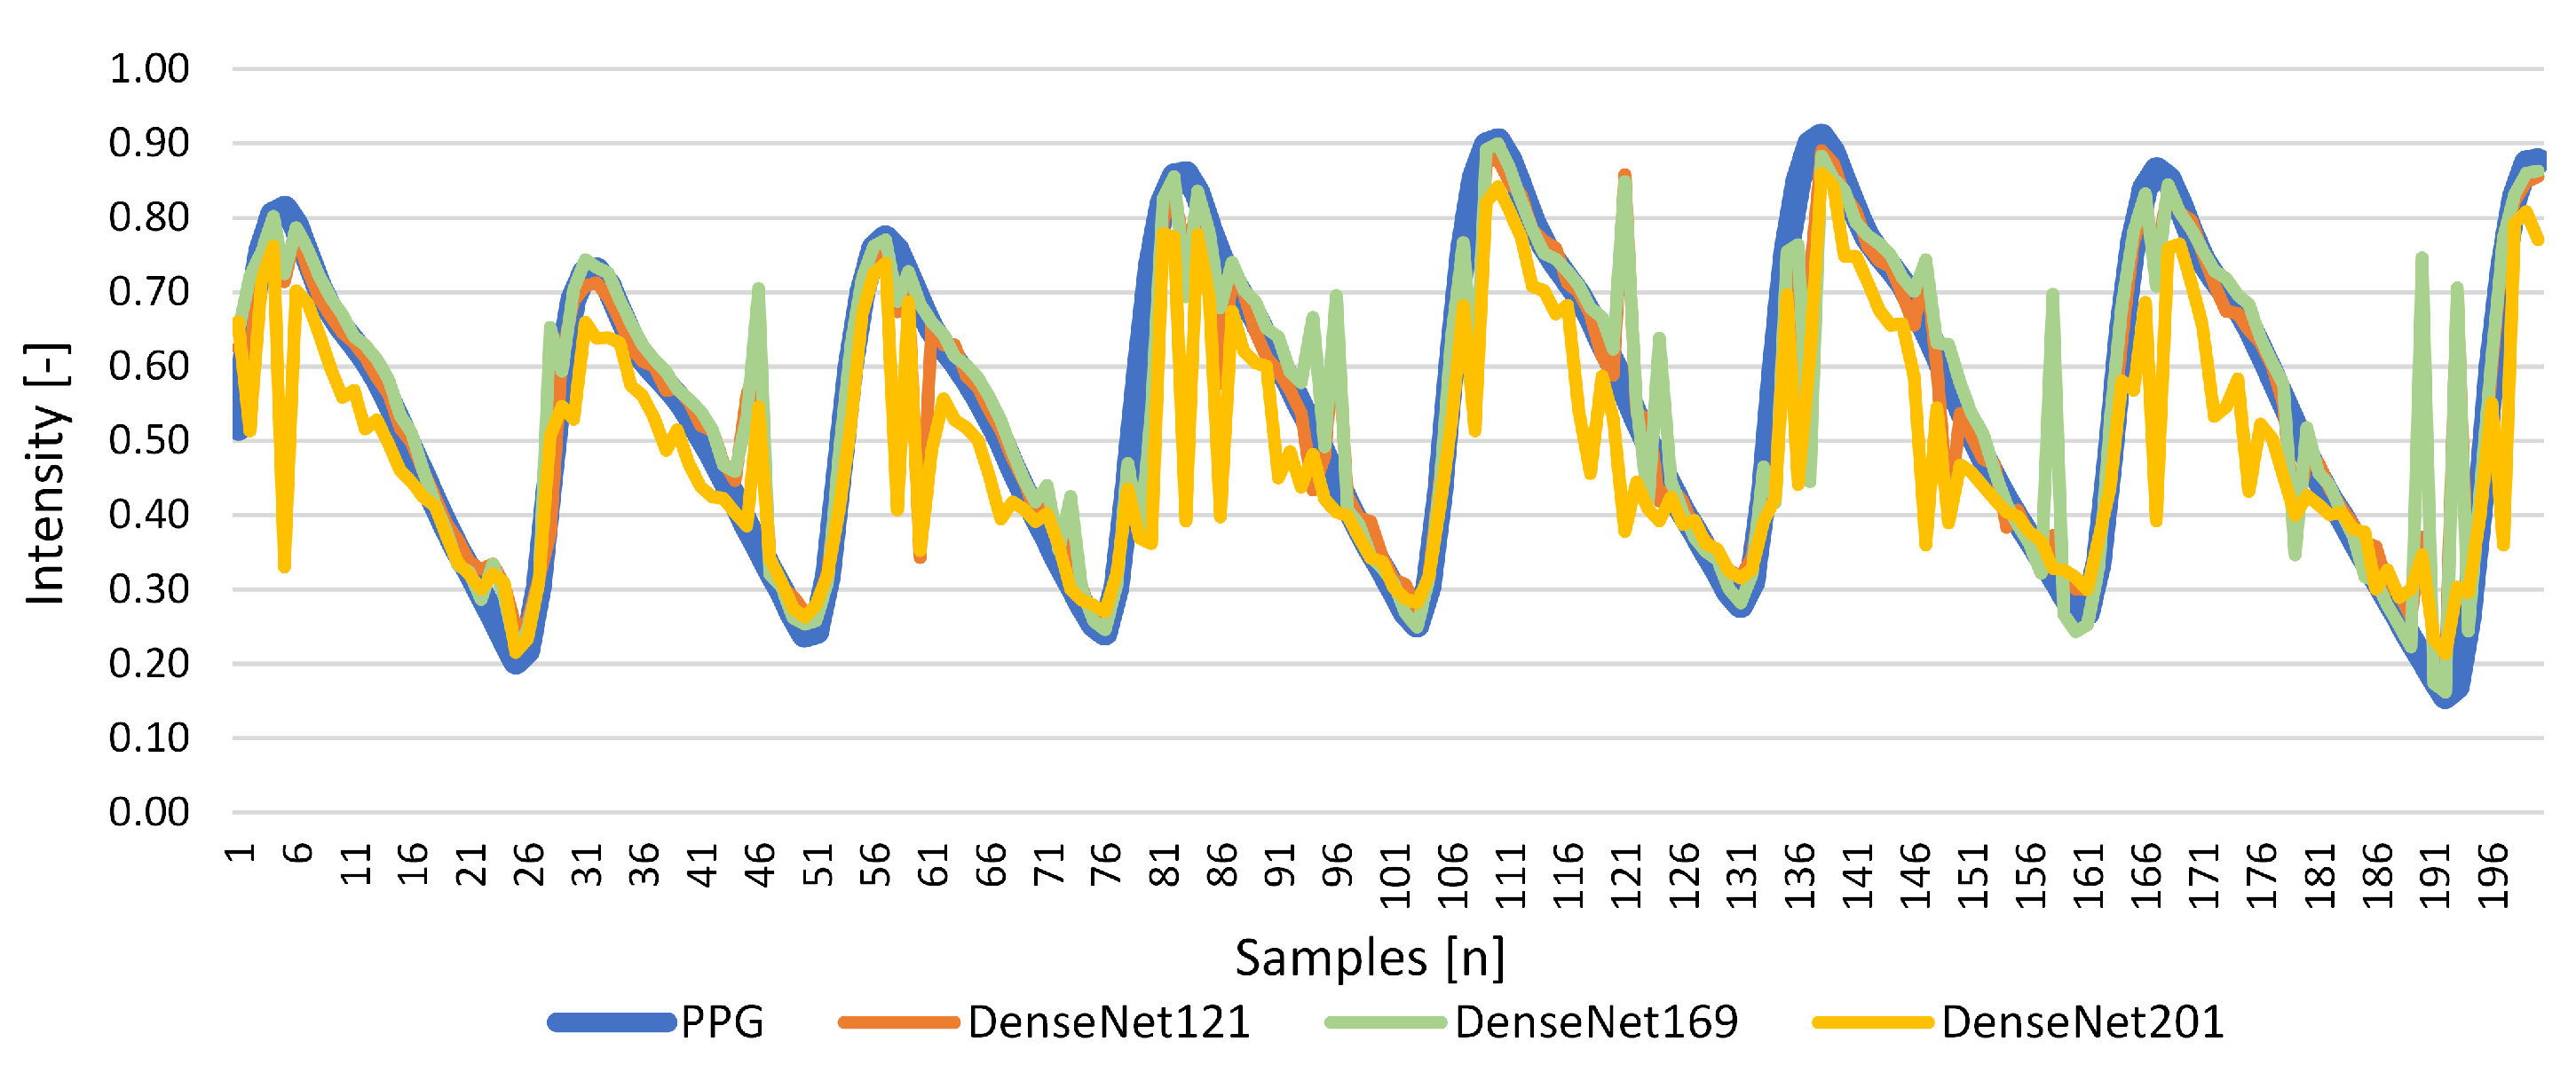
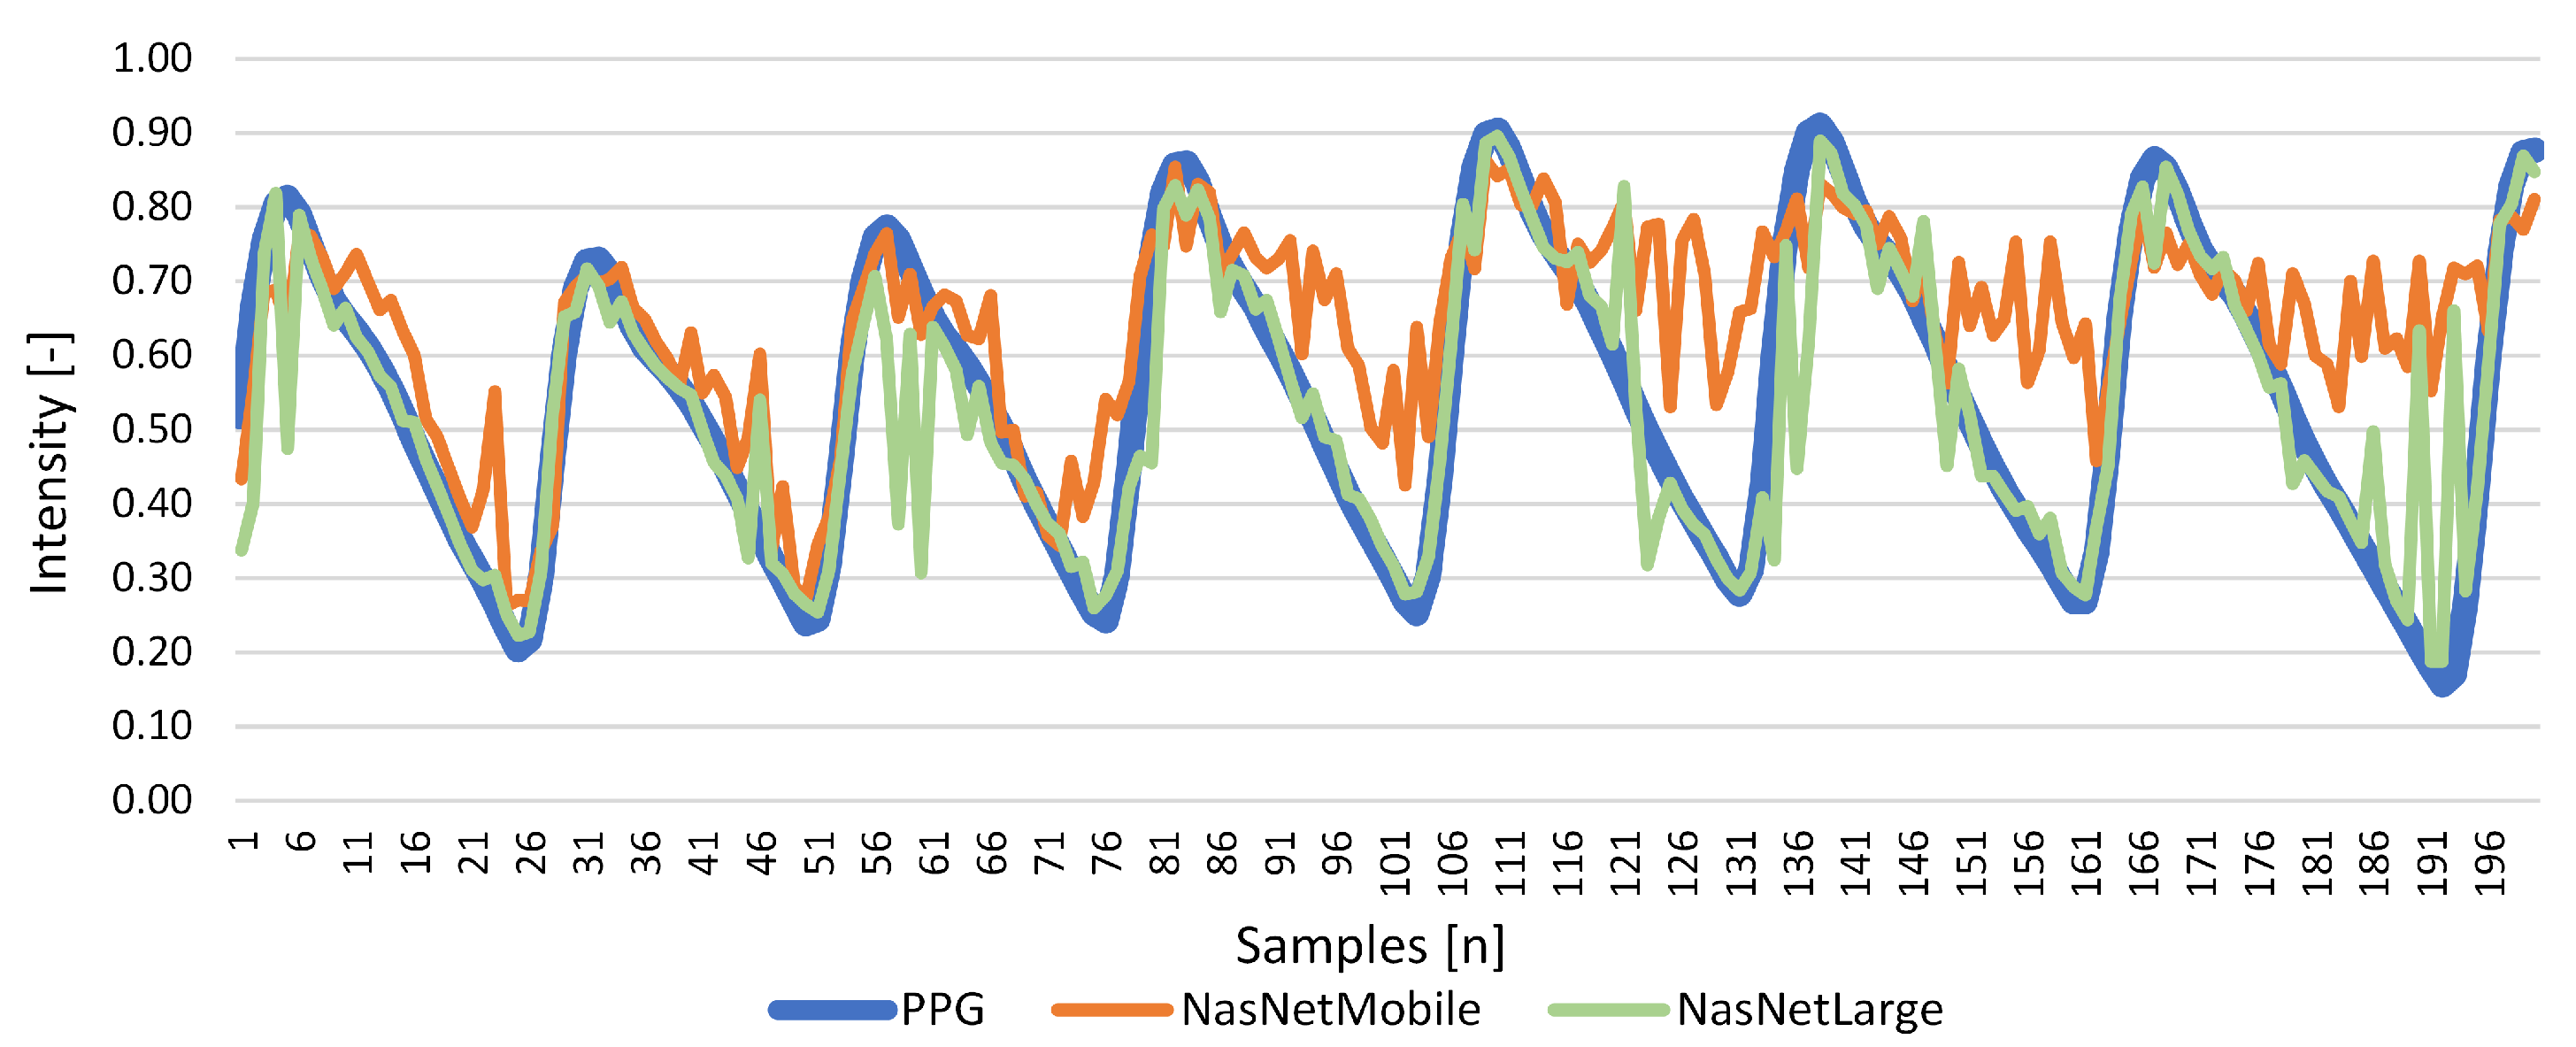
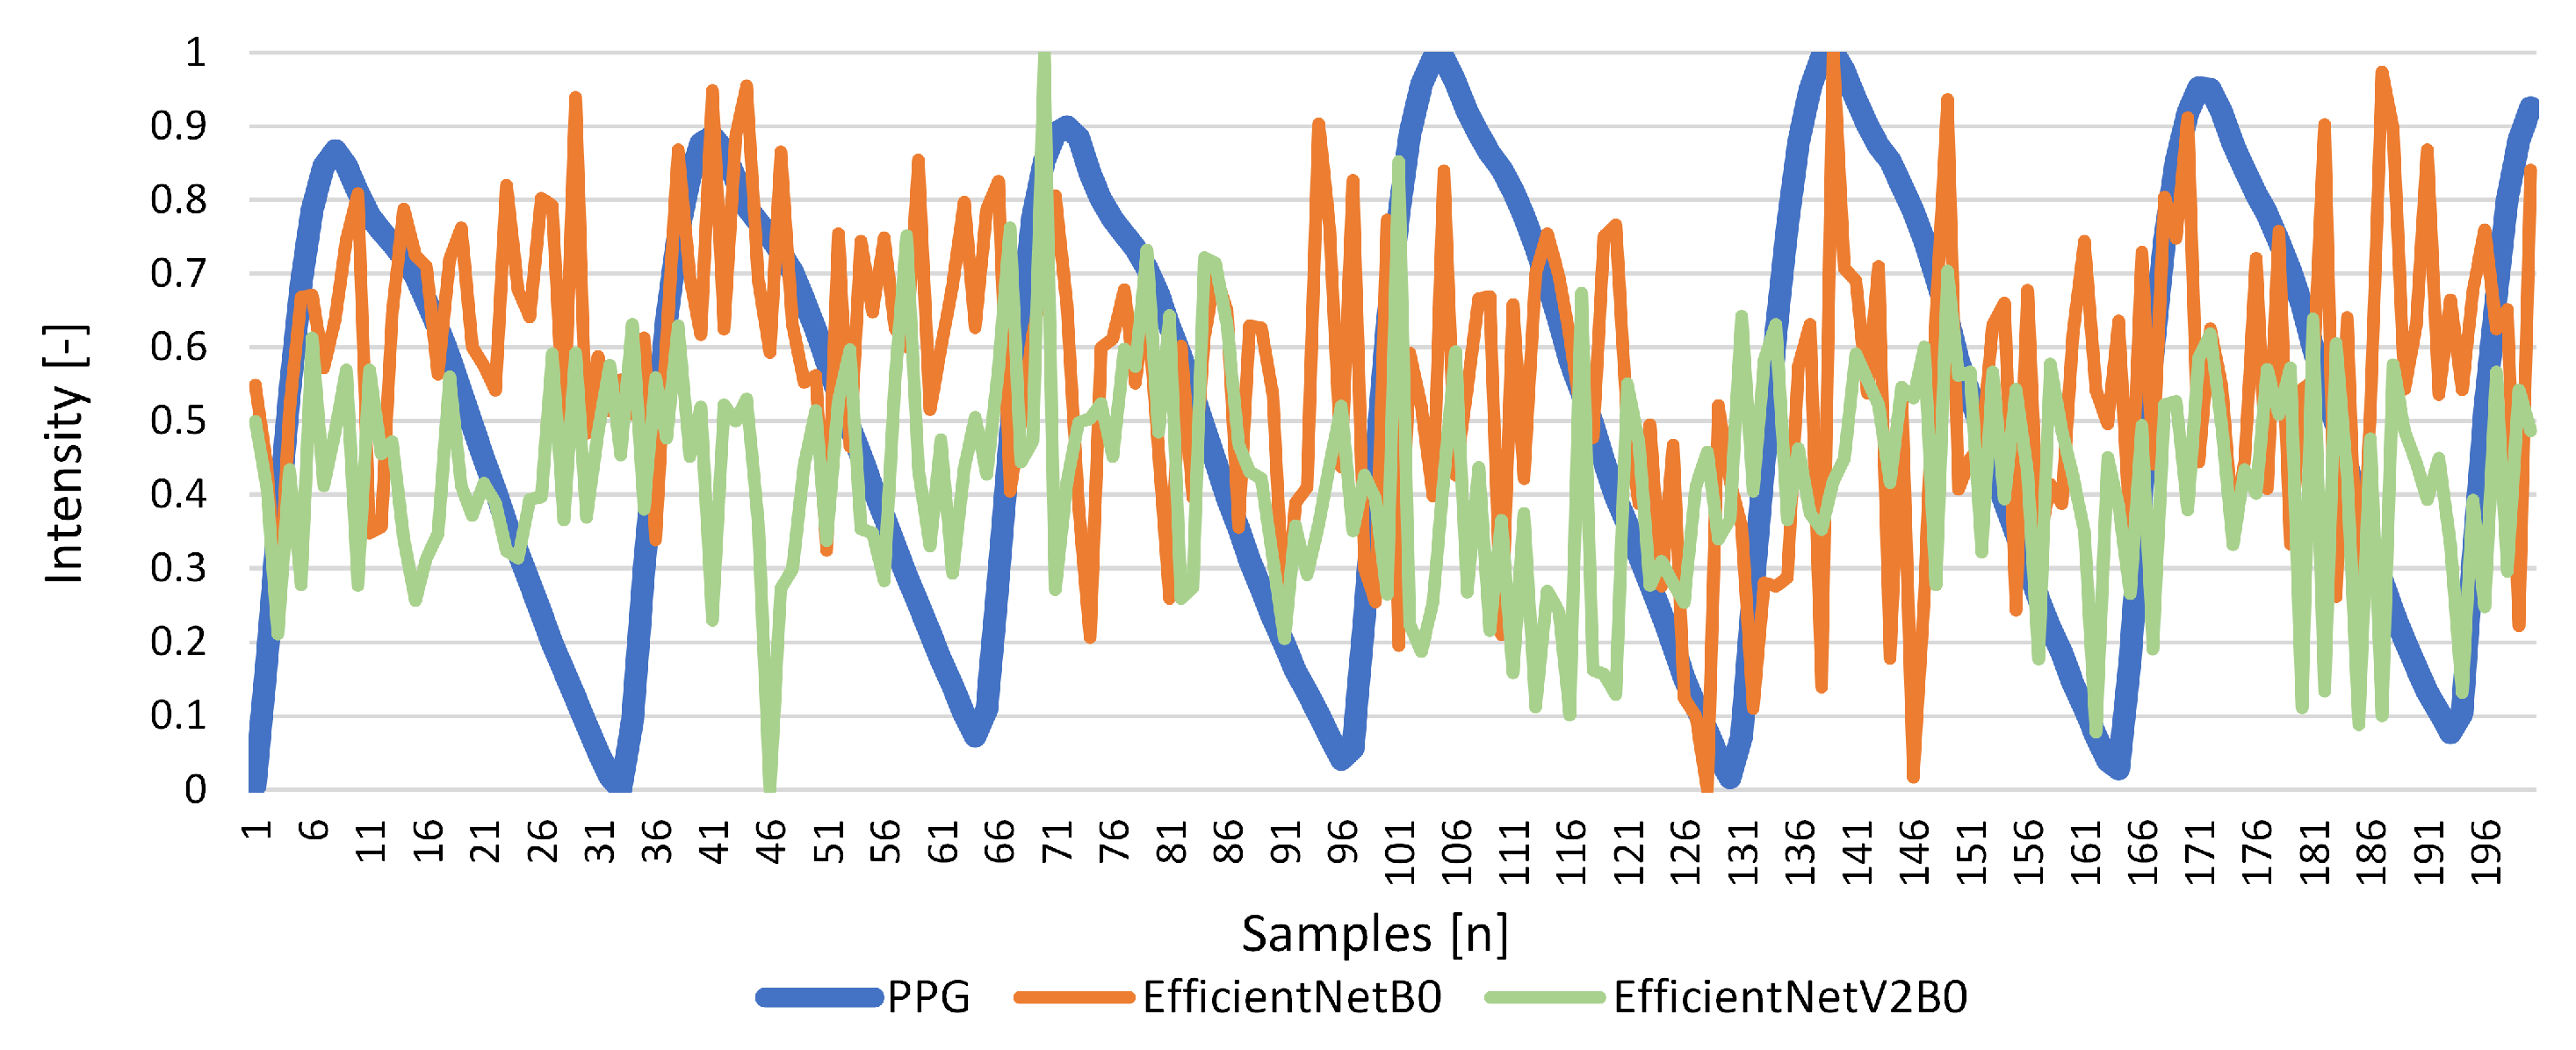
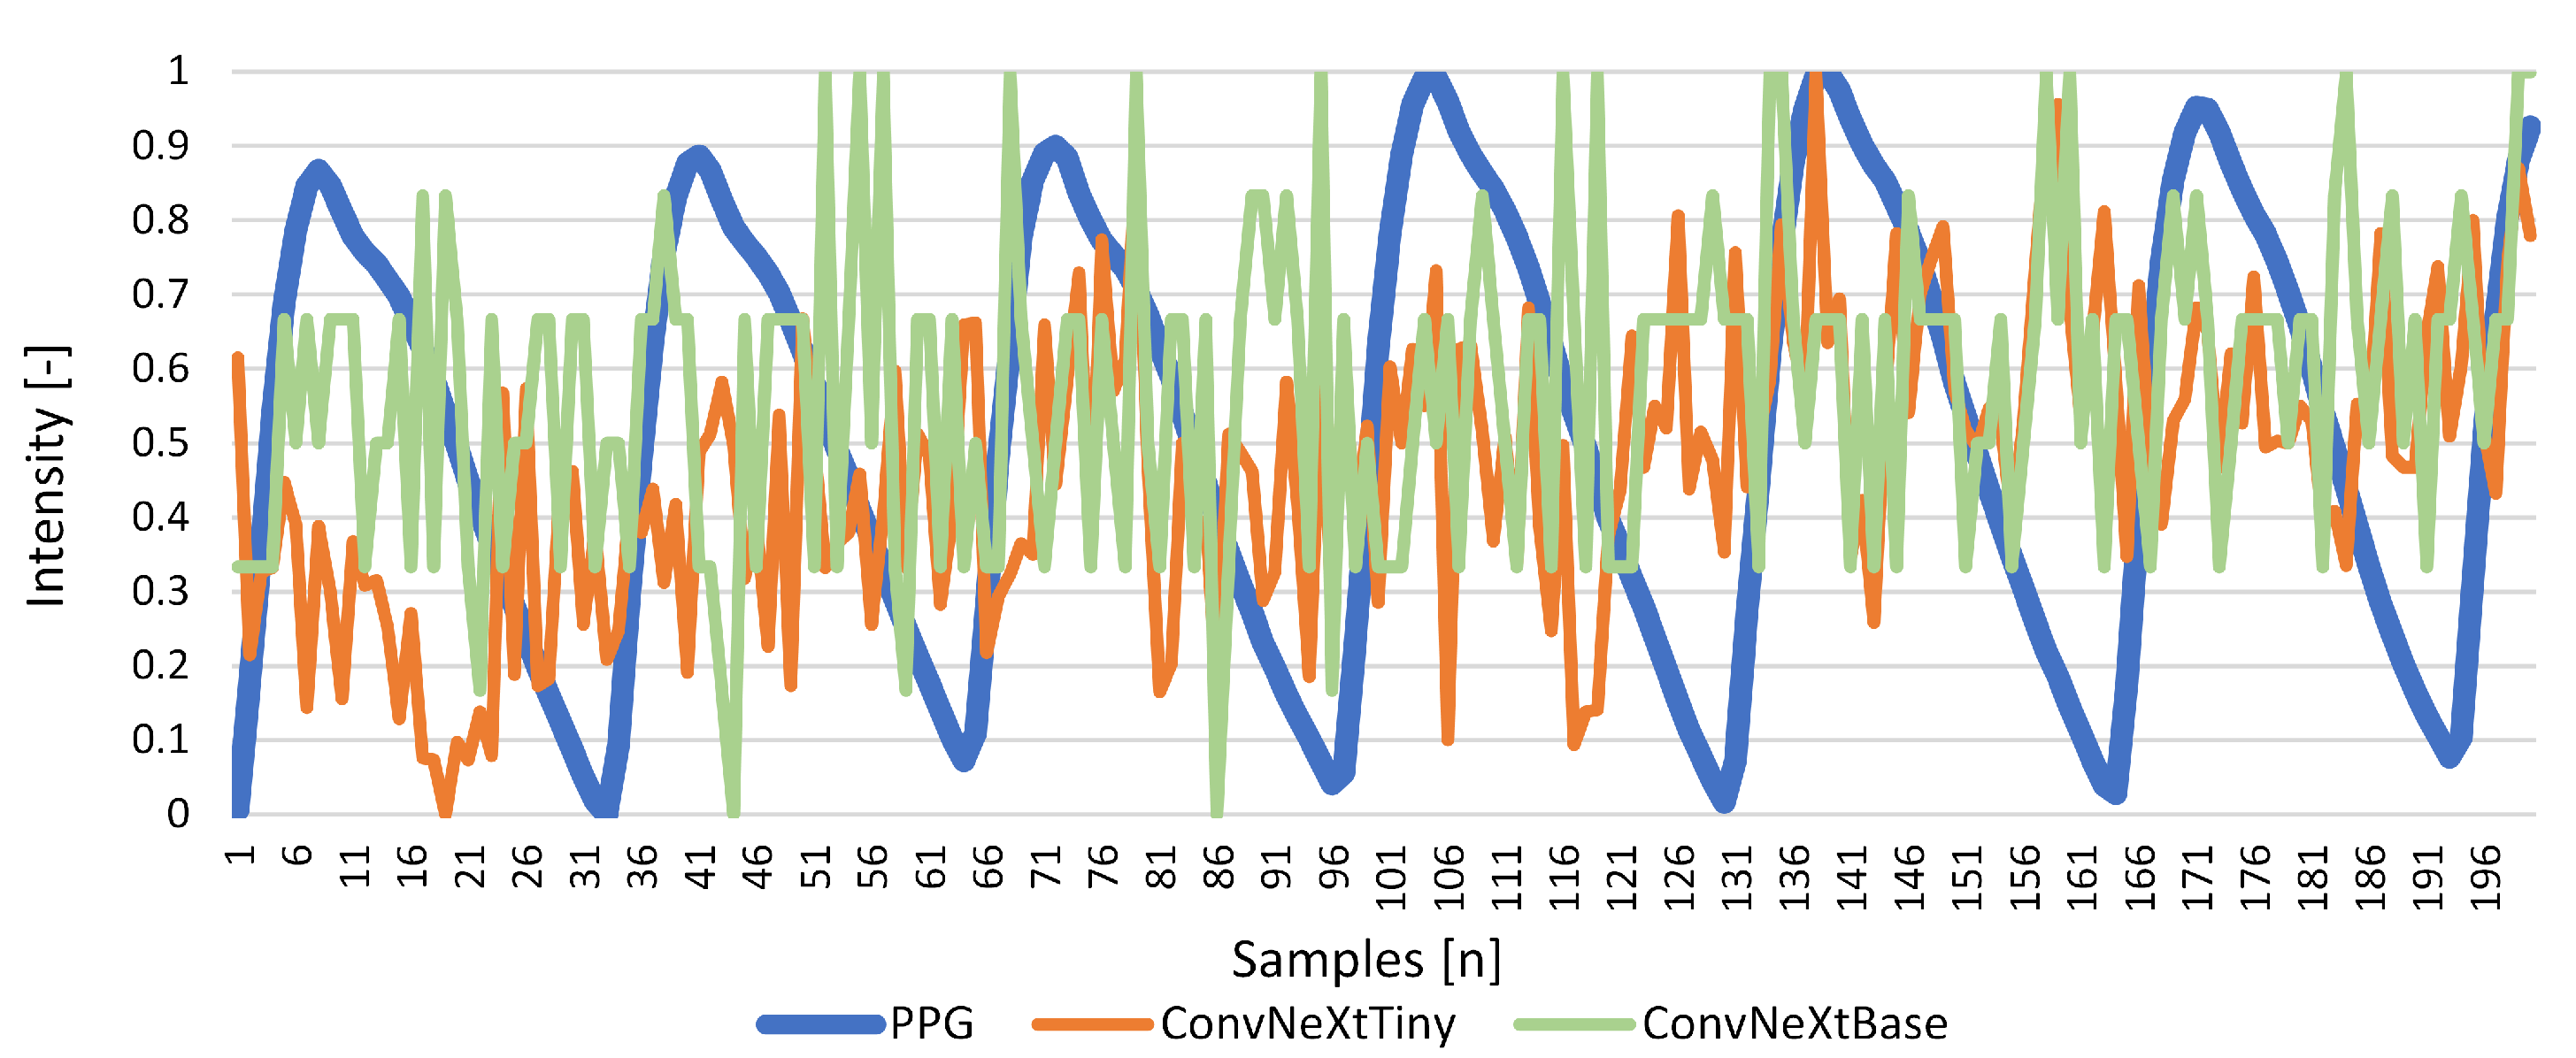
Results for Signal Reconstruction

In our study, we explored various neural network architectures for the task of remote photoplethysmography (rPPG) signal estimation. Among the examined models, Xception emerged as a standout performer, demonstrating a well-reconstructed PPG curve that closely aligned with the ground truth, as depicted in Figure 3 and Figure 4. This indicates that Xception effectively captured the essential features of the rPPG signal, which is critical for accurate heart rate monitoring. Xception is an extension of the Inception architecture, utilizing depthwise separable convolutions that significantly reduce the number of parameters while maintaining high performance. This design allows for efficient feature extraction, making it particularly suitable for tasks requiring detailed analysis of complex signals such as rPPG. The results suggest that Xception’s ability to model intricate patterns in the data contributes to its superior performance in reconstructing PPG signals.
The ResNet101V2 architecture also showed promising results, potentially due to its enhanced residual connections compared to its predecessor. These connections help mitigate the vanishing gradient problem, allowing gradients to flow more easily through deeper layers during training. As illustrated in Figure 5, this capability enables better feature extraction at deeper levels of the network, which is essential for capturing subtle variations in rPPG signals that are crucial for accurate heart rate estimation.
MobileNet outperformed ResNet, likely due to its lightweight design and implementation of depthwise separable convolutions. As shown in Figure 6, MobileNet’s architecture allows for efficient feature mapping while minimizing computational load. This efficiency is particularly advantageous when working with large datasets or in environments with limited computational resources. The architecture’s ability to maintain performance without requiring extensive resources makes it an attractive option for real-time applications.
DenseNet architectures exhibited consistent reliability across various configurations. The tightly connected layers within DenseNet facilitate feature reuse, enhancing gradient flow and enabling effective learning of features throughout the network. As depicted in Figure 7, this characteristic contributes to DenseNet’s robust performance.
The NasNetLarge architecture achieved competitive results, showcasing its ability to adaptively search for optimal network structures tailored to specific tasks (Figure 8). The architecture search methodology employed by NasNet allows for customized configurations that maximize performance based on task requirements. This adaptability is particularly beneficial in complex applications like rPPG signal estimation.
In contrast, both versions of EfficientNet performed poorly in our evaluations. This underperformance may be attributed to the complexity of the architecture exceeding that of the dataset being analyzed. Further investigation is needed to understand why other complex architectures succeeded where EfficientNet did not (Figure 9).
Similarly, ConvNeXt also exhibited suboptimal performance. One possible explanation is that ConvNeXt attempts to extract features across different scales, which may interfere with the overall signal representation derived from the entire image (Figure 10). This scale variance could lead to confusion in feature extraction processes, ultimately affecting the accuracy of rPPG signal estimation.
Among the architectures assessed, DenseNet121 demonstrated superior performance, offering the most reliable results in this context. These findings underscore the potential of neural networks in advancing rPPG signal extraction, which has promising applications in fields such as clinical monitoring and personalized medical care. This study contributes to the integration of advanced imaging techniques and neural network-based analysis in biomedical engineering, paving the way for more robust and efficient methodologies.
Table 2 presents the regression metrics for the tested architectures, offering a quantitative evaluation of their predictive capabilities. Highlighted values in the table represent the three best-performing models across the examined metrics. Figure 11 complements this table by visually comparing the error metrics for all architectures. This visualization reinforces the numerical results, further emphasizing DenseNet121’s superior performance and highlighting differences across the tested models.
In our case, we conducted a comprehensive performance comparison of various machine learning architectures for rPPG signal estimation, utilizing three key error metrics: MAE, MSE, and MPD. These metrics provide a robust framework for evaluating the accuracy and reliability of the models in reconstructing PPG signals from video data. Among the tested models, DenseNet121 emerged as the top performer, achieving the lowest MAE and MSE values. This indicates that DenseNet121 not only provides superior accuracy in estimating rPPG signals but also demonstrates a high level of reliability across different testing conditions. The architecture’s design, characterized by densely connected layers, facilitates efficient feature reuse and enhances gradient flow, which are crucial for capturing the intricate patterns inherent in PPG signals. The results of our comparison highlight the effectiveness of DenseNet121 as a leading architecture for rPPG signal estimation, while also demonstrating that Xception and MobileNetV2 are strong contenders. The findings underscore the importance of selecting appropriate machine learning models based on specific application requirements and available computational resources. Further exploration into optimizing architectures like ConvNeXt may be warranted to enhance their performance for this critical task in non-invasive physiological monitoring.
This comparative analysis contributes valuable insights into the ongoing development of machine learning applications in remote photoplethysmography, paving the way for future research aimed at improving accuracy and efficiency in heart rate monitoring technologies.

5. Discussion and Conclusions

This study systematically evaluated several neural network architectures for extracting rPPG signals from facial images, highlighting their suitability for non-contact physiological monitoring systems. Two distinct training approaches were employed: one focusing on pre-training with only the fully connected layers trained and another training the entire network from scratch. These approaches provided valuable insights into the adaptability and performance of various architectures. The results revealed notable differences in performance across architectures, with some models benefiting from increased depth, such as ResNet, while others, like DenseNet, performed optimally with fewer layers. DenseNet121 emerged as the most effective architecture among all the networks tested, consistently delivering superior performance across diverse evaluation metrics. Its ability to reuse features and balance gradient flow proved particularly advantageous in accurately extracting subtle PPG signals from the input data. This success can be attributed to several factors. The modified DenseNet121, with its enhanced feature extraction capabilities, leveraged a well-structured convolutional base to extract relevant patterns while mitigating noise and distortions. The additional dense layers tailored for regression tasks enabled precise signal prediction, highlighting the value of customizing established architectures for specific applications like rPPG. While DenseNet121’s performance was robust, other architectures, such as ResNet and MobileNet, also demonstrated competitive results under certain configurations. Interestingly, ResNet and MobileNet exhibited strengths in specific configurations, suggesting that architecture depth and layer connectivity should be optimized based on the complexity of input data and target tasks. The strong performance of MobileNet’s version 1 highlights the potential of lightweight models for applications in resource-constrained environments, such as handheld devices. Despite these successes, challenges remain. The variability in input data quality, influenced by factors such as lighting conditions and motion artifacts, poses significant hurdles. While DenseNet121 managed to perform well under these constraints, further refinements, such as data augmentation or domain adaptation, could enhance robustness. Additionally, this study’s reliance on a specific dataset limits the generalizability of findings, underscoring the need for broader benchmarking. It is important to emphasize that these results were obtained on a dataset with a small number of participants, and an extended experiment with a greater number of participants is needed to further validate the model performance and improve generalizability. The choice of hyperparameters, including the learning rate and dropout, played a crucial role in the training process. However, systematic exploration of these parameters may reveal configurations that yield even better performance. The decision to employ a mean squared error (MSE) loss function proved effective for this regression task but may benefit from comparison with other loss functions tailored for physiological signal prediction. Building on the findings of this study, future research will focus on refining the proposed methodology to enhance system accuracy and broaden its applicability. Key areas of exploration include:
  • Hyperparameter Optimization: Fine-tuning parameters such as learning rates, dropout rates, and layer configurations in DenseNet121 and other promising models to further improve performance and reduce prediction errors.
  • Expanding Signal Scope: Extending the system to extract additional physiological signals such as blood pressure and respiratory rate. This expansion will increase the clinical utility of the system, enabling comprehensive health monitoring in a non-contact manner.
  • Real-Time Applications: Developing a standalone system optimized for real-time operation on handheld devices. This step will involve adapting the architecture to handle resource constraints while maintaining accuracy, paving the way for portable and scalable monitoring solutions.
  • Addressing Variability in Input Data: Exploring techniques to improve the robustness of the system under diverse conditions, including varying lighting, skin tones, and motion artifacts. This may involve integrating data augmentation strategies or employing domain adaptation techniques to enhance model generalization.
  • Benchmarking with Larger Datasets: Testing the system on larger and more diverse datasets to validate its scalability and reliability. Incorporating datasets with real-world variability will ensure the robustness of the model in practical applications.
  • Investigating Lightweight Architectures: Exploring more efficient neural network architectures tailored for edge computing, such as MobileNet variants or transformer-based models optimized for smaller datasets.
  • Clinical Integration: Collaborating with medical professionals to evaluate the system in clinical environments, particularly for applications in telemedicine, neonatal care, and ICU monitoring.
In conclusion, the insights from this study highlight the potential of neural networks, particularly DenseNet121, in advancing non-contact physiological monitoring. However, it must be reiterated that the findings are based on a limited dataset and should be interpreted as a foundation for future investigations rather than definitive conclusions. Future work aims to create a comprehensive, scalable, and clinically relevant tool for real-time health monitoring by addressing the identified challenges and expanding the system’s functionality.
Our study not only contributes valuable insights into the effectiveness of NN transfer learning models for rPPG signal estimation but also addresses critical challenges faced in this field. By providing a comprehensive comparison and analysis, we hope to inspire further advancements in non-contact physiological monitoring technologies that can improve patient care and outcomes. In summary, our comparative analysis highlights the strengths and weaknesses of various NN architectures in the context of rPPG signal estimation. Xception and ResNet101V2 demonstrated superior capabilities due to their effective feature extraction mechanisms, while MobileNet offered a lightweight alternative with efficient performance. DenseNet’s reliability and NasNetLarge’s adaptability further underscore the potential of these architectures in advancing non-invasive heart rate monitoring technologies. Conversely, EfficientNet and ConvNeXt illustrate the challenges associated with overly complex models when faced with specific datasets. Our findings emphasize the need for careful consideration of architecture selection based on task requirements and data characteristics in future research endeavors.

Author Contributions

Conceptualization, J.S., P.K. and P.S.; methodology, J.S. and P.K.; software, J.S. and P.S.; validation, J.S., P.K., P.S. and R.H.; formal analysis, J.S., P.K. and R.H.; investigation, J.S.; writing—original draft preparation, J.S., P.K. and P.S.; writing—review and editing, J.S., P.K. and R.H.; visualization, J.S. and P.K.; supervision, P.K. All authors have read and agreed to the published version of the manuscript.

Funding

This work was supported by Slovak Research and Development Agency under contract no. APVV-21-0502: BrainWatch: System for automatic detection of intracranial aneurysms.

Institutional Review Board Statement

This study was conducted in accordance with the Declaration of Helsinki, and approved by the Ethics Committee of University of Zilina in Zilina (9 August 2024).

Informed Consent Statement

Not applicable.

Data Availability Statement

The data presented in this study are available on request from the corresponding author. This is according to the laboratory rules.

Acknowledgments

This work was supported by the Slovak Research and Development Agency under project PP-COVID-20-0100: DOLORES. AI: The pandemic guard system and by collaboration with Brain:IT “Brainit.sk, s.r.o.”.

Conflicts of Interest

The authors declare no conflicts of interest.

Abbreviations

The following abbreviations are used in this manuscript:
ANNMSAdaptive Neural Network Model Selection
CNNConvolutional Neural Network
EVSExplained Variance Score
LSTMLong Short-Term Memory
MAEMean Absolute Error
MEMax Error
MPDMean Poisson Deviance
MSEMean Squared Error
NNNeural Network
PPGPhotoplethysmography
PPGIPhotoplethysmography Imagining
rPPGremote Photoplethysmography
SGDStochastic Gradient Descent
VGGVisual Geometry Group
V4VVision for Vitals

References

  1. Novita, D.; Adikusuma, F.W.; Rohadi, N.; Wibawa, B.M.; Trisanto, A.; Defi, I.R.; Fauziah, S.R. Development of contactless human vital signs monitoring device with remote-photoplethysmography using adaptive region-of-interest and hybrid processing methods. Intell.-Based Med. 2024, 10, 100160. [Google Scholar] [CrossRef]
  2. Sun, Y.; Thakor, N. Photoplethysmography revisited: From contact to noncontact, from point to imaging. IEEE Trans. Biomed. Eng. 2016, 63, 463–477. [Google Scholar] [CrossRef] [PubMed]
  3. Allen, J. Photoplethysmography and its application in clinical physiological measurement. Physiol. Meas. 2007, 28, R1–39. [Google Scholar] [CrossRef] [PubMed]
  4. Blanik, N.; Abbas, A.K.; Venema, B.; Blazek, V.; Leonhardt, S. Hybrid optical imaging technology for long-term remote monitoring of skin perfusion and temperature behavior. J. Biomed. Opt. 2014, 19, 016012. [Google Scholar] [CrossRef]
  5. Rubins, U.; Marcinkevics, Z.; Muckle, R.A.; Henkuzena, I.; Roze, A.; Grabovskis, A. Remote photoplethysmography for assessment of oral mucosa. In Proceedings of the Clinical and Preclinical Optical Diagnostics II (2019), Munich, Germany, 23–25 June 2019; Paper 11073_50. Optica Publishing Group: Washington, DC, USA, 2019; p. 11073_50. [Google Scholar] [CrossRef]
  6. Schraven, S.P.; Kossack, B.; Strüder, D.; Jung, M.; Skopnik, L.; Gross, J.; Hilsmann, A.; Eisert, P.; Mlynski, R.; Wisotzky, E.L. Continuous intraoperative perfusion monitoring of free microvascular anastomosed fasciocutaneous flaps using remote photoplethysmography. Sci. Rep. 2023, 13, 1532. [Google Scholar] [CrossRef] [PubMed]
  7. Premkumar, S.; Hemanth, D.J. Intelligent remote photoplethysmography-based methods for heart rate estimation from face videos: A survey. Informatics 2022, 9, 57. [Google Scholar] [CrossRef]
  8. Park, S.; Youn, H.; Lee, S.; Kwon, S. A Study on the Implementation of Temporal Noise-Robust Methods for Acquiring Vital Signs. IEEE Access 2024, 12, 24700–24713. [Google Scholar] [CrossRef]
  9. Liu, Y.; Guo, X.; Zhang, Y. Lightweight and interpretable convolutional neural network for real-time heart rate monitoring using low-cost video camera under realistic conditions. Biomed. Signal Process. Control 2024, 87, 105461. [Google Scholar] [CrossRef]
  10. Gao, H.; Zhang, C.; Pei, S.; Wu, X. LSTM-based real-time signal quality assessment for blood volume pulse analysis. Biomed. Opt. Express 2023, 14, 1119–1136. [Google Scholar] [CrossRef]
  11. Fontes, L.; Machado, P.; Vinkemeier, D.; Yahaya, S.; Bird, J.J.; Ihianle, I.K. Enhancing stress detection: A comprehensive approach through rPPG analysis and deep learning techniques. Sensors 2024, 24, 1096. [Google Scholar] [CrossRef]
  12. Patel, P.; Biradar, V. Monitoring physiological and mental well-being through video-based vital parameter measurement: A review. Int. J. Innov. Res. Technol. Sci. IJCTET 2024, 12, 79–86. [Google Scholar]
  13. Álvarez Casado, C.; Nguyen, L.; Silvén, O.; Bordallo López, M. Assessing the feasibility of remote photoplethysmography through videocalls: A study of network and computing constraints. In Image Analysis. SCIA 2023; Lecture Notes in Computer Science; Springer Nature: Cham, Switzerland, 2023; pp. 586–598. [Google Scholar]
  14. Svoboda, L.; Sperrhake, J.; Nisser, M.; Zhang, C.; Notni, G.; Proquitté, H. Contactless heart rate measurement in newborn infants using a multimodal 3D camera system. Front. Pediatr. 2022, 10, 897961. [Google Scholar] [CrossRef] [PubMed]
  15. Chen, Y.J.; Lin, L.C.; Yang, S.T.; Hwang, K.S.; Liao, C.T.; Ho, W.H. High-reliability non-contact photoplethysmography imaging for newborn care by a generative artificial intelligence. IEEE Access 2023, 11, 90801–90810. [Google Scholar] [CrossRef]
  16. Park, J.; Seok, H.S.; Kim, S.S.; Shin, H. Photoplethysmogram analysis and applications: An integrative review. Front. Physiol. 2021, 12, 808451. [Google Scholar] [CrossRef] [PubMed]
  17. Wu, B.F.; Chu, Y.W.; Huang, P.W.; Chung, M.L. Neural Network Based Luminance Variation Resistant Remote-Photoplethysmography for Driver’s Heart Rate Monitoring. IEEE Access 2019, 7, 57210–57225. [Google Scholar] [CrossRef]
  18. Revanur, A.; Li, Z.; Ciftci, U.A.; Yin, L.; Jeni, L.A. The First Vision For Vitals (V4V) Challenge for Non-Contact Video-Based Physiological Estimation. In Proceedings of the 2021 IEEE/CVF International Conference on Computer Vision Workshops (ICCVW), Montreal, BC, Canada, 11–17 October 2021; pp. 2760–2767. [Google Scholar] [CrossRef]
  19. Pediaditis, M.; Farmaki, C.; Schiza, S.; Tzanakis, N.; Galanakis, E.; Sakkalis, V. Contactless respiratory rate estimation from video in a real-life clinical environment using Eulerian magnification and 3D CNNs. In Proceedings of the 2022 IEEE International Conference on Imaging Systems and Techniques (IST), Virtual, 21–23 June 2022; pp. 1–6. [Google Scholar] [CrossRef]
  20. Wang, H.; Huang, J.; Wang, G.; Lu, H.; Wang, W. Surveillance Camera-based Cardio-respiratory Monitoring for Critical Patients in ICU. In Proceedings of the 2022 IEEE-EMBS International Conference on Biomedical and Health Informatics (BHI), Ioannina, Greece, 27–30 September 2022; pp. 1–4. [Google Scholar] [CrossRef]
  21. Molinaro, N.; Schena, E.; Silvestri, S.; Bonotti, F.; Aguzzi, D.; Viola, E.; Buccolini, F.; Massaroni, C. Contactless vital signs monitoring from videos recorded with digital cameras: An overview. Front. Physiol. 2022, 13, 801709. [Google Scholar] [CrossRef] [PubMed]
  22. Zhang, C.; Gebhart, I.; Kühmstedt, P.; Rosenberger, M.; Notni, G. Enhanced contactless vital sign estimation from real-time multimodal 3D image data. J. Imaging 2020, 6, 123. [Google Scholar] [CrossRef]
  23. Wang, W.; Weiss, S.; den Brinker, A.C.; Wuelbern, J.H.; Tormo, A.G.i.; Pappous, I.; Sénégas, J. Fundamentals of Camera-PPG Based Magnetic Resonance Imaging. IEEE J. Biomed. Health Inform. 2022, 26, 4378–4389. [Google Scholar] [CrossRef] [PubMed]
  24. Lee, J.S.; Hwang, G.; Ryu, M.; Lee, S.J. LSTC-rPPG: Long Short-Term Convolutional Network for Remote Photoplethysmography. In Proceedings of the 2023 IEEE/CVF Conference on Computer Vision and Pattern Recognition Workshops (CVPRW), Vancouver, BC, Canada, 17–24 June 2023; pp. 6015–6023. [Google Scholar] [CrossRef]
  25. Xiong, J.; Ou, W.; Yao, Y.; Liu, Y.; Gao, Z.; Liu, Z.; Gou, J. STGNet: Spatio-temporal graph neural networks considering inherent properties of physiological signals for camera-based remote photoplethysmography. Biomed. Signal Process. Control. 2024, 98, 106690. [Google Scholar] [CrossRef]
  26. Lee, S.; Lee, M.; Sim, J.Y. DSE-NN: Deeply Supervised Efficient Neural Network for Real-Time Remote Photoplethysmography. Bioengineering 2023, 10, 1428. [Google Scholar] [CrossRef]
  27. Zhao, C.; Cao, P.; Hu, M.; Huang, B.; Chen, H.; Li, J. WTC3D: An Efficient Neural Network for Noncontact Pulse Acquisition in Internet of Medical Things. IEEE Trans. Ind. Inform. 2024; early access. 1–10. [Google Scholar] [CrossRef]
  28. Chavlis, S.; Poirazi, P. Drawing inspiration from biological dendrites to empower artificial neural networks. Curr. Opin. Neurobiol. 2021, 70, 1–10. [Google Scholar] [CrossRef]
  29. Apicella, A.; Donnarumma, F.; Isgrò, F.; Prevete, R. A survey on modern trainable activation functions. Neural Netw. 2021, 138, 14–32. [Google Scholar] [CrossRef]
  30. Mallak, A. Comprehensive Machine and Deep Learning Fault Detection and Classification Approaches of Industry 4.0 Mechanical Machineries: With Application to a Hydraulic Test Rig. Ph.D. Thesis, Universität Siegen, Siegen, Germany, 2021. [Google Scholar] [CrossRef]
  31. Lillicrap, T.P.; Santoro, A.; Marris, L.; Akerman, C.J.; Hinton, G. Backpropagation and the brain. Nat. Rev. Neurosci. 2020, 21, 335–346. [Google Scholar] [CrossRef] [PubMed]
  32. Jais, I.; Ismail, A.R.; Qamrun Nisa, S. Adam Optimization Algorithm for Wide and Deep Neural Network. Knowl. Eng. Data Sci. 2019, 2, 41. [Google Scholar] [CrossRef]
  33. Masters, D.; Luschi, C. Revisiting Small Batch Training for Deep Neural Networks. arXiv 2018, arXiv:1804.07612. [Google Scholar] [CrossRef]
  34. Yamashita, R.; Nishio, M.; Do, R.K.G.; Togashi, K. Convolutional neural networks: An overview and application in radiology. Insights Imaging 2018, 9, 611–629. [Google Scholar] [CrossRef]
  35. Salman, S.; Liu, X. Overfitting Mechanism and Avoidance in Deep Neural Networks. arXiv 2019, arXiv:1901.06566. [Google Scholar] [CrossRef]
  36. Keras. Keras Applications. Available online: https://keras.io/api/applications/ (accessed on 17 December 2024).
  37. Cruz, A.C.; Luvisi, A.; De Bellis, L.; Ampatzidis, Y. X-FIDO: An Effective Application for Detecting Olive Quick Decline Syndrome with Deep Learning and Data Fusion. Front. Plant Sci. 2017, 8, 1741. [Google Scholar] [CrossRef] [PubMed]
  38. Simonyan, K.; Zisserman, A. Very Deep Convolutional Networks for Large-Scale Image Recognition. arXiv 2015, arXiv:1409.1556. [Google Scholar] [CrossRef]
  39. He, K.; Zhang, X.; Ren, S.; Sun, J. Deep Residual Learning for Image Recognition. arXiv 2015, arXiv:1512.03385. [Google Scholar] [CrossRef]
  40. Szegedy, C.; Vanhoucke, V.; Ioffe, S.; Shlens, J.; Wojna, Z. Rethinking the Inception Architecture for Computer Vision. arXiv 2015, arXiv:1512.00567. [Google Scholar] [CrossRef]
  41. Chollet, F. Xception: Deep Learning with Depthwise Separable Convolutions. arXiv 2017, arXiv:1610.02357. [Google Scholar] [CrossRef]
  42. Howard, A.G.; Zhu, M.; Chen, B.; Kalenichenko, D.; Wang, W.; Weyand, T.; Andreetto, M.; Adam, H. MobileNets: Efficient Convolutional Neural Networks for Mobile Vision Applications. arXiv 2017, arXiv:1704.04861. [Google Scholar] [CrossRef]
  43. Huang, G.; Liu, Z.; van der Maaten, L.; Weinberger, K.Q. Densely Connected Convolutional Networks. arXiv 2018, arXiv:1608.06993. [Google Scholar] [CrossRef]
  44. Zoph, B.; Vasudevan, V.; Shlens, J.; Le, Q.V. Learning Transferable Architectures for Scalable Image Recognition. arXiv 2018, arXiv:1707.07012. [Google Scholar] [CrossRef]
  45. Tan, M.; Le, Q.V. EfficientNet: Rethinking Model Scaling for Convolutional Neural Networks. arXiv 2020, arXiv:1905.11946. [Google Scholar] [CrossRef]
  46. Tan, M.; Le, Q.V. EfficientNetV2: Smaller Models and Faster Training. arXiv 2021, arXiv:2104.00298. [Google Scholar] [CrossRef]
  47. Liu, Z.; Mao, H.; Wu, C.Y.; Feichtenhofer, C.; Darrell, T.; Xie, S. A ConvNet for the 2020s. arXiv 2022, arXiv:2201.03545. [Google Scholar] [CrossRef]
Figure 1. Abstraction levels in neural network image [37].
Ai 06 00024 g001
Figure 2. Block diagram of the proposed system, illustrating the architecture of the Base model and Extension.
Ai 06 00024 g002
Figure 3. Predicted rPPG signal from Xception (orange line) architecture compared to the original PPG signal obtained from the subject (blue line).
Ai 06 00024 g003
Figure 4. Predicted rPPG signals from ResNet50 (orange line), ResNet101 (green line), and ResNet152 (yellow line) architectures are compared to the original PPG signal obtained from the subject (blue line).
Ai 06 00024 g004
Figure 5. Predicted rPPG signals from ResNet50V2 (orange line), ResNet101V2 (green line), and ResNet152V2 (yellow line) architectures are compared to the original PPG signal obtained from the subject (blue line).
Ai 06 00024 g005
Figure 6. Predicted rPPG signals from MobileNet (orange line) and MobileNetV2 (green line) architectures are compared to the original PPG signal obtained from the subject (blue line).
Ai 06 00024 g006
Figure 7. Predicted rPPG signals from DenseNet121 (orange line), DenseNet169 (green line), and DenseNet (yellow line) architectures are compared to the original PPG signal obtained from the subject (blue line).
Ai 06 00024 g007
Figure 8. Predicted rPPG signals from NasNetMobile (orange line) and NasNetLarge (green line) architectures are compared to the original PPG signal obtained from the subject (blue line).
Ai 06 00024 g008
Figure 9. Predicted rPPG signals from EfficientNetB0 (orange line) and EfficientNetV2B0 (green line) architectures are compared to the original PPG signal obtained from the subject (blue line).
Ai 06 00024 g009
Figure 10. Predicted rPPG signals from ConvNeXtTiny (orange line) and ConvNeXtBase (green line) architectures are compared to the original PPG signal obtained from the subject (blue line).
Ai 06 00024 g010
Figure 11. Performance comparison of machine learning architectures for rPPG signal estimation using three error metrics: MAE, MSE, and MPD. Among the tested models, DenseNet121 achieved the lowest MAE and MSE, indicating superior accuracy and reliability for this task. While other architectures, such as Xception and MobileNetV2, demonstrated relatively competitive performance, models like ConvNeXt exhibited higher error rates, suggesting lower suitability for precise rPPG signal estimation.
Ai 06 00024 g011
Table 1. Hyperparameter tuning.
ModelHyperparameterValue
Epochs250
Learning Rate0.0001
Batch size128
Convolutional Neural NetworkActivationReLU
Pooling size2 × 2
Pooling method“max”
Dropout rate0.5
Loss functionMSE
Table 2. Regression metrics for tested architectures.
ArchitectureMEEVSMAEMSER2MPD
(Best Value)0100±10
Xception0.4930.8480.0330.0050.8440.009
VGG160.5610.0000.1480.031−0.0020.059
VGG190.5530.0000.1480.0310.0000.059
ResNet500.6050.1800.1450.035−0.1520.070
ResNet1010.5820.0670.1430.0300.0290.057
ResNet1520.5370.2880.1100.0220.2880.042
ResNet50V20.4580.0990.1400.0280.0970.053
ResNet101V20.5480.7000.0680.0090.7000.018
ResNet152V20.5670.1740.1350.032−0.029−1.000
MobileNet0.6020.3830.1020.0190.3680.042
MobileNetV20.6090.0960.1420.0300.0060.060
DenseNet1210.5260.8550.0320.0040.8550.009
DenseNet1690.5390.8100.0420.0060.810−1.000
DenseNet2010.5290.7390.0650.0100.6630.020
NasNetMobile1.4730.3320.1050.0220.2670.039
NasNetLarge0.5350.8020.0440.0060.7920.012
EfficientNetB00.5110.0400.1480.034−0.0240.069
EfficientNetV2B01.146−0.1030.5580.348−9.574−1.000
ConvNeXtTiny0.5250.0000.1560.038−0.1500.076
ConvNeXtBase0.4780.0000.1520.033−0.0010.068
All metrics are measured for the specified architectures based on test datasets. Bold values in the table represent the three best-performing models across the examined metrics.
Disclaimer/Publisher’s Note: The statements, opinions and data contained in all publications are solely those of the individual author(s) and contributor(s) and not of MDPI and/or the editor(s). MDPI and/or the editor(s) disclaim responsibility for any injury to people or property resulting from any ideas, methods, instructions or products referred to in the content.

