Article

The Detection and Counting of Olive Tree Fruits Using Deep Learning Models in Tacna, Perú

by
Erbert Osco-Mamani
1,*,
Oliver Santana-Carbajal
1,
Israel Chaparro-Cruz
1,
Daniel Ochoa-Donoso
2 and
Sylvia Alcazar-Alay
3
1
Department of Informatics and Systems, Jorge Basadre Grohmann National University, Tacna 23003, Peru
2
Faculty of Electrical and Computer Engineering, ESPOL Polytechnic University, Escuela Superior Politécnica del Litoral, Guayaquil 0909022, Ecuador
3
Department of Food Engineering, National Intercultural University of Quillabamba, Cusco 08741, Peru
*
Author to whom correspondence should be addressed.
Submission received: 26 October 2024 / Revised: 19 December 2024 / Accepted: 24 December 2024 / Published: 1 February 2025
(This article belongs to the Special Issue Artificial Intelligence in Agriculture)

Abstract

:
Predicting crop performance is key to decision making for farmers and business owners. Tacna is the main olive-producing region in Perú, with an annual yield of 6.4 t/ha, mainly of the Sevillana variety. Recently, olive production levels have fluctuated due to severe weather conditions and disease outbreaks. These climatic phenomena are expected to continue in the coming years. The objective of the study was to evaluate the performance of the model in natural and specific environments of the olive grove and counting olive fruits using CNNs from images. Among the models evaluated, YOLOv8m proved to be the most effective (94.960), followed by YOLOv8s, Faster R-CNN and RetinaNet. For the mAP50-95 metric, YOLOv8m was also the most effective (0.775). YOLOv8m achieved the best performance with an RMSE of 402.458 and a coefficient of determination R2 of (0.944), indicating a high correlation with the actual fruit count. As part of this study, a novel olive fruit dataset was developed to capture the variability under different fruit conditions. Concluded that the predicting crop from images requires consideration of field imaging conditions, color tones, and the similarity between olives and leaves.

1. Introduction

Olive production is an important agro-industrial activity for the economic and social development of the southern region of Perú, with 95% of the national production and an average yield of 6.4 t/ha [1]. The Tacna Region is characterized as a pioneer in olive production, with its economic benefits determined by the productivity and efficiency of profitability achieved in recent years. This has driven economic dynamism at the regional level, as evidenced by the production and agro-export of olives [1]. Tacna’s local economy depends on having stable production levels. However, climate change has caused significant variability in annual olive production in recent years; between 2022 and 2023, Tacna olive production decreased by 27%, and the early forecast for 2024 indicated an even more drastic decrease in production, caused by the El Niño–Southern Oscillation [2,3].
The automatic estimation of olive crop yield is necessary to select production strategies to mitigate the effects of climate change [4] and can also reduce labor costs, improve the accuracy of yield forecasts, and support farmers in developing more rational harvesting and marketing strategies. Past works on quantitative crops have exploited computer vision techniques for oranges [5], lemons [6], apples [7], blueberries [8], plums [9], walnuts [10], tomatoes [11], and grape bunches [12]. Changing lighting conditions, occlusion, shadows, relative scale, and complex backgrounds negatively affect fruit detection accuracy [13,14,15].
Regarding olive detection, past works have applied feature engineering to compute image descriptors based on mathematical morphology and relied on local contrast thresholding for segmentation [16,17]. Clustering in RGB color space using k-nearest neighbors was used to detect the ripening stage of olive fruit batches using a real-time computer vision method [18]. Although fruit detection based on deep learning has shown good results, the accurate counting of olive fruits is a challenging problem. Detection and localization errors may occur due to artifacts, background clutter, lighting fluctuations, scale variations, and occlusion. Even for a trained eye, it may be difficult to distinguish an olive from the foliage [19].
In this paper, we present an initial attempt to detect olives using widely varying deep learning techniques. The main objective of the study was to evaluate the model’s performance in natural and specific olive grove environments. To carry this out, we built a dataset of Sevillana olives and compared six deep learning models (YOLOv8m, YOLOv8s, Faster R-CNN 101, Faster R-CNN 50, RetinaNet 101, and RetinaNet 50) using RGB images captured in real production conditions. The suitability of each model was established by computing well-known object detection metrics.
In this study, a novel contribution is presented: (a) It is the first time that we have a dataset of images of harvested olive fruits in Tacna, Perú. (b) Although learning models have been used in previous research for detection tasks in agricultural environments, our work introduces an exhaustive evaluation of latest YOLOv8 models, applied specifically to the counting and detection of olive fruits of the Sevillian variety, which has not yet been explored in this domain. (c) Our approach not only uses YOLOv8 but also compares it with YOLOv8m, YOLOv8s, Faster R-CNN 101, Faster R-CNN 50, RetinaNet 101, and RetinaNet 50, evaluating key metrics such as average precision (map), training time, and average inference time. This comparative study provides information on the advantages and limitations of the models to provide a solid basis for selecting models based on the reader’s needs. (d) Although there is previous research related to the detection of fruits of crops such as tomatoes, apples or citrus fruits, our work focuses on olive fruits (olives), which present unique challenges due to size (1.5 to 3.5 cm), branch density, and variability in colors and textures.

2. Literarature Review

In recent years, significant advancements have been made in the automated detection of fruits and disease-related lesions. These advancements can be divided into two types of approaches: the use of feature engineering and supervised or unsupervised classification. For instance, the Hough transform [20,21] and the k-means algorithm are used in [22,23]. Features such as color, shape, texture, and edges of a fruit [24,25] can be exploited for feature extraction. The ability to recognize fruits in complex scenes is the main disadvantage of this type of detection. Changes in lighting, clutter, and noise negatively affect detection rates.
A more recent approach relies on convolutional neural networks (CNNs). Deep-learning-based methods automatically extract image features from large sample datasets [25]. CNNs have been used for crop disease [26], weed [27], and fruit ripeness detection [28].
Deep-learning-based detectors may have one or two processing stages. Single-stage detectors are trained by optimizing both object classification and localization simultaneously. Two-stage algorithms generate a large number of potential detections, which are then tested to determine if they contain the target object [29]. R-CNN [30], Fast R-CNN [31], and Mask R-CNN [32] are examples of two-stage CNNs used in fruit detection. Two-stage detection algorithms report higher accuracy than single-stage algorithms to detect objects at different scales and with complex spatial relationships. However, they are computationally demanding, as they perform classification and refinement in separate steps.
In Fu et al. [33], a Fast R-CNN is used for kiwi recognition, which demonstrated good robustness against changes in lighting and leaf occlusion. Kim et al. [9] used RGBD images of plums for growth estimation, considering various environments, including the depth information of objects in an outdoor field, based on the R-CNN model. Mu et al. [11] used a model to detect ripe tomatoes, addressing issues such as fruit occlusion and variable lighting conditions, based on the R-CNN model. Zhou et al. [34] used Faster R-CNN to identify oranges at different maturity levels in a natural environment under various weather conditions. Jia et al. [35] used a detection and segmentation method for apples based on Mask-R-CNN to improve the detection of overlapping fruits.
The YOLO architecture Redmon et al. [36] has also been applied for the detection and counting of grape clusters using YOLOv3, YOLOv4, and YOLOv5 models Sozzi et al. [37]. Kuznetsova et al. [38] compared the YOLOv3, YOLOv3-Dense, Faster R-CNN, DaSNet-v2, and LedNet models for apple detection. Yang et al. [39] used YOLOv8 for tomato detection and compared it with SSD, Faster R-CNN, YOLOv4, YOLOv5, and YOLOv7. Ma et al. [40] proposed a lightweight detection algorithm based on YOLOv7-tiny using RMSE and MAE metrics to evaluate counting accuracy. In Wu et al. [10], YOLOv8 was used for the identification and counting of walnuts in UAVs images. Xiao et al. [41] trained two models, YOLOv8 and CenterNet, extracting visual features from images of apples and pears, focusing on detailed analysis of the skin to predict the fruit class.

3. Materials and Methods

3.1. Detection Architectures

The six models that were subjected to analysis are outlined below.

3.1.1. YOLOv8

YOLOv8 is a popular real-time object detection algorithm that has been improved over time, with its first version (YOLOv1) proposed in 2015 and the most recent, YOLOv8, introduced in 2023. YOLOv8 has 5 versions with different scales: YOLOv8n (nano), YOLOv8s (small), YOLOv8m (medium), YOLOv8l (large), and YOLOv8x (extra large). These versions share a common architectural approach but differ in the depth and width of their layers [42]. The versions YOLOv8s (depth: 0.33, width: 0.5) and YOLOv8m (depth: 0.67, width: 0.75) were chosen for use.

3.1.2. Faster R-CNN

Faster R-CNN is an object detection architecture that efficiently and accurately addresses the problem of generating region of interest (ROI) proposals. It consists of three main components: a shared convolutional network, a Region Proposal Network (RPN), and a detection module [43]. Faster R-CNN 50 (Backbone: ResNet50+FPN) [44] and Faster R-CNN 101 (Backbone: X101-FPN) [45] were chosen for use.

3.1.3. RetinaNet

RetinaNet is a single, unified network composed of a base network and two task-specific subnetworks. The base network is responsible for computing a convolutional feature map over the input image and is a pre-existing convolutional network. The first subnetwork performs convolutional object classification on the output of the base network, and the second subnetwork performs convolutional regression of bounding boxes. Both subnetworks have a simple design specifically proposed for dense single-stage detection [46]. RetinaNet 50 (Backbone: ResNet-50) and RetinaNet 101 (Backbone: ResNet-101) were chosen for use [47].
Table 1 shows the number of parameters of the models, as well as the AP (average precision), traditionally called “mean average precision” (mAP) [48]. The “mAP50-95” value was obtained by the models when evaluated on the COCO dataset [42,45].
YOLOv8 stands out for its speed and accuracy, making it ideal for real-time applications [5,36]. Faster R-CNN performs well in handling complex backgrounds and occlusion due to its robust design [43], while RetinaNet balances precision and efficiency by using focal loss, making it ideal for handling detection imbalances [46].

3.2. Tacna Olive Dataset

The proposed dataset was used for training and evaluating object detection models. Olive trees of the Sevillana variety were selected for the study, as shown in Figure 1. The tress images are located in the district of La Yarada, Los Palos, in the outskirts of Tacna (coordinates: 18°15′16.1″ S 70°26′30.7″ W)

3.2.1. Data Acquisition

A Canon EOS Rebel T6i camera with a CMOS sensor of 22.3 mm × 14.9 mm and a resolution of 24.2 MP, a measuring tape to measure the distance between the olive tree and the camera (5 m approximately), and a tripod were used to record images at the same distance from each tree trunk. The lens aperture was set to f/4.5 so that the depth of field allowed well-focused images of both the inner and outer leaves of the tree while having a full tree in the scene. The image acquisition work was performed between 10:00 and 17:00 h. The camera gain was set to 100 and the aperture to f/4.5. A total of 8 photos per tree were captured by positioning the tripod around each tree at 45-degree steps. In total, 100 trees were photographed, mostly resulting in 815 RAW images in CR2 format. Photos were selected based on their focus quality, resulting in a sample of 503 images for analysis (Figure 1).
Variations in lighting and camera position are inherent in the outdoor agricultural environment (Yarada Los Palos) due to factors such as changing sunlight, shadows cast by branches, or different recording angles. These conditions reflect the actual environment in which our model was implemented and contribute to the ecological validity of the study. To reduce inconsistencies, images were taken in groups in the morning and afternoon to account for direct light, partial shade, and cloudy days and at eight different angles of the tree. This ensures that the model is exposed to different weather conditions (sunny, partly cloudy, and cloudy). This allowed us to have images that represent the variability of natural illumination, position with respect to the sun, and that projected by the sun. This variability will allow the models trained from this dataset to be robust to a variety of environmental conditions.

3.2.2. Data Generation

The olive trees were photographed, resulting in 815 images. These images were formatted to uncompressed .PNG format to reduce storage without lost of detail. Finally, 24 regions of each tree image were cropped to optimize data processing. The dataset consisted of 19,560 images of 1000 × 1000 pixels. A representative sample of 12,072 images was carefully selected for labeling, taking into account the variation in lighting based on the time of capture in a balanced manner, thus reducing the time spent on the labeling process.

3.2.3. Data Labeling

The labeling phase began with 480 randomly selected .png images of olive fruits, manually labeled by an expert using the software Label Studio v14.3. Olive fruits were delimited using “bounding boxes”. An additional set of 576 images was subsequently labeled by the research team, with manual refinement by an expert to correct potential errors. This cyclic process of team labeling and expert labeling refinement was repeated over 5 iterations, during which the number of expert-labeled images gradually increased from 480 in the first iteration to 5064 in the final iteration. In each cycle, newly labeled data were used to improve the labeling process, enabling the efficient expert annotation of 10,728 images in the dataset.
The dataset was divided into 8549 (70.82%) images for training, 2179 (18.05%) images for validation, and 1344 (11.13%) images for testing, ensuring representativeness for each tree. Table 2 shows the information regarding the number of olive tree images, as well as the crops and pixels, after labeling 12,072 images. Ten training iterations of the studied models were performed to compare and generate the indicator reports for each epoch and model in a .csv file for subsequent analysis and evaluation.

3.3. Data Processing

3.3.1. Training

The training of the learning models was carried out on a workstation with the following specifications: Intel® Xeon® Silver 4214 2.20 GHz processor, 64 GB DDR4 2933 366 MHz RAM, 1 TB SSD storage, NVIDIA A5000 24GB GPU. Operating system: Ubuntu 22.04 LTS, CUDA Ver. 12.1, OpenCV, Jupyter-Lab v4.0.6, and other libraries focused on implementing deep learning models for object detection.
During this stage, each of the selected models was trained 10 times, as explained below: YOLOv8s, YOLOv8m, Faster R-CNN 50, Faster R-CNN 101, RetinaNet 50 and RetinaNet 101 models.Training was set to 100 epochs, with a batch size of 4 and a learning rate of 0.001, using pre-trained weights from the COCO dataset.
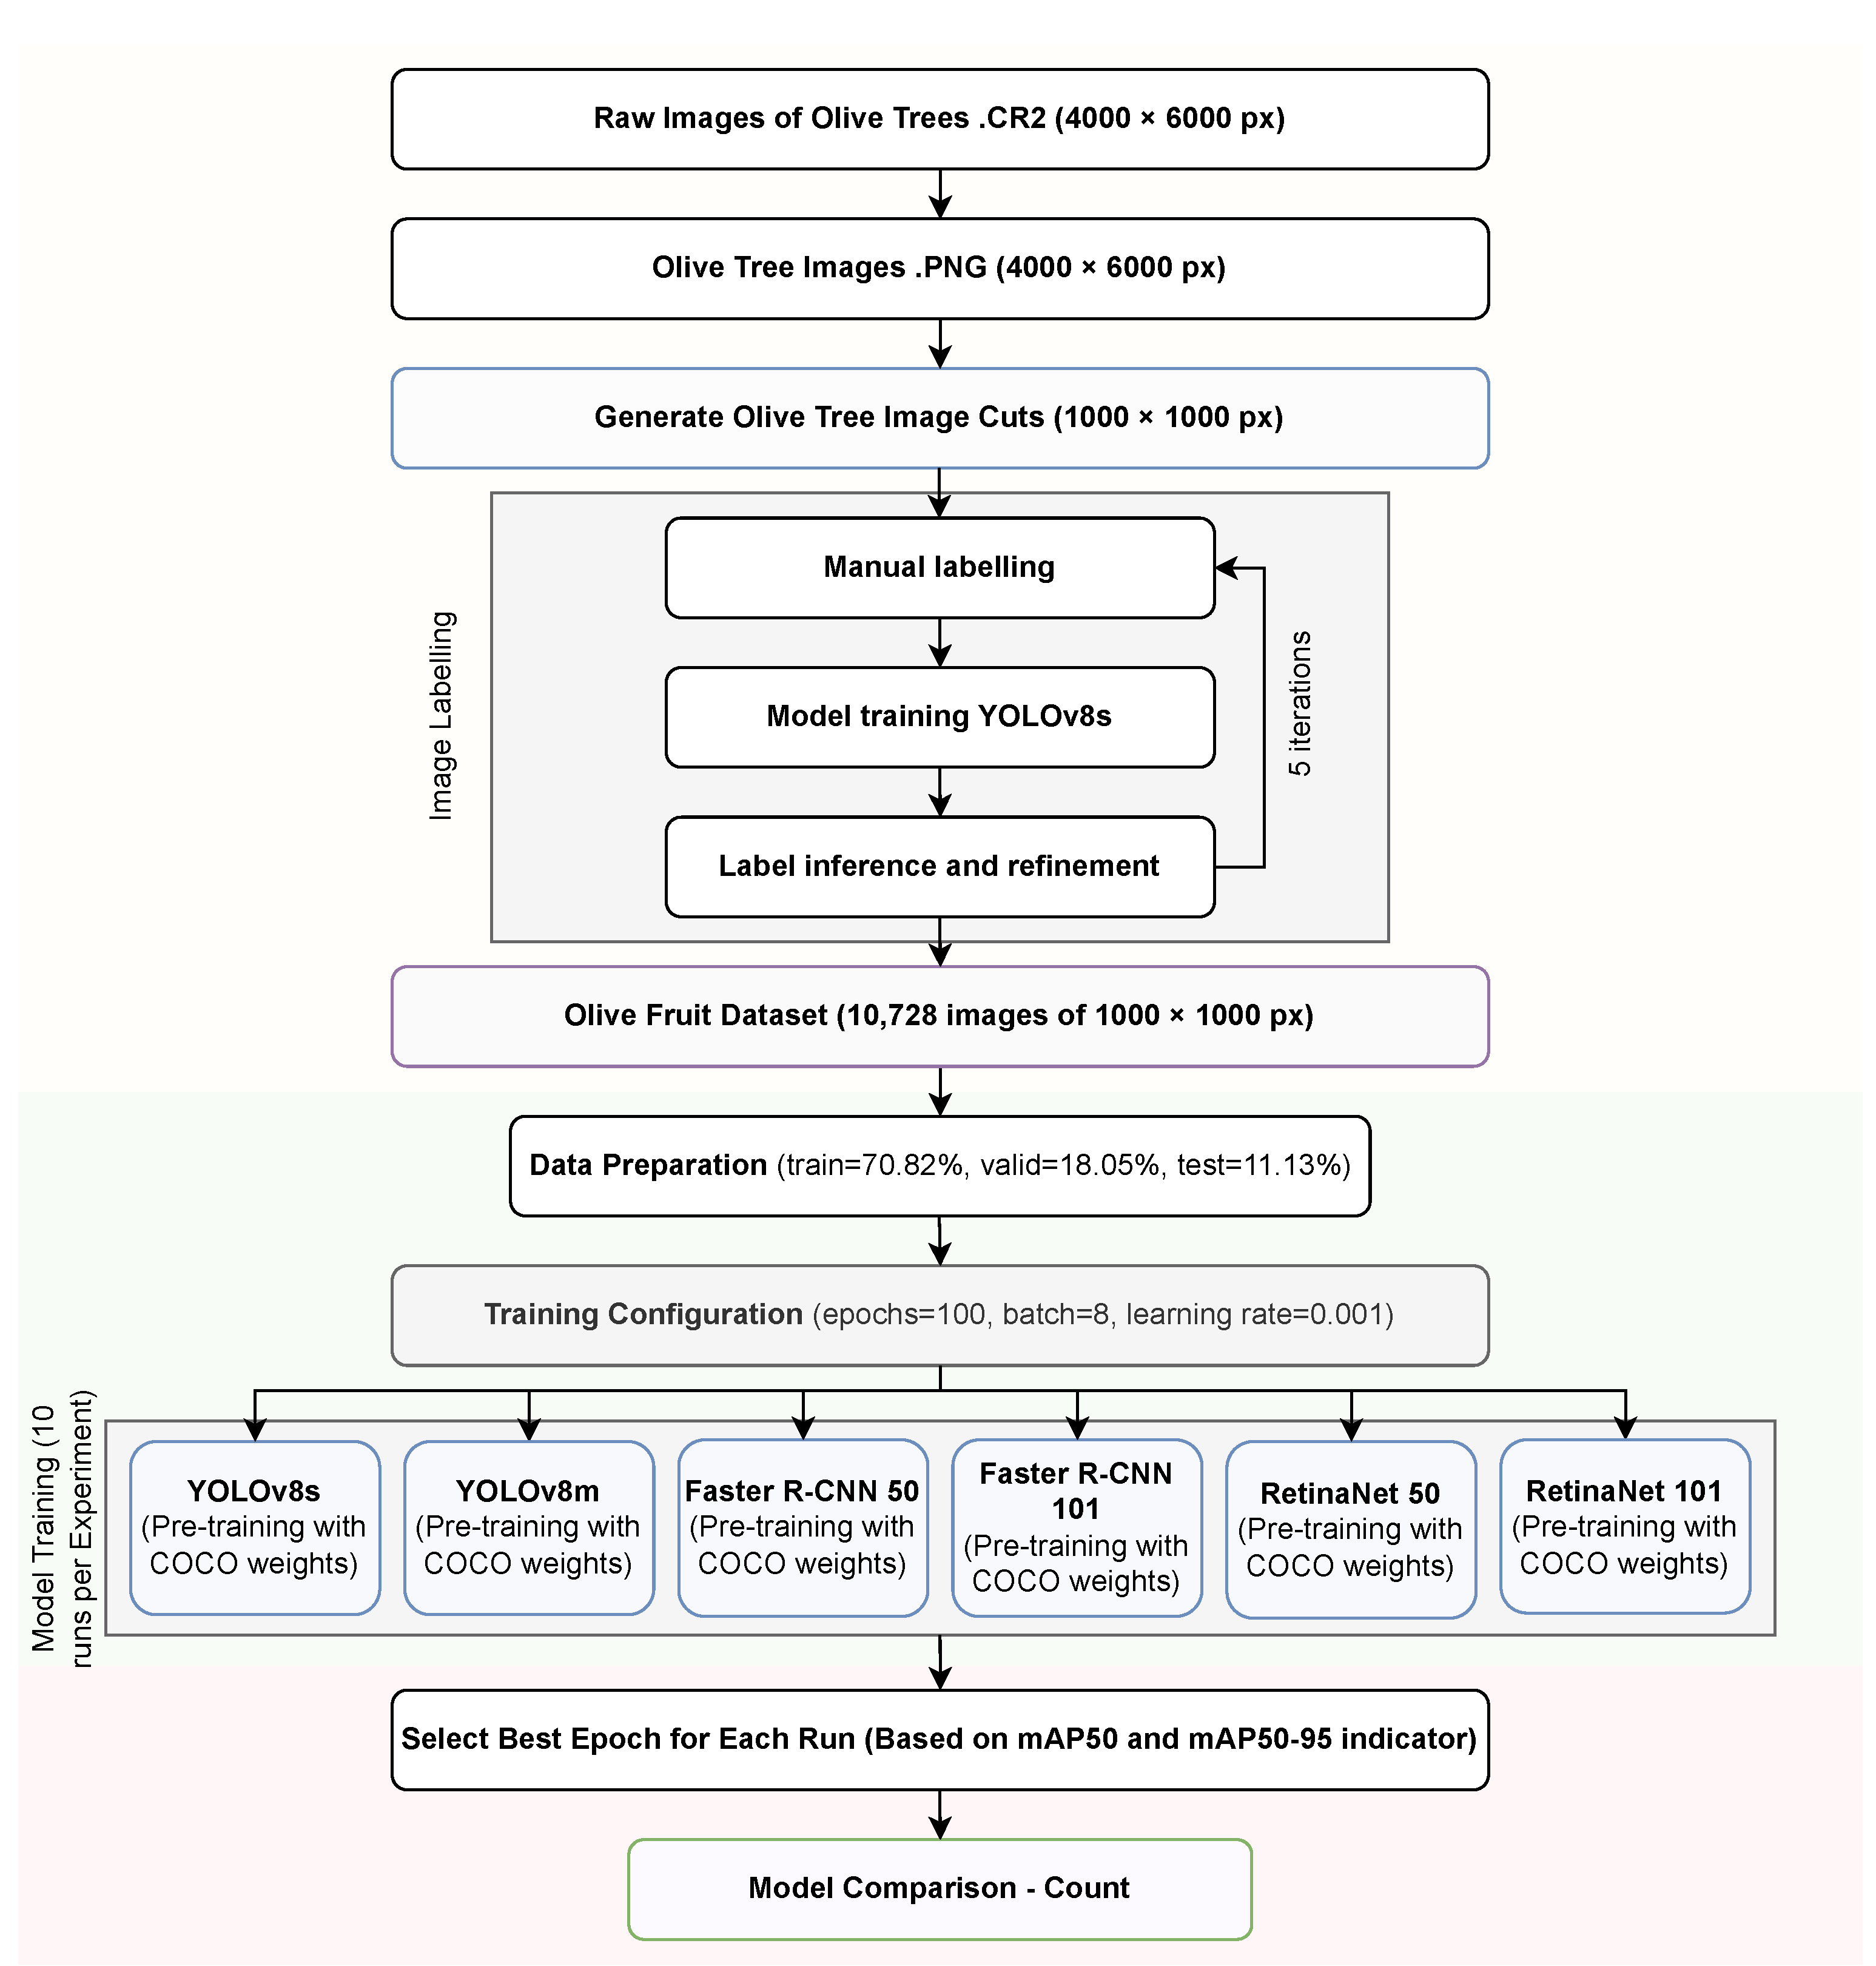
Figure 2 shows the technical process and training developed in this work.

3.3.2. Count

To carry out the counting measurement, all the olive fruits predicted by the models in the image crops were summed. Subsequently, the results from these crops were grouped by each complete image, and finally, 8 images were grouped for each tree, thus allowing a total fruit count for each tree to be obtained.

3.4. Evaluation Metrics

3.4.1. Intersection over Union (IoU)

According to Padilla et al. [49], the IoU measures the overlap area between the predicted bounding box and the actual bounding box, divided by the area of union between them. By comparing the IoU with a given threshold “t”, we can classify a detection as correct or incorrect. If IoU ≥ t, the detection is considered correct. If IoU < t, the detection is considered incorrect. Its calculation is determined in Equation (1).
IoU = area of overlap area of union

3.4.2. Mean Average Precision (mAP)

The mean average precision (mAP) is a metric used to assess the accuracy of object detectors across all classes in a given dataset [49].
mAP = 1 N i = 1 N AP i

3.4.3. MAP50

The mAP50 value is calculated with a single Intersection over Union (IoU) value of 0.50 [48].

3.4.4. MAP50-95

The mAP50-95 value is calculated over multiple Intersection over Union (IoU) values. Specifically, 10 IoU thresholds are used, ranging from 0.50 to 0.95 in steps of 0.05 [48]. In order to estimate mAP50-95, it was necessary to take steps of 0.05, starting from an IoU threshold of 0.5 and stopping at 0.95. The average precision in this interval is the AP of a single class. By repeating this process for all classes and calculating the mean of all classes, it is possible to calculate the mAP50-95 [50].

3.4.5. Root Mean Square Error (RMSE)

The root mean square error (RMSE) has been used as a standard statistical metric to measure model performance in meteorology, air quality, and climate research studies [51]. The RMSE and the MAE are calculated for the dataset as
RMSE = 1 n i = 1 n y ^ i y i 2

4. Results

4.1. Model Results for the mAP50 Indicator

In Figure 3, the mAP50 value is shown on the validation set for the models over the 100 epochs of training. The best results from the runs are highlighted, and the highest mAP50 values for each model are marked with stars in the respective colors indicated in the figure legend.
It can be observed that among the six models studied, the YOLOv8m model shows the best performance with an mAP50 value of 0.9496 at epoch 77. The YOLOv8s model reached a maximum mAP50 value of 0.94685 at epoch 78. The Faster R-CNN 101 model obtained a maximum mAP50 value of 0.723431 at epoch 97, while the Faster R-CNN 50 model achieved a maximum mAP50 value of 0.722168 at epoch 99. The RetinaNet 101 model reached a maximum mAP50 value of 0.693666 at epoch 97, and finally, the RetinaNet 50 model achieved a maximum mAP50 value of 0.683174 at epoch 99.

4.2. Model Results for the mAP50-95 Indicator

Figure 4 shows the mAP50-95 value on the validation set for the models over the 100 epochs of training. The best results from the runs are highlighted, and the highest mAP50-95 values for each model are marked with stars in the respective colors indicated in the figure legend.
It can be observed that the YOLOv8m model achieved the best performance with an mAP50-95 value of 0.77533 at epoch 80. The YOLOv8s model reached a maximum mAP50-95 value of 0.7707 at epoch 79. The Faster R-CNN 101 model obtained a maximum mAP50-95 value of 0.462735 at epoch 99, while the Faster R-CNN 50 model achieved a maximum mAP50-95 value of 0.455714 at epoch 99. The RetinaNet 101 model reached a maximum mAP50-95 value of 0.416039 at epoch 98, and finally, the RetinaNet 50 model achieved a maximum mAP50-95 value of 0.410199 at epoch 99.

4.3. Model Results for the mAP50 Indicator on the Box Plot

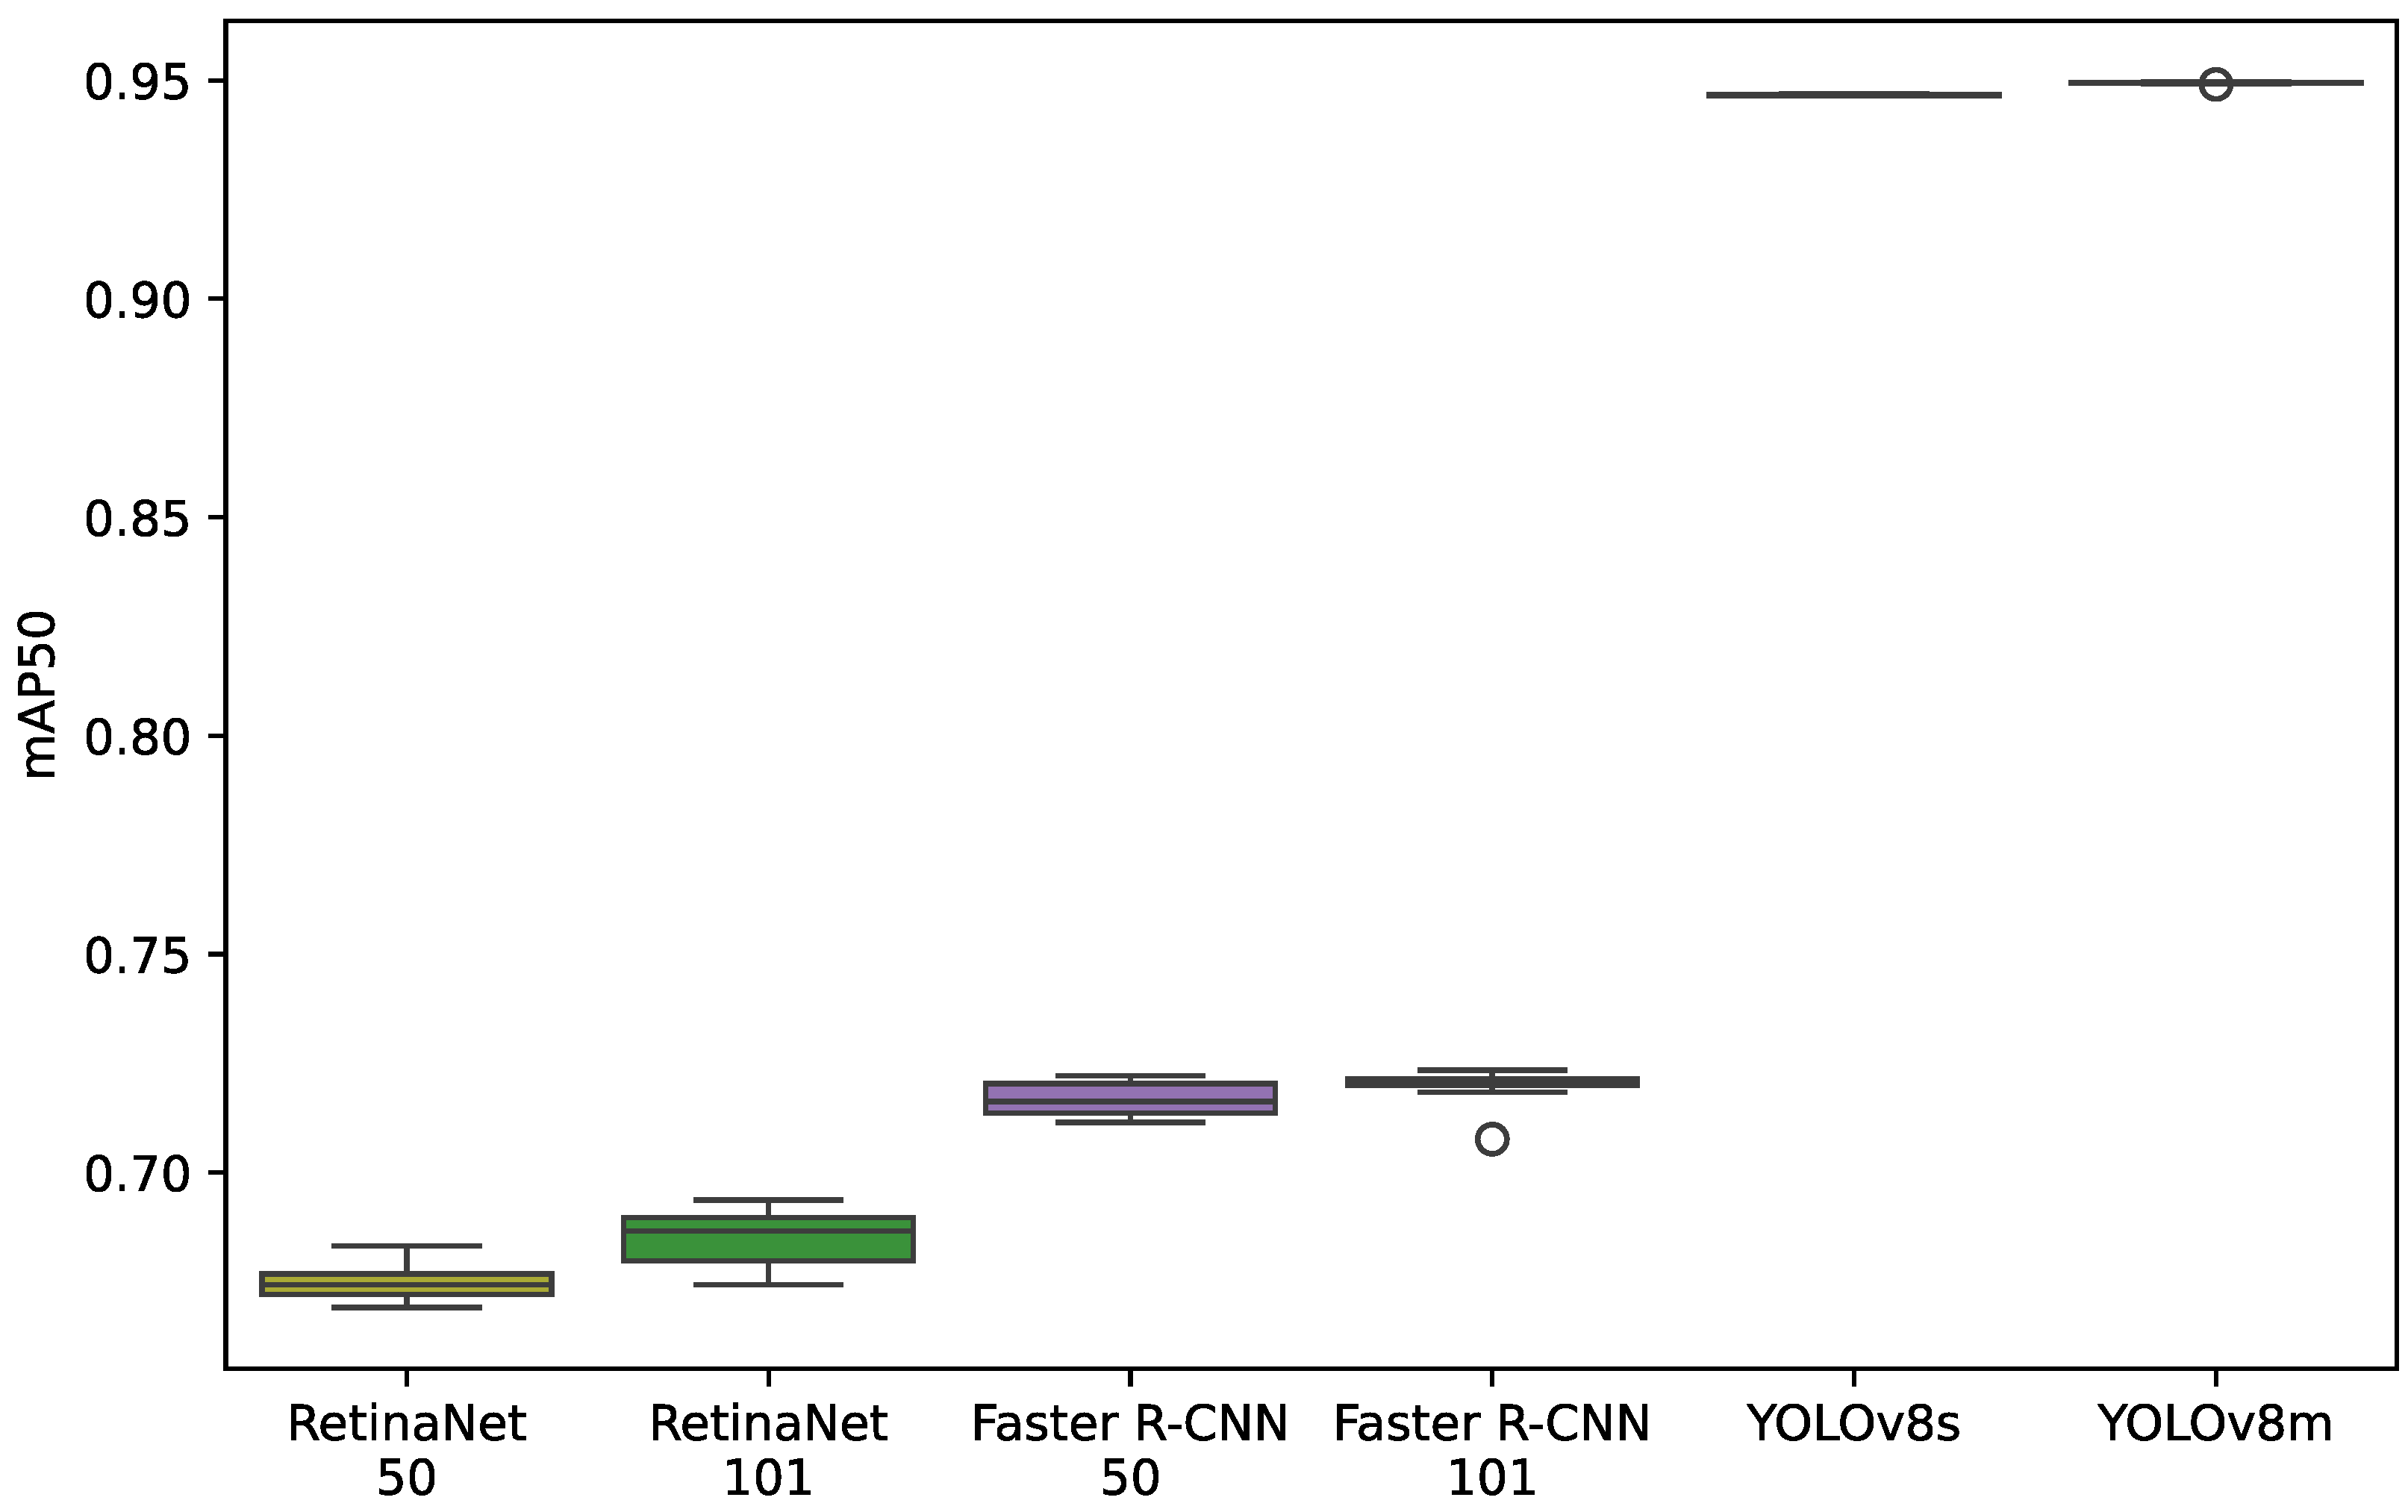
In Figure 5, the box plot shows the distribution of performance in terms of mAP50 for the RetinaNet, Faster R-CNN, and YOLOv8 models, with the dispersion represented by the Interquartile Range (IQR). The YOLOv8m and YOLOv8s models stand out for their high performance and minimal dispersion, reflected in IQRs of 0.00014 and 0.000165, indicating great consistency in their predictions. On the other hand, the Faster R-CNN 101 and 50 models, with IQRs of 0.00142625 and 0.006719, show greater variability in their results. The RetinaNet 101 and 50 models present the lowest performance and a broader dispersion, with IQRs of 0.0099085 and 0.004745.

4.4. Model Results for the mAP50-95 Indicator on the Box Plot

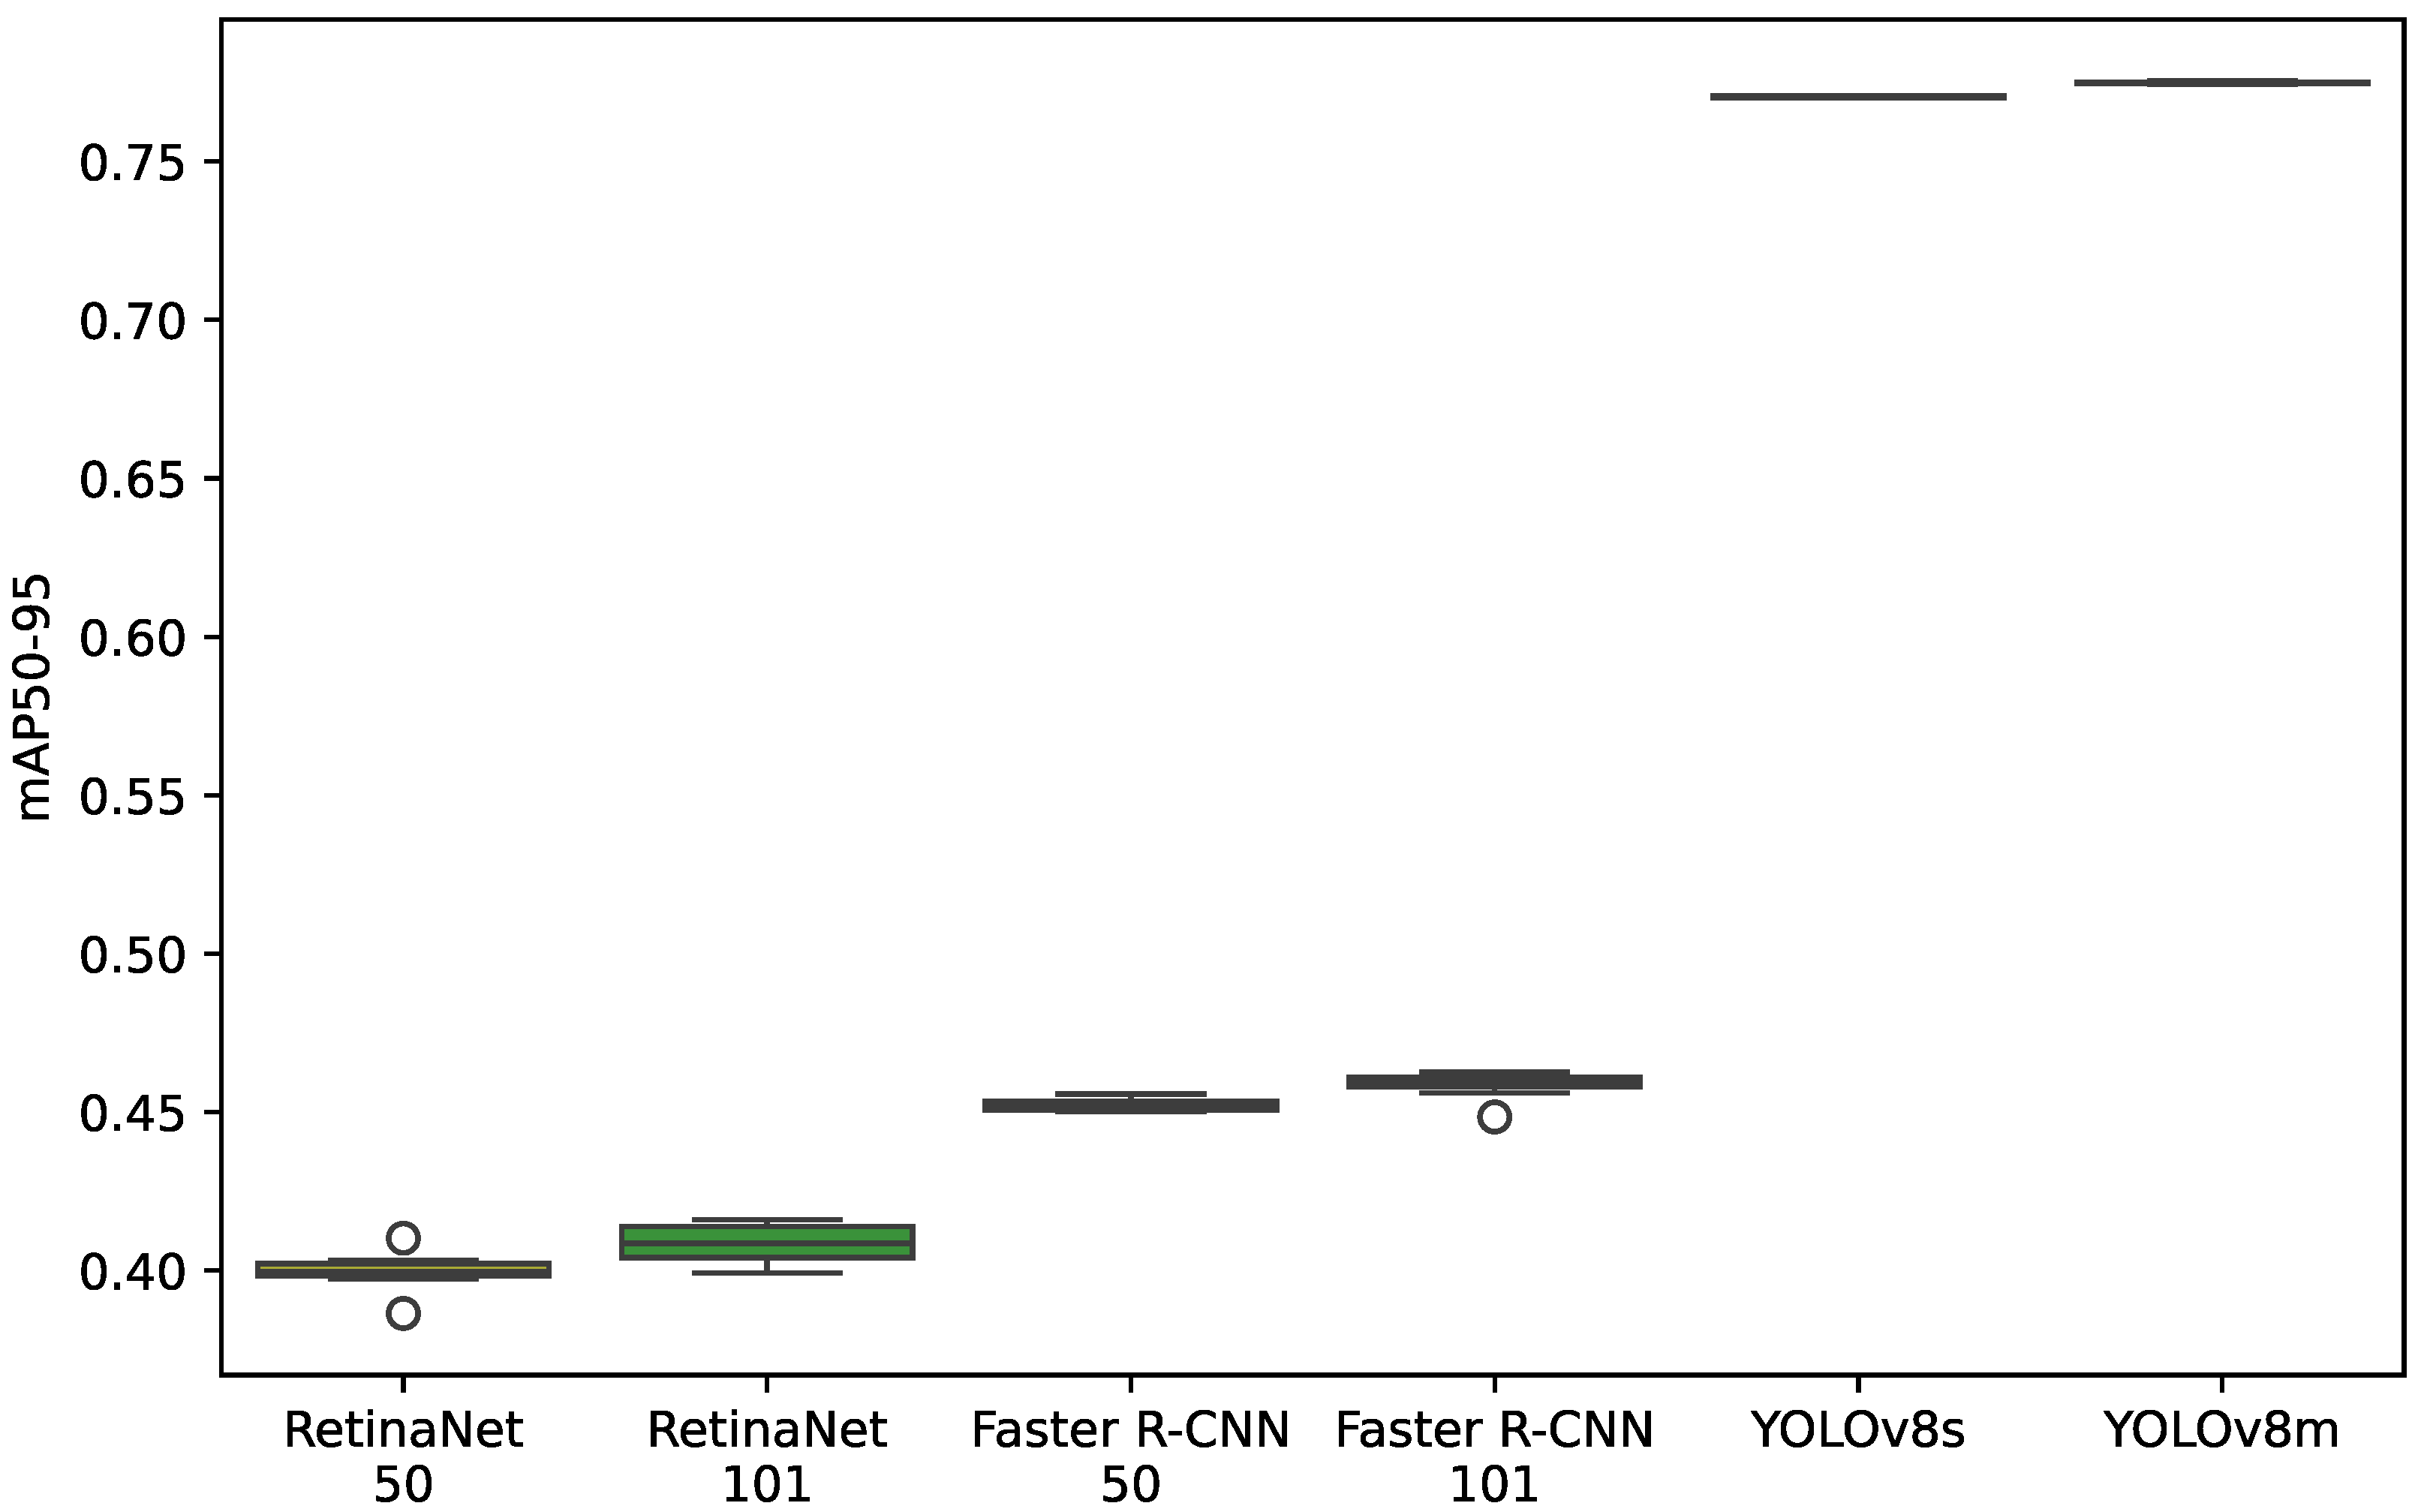
In Figure 6, the box plot presents the distribution of performance in terms of mAP50-95 for the RetinaNet, Faster R-CNN, and YOLOv8 models, with dispersion measured by the Interquartile Range (IQR).
The YOLOv8m and YOLOv8s models stand out once again, showing the highest results and the lowest dispersion, with IQRs of 0.00026 and 0.0005025, respectively, reflecting high consistency in their performance. The Faster R-CNN 101 and 50 models show lower results compared to YOLOv8 and greater variability, with IQRs of 0.0028417 and 0.00269775, respectively. The RetinaNet 101 and 50 models present the lowest medians and the highest dispersion among the evaluated models, with IQRs of 0.0098295 for RetinaNet 101 and 0.003743 for RetinaNet 50. These results confirm the superiority of YOLOv8 not only in terms of accuracy but also in consistency, outperforming the Faster R-CNN and RetinaNet models in the mAP50-95 metric.

4.5. Model Comparison

Table 3 shows the results of the YOLO, Faster, and RetinaNet models, for both the mAP50 and mAP50-95 metrics.
The results in Table 3 demonstrate that the YOLOv8m model not only achieves the best performance in the validation set with an mAP50 of 0.9496 and an mAP50-95 of 0.77533, but also outperforms the other models in the test set. Specifically, YOLOv8m achieves the highest values for mAP50 (0.98273) and mAP50-95 (0.96060) across all configurations. In contrast, YOLOv8s shows slightly lower performance, while Faster R-CNN 101, Faster R-CNN 50, RetinaNet 101, and RetinaNet 50 exhibit significantly reduced mAP values. The interquartile range (IQR) for YOLOv8m remains the lowest across both he validation and test sets, indicating a more stable and consistent performance. These results reinforce the efficiency and accuracy of the YOLOv8m model for olive fruit detection tasks compared to the other evaluated models.
In Table 4, the training time and average inference time for each analyzed model are presented, highlighting the efficiency of YOLOv8s compared to the other models. The study emphasizes that YOLOv8s not only delivers outstanding performance in fruit identification and counting but is also highly efficient in terms of speed, even though the task to be solved does not require real-time inference.
The results in Table 4 indicate that YOLOv8m takes longer to train due to its complexity, but with YOLOv8s, it manages to reduce training to approximately 5 h, which justifies its use in the detection and counting of olive fruits. The processing of the models utilized YOLOv8m and YOLOv8s, with YOLOv8m being more accurate (Table 3) and YOLOv8s being faster in inference (Table 4). However, for field applications, such as drones or mobile systems, lighter models like YOLOv8n are recommended. These are designed for hardware with low-performance GPUs due to constraints related to energy, cost, and portability.
Table 5 presents the RMSE results of the number of predictions from the models (using a confidence threshold of 0.5) applied to the 447 images, which were grouped into batches of 8 images per tree, generating 55 results corresponding to 55 trees. The results of the models were compared with the sum of the manual labels. The R2 value for YOLOv8m, which is 0.944, indicates the precision and quality of the model’s predictions, reflecting a high correlation between the predictions and the actual values.
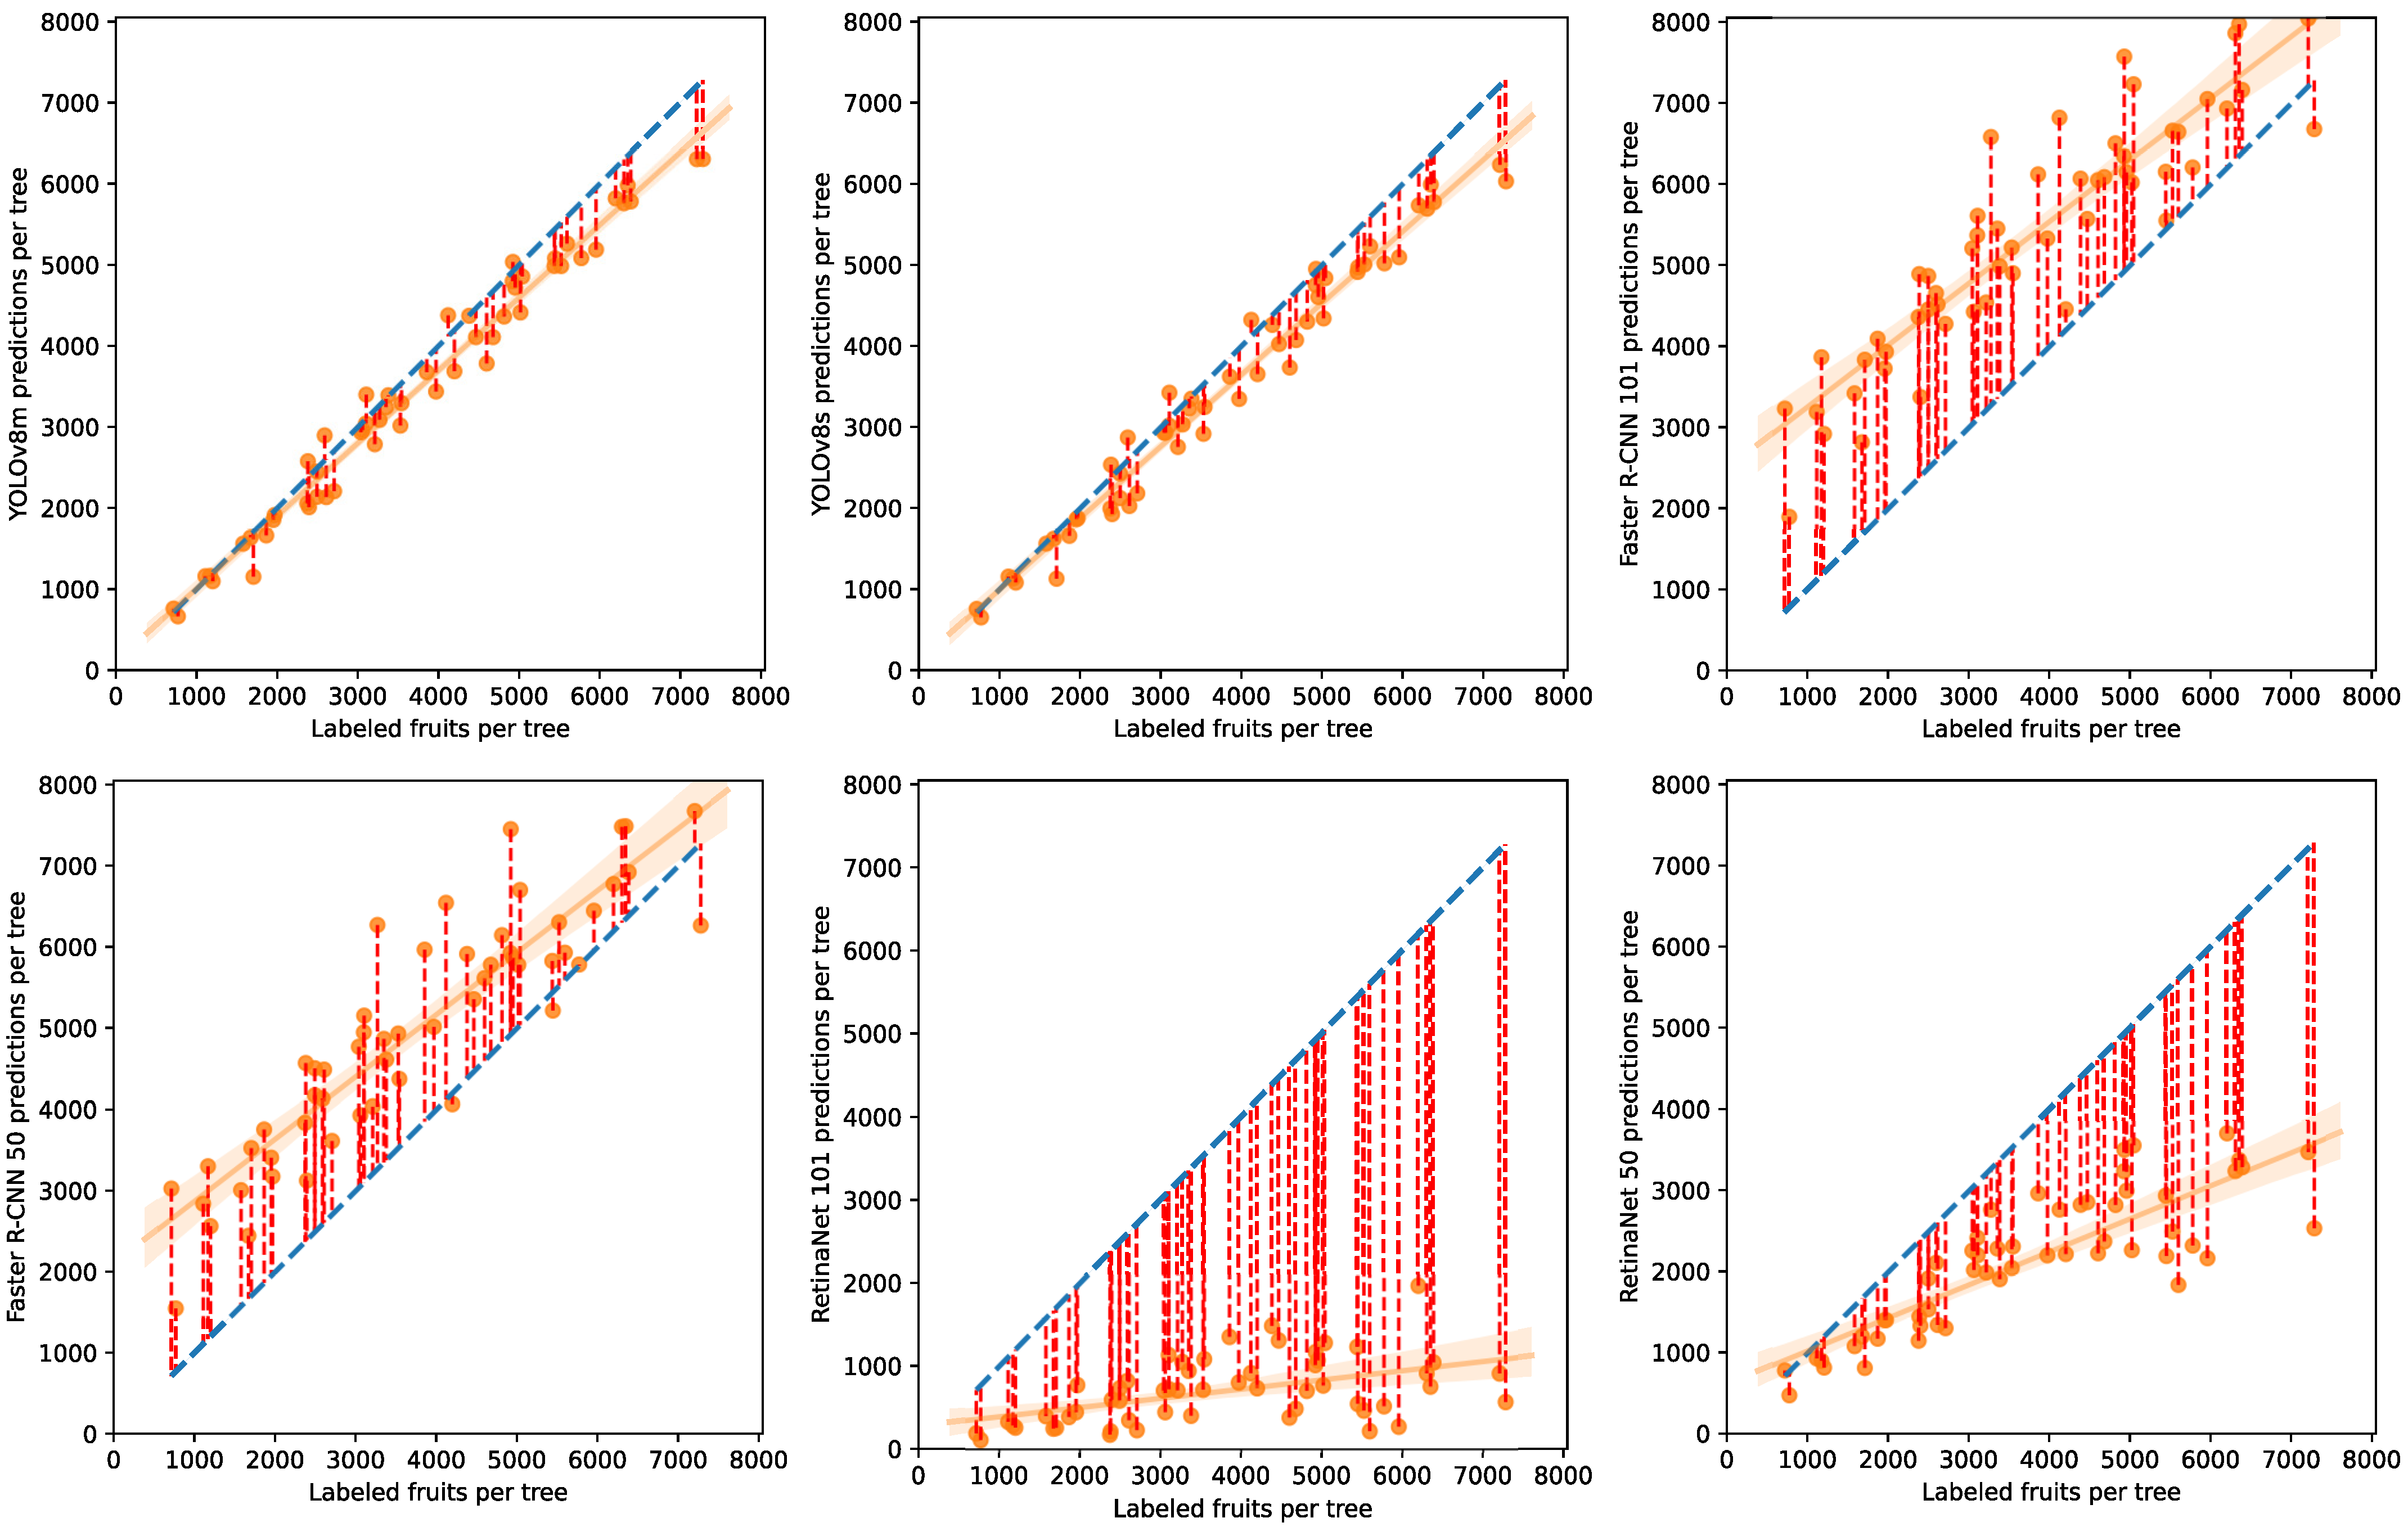
Figure 7 shows the relationship between the number of labeled fruits on olive trees and the predictions with a confidence value of 0.5 from the six deep learning models. Each graph indicates how the predictions of each model fit the real values through the blue reference line (perfect prediction), showing a scatter pattern where the YOLOv8m and YOLOv8s models demonstrate a closer fit to the reference line and come closer to the actual number of fruits labeled per tree.
As can be seen from the results in Table 5, the YOLOv8m model shows the lowest RMSE value for confidence thresholds (0.4, 0.5, 0.6), presenting the smallest prediction error. Regarding the average inference time, the YOLOv8s model shows the shortest time of 7.183 ms.
The results described above show the effectiveness of the models studied. Additionally, we have performed a qualitative analysis of the most important errors made by the model by categorizing the probable causes into (a) multiple fruits, (b) lighting conditions, (c) differentiation between green olives and olive leaves, and (d) fruits located at the edges of the image. Representative visual samples are shown in Figure 8.
The results of the normality test indicate a normal distribution of the data. In Table 6, the results of the ANOVA statistical test for the mAP50 and mAP50-95 metrics across the models are presented. The analysis shows that the performance differences in terms of mAP50 and mAP50-95 between some models are statistically significant (p < 0.05), validating the superiority of YOLOv8 under specific conditions. Table 6 shows the results of the ANOVA statistical test for the mAP 50 indicator of the models.
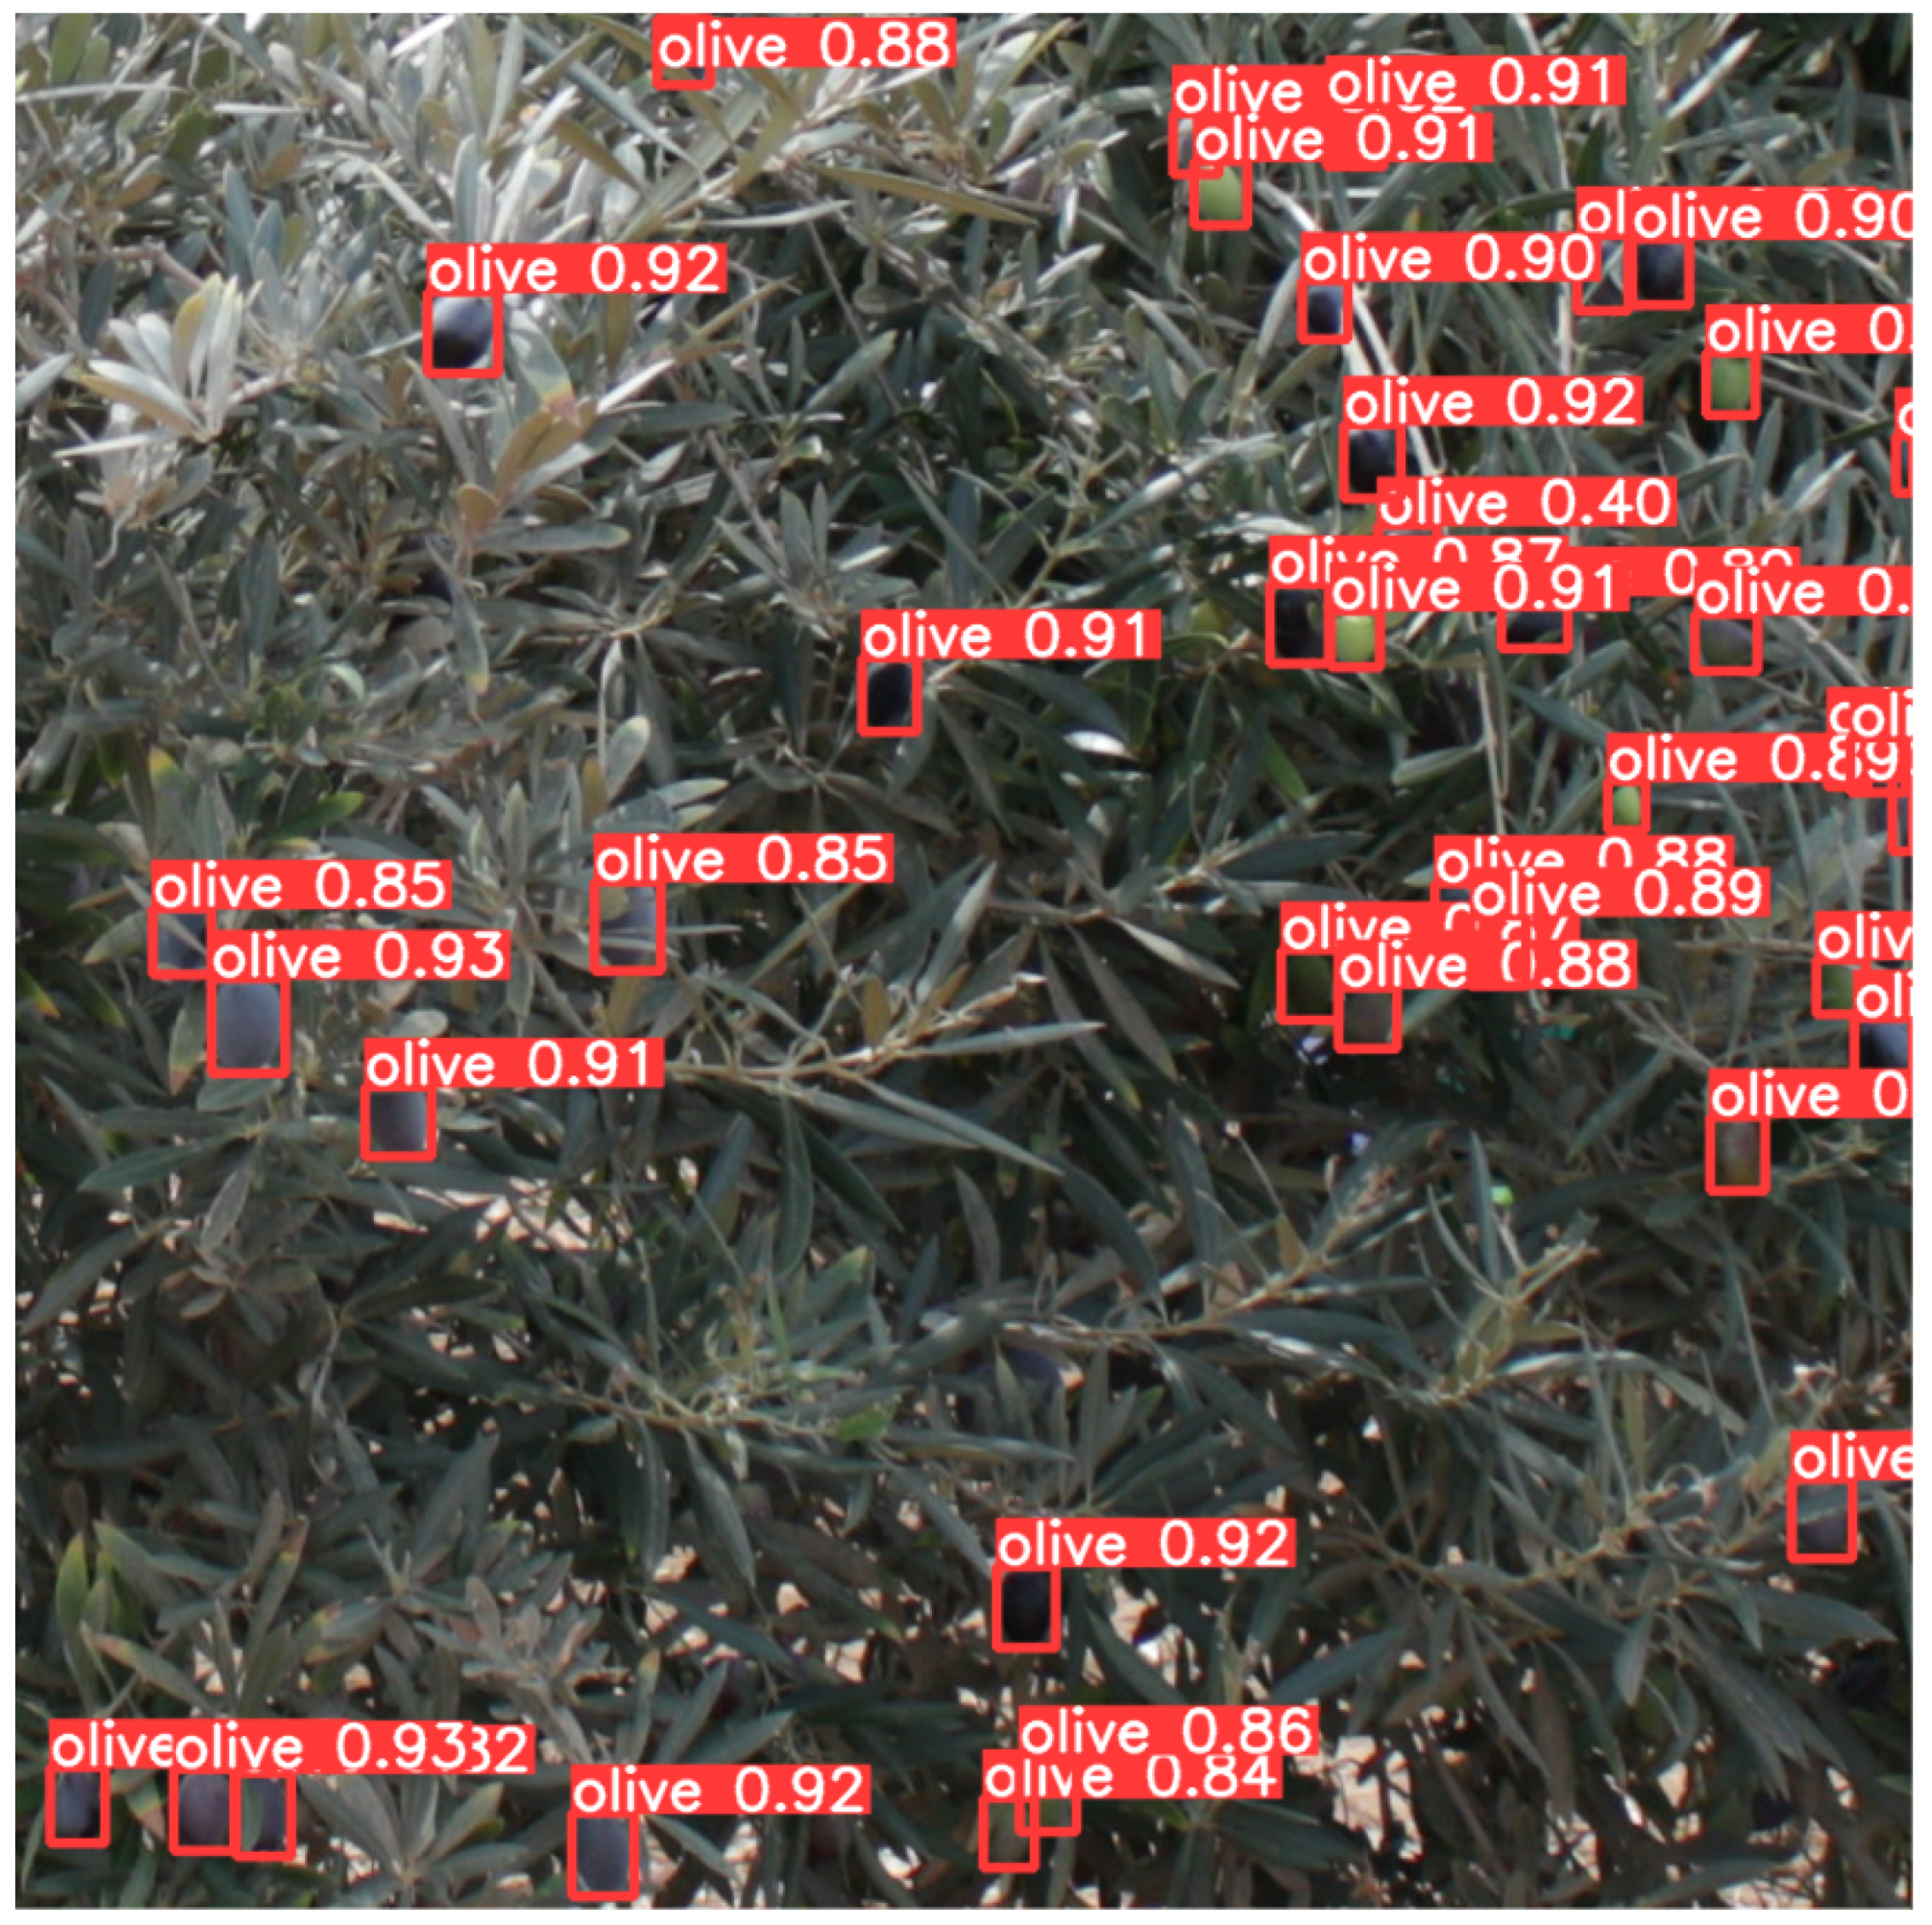
Figure 9 shows a cropped image from the validation set and the inference with a confidence threshold of 0.25 from the YOLOv8m model.
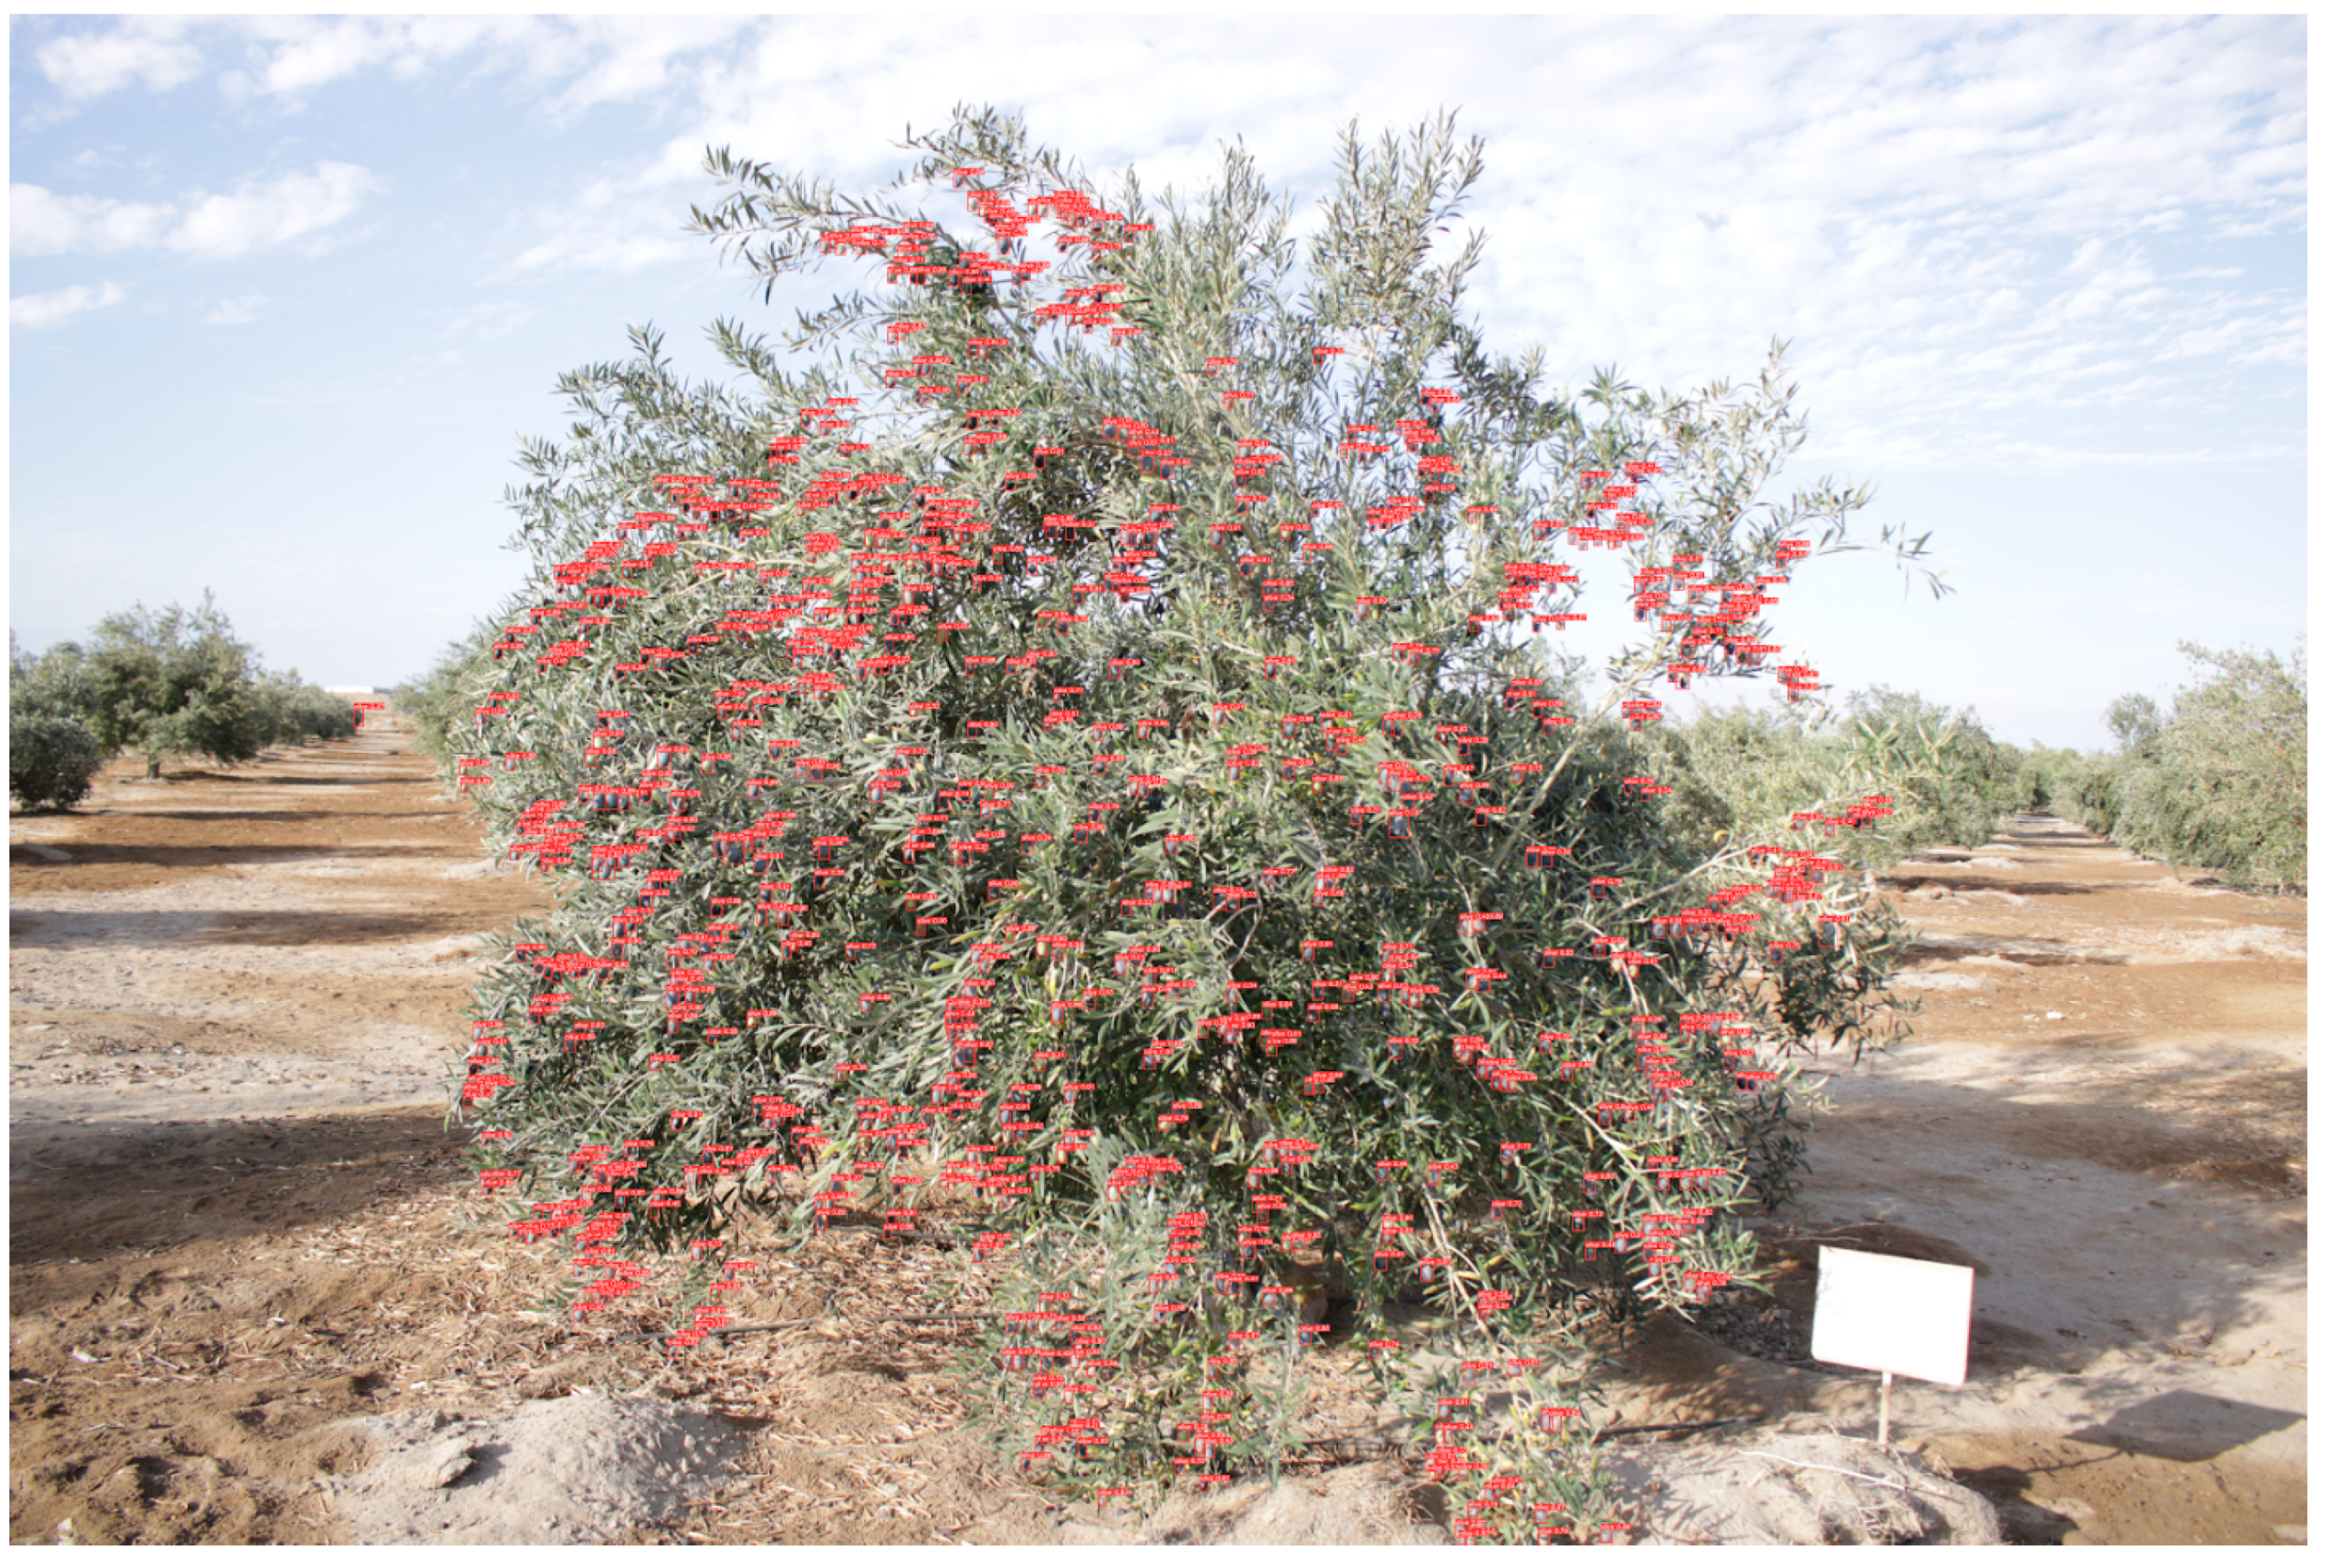
Figure 10 shows the result of applying the best model, YOLOv8m, to a full image of an olive tree using the sliced inference technique with SAHI.

5. Discussion

5.1. mAP50 Indicator

The data obtained for the mAP50 indicator (Figure 3) show that the best model was YOLOv8m (94.960), followed by YOLOv8s (94.685), Faster R-CNN 101 (72.343), Faster R-CNN 50 (72.217), RetinaNet 101 (69.367), and RetinaNet 50 (68.317) in the detection of Sevillana olive varieties. These results contrast with those obtained by Zhu et al. [28], who studied the detection of four olive varieties (Frantoio, Ezhi8, Leccino, and Picholine), achieving mAP50 indicators for YOLOv3 (90.87, 92.95, 91.24, and 93.67) and Faster R-CNN (93.56, 94.51, 93.05, and 94.81). In their research, the best performance was achieved by Faster R-CNN, with an mAP50 of 94.81 in the Picholine variety, and they also proposed the Olive-EfficientDet model. However, it is important to consider that the YOLO version used by Zhu et al. [28] is earlier than the one used in this study.
Studies by Yang et al. [39] for the detection of tomato fruits compared mAP50 measurements by applying YOLOv8 (91.9), YOLOv7 (91.6), YOLOv5 (91.2), and Faster R-CNN, which performed lower at (80.8). It is evident that the YOLOv8 model achieved better results than Faster R-CNN, similar to the performance of the model demonstrated in the present research, as well as showing that the YOLO model improves across its different versions. Additionally, in the work of Wu et al. [10], various YOLO versions were compared for walnut detection, and the mAP50 values for YOLOv5, YOLOv7, and YOLOv8 ranged from 95.9 to 96.9. Similarly, Lin et al. [5] in their citrus fruit research obtained mAP50 values using YOLOv8s (77.6) and Faster R-CNN (77.3), where both models showed similar performance with no significant differences in their results.
Regarding the results of the research conducted by Kim et al. [9] for plum detection, mAP50 values can be observed in the Faster R-CNN 101 models (73.63) and RetinaNet 101 (70.34), where Faster R-CNN obtained better results than those shown in our work (72.217), possibly due to the characteristics of the fruits studied.

5.2. mAP50-95 Indicator

The results obtained in this study show that for the mAP50-95 indicator, the best model was YOLOv8m (77.533), followed by YOLOv8s (77.070), Faster R-CNN 101 (46.274), Faster R-CNN 50 (45.571), RetinaNet 101 (41.604), and RetinaNet 50 (41.020). Similarly, other investigations such as Aljaafreh et al. [52], conducted for the detection of olive fruits from digital videos using deep neural networks, reported mAP50-95 values with YOLO models in two different versions, YOLOv5x (77.08) and YOLOv5s (74.13), obtaining comparable results. On the other hand, the research by Lin et al. [5] focused on detecting citrus fruits, achieving mAP50-95 values for the YOLOv8s models (57.0) and Faster R-CNN (47.2). In contrast to the results of this study on olive fruits, the YOLOv8s model shows a lower mAP50-95 index, while Faster R-CNN presents similar values.

5.3. Olive Fruit Count

The study by Bellocchio et al. [19], focusing on counting fruits (olives, almonds, and apples), developed an architecture that learns to count without specific task labels (object bounding boxes). The results show that this approach achieves performance values for the unsupervised model with RMSE of 2.44 ± 0.06, and for the supervised model, RMSE values of 2.03±0.07, which are analogous to the results of this study.
For the olive counting, the number of fruits detected by the models was compared with the number of manually labeled olives in each image set of a tree (see Table 5). In the inferences, a confidence threshold of 0.5 was used; the YOLOv8m model demonstrated the best performance in olive counting, achieving the lowest RMSE values (402.46) and the highest R2 values (0.94).
According to the results presented in Table 3, it is evident that YOLOv8m offers better performance compared to YOLOv8s, which can be attributed to its deeper architecture [42].
From the results obtained in out study, it is evident that the YOLOv8 model stands out for its balance between speed and precision, being ideal for real-time applications, as evidenced in our results in Table 3 and Table 4; YOLOv8 outperforms Faster R-CNN and RetinaNet due to its optimized architecture (FPN and PAN), which enhances the detection of small objects with speed and efficiency [5,42]. YOLOv8m stands out for its balance between accuracy and speed, making it ideal for detecting olive fruits under field conditions and the best choice for this study.
In future work, testing lightweight architectures such as YOLOv8n is planned to evaluate their performance compared to the larger models trained in this study. Nonetheless, it was observed that the YOLOv8s model offers better average inference times, as evidenced in Table 4. This is due to the fact that YOLOv8s, with its fewer layers and parameters, provides a balance between accuracy and speed.

6. Conclusions

The results demonstrated that the YOLOv8 models outperformed Faster-RCNN and RetinaNet in metrics such as mAP50, mAP50-95, RMSE, and R2, for both fruit detection and olive fruit counting. YOLOv8m achieved the best results in mAP50 (94.960) and mAP50-95 (77.533). Additionally, for counting, YOLOv8m also stood out with the lowest RMSE values (402.46) and the highest R2 (0.94). These results indicate that YOLOv8 not only excels in terms of accuracy (mAP50) but also exhibits lower variability, making it a more reliable and consistent option for detection compared to the other evaluated models.
It is concluded that the YOLOv8 model is the most suitable image processing model for detecting Sevillana-type olive fruits according to the results of this research. However, it is important to consider that factors such as camera positioning, shot distance, lighting, shadows, the type of device used, and other uncontrolled variables can affect the effectiveness of the deep learning models evaluated. All of these aspects should be taken into account to optimize performance in future applications.
The new dataset could be used in future work to address the limitations of trained models, along with the deployment of models on edge devices. However, it is worth mentioning that there are inexpensive devices on the market that support real-time YOLOv8s model inference, although this is not necessary for counting olives.

Author Contributions

Conceptualization, E.O.-M., O.S.-C., I.C.-C., D.O.-D. and S.A.-A.; methodology, E.O.-M. and S.A.-A.; formal analysis, E.O.-M.; project administration, E.O.-M.; supervision, E.O.-M.; writing—original draft, E.O.-M.; validation, O.S.-C.; visualization, O.S.-C.; software, I.C.-C. and D.O.-D.; data curation, I.C.-C. and D.O.-D.; writing—review & editing, S.A.-A. All authors have read and agreed to the published version of the manuscript.

Funding

This research was funded by resources from Canon, Sobrecanon, and mining royalties at the National University Jorge Basadre Grohmann of Tacna.

Institutional Review Board Statement

The study was conducted in accordance and approved by the Institutional Review Board (or Ethics Committee) of Universidad Nacional Jorge Basadre Grohmann, Tacna, Perú (protocol code 2023-035-CEIUNJBG).

Informed Consent Statement

Not applicable.

Data Availability Statement

The data presented in this study are available upon request from the corresponding author and can be accessed via the following link: “https://kaggle.com/datasets/1f0a4b51c3d5b2e73459b1b384585edde0e08d0ddb9874099e22b51e8a93a914 (accessed on 27 December 2024)”.

Conflicts of Interest

The authors declare no conflict of interest. The funders had no role in the design of the study; in the collection, analyses, or interpretation of data; in the writing of the manuscript; or in the decision to publish the results.

References

  1. Casanova Núñez Melgar, D.P. Guía Técnica del Cultivo de Olivo en la Región Tacna; Instituto Nacional de Innovación Agraria: Lima, Peru, 2022. [Google Scholar]
  2. Dawson, D. El Niño Diezma la Cosecha de Aceituna Peruana. Available online: https://es.oliveoiltimes.com/production/el-nino-decimates-peruvian-olive-harvest/127929 (accessed on 13 October 2024).
  3. de Agricultura Tacna, D.R. Región Tacna: Serie Histórica Producción Agropecuaria 2014–2023. Available online: https://www.agritacna.gob.pe/direcciones/estadistica-agraria (accessed on 17 December 2024).
  4. de Freitas Cunha, R.L.; Silva, B. Estimating crop yields with remote sensing and deep learning. In Proceedings of the 2020 IEEE Latin American GRSS & ISPRS Remote Sensing Conference (LAGIRS), Santiago, Chile, 22–26 March 2020; pp. 273–278. [Google Scholar] [CrossRef]
  5. Lin, Y.; Huang, Z.; Liang, Y.; Liu, Y.; Jiang, W. AG-YOLO: A Rapid Citrus Fruit Detection Algorithm with Global Context Fusion. Agriculture 2024, 14, 114. [Google Scholar] [CrossRef]
  6. Li, G.; Huang, X.; Ai, J.; Yi, Z.; Xie, W. Lemon-YOLO: An efficient object detection method for lemons in the natural environment. IET Image Process. 2021, 15, 1998–2009. [Google Scholar] [CrossRef]
  7. Hu, J.; Fan, C.; Wang, Z.; Ruan, J.; Wu, S. Fruit detection and counting in apple orchards based on improved Yolov7 and multi-Object tracking methods. Sensors 2023, 23, 5903. [Google Scholar] [CrossRef] [PubMed]
  8. Yang, W.; Ma, X.; An, H. Blueberry Ripeness Detection Model Based on Enhanced Detail Feature and Content-Aware Reassembly. Agronomy 2023, 13, 1613. [Google Scholar] [CrossRef]
  9. Kim, E.; Hong, S.J.; Kim, S.Y.; Lee, C.H.; Kim, S.; Kim, H.J.; Kim, G. CNN-based object detection and growth estimation of plum fruit (Prunus mume) using RGB and depth imaging techniques. Sci. Rep. 2022, 12, 20796. [Google Scholar] [CrossRef] [PubMed]
  10. Wu, M.; Yun, L.; Xue, C.; Chen, Z.; Xia, Y. Walnut Recognition Method for UAV Remote Sensing Images. Agriculture 2024, 14, 646. [Google Scholar] [CrossRef]
  11. Mu, Y.; Chen, T.S.; Ninomiya, S.; Guo, W. Intact detection of highly occluded immature tomatoes on plants using deep learning techniques. Sensors 2020, 20, 2984. [Google Scholar] [CrossRef]
  12. Peng, J.; Ouyang, C.; Peng, H.; Hu, W.; Wang, Y.; Jiang, P. MultiFuseYOLO: Redefining Wine Grape Variety Recognition through Multisource Information Fusion. Sensors 2024, 24, 2953. [Google Scholar] [CrossRef]
  13. Tian, Y.; Yang, G.; Wang, Z.; Wang, H.; Li, E.; Liang, Z. Apple detection during different growth stages in orchards using the improved YOLO-V3 model. Comput. Electron. Agric. 2019, 157, 417–426. [Google Scholar] [CrossRef]
  14. Ulutas, E.G.; ALTIN, C. Kiwi Fruit Detection with Deep Learning Methods. J. Adv. Nat. Sci. Eng. Res. 2023, 7, 39–45. [Google Scholar] [CrossRef]
  15. Kang, H.; Chen, C. Fruit detection, segmentation and 3D visualisation of environments in apple orchards. Comput. Electron. Agric. 2020, 171, 105302. [Google Scholar] [CrossRef]
  16. Ponce, J.M.; Aquino, A.; Millán, B.; Andújar, J.M. Olive-fruit mass and size estimation using image analysis and feature modeling. Sensors 2018, 18, 2930. [Google Scholar] [CrossRef] [PubMed]
  17. Ponce, J.M.; Aquino, A.; Millan, B.; Andújar, J.M. Automatic Counting and Individual Size and Mass Estimation of Olive-Fruits Through Computer Vision Techniques. IEEE Access 2019, 7, 59451–59465. [Google Scholar] [CrossRef]
  18. Ortenzi, L.; Figorilli, S.; Costa, C.; Pallottino, F.; Violino, S.; Pagano, M.; Imperi, G.; Manganiello, R.; Lanza, B.; Antonucci, F. A machine vision rapid method to determine the ripeness degree of olive lots. Sensors 2021, 21, 2940. [Google Scholar] [CrossRef]
  19. Bellocchio, E.; Ciarfuglia, T.A.; Costante, G.; Valigi, P. Weakly supervised fruit counting for yield estimation using spatial consistency. IEEE Robot. Autom. Lett. 2019, 4, 2348–2355. [Google Scholar] [CrossRef]
  20. Murillo-Bracamontes, E.A.; Martinez-Rosas, M.E.; Miranda-Velasco, M.M.; Martinez-Reyes, H.L.; Martinez-Sandoval, J.R.; Cervantes-de Avila, H. Implementation of Hough transform for fruit image segmentation. Procedia Eng. 2012, 35, 230–239. [Google Scholar] [CrossRef]
  21. Lin, G.; Tang, Y.; Zou, X.; Cheng, J.; Xiong, J. Fruit detection in natural environment using partial shape matching and probabilistic Hough transform. Precis. Agric. 2020, 21, 160–177. [Google Scholar] [CrossRef]
  22. Sidehabi, S.W.; Suyuti, A.; Areni, I.S.; Nurtanio, I. Classification on passion fruit’s ripeness using K-means clustering and artificial neural network. In Proceedings of the 2018 International Conference on Information and Communications Technology (ICOIACT), Yogyakarta, Indonesia, 6–7 March 2018; pp. 304–309. [Google Scholar] [CrossRef]
  23. Yu, Y.; Velastin, S.A.; Yin, F. Automatic grading of apples based on multi-features and weighted K-means clustering algorithm. Inf. Process. Agric. 2020, 7, 556–565. [Google Scholar] [CrossRef]
  24. Bhargava, A.; Bansal, A. Fruits and vegetables quality evaluation using computer vision: A review. J. King Saud-Univ. Comput. Inf. Sci. 2021, 33, 243–257. [Google Scholar] [CrossRef]
  25. Vibhute, A.; Bodhe, S.K. Applications of image processing in agriculture: A survey. Int. J. Comput. Appl. 2012, 52, 34–40. [Google Scholar] [CrossRef]
  26. Jafar, A.; Bibi, N.; Naqvi, R.A.; Sadeghi-Niaraki, A.; Jeong, D. Revolutionizing agriculture with artificial intelligence: Plant disease detection methods, applications, and their limitations. Front. Plant Sci. 2024, 15, 1356260. [Google Scholar] [CrossRef] [PubMed]
  27. Mesías-Ruiz, G.A.; Peña, J.M.; de Castro, A.I.; Borra-Serrano, I.; Dorado, J. Cognitive Computing Advancements: Improving Precision Crop Protection through UAV Imagery for Targeted Weed Monitoring. Remote Sens. 2024, 16, 3026. [Google Scholar] [CrossRef]
  28. Zhu, X.; Chen, F.; Zhang, X.; Zheng, Y.; Peng, X.; Chen, C. Detection the maturity of multi-cultivar olive fruit in orchard environments based on Olive-EfficientDet. Sci. Hortic. 2024, 324, 112607. [Google Scholar] [CrossRef]
  29. Wang, W.; Shi, Y.; Liu, W.; Che, Z. An Unstructured Orchard Grape Detection Method Utilizing YOLOv5s. Agriculture 2024, 14, 262. [Google Scholar] [CrossRef]
  30. Girshick, R.; Donahue, J.; Darrell, T.; Malik, J. Rich feature hierarchies for accurate object detection and semantic segmentation. In Proceedings of the IEEE Conference on Computer Vision and Pattern Recognition, Columbus, OH, USA, 23–28 June 2014; pp. 580–587. [Google Scholar] [CrossRef]
  31. Girshick, R. Fast R-CNN. In Proceedings of the 2015 IEEE International Conference on Computer Vision (ICCV), Santiago, Chile, 7–13 December 2015; pp. 1440–1448. [Google Scholar] [CrossRef]
  32. He, K.; Gkioxari, G.; Dollár, P.; Girshick, R. Mask r-cnn. In Proceedings of the IEEE International Conference on Computer Vision, Venice, Italy, 22–29 October 2017; pp. 2961–2969. [Google Scholar] [CrossRef]
  33. Fu, L.; Feng, Y.; Majeed, Y.; Zhang, X.; Zhang, J.; Karkee, M.; Zhang, Q. Kiwifruit detection in field images using Faster R-CNN with ZFNet. IFAC-PapersOnLine 2018, 51, 45–50. [Google Scholar] [CrossRef]
  34. Zhou, B.; Wu, K.; Chen, M. Detection of Gannan Navel Orange Ripeness in Natural Environment Based on YOLOv5-NMM. Agronomy 2024, 14, 910. [Google Scholar] [CrossRef]
  35. Jia, W.; Tian, Y.; Luo, R.; Zhang, Z.; Lian, J.; Zheng, Y. Detection and segmentation of overlapped fruits based on optimized mask R-CNN application in apple harvesting robot. Comput. Electron. Agric. 2020, 172, 105380. [Google Scholar] [CrossRef]
  36. Redmon, J.; Divvala, S.; Girshick, R.; Farhadi, A. You Only Look Once: Unified, Real-Time Object Detection. In Proceedings of the 2016 IEEE Conference on Computer Vision and Pattern Recognition (CVPR), Las Vegas, NV, USA, 27–30 June 2016; pp. 779–788. [Google Scholar] [CrossRef]
  37. Sozzi, M.; Cantalamessa, S.; Cogato, A.; Kayad, A.; Marinello, F. Automatic bunch detection in white grape varieties using YOLOv3, YOLOv4, and YOLOv5 deep learning algorithms. Agronomy 2022, 12, 319. [Google Scholar] [CrossRef]
  38. Kuznetsova, A.; Maleva, T.; Soloviev, V. Using YOLOv3 algorithm with pre-and post-processing for apple detection in fruit-harvesting robot. Agronomy 2020, 10, 1016. [Google Scholar] [CrossRef]
  39. Yang, G.; Wang, J.; Nie, Z.; Yang, H.; Yu, S. A lightweight YOLOv8 tomato detection algorithm combining feature enhancement and attention. Agronomy 2023, 13, 1824. [Google Scholar] [CrossRef]
  40. Ma, L.; Zhao, L.; Wang, Z.; Zhang, J.; Chen, G. Detection and counting of small target apples under complicated environments by using improved YOLOv7-tiny. Agronomy 2023, 13, 1419. [Google Scholar] [CrossRef]
  41. Xiao, B.; Nguyen, M.; Yan, W.Q. Fruit ripeness identification using YOLOv8 model. Multimed. Tools Appl. 2024, 83, 28039–28056. [Google Scholar] [CrossRef]
  42. Jocher, G.; Qiu, J.; Chaurasia, A. Detectron2. Available online: https://github.com/ultralytics/ultralytics (accessed on 13 October 2024).
  43. Ren, S.; He, K.; Girshick, R.; Sun, J. Faster R-CNN: Towards Real-Time Object Detection with Region Proposal Networks. IEEE Trans. Pattern Anal. Mach. Intell. 2017, 39, 1137–1149. [Google Scholar] [CrossRef] [PubMed]
  44. Chincholi, F.; Koestler, H. Detectron2 for lesion detection in diabetic retinopathy. Algorithms 2023, 16, 147. [Google Scholar] [CrossRef]
  45. Wu, Y.; Kirillov, A.; Massa, F.; Lo, W.Y.; Girshick, R. Detectron2. Available online: https://github.com/facebookresearch/detectron2 (accessed on 14 October 2024).
  46. Lin, T.Y.; Goyal, P.; Girshick, R.; He, K.; Dollár, P. Focal Loss for Dense Object Detection. IEEE Trans. Pattern Anal. Mach. Intell. 2020, 42, 318–327. [Google Scholar] [CrossRef] [PubMed]
  47. Santos, A.; Marcato Junior, J.; de Andrade Silva, J.; Pereira, R.; Matos, D.; Menezes, G.; Higa, L.; Eltner, A.; Ramos, A.P.; Osco, L.; et al. Storm-drain and manhole detection using the retinanet method. Sensors 2020, 20, 4450. [Google Scholar] [CrossRef] [PubMed]
  48. COCOdataset. Detection Evaluation. Available online: https://cocodataset.org/#detection-eval (accessed on 13 October 2024).
  49. Padilla, R.; Netto, S.L.; Da Silva, E.A. A survey on performance metrics for object-detection algorithms. In Proceedings of the 2020 International Conference on Systems, Signals and Image Processing (IWSSIP), Niteroi, Brazil, 1–3 July 2020; pp. 237–242. [Google Scholar] [CrossRef]
  50. Reis, D.; Kupec, J.; Hong, J.; Daoudi, A. Real-time flying object detection with YOLOv8. arXiv 2023, arXiv:2305.09972. [Google Scholar]
  51. Chai, T.; Draxler, R.R. Root mean square error (RMSE) or mean absolute error (MAE)?–Arguments against avoiding RMSE in the literature. Geosci. Model Dev. 2014, 7, 1247–1250. [Google Scholar] [CrossRef]
  52. Aljaafreh, A.; Elzagzoug, E.Y.; Abukhait, J.; Soliman, A.H.; Alja’Afreh, S.S.; Sivanathan, A.; Hughes, J. A Real-Time Olive Fruit Detection for Harvesting Robot Based on YOLO Algorithms. Acta Technol. Agric. 2023, 26, 121–132. [Google Scholar] [CrossRef]
Figure 1. Image of the olive tree (a) and crop obtained from the image of the olive tree (b).
Ai 06 00025 g001
Figure 2. Technical process (from top to bottom): data acquisition, generation, and labeling; partitioning; training; and results.
Ai 06 00025 g002
Figure 3. Mean average precision (mAP50) of the deep learning models.
Ai 06 00025 g003
Figure 4. Mean average precision (mAP50-95) of the deep learning models.
Ai 06 00025 g004
Figure 5. Box plot of mean average precision (mAP50) of the deep learning models.
Ai 06 00025 g005
Figure 6. Box plot of mean average precision (mAP50-95) of the deep learning models.
Ai 06 00025 g006
Figure 7. The relationship of the actual number of olive fruits vs. the predictions of six deep learning models.
Ai 06 00025 g007
Figure 8. Representativevisual examples of errors where the model failed.
Ai 06 00025 g008
Figure 9. Inferenceof the best YOLOv8m model on a crop image.
Ai 06 00025 g009
Figure 10. Inference of the best YOLOv8m model on a tree image.
Ai 06 00025 g010
Table 1. Characteristics of deep learning models.
ModelNumber of ParametersCOCO mAP50-95
YOLOv8s11.2 M44.9
YOLOv8m25.9 M50.2
Faster R-CNN 5042 M40.2
Faster R-CNN 101105 M43.0
RetinaNet 5038 M38.7
RetinaNet 10157 M40.4
Table 2. Sevillana variety olive tree dataset information.
Number of TreesOlive Tree ImagesImage CropsImage Size (px)Image Crop Size (px)TrainingValidationTest
6250312,0726000 × 40001000 × 1000854921791344
Table 3. Comparison of the performance of models YOLOv8, Faster R-CNN, and RetinaNet on the validation and test set.
SetMetricConfigYOLOv8mYOLOv8sFaster R-CNN 101Faster R-CNN 50RetinaNet 101RetinaNet 50
Validation SetmAP50Min ↑0.949080.946420.707640.711450.674310.66907
Max ↑0.949600.946850.723430.722170.693670.68317
Median ↑0.949430.946560.720440.716280.686630.67432
Mean ↑0.949410.946600.719500.716620.684990.67460
IQR ↓0.000140.000170.001430.006720.009910.00475
mAP50-95Min ↑0.774430.770010.448470.450160.399260.38647
Max ↑0.775330.770700.462740.455710.416040.41020
Median ↑0.774850.770300.459750.452170.408580.39963
Mean ↑0.774860.770350.458740.452380.408400.39980
IQR ↓0.000260.000500.002840.002700.009830.00374
Test SetmAP50Min ↑0.980520.973020.748230.709000.657020.67012
Max ↑0.982730.973960.771960.743580.744160.71648
Median ↑0.981270.973210.756980.734030.728240.71083
Mean ↑0.981420.973280.758220.732300.720330.70649
IQR ↓0.000270.000270.007640.015770.008450.00843
mAP50-95Min ↑0.951830.899840.470010.460710.357180.23806
Max ↑0.960600.900680.515990.497830.443120.42318
Median ↑0.953190.900210.492780.484310.415720.37883
Mean ↑0.953650.900230.493700.482240.408900.37242
IQR ↓0.001710.000290.015530.009400.046280.05260
Table 4. Training and inference time.
ModelAverage Training Time (Hrs)Average Inference Time (ms)
YOLOv8m8.64013.22
YOLOv8s5.01407.18
Faster R-CNN 1014.89687.04
Faster R-CNN 502.22143.60
RetinaNet 1012.64052.29
RetinaNet 502.20042.51
Table 5. RMSE and R2 of deep learning models.
ModelRMSER2
YOLOv8m402.460.94
YOLOv8s452.980.93
Faster R-CNN 1011758.15−0.06
Faster R-CNN 501435.630.29
RetinaNet 1013417.34−3.02
RetinaNet 501942.45−0.30
Table 6. Statistical test results of ANOVA (mAP50 and mAP50-95).
Sum of SquaresglRoot Mean SquareFSig.
mAP50Between groups0.84250.16810,640.9370.000
Within groups0.001540.000
Total0.84359
mAP50-95Between groups1.59450.31919,747.3370.000
Within groups0.001540.000
Total1.59559
Disclaimer/Publisher’s Note: The statements, opinions and data contained in all publications are solely those of the individual author(s) and contributor(s) and not of MDPI and/or the editor(s). MDPI and/or the editor(s) disclaim responsibility for any injury to people or property resulting from any ideas, methods, instructions or products referred to in the content.