Article

Radiomics-Based Machine Learning Models Improve Acute Pancreatitis Severity Prediction

1
Department of Radiology, Istanbul Medical Faculty, Istanbul University, Istanbul 34093, Turkey
2
Department of Radiology, Northwestern University, Chicago, IL 60611, USA
3
Department of Internal Medicine, Istanbul Medical Faculty, Istanbul University, Istanbul 34093, Turkey
4
Department of Radiation Oncology, Professor Doctor Cemil Tascioglu City Hospital, Istanbul 34384, Turkey
5
Department of General Surgery, Istanbul Medical Faculty, Istanbul University, Istanbul 34093, Turkey
*
Author to whom correspondence should be addressed.
Submission received: 13 March 2025 / Revised: 6 April 2025 / Accepted: 11 April 2025 / Published: 18 April 2025
(This article belongs to the Section Medical & Healthcare AI)

Abstract

:
(1) Acute pancreatitis (AP) is a medical emergency associated with high mortality rates. Early and accurate prognosis assessment during admission is crucial for optimizing patient management and outcomes. This study seeks to develop robust radiomics-based machine learning (ML) models to classify the severity of AP using contrast-enhanced computed tomography (CECT) scans. (2) Methods: A retrospective cohort of 287 AP patients with CECT scans was analyzed, and clinical data were collected within 72 h of admission. Patients were classified as mild or moderate/severe based on the Revised Atlanta classification. Two radiologists manually segmented the pancreas and peripancreatic regions on CECT scans, and 234 radiomic features were extracted. The performance of the ML algorithms was compared with that of traditional scoring systems, including Ranson and Glasgow-Imrie scores. (3) Results: Traditional severity scoring systems produced AUC values of 0.593 (Ranson, Admission), 0.696 (Ranson, 48 h), 0.677 (Ranson, Cumulative), and 0.663 (Glasgow-Imrie). Using LASSO regression, 12 radiomic features were selected for the ML classifiers. Among these, the best-performing ML classifier achieved an AUC of 0.876 in the training set and 0.777 in the test set. (4) Conclusions: Radiomics-based ML classifiers significantly enhanced the prediction of AP severity in patients undergoing CECT scans within 72 h of admission, outperforming traditional severity scoring systems. This research is the first to successfully predict prognosis by analyzing radiomic features from both pancreatic and peripancreatic tissues using multiple ML algorithms applied to early CECT images.

1. Introduction

Acute pancreatitis (AP) is a prevalent condition with a highly variable clinical trajectory [1]. While the mortality rate in patients with mild self-limiting AP remains relatively low at around 5%, it escalates dramatically to as high as 30% in cases complicated by systemic inflammatory response syndrome (SIRS) or organ failure [2,3,4]. To address the need for early severity assessment, several scoring systems have been developed, including the Ranson criteria, Glasgow-Imrie criteria, APACHE II, SIRS score, the Bedside Index for Severity in Acute Pancreatitis (BISAP), and the CT Severity Index (CTSI) [5,6]. However, these tools often incorporate multiple parameters that can be challenging to interpret, and some require a waiting period for accurate assessment. Moreover, their overall effectiveness remains a topic of ongoing debate in clinical practice [7].
Among all these scoring systems, imaging plays a pivotal role in diagnosing and managing AP, particularly in assessing disease severity and guiding treatment decisions. Imaging modalities, such as CT, are essential for detecting complications, including necrosis, fluid collection, and vascular involvement [8]. However, despite its critical role, traditional imaging alone often fails to detect subtle changes, such as early necrosis or inflammation, which are crucial for prognosis and treatment planning [6,9]. This underscores the need for advanced imaging techniques to provide more detailed and timely insights into disease progression.
Although the role of artificial intelligence (AI) in diagnosing AP and other pancreatic diseases has been explored [10,11,12,13], its potential to predict the progression of AP remains under-researched. Since early-stage morphological changes, such as necrosis, may not be detectable through traditional imaging, the demand for advanced image analysis techniques is increasing. Furthermore, the increasing volume of imaging examinations and the complexity of clinical parameters highlight the necessity for AI-supported radiological-clinical diagnostic and predictive systems.
However, AI has not yet been sufficiently integrated into clinical practice, limiting the potential role of imaging in the triage of AP patients. Early and accurate image analysis is a critical step for achieving this. To address this, this study aims to develop a robust machine learning (ML) algorithm that accurately assesses AP severity early by utilizing radiomic features extracted from both the pancreas and peripancreatic edema/necrosis. This approach offers a promising solution for the timely and precise prediction of AP severity. It can enhance diagnostic sensitivity, reduce complications before they arise, shorten hospital stays, and decrease the risk of organ failure, complications, and mortality.

2. Materials and Methods

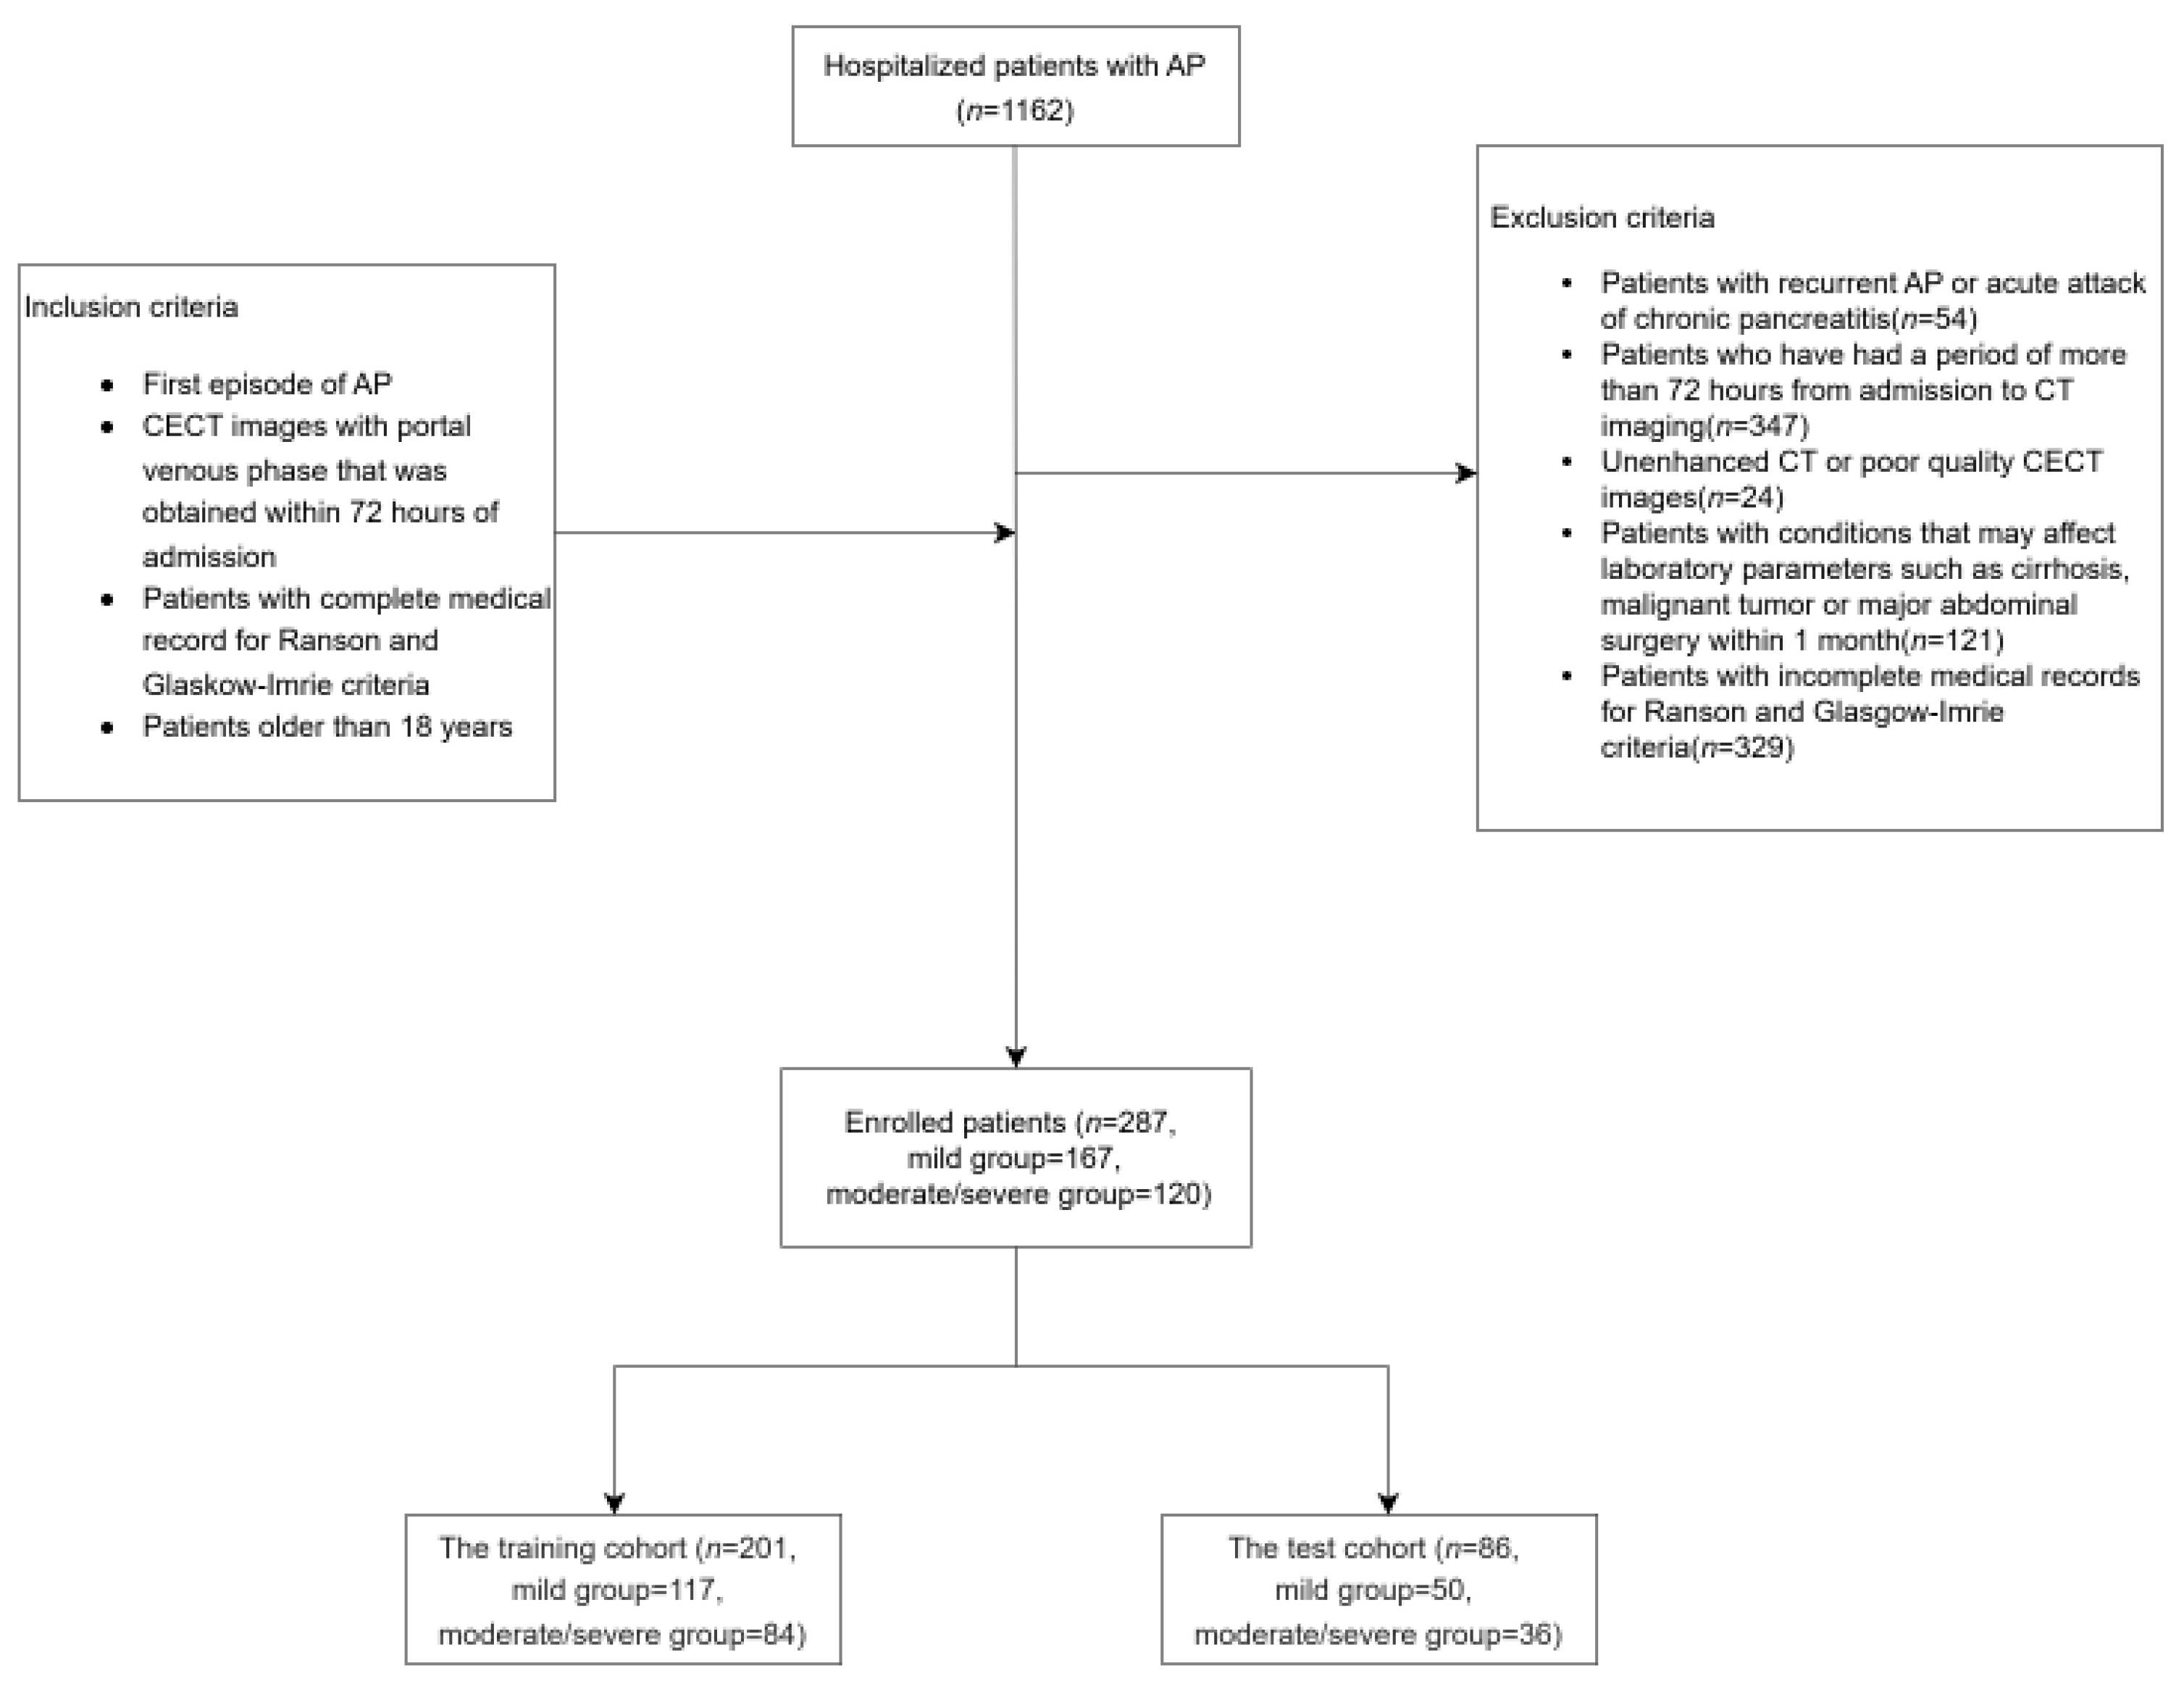
2.1. Data Collection

This retrospective study was approved by the Institutional Review Board (IRB) of Istanbul University, Istanbul Faculty of Medicine. Due to its retrospective design, the requirement for informed consent was waived. Clinical, laboratory, and CECT imaging data were collected from 1.162 patients diagnosed with AP between 1 January 2012 and 1 December 2023. The dataset included patient demographics (age, gender), AP etiologies, organ failure status, 30-day mortality, and laboratory values required for the Ranson and Glasgow-Imrie scoring systems. AP severity was classified according to the Revised Atlanta classification, categorizing patients into two groups: mild (n = 167) and moderate/severe (n = 120). Ranson scores (at admission, 48 h, and cumulative) and Glasgow-Imrie scores were calculated to evaluate the performance of ML algorithms. Additionally, when calculating Ranson scores, etiological factors were considered to ensure an accurate severity assessment.
Inclusion criteria:
  • Patients aged ≥ 18 years.
  • First episode of AP.
  • CECT with portal venous phase acquired within 72 h of admission.
  • Complete medical records for Ranson and Glasgow-Imrie scoring.
Exclusion criteria:
  • Incomplete medical records for Ranson and Glasgow-Imrie scoring.
  • History of recurrent AP or acute exacerbations of chronic pancreatitis.
  • Conditions potentially affecting laboratory results, including cirrhosis, malignancy, or major abdominal surgery within the past month.
  • CECT was performed more than 72 h after admission.
  • Unenhanced or poor-quality CECT images.
The patient recruitment process is summarized in Figure 1.

2.2. CT Image Acquisition

CECT scans were performed using the Canon TSX-305A/5K model with 320 detectors and 640 sections, as well as Brilliance-Philips tomography devices with 16 detectors. All patients were positioned in the supine position with full inspiration. The imaging protocol included a tube voltage of 120 kV, tube current modulation ranging from 50 to 150 mA, a pitch of 0.85–1, image slice thickness of 1 mm, and a reconstruction interval of 1 mm. An iodinated contrast agent was administered via the cubital vein, with a dose of 1.5 mL/kg at a flow rate of 3 mL/s. Prior to contrast injection, kidney function was evaluated in all patients, and informed consent was obtained through a review of their allergic history and any chronic diseases. Portal venous phase images were acquired 65–70 s following the intravenous (IV) contrast injection.

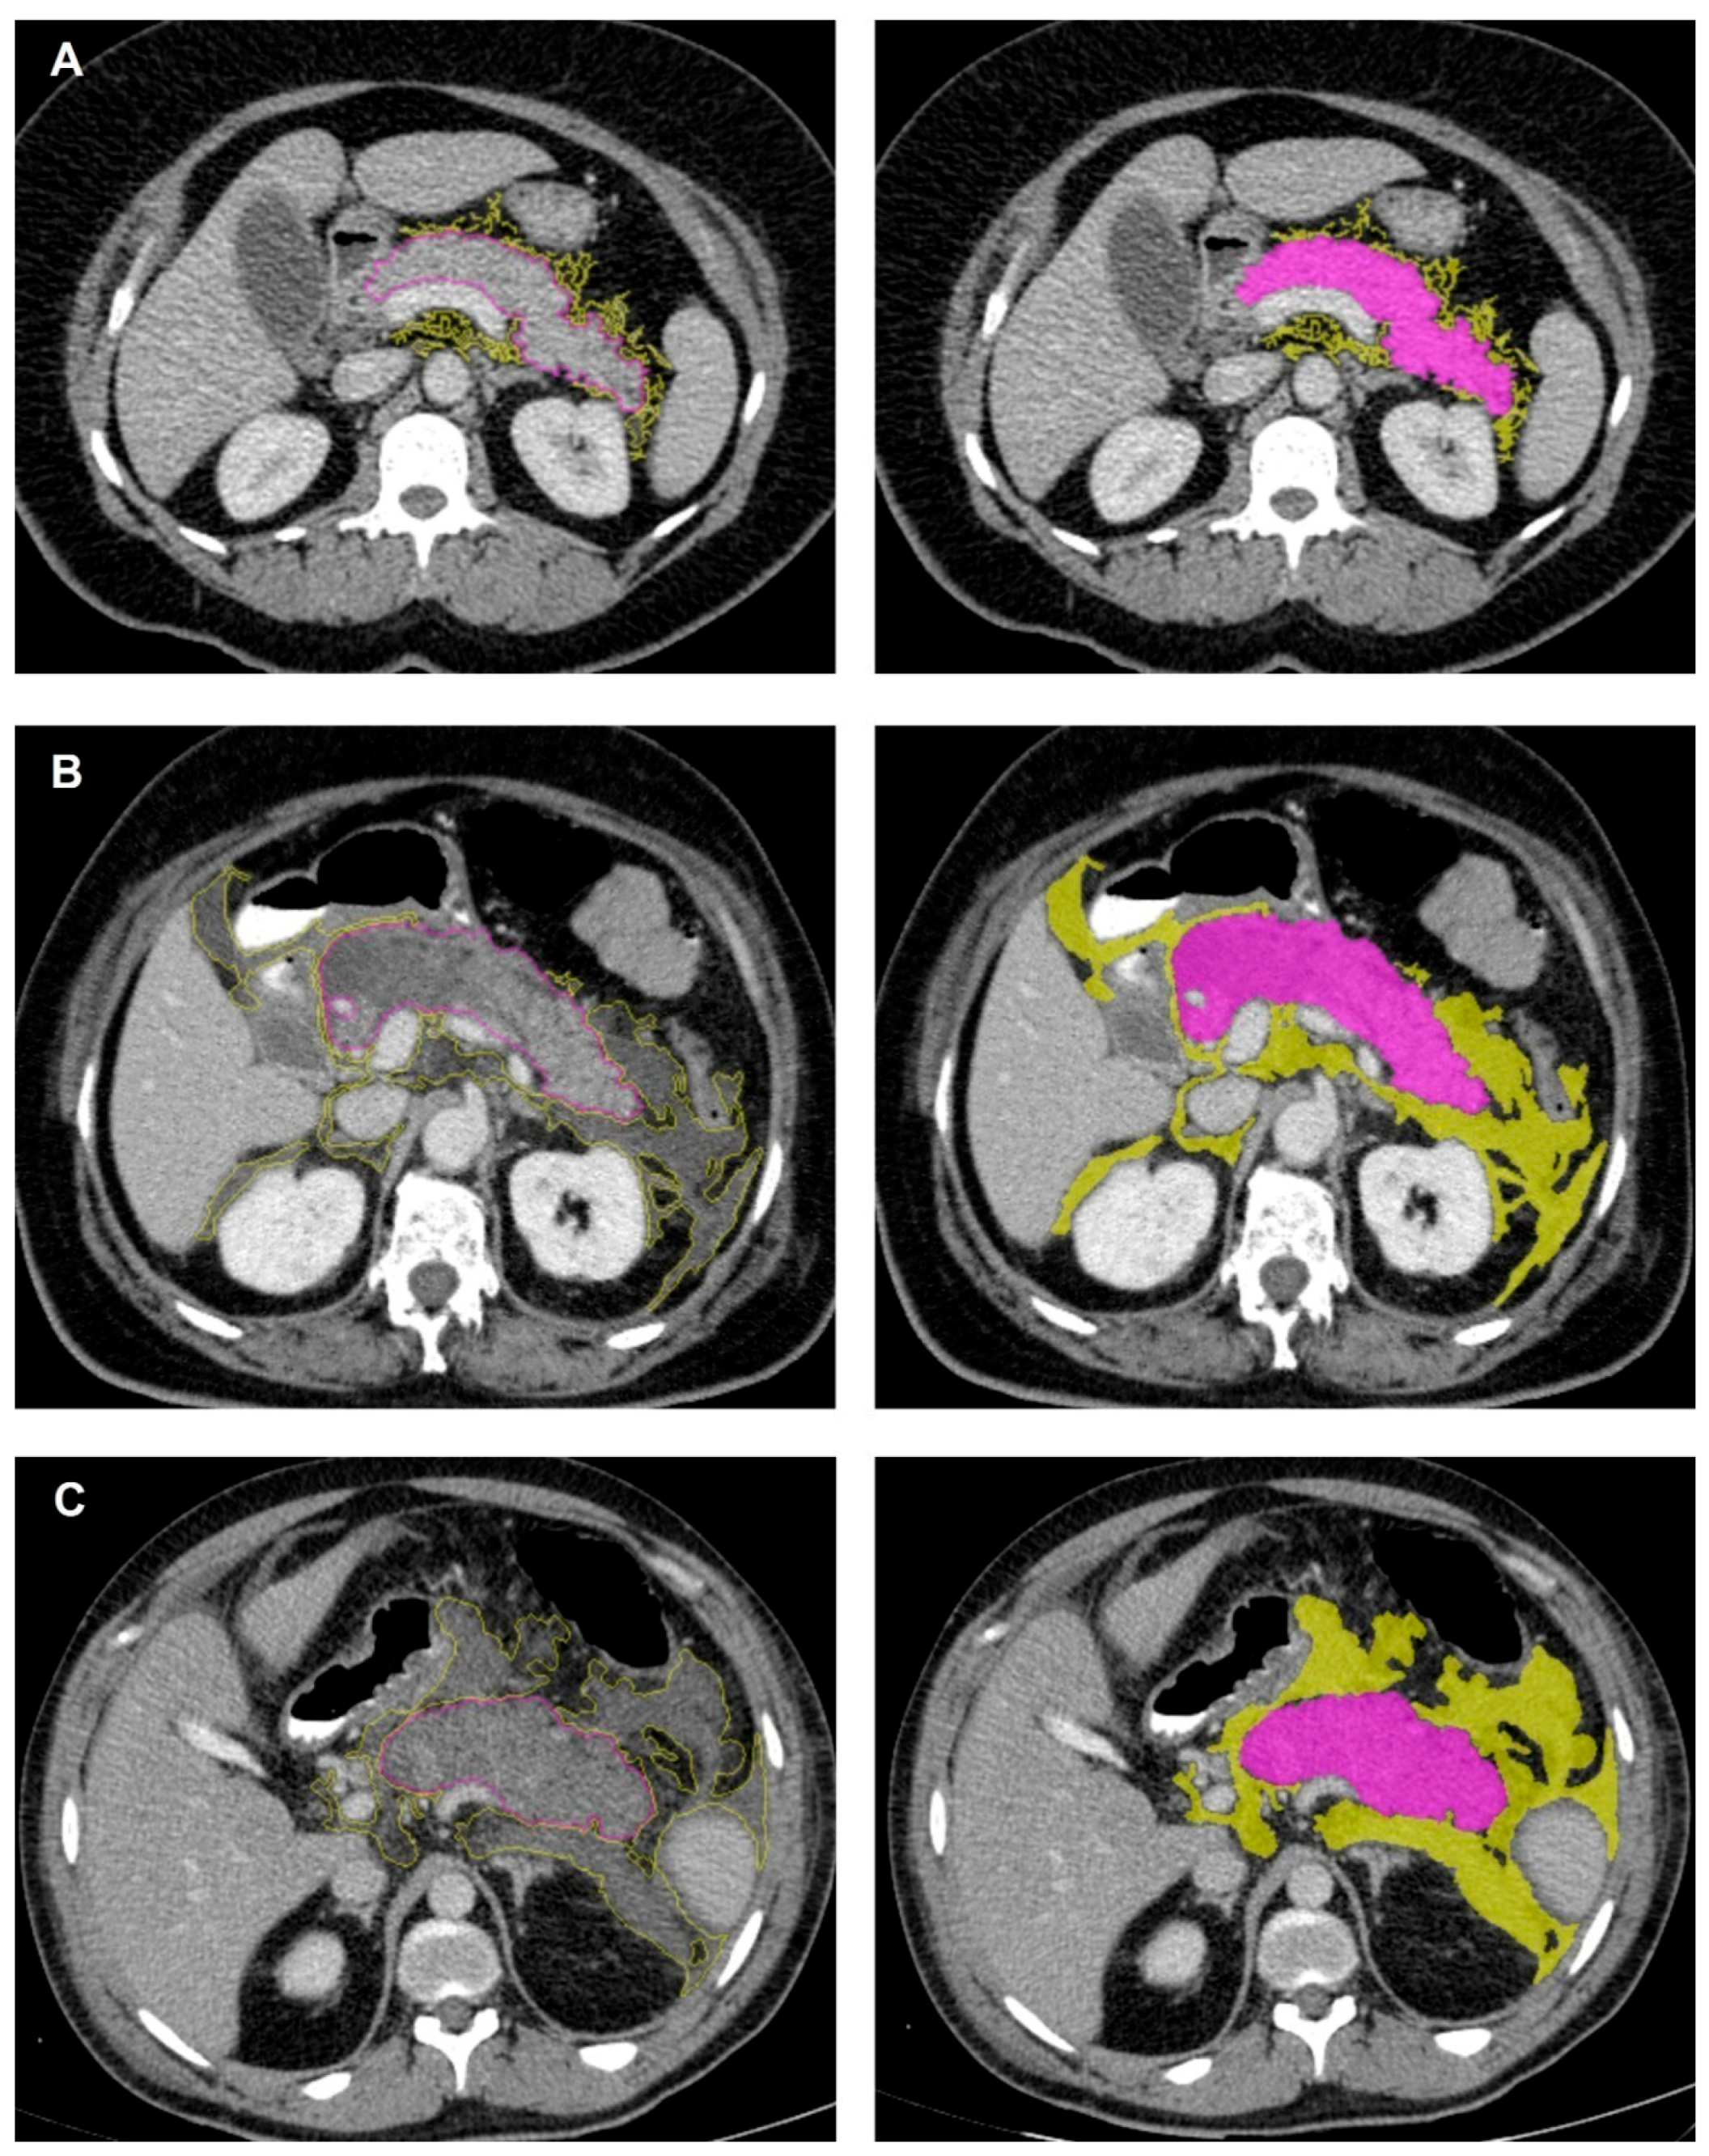
2.3. CT Image Interpretation and Feature Extraction

The images were retrospectively collected from the Picture Archiving and Communication System (PACS). Two abdominal radiologists, each with five years of experience, manually performed volumetric three-dimensional (3D) segmentation of the pancreas and peripancreatic regions using Local Image Features Extraction (LIFEx) 7.4.3 software, remaining blinded to each other’s segmentations [14]. A more senior abdominal radiologist with 15 years of experience confirmed the segmented volumes for quality and consistency. Figure 2 shows the manual segmentation of the pancreas and peripancreatic region in patients with AP at varying severity levels. Radiomic feature extraction and spatial consistency between images were ensured using LIFEx. Spatial resampling was performed to calculate the average voxel values across all images, optimizing the median voxel dimensions in the XYZ planes to 0.89 × 0.89 × 1.06 mm3. Gray levels were discretized to a fixed bin number of 64, and intensity normalization was applied within the ±3 sigma range to minimize protocol-related variations in texture properties, thereby ensuring a more homogeneous dataset.

2.4. Intra-Observer Reliability and Inter-Observer Agreement

We calculated intra- and inter-observer agreements using the Dice Similarity Coefficient (DSC) and Cohen’s kappa scores. For inter-observer reliability, a random selection of 30 CT scans was used. The inter-observer agreement yielded DSC values of 92.9% and 84.8% for the pancreas and peripancreatic regions, respectively. To assess intra-observer agreement, the same radiologist re-evaluated 20 randomly selected CT scans after a wash-out period of three weeks. Intra-observer agreement showed high consistency, with DSC values of 97.0% and 95.5% for the pancreas and peripancreatic regions, respectively. Cohen’s kappa coefficients exceeded 0.80 for both the pancreas and peripancreatic regions in both analyses, indicating strong consistency.

2.5. Feature Selection

In total, 234 radiomic features were extracted from the pancreas and peripancreatic regions, including 55 histograms, 24 GLCM, 11 GLRLM, 16 GLSZM, and 5 NGTDM. The most discriminative features were selected using the LASSO (Least Absolute Shrinkage and Selection Operator) regression method on the training set [15]. The alpha was found to be 0.039, calculated automatically to minimize the mean squared error (MSE) using 5-fold cross-validation. This process resulted in the selection of 12 radiomic features (6 from the pancreas and 6 from the peripancreatic region) for predicting severity with ML classifiers.

2.6. Classification with Machine Learning Algorithms

We utilized Logistic Regression (LR), Artificial Neural Network (ANN), k-Nearest neighbors (kNN), Support Vector Machine (SVM), and Random Forest (RF) classifiers to evaluate the performance of classification into two groups using radiomic features: mild AP (58.2%) and moderate/severe AP (41.8%). The data were randomly divided into a 70% training set and a 30% test set, which did not overlap.
The LR algorithm was selected due to its simplicity and ability to model the probability of binary outcomes. The model fit was evaluated using the goodness-of-fit test, and its significance was assessed using the Nagelkerke R2 test. The ANN model was implemented as a multilayer perceptron (MLP) with a single hidden layer containing four nodes. The Radial Basis Function (RBF) was used as a core function of the SVM algorithm due to its ability to handle non-linear data. The SVM model was optimized with a regularization parameter (C = 1) and an RBF gamma value (γ = 0.05) through grid search to improve accuracy. In the RF algorithm, the maximum number of trees was set to 60, the maximum depth to 10, and the number of bins to 2, aiming to avoid overfitting while maintaining model complexity. The kNN model’s optimal k-level was determined by evaluating error rates for k values between 3 and 9, with the lowest error rate found at k = 9. Model optimization was assessed using 10-fold cross-validation with non-overlapping data chunks to ensure robustness. Model performance was then evaluated by an independent test set (hold-out) consisting of cases not included in the training set. Correct predictions of the moderate/severe AP class were considered true positives in all performance evaluations. Table 1 shows the data distribution in experiments.

2.7. Statistical Analysis

Continuous variables were reported as median (range), while categorical variables were expressed as numbers and percentages [n (%)]. The normality of continuous variables was assessed using the Kolmogorov–Smirnov and Shapiro–Wilk tests. The Mann–Whitney U test was employed to compare continuous variables between two independent groups, while the chi-square test was applied to compare categorical variables between groups. A p-value < 0.05 was considered statistically significant. We conducted comparisons between each ML model and the best-performing traditional scoring method using a paired t-test. All statistical analyses were conducted using IBM SPSS Statistics for Windows, version 29 (IBM Corp., Armonk, NY, USA).

3. Results

A total of 287 patients (154 men, 133 women; median age: 54 years, range: 18–96 years) were included in this study. Of these, 58.2% (n = 167) had mild AP, while 41.8% (n = 120) had moderate/severe AP. The proportion of male patients was significantly higher in the moderate/severe AP group than in the mild AP group (60.8% vs. 48.5%, p = 0.039). The prevalence of Atlanta AP necrotizing type, MODS, and mortality within one month was significantly higher in the moderate to severe AP group (p < 0.001) (Table 2). The incidence of AKI at admission, at 48 h, and fluid loss > 6 L differed significantly between the two groups (p < 0.001). There was no significant difference in patient age between the groups (p = 0.383). Table 2 summarizes the clinical characteristics of the patients.
Severity scoring systems such as Ranson at Admission, Ranson at 48 h, Cumulative Ranson, and Glasgow-Imrie showed relatively high specificity in predicting the severity of AP, ranging from 0.635 to 0.784, but the sensitivity remained low. The performance of severity scoring systems is presented in Table 3.
Table 4 presents the detailed performance metrics of the ML models. The AUC values of the ML models in the training group were 0.825, 0.876, 0.791, 0.826, and 0.653 for LR, RF, SVM, ANN, and kNN, respectively. In the test group, the corresponding AUC values were 0.746, 0.747, 0.777, 0.767, and 0.677. Statistically significant improvements in the AUC were observed for the ML models (SVM, ANN, RF, and LR), all with p < 0.001, compared to the best traditional scoring system (Ranson at 48 h, AUC = 0.696). In contrast, the kNN model exhibited a statistically significant decrease in the AUC (p < 0.001).

4. Discussion

Accurate classification of AP severity is crucial for timely and effective treatment planning. Approximately 80% of AP cases are mild, self-limiting, and respond well to conservative treatment. However, 15–20% of cases may progress to local and systemic complications or organ failure [16]. Our findings indicate that radiomics-powered ML algorithms outperform traditional classification systems in identifying moderate/severe AP cases that require closer monitoring. The highest AUC value in the test group was achieved with SVM (0.777), whereas traditional severity scoring systems attained a maximum AUC of 0.696.
Several studies have compared the performance of traditional severity scoring systems with radiomics-based models in predicting AP severity. For instance, Zhao et al. (2023) conducted a study involving 215 patients, categorizing them as 158 non-severe and 57 severe based on the Atlanta criteria [17]. The cohort was split into a training set (n = 141) and a test set (n = 74). A logistic regression (LR) model and a corresponding nomogram were developed using 13 radiomic features extracted from the pancreas and peripancreatic region. The radiomics model achieved an AUC of 0.992 in the training set and 0.894 in the test set. According to the nomogram, a total score exceeding 124 points indicated a high probability of severe AP.
Our study presents several advantages over that of Zhao et al. [17] First, although their group distributions may better reflect real-life scenarios, our study incorporates a more balanced distribution which enhances the analytical power of ML methods, as noted in our limitations. Moreover, a larger dataset and more balanced group distribution provide a more robust foundation for ML model development. Second, whereas they employed only a logistic regression algorithm, we assessed the performance of five different ML models, providing a broader perspective. Finally, our study offers a more comprehensive analysis by comparing the ML model’s performance with traditional severity scoring systems, thereby adding a layer of clinical relevance.
Lin et al. conducted a radiomics-based study utilizing contrast-enhanced portal-phase MRI to predict early-stage severity in 259 AP patients (142 mild, 117 moderate/severe) [18]. Radiomic features were extracted from the pancreas, and an SVM model was developed using optimal features. The model achieved AUCs of 0.917 in the training cohort (n = 180) and 0.848 in the test cohort n = 79). These AUCs were significantly higher than those of traditional clinical and radiological scoring systems, including APACHE II, BISAP, and MRSI, suggesting that the radiomics-based approach provides superior early-stage severity prediction.
Compared to Lin et al.’s study [18], our research utilized five different ML models applied to CECT images, providing a more comprehensive evaluation of model performance. Additionally, to improve the accuracy and thoroughness of our results, we included radiomic features from peripancreatic fat stranding, edema, and necrosis in our analysis, which are essential factors affecting patient outcomes. This approach provides a more complete assessment of the severity of AP. Moreover, CECT is more commonly used and remains the preferred imaging technique for evaluating AP severity.
Several studies have further explored the relationship between imaging findings and AP severity. For instance, Peng et al. identified pleural effusion and pulmonary consolidation as potential indicators of disease severity [19]. Their findings suggest that the volume of pleural effusion and the extent of pulmonary consolidation, especially when involving multiple lobes, may aid in predicting the likelihood of organ failure and the overall severity of AP. These imaging findings provide valuable insights into systemic complications, underscoring the importance of comprehensive radiological assessment in the management of AP.
Our study has several limitations. First, as a single-center retrospective analysis, the generalizability of our findings may be limited due to potential selection biases and reduced patient diversity. To address this, future studies should validate algorithm performance using external, independent datasets, and a prospective multicenter study design could further enhance result reliability and applicability. Second, while the Revised Atlanta classification distinguishes transient organ failure resolving within 48 h as temporary, our categorization considered sustained organ failure as a critical factor for severity classification. This methodological choice may not fully represent real-world scenarios, where a majority of acute pancreatitis cases typically present as mild and self-limiting. Nevertheless, our balanced group distribution was intentionally designed to facilitate robust machine learning model training and testing, particularly given the significant clinical difference in mortality [20] and complications associated with moderate and severe cases. Third, routine clinical practice at various institutions may not consistently include contrast-enhanced computed tomography (CECT) within 72 h of admission; our intent was specifically to detect early subtle imaging features indicative of severity. Lastly, our current machine learning models rely exclusively on imaging-derived radiomic data. Subsequent research efforts should aim to develop integrated predictive models that combine radiomic imaging features with relevant clinical and laboratory variables using comprehensive multicenter datasets.
In conclusion, despite substantial evidence in radiomics and other advanced image analysis techniques, significant opportunities remain to improve AP severity prediction by simultaneously analyzing both pancreatic and peripancreatic regions. Our study underscores the clinical advantage of incorporating detailed imaging-based assessments into existing severity scoring systems. To our knowledge, this study is among the first to comprehensively investigate radiomic features from both pancreatic tissue and peripancreatic edema and necrotic regions using diverse machine learning algorithms. Future studies should further integrate radiomics with deep learning methodologies, leveraging larger and more diverse datasets. This integration of advanced imaging analytics with established clinical scoring frameworks promises to enhance diagnostic precision, streamline clinical decision-making, and ultimately improve patient outcomes.

Author Contributions

Conceptualization: A.Y.K., G.D., M.S.C., and S.M.E.; Methodology: A.Y.K., G.D., M.S.C., S.M.E., and U.B.; Software: E.U., H.E.A., and U.B.; Validation: E.U., H.E.A., and U.B.; Formal Analysis: E.U., H.E.A., and U.B.; Investigation: A.Y.K., G.D., O.B., T.C., and M.S.C.; Resources: A.Y.K., T.C., M.I., and A.M.; Data Curation: A.Y.K., G.D., O.B., T.C., and M.S.C.; Writing—Original Draft Preparation: All authors; Writing—Review and Editing: All authors; Visualization: A.Y.K., G.D., M.I., A.M., and O.B.; Supervision: S.M.E., M.S.C., and U.B.; Project Administration: U.B.; Funding Acquisition: U.B.; Final Approval of Manuscript: All authors. All authors have read and agreed to the published version of the manuscript.

Funding

This work is supported by NIH funding: R01-CA246704.

Institutional Review Board Statement

This retrospective study was conducted at the Department of Radiology, Istanbul University, Istanbul Faculty of Medicine, with approval from the Academic Board and ethical clearance from the Institutional Review Board and Clinical Research Ethics Committee of Istanbul Faculty of Medicine. This study received approval during the meeting held on 21 July 2023 (Meeting No. 15) under file number 2023/1193.

Informed Consent Statement

This study is retrospective in design, with diagnosis, treatment, and follow-up of patients completed at the time of the study. As this study does not require any additional interventions or procedures for the participants, informed consent was waived.

Data Availability Statement

The data supporting the findings of this study are not publicly available due to ethical restrictions. Access to the data can be obtained upon reasonable request to the corresponding author.

Conflicts of Interest

The authors declare no conflicts of interest.

References

  1. Szatmary, P.; Grammatikopoulos, T.; Cai, W.; Huang, W.; Mukherjee, R.; Halloran, C.; Beyer, G.; Sutton, R. Acute pancreatitis: Diagnosis and treatment. Drugs 2022, 82, 1251–1276. [Google Scholar] [CrossRef] [PubMed]
  2. Petrov, M.S.; Yadav, D. Global epidemiology and holistic prevention of pancreatitis. Nat. Rev. Gastroenterol. Hepatol. 2018, 16, 175–184. [Google Scholar] [CrossRef] [PubMed]
  3. Habtezion, A.; Gukovskaya, A.S.; Pandol, S.J. Acute pancreatitis: A multifaceted set of organelle and cellular interactions. Gastroenterology 2019, 156, 1941–1950. [Google Scholar] [CrossRef]
  4. Banks, P.A.; Bollen, T.L.; Dervenis, C.; Gooszen, H.G.; Johnson, C.D.; Sarr, M.G.; Tsiotos, G.G.; Vege, S.S. Classification of acute pancreatitis2012: Revision of the Atlanta classification and definitions by international consensus. Gut 2012, 62, 102–111. [Google Scholar] [CrossRef] [PubMed]
  5. Papachristou, G.I.; Muddana, V.; Yadav, D.; O’COnnell, M.; Sanders, M.K.; Slivka, A.; Whitcomb, D.C. Comparison of BISAP, Ranson’s, APACHE-II, and CTSI scores in predicting organ failure, complications, and mortality in acute pancreatitis. Am. J. Gastroenterol. 2010, 105, 435–441. [Google Scholar] [CrossRef] [PubMed]
  6. Lee, D.W.; Cho, C.M. Predicting severity of acute pancreatitis. Med. Kaunas 2022, 58, 742. [Google Scholar] [CrossRef] [PubMed]
  7. Capurso, G.; de Leon Pisani, R.P.; Lauri, G.; Archibugi, L.; Hegyi, P.; Papachristou, G.I.; Pandanaboyana, S.; Maisonneuve, P.; Arcidiacono, P.G.; De-Madaria, E. Clinical usefulness of scoring systems to predict severe acute pancreatitis: A systematic review and meta-analysis with pre and post-test probability assessment. United Eur. Gastroenterol. J. 2023, 11, 825–836. [Google Scholar] [CrossRef]
  8. Bharwani, N.; Patel, S.; Prabhudesai, S.; Fotheringham, T.; Power, N. Acute pancreatitis: The role of imaging in diagnosis and management. Clin. Radiol. 2010, 66, 164–175. [Google Scholar] [CrossRef] [PubMed]
  9. Spanier, B.W.M.; Nio, Y.; Van der Hulst, R.W.M.; Tuynman, H.A.R.E.; Dijkgraaf, M.G.W.; Bruno, M.J. Practice and yield of early CT scan in acute pancreatitis: A Dutch observational multicenter study. Pancreatology 2010, 10, 222–228. [Google Scholar] [CrossRef] [PubMed]
  10. Kenner, B.; Chari, S.T.; Kelsen, D.; Klimstra, D.S.; Pandol, S.J.; Rosenthal, M.; Rustgi, A.K.; Taylor, J.A.; Yala, A.; Abul-Husn, N.; et al. Artificial intelligence and early detection of pancreatic cancer: 2020 summative review. Pancreas 2021, 50, 251–279. [Google Scholar] [CrossRef] [PubMed]
  11. Dinesh, M.G.; Bacanin, N.; Askar, S.S.; Abouhawwash, M. Diagnostic ability of deep learning in detection of pancreatic tumour. Sci. Rep. 2023, 13, 9725. [Google Scholar] [CrossRef] [PubMed]
  12. Hong, Z.; Jha, D.; Biswas, K.; Zhang, Z.; Velichko, Y.; Yazici, C.; Tirkes, T.; Borhani, A.; Turkbey, B.; Medetalibeyoglu, A.; et al. Detection of peri-pancreatic edema using deep learning and radiomics techniques. In Proceedings of the 46th Annual International Conference of the IEEE Engineering in Medicine and Biology Society (EMBC), Orlando, FL, USA, 15–19 July 2024; pp. 1–4. [Google Scholar] [CrossRef]
  13. Bette, S.; Canalini, L.; Feitelson, L.-M.; Woźnicki, P.; Risch, F.; Huber, A.; Decker, J.A.; Tehlan, K.; Becker, J.; Wollny, C.; et al. Radiomics-based machine learning model for diagnosis of acute pancreatitis using computed tomography. Diagnostics 2024, 14, 718. [Google Scholar] [CrossRef] [PubMed]
  14. Nioche, C.; Orlhac, F.; Boughdad, S.; Reuzé, S.; Goya-Outi, J.; Robert, C.; Pellot-Barakat, C.; Soussan, M.; Frouin, F.; Buvat, I. LIFEx: A freeware for radiomic feature calculation in multimodality imaging to accelerate advances in the characterization of tumor heterogeneity. Cancer Res. 2018, 78, 4786–4789. [Google Scholar] [CrossRef] [PubMed]
  15. Friedman, J.H.; Hastie, T.; Tibshirani, R. Regularization paths for generalized linear models via coordinate descent. J. Stat. Softw. 2010, 33, 1–22. [Google Scholar] [CrossRef] [PubMed]
  16. Forsmark, C.E.; Baillie, J. AGA Institute technical review on acute pancreatitis. Gastroenterology 2007, 132, 2022–2044. [Google Scholar] [CrossRef] [PubMed]
  17. Zhao, Y.; Wei, J.; Xiao, B.; Wang, L.; Jiang, X.; Zhu, Y.; He, W. Early prediction of acute pancreatitis severity based on changes in pancreatic and peripancreatic computed tomography radiomics nomogram. Quant. Imaging Med. Surg. 2023, 13, 1927–1936. [Google Scholar] [CrossRef] [PubMed]
  18. Lin, Q.; Ji, Y.; Chen, Y.; Sun, H.; Yang, D.; Chen, A.; Chen, T.; Zhang, X.M. Radiomics model of contrast-enhanced MRI for early prediction of acute pancreatitis severity. J. Magn. Reson. Imaging 2019, 51, 397–406. [Google Scholar] [CrossRef]
  19. Peng, R.; Zhang, L.; Zhang, Z.-M.; Wang, Z.-Q.; Liu, G.-Y.; Zhang, X.-M. Chest computed tomography semi-quantitative pleural effusion and pulmonary consolidation are early predictors of acute pancreatitis severity. Quant. Imaging Med. Surg. 2020, 10, 451–463. [Google Scholar] [CrossRef]
  20. Boxhoorn, L.; Voermans, R.P.; Bouwense, S.A.; Bruno, M.J.; Verdonk, R.C.; Boermeester, M.A.; van Santvoort, H.C.; Besselink, M.G. Acute pancreatitis. Lancet 2020, 396, 726–734. [Google Scholar] [CrossRef] [PubMed]
Figure 1. Flowchart of patient recruitment.
Ai 06 00080 g001
Figure 2. Segmentation of the pancreas (pink color) and peripancreatic (yellow color) region of cases clinically diagnosed as (A) mild, (B) moderate, and (C) severe AP in LIFEx software.
Ai 06 00080 g002
Table 1. Distribution of acute pancreatitis (AP) cases in the training and test groups.
CategoryTotal (n, %)Training (n, %)Test (n, %)
Mild AP 1167 (58.2%)117 (70.1%)50 (29.9%)
Moderate/Severe AP 1120 (41.8%)84 (70.0%)36 (30.0%)
Total28720186
1 AP = Acute Pancreatitis. Percentages are calculated within each category. Training and test groups were split in a 70:30 ratio.
Table 2. Demographics and clinical characteristics of the patients.
CharacteristicMildModerate-Severep
Total (n = 287)n = 167%n = 120%
Age (median, range)53 (18–92) 55(24–96) 0.383
Sex 0.039
     Female8651.54739.2
     Male8148.57360.8
Atlanta 1 AP type <0.001
     Edematous16699.43831.7
     Necrotizing10.68268.3
Obesity8349.74739.20.077
Hypertension7343.75848.30.438
Hepatic steatosis5935.34335.80.930
Etiology
          Gallstones6840.75646.70.313
          Hyperlipidemia30181411.7
          Alcohol10.621.6
          Other6840.74840
2 AKI001310.8<0.001
2 AKI, at 48th Hours21.21310.8<0.001
Fluid loss > 4/6 * L within 48 h1710.25949.2<0.001
3 MODS0097.5<0.001
Death, within 1 month10.61310.8<0.001
1 AP: acute pancreatitis, 2 AKI: acute kidney injury, 3 MODS: multiple organ dysfunction syndrome, * L: Liter.
Table 3. The performance of Ranson and Glasgow-Imrie scoring systems in our dataset.
Scoring System1 AUCAccuracySensitivitySpecificityPrecision2 F1
Ranson at Admission0.5930.5890.4830.6650.5090.496
Ranson at 48 h0.6960.6690.5080.7840.6290.562
Cumulative Ranson0.6770.6270.6000.6350.5410.569
Glasgow-Imrie0.6630.6450.5750.6950.5750.575
1 AUC: Area Under the Curve, 2 F1: F1-score.
Table 4. Performances of machine learning models.
ModelGroup1 AUCAccuracySensitivitySpecificityPrecision7 F1
2 LRTraining0.8250.7510.7460.7860.7020.723
Test0.7460.6860.5550.7800.6450.597
3 RFTraining0.8760.8010.8330.7780.7290.778
Test0.7470.7330.8330.6600.6380.723
4 SVMTraining0.7910.7510.6550.8200.7240.688
Test0.7770.7210.5280.8600.7300.613
5 ANNTraining0.8260.7360.6670.7860.6550.661
Test0.7670.6860.5280.8000.7280.612
6 kNNTraining0.6530.6070.6310.6750.5820.606
Test0.6770.6740.6940.6600.5950.641
1 AUC: Area Under the Curve, 2 LR: Logistic Regression, 3 RF: Random Forest, 4 SVM: Support Vector Machine, 5 ANN: Artificial Neural Network, 6 kNN: k-Nearest Neighbors, 7 F1: F1-score.
Disclaimer/Publisher’s Note: The statements, opinions and data contained in all publications are solely those of the individual author(s) and contributor(s) and not of MDPI and/or the editor(s). MDPI and/or the editor(s) disclaim responsibility for any injury to people or property resulting from any ideas, methods, instructions or products referred to in the content.

