Abstract
Effective sound absorption is crucial in environments like schools and hospitals. This study evaluates open-pore polyurethane foam and perforated onyx panels, which attenuate noise via distinct mechanisms: porous materials convert sound energy to heat through viscous and thermal losses, while perforated panels use resonant behaviour for energy dissipation. The impact of hole geometries and panel orientations on the sound absorption coefficient and noise reduction coefficient was investigated using COMSOL Multiphysics 6.0 for finite element analysis and ISO 10534-2 compliant impedance tube experiments. Six perforated panel configurations were 3D-printed with varying hole diameters and backed by a 24 mm polyurethane foam layer. Both ‘forward’ and ‘reverse’ configurations were assessed. A tapered hole from 4 mm to 2 mm showed the highest sound absorption across the 100–4000 Hz range, with a noise reduction coefficient of 0.444, excelling in both orientations. Reverse designs generally performed less, underscoring the importance of hole geometry and orientation. Experimental results aligned with FEA simulations, validating the computational model. This study elucidates sound absorption mechanisms of porous and perforated materials, providing a validated framework for material selection in noise-sensitive settings and highlighting 3D-printing’s potential in noise control.
1. Introduction
This study introduces a new approach for exploring sound absorption mechanisms in engineered materials. It delves into a complex web of variables and interactions, making it an indispensable area of inquiry for multiple applications. The study aims to comprehensively understand this domain, dissecting three primary acoustic phenomena—reflection, absorption, and transmission. These acoustic interactions are influenced by an array of parameters, including, but not limited to, the medium’s attributes, boundary conditions, the waveform of the incident sound, and the angle of impact.
Maa proposed a novel approach to sound-absorbing panels by reducing perforation sizes to sub-millimetre levels, effectively mitigating issues related to acoustic resistance. Named “microperforated panels”, these structures offer predictable sound absorption, simplicity, and broad frequency range while being weather, heat, and flame-resistant when made from fireproof materials [1]. Maa’s work, building on Rayleigh and Crandall’s research, offers foundational theories for Microperforated Panels (MPPs). It explores how smaller perforations in panels can improve sound absorption by optimizing acoustic resistance and minimising mass reactance. MPPs provide broad-spectrum absorption, further enhanced by double resonators and varied configurations [2].
Meng et al. evaluated the low-frequency sound absorption and transmission loss in corrugated sandwich panels with varying perforation configurations. Findings suggest that perforated panels offer enhanced acoustic performance, with perforation diameter and ratio influencing vibroacoustic characteristics [3]. A composite structure fusing a porous material layer and a perforated resonator improves low-frequency sound absorption. Theoretical models accurately predict acoustic properties, validated by polyurethane and melamine samples in an impedance tube. Li et al. studied the critical parameters, such as hole diameter and flow resistance, that affect performance [4].
Sakagami et al. studied the double-leaf microperforated panel (DLMPP) absorbers to achieve Helmholtz-type resonance without rigid backing, which was numerically investigated. DLMPPs offer enhanced sound absorption at medium-to-high and low frequencies, expanding conventional MPP applications. Magliacano et al. examine the effect of incorporating periodic patterns, particularly Helmholtz resonators, into porous materials to improve their sound transmission loss capabilities, targeting aeronautical soundproofing applications [5,6].
Lee et al. explored a new analytical acoustic transmission analysis (ATA) that evaluates multi-layer acoustic absorbers encompassing perforated plates, airspaces, and porous materials. It assumes particle velocity continuity at interfaces and considers back surface acoustic impedance [7]. Bravo et al. studied the theoretical and experimental work that optimises multi-layer micro-perforated panels (ML-MPPs) for enhanced acoustic performance. Validated by tube measurements, a coupled modal formulation predicts structural and volumetric resonances, influencing absorption and transmission loss. Advanced design and manufacturing offset cost and frequency limitations, making ML-MPPs efficient in building acoustics and aeronautics. Compared to traditional porous absorbers, they offer benefits and tuneable frequency-specific absorption [8,9].
Lee et al. presented the transfer matrix method that evaluated the acoustic absorption of multi-layer perforated panel systems. This method accurately estimates absorption coefficients and explores how panel dimensions and arrangements impact acoustical performance [10]. Bolton et al. employ one-dimensional wave propagation theory to calculate normal incidence sound transmission in double-panel structures lined with polyurethane foam, accounting for airborne and frame-borne waves. It emphasises the significance of foam-panel boundary conditions in determining transmission loss, particularly in configurations simulating aircraft fuselage. Optimal performance is achieved when the foam is directly bonded to one panel and separated from the other by an air gap, mitigating low-frequency ‘mass–air–mass’ resonance while ensuring high-frequency efficacy [11].
This study explores the technical feasibility of transparent, sound-absorbing outdoor noise barriers. Utilising microperforated absorber theory, Asdrubali et al. optimise a three-layer configuration to meet European roadway noise barrier criteria. Experimental tests on polycarbonate samples validate theoretical predictions, achieving effective sound absorption with limited visual transparency loss and sufficient mechanical strength [12].
Effect of Cavity Depth on Sound Absorption Coefficient
Mosa et al. investigated the effects of modifying the cavity depth behind sub-structures in a double-layer inhomogeneous micro-perforated panel (DL-iMPP) on sound absorption coefficients. Enhancing the back cavity depth of sub-MPPs with larger hole diameters and smaller perforation ratios boosts low-frequency absorption. Conversely, decreasing the inter-panel cavity depth shifts the absorption peak to higher frequencies, expanding the frequency bandwidth of absorption. While the front cavity depth has negligible effects on absorption characteristics, modulating the back cavity depth at certain sub-MPPs optimizes absorption amplitude and frequency response [13]. Chiang et al. noted that the cavity depth significantly impacts the sound absorption coefficients of the MPP (Micro-Perforated Panel) absorber array. Variations in the depths of sub-cavities within the array lead to different absorption coefficients, enhancing absorption at specific resonance frequencies. Changes in cavity depth alter local resonance effects and particle velocities, thereby impacting the acoustic resistance and overall absorption performance of the MPP absorber array. Adjusting these depths is essential for optimizing the acoustic properties and effectiveness of the absorber array in various acoustic environments [14].
Lin et al. studied how the perforation depth affects the sound absorption coefficients of PU foam plates by altering the resonance chamber size and consequently the sound absorption properties. Specifically, perforation depths of 50 mm and 75 mm optimize absorption at 2500 Hz, whereas a depth of 100 mm reduces absorption due to enhanced sound wave penetration. Additionally, larger resonance chamber sizes, particularly with a perforation depth of 100 mm, shift absorption peaks to lower frequencies. The varying perforation depths in PU foam plates result in distinct sound absorption coefficients, with peak absorption effectiveness occurring at specific frequencies determined by both perforation depth and rate [15]. Bravo et al. studied how the cavity depth is critical in micro-perforated panel structures for establishing Helmholtz-type resonances, significantly influencing sound absorption coefficients. Optimal cavity depths not only enhance the maximum absorption values but also broaden the effective bandwidth of absorption without compromising performance. This depth directly affects the absorption characteristics, making the selection of appropriate cavity dimensions essential for achieving desired acoustic outcomes [8].
Min et al. explored how the depth sequence of sub-cavities critically affects the sound absorption coefficients of micro-perforated panel (MPP) absorbers. Their research highlights that the depth ratio and arrangement of these cavities are pivotal in optimizing absorption performance. By tuning the cavity depth sequence, the absorption characteristics are enhanced, resulting in broader absorption bandwidths and higher coefficients than those observed in single MPP absorbers [16]. Sound absorption in materials involves reflection, absorption, and transmission of sound waves, influenced by material properties and wave incidence. Porous absorbers are designed to minimize reflection and maximize energy dissipation as heat, enhancing noise control and acoustic quality in various environments.
In this study, two materials were rigorously examined for their sound absorption capabilities—polyurethane foam and 3D-printed onyx panels by using a Markforged 3D-printer (i.e., Mark 2), (Markforged, Waltham, MA, USA). Our research employed a multi-faceted methodology that integrated both computational and experimental frameworks. Finite Element Analysis (FEA) simulations were conducted in COMSOL Multiphysics 6.0 to calculate sound absorption. A series of six samples for each configuration was systematically analysed. Polyurethane foam, with a uniform thickness of 24 mm, was used as a backing layer to bolster the absorption properties of the perforated panels. This study aims to offer a robust analytical framework to inform material selection and design strategies, particularly in noise-sensitive areas such as educational institutions and healthcare facilities.
We relied on a multiphysics-enabled simulation framework proficiently handling complex sound propagation dynamics. The FEA model considered several parameters like sound speed, flow resistivity, and thickness of the acoustic structure. The Delany–Bazley model employed within the Poroacoustic framework, incorporated features such as Floquet periodicity to yield highly accurate SAC values. Complementing the computational efforts, we used an array of sophisticated instrumentation, ranging from impedance tubes to MEMS microphones, frequency analysers, and loudspeakers. These instruments facilitated the empirical evaluation of both porous and perforated acoustic materials, with data analysed using VA lab software (VA Lab4 5.5) and signal analysers through the transfer function method.
Our study introduces novel hole configurations, thus extending existing paradigms of understanding sound absorption properties. The research outcome underscores the significance of design geometry and perforation ratios in achieving optimal sound absorption, especially at lower frequencies. It also opens new avenues for custom-tailoring material properties through precise geometric modifications, contributing to the next generation of acoustic engineering solutions.
This information provides an outline of the contents. Section 1 presents a technical overview of existing literature relevant to our research, focusing on sound absorption mechanisms and analysing the influence of panel cavity depth on the sound absorption coefficient. Section 2 details the materials employed for sound absorption, including a morphological analysis of polyurethane foam, methods for assessing sound absorption coefficients, contributions of this research and the details of acoustic structures. Section 3 outlines the computational model and parameters implemented for acoustic analysis using COMSOL Multiphysics 6.0 and presents the corresponding simulation results. Section 4 describes the experimental validation process, detailing the 3D-printing of acoustic samples and the configuration of measurement setups for acoustic testing. Section 5 interprets both computational and experimental results. Section 6 analyses the impact of different hole geometries on acoustic performance, incorporating comparative studies with prior research. Section 7 summarizes the entire research, outlining key findings and implications.
2. Materials and Methods
2.1. Materials
Caniato et al. explored sustainable alginate-based foams’ acoustic properties, challenging traditional poroelastic models. New tortuosity computation methods were validated, linking foam microstructure to acoustic performance [17]. Yuvaraj et al. studied the parameters by effectively combining the effect of integrated passive elements (IPEs), combining a Helmholtz resonator, micro-perforated panel, and polyurethane foam to reduce noise across low–mid–high frequencies. Experimentally validated, the design achieves a 4–6 dB noise reduction in a broad frequency band [18]. Kim et al. studied a composite sound absorber with fibrous layers and carbon fibres to show improved acoustic performance. Sound absorption efficiency was experimentally assessed via the two-microphone impedance tube method and modified wave equations. Carbon fibres enhanced sound dissipation when adequately distributed, optimizing normal and random incidence absorption [19].
Yuvaraj et al. examined the impact of perforation ratio, air gap, and various porous layer configurations on sound absorption performance, a critical dependent variable. An increased perforation ratio reduces panel acoustic mass, leading to higher resonant frequencies for optimal sound absorption, while lower ratios yield peaks in the low-frequency range. The perforation ratio affects the absorption bandwidth: higher ratios expand the bandwidth due to enhanced sound interaction and increased viscous loss from the countersunk profile. Conversely, a lower perforation ratio increases the panel’s resistance to sound waves and reduces acoustic hole mass, thereby influencing the peak absorption frequency. In this work, the centre-to-centre distances between holes are set at 5 mm, 10 mm, and 15 mm. Increasing this distance reduces the perforation ratio, thereby optimizing absorption in the lower frequency range [20].
Liu et al. explored the acoustic absorption of a 3D-printed multilayer micro-perforated panel absorber (MPPA). Impedance tube tests validated the theoretical model, showing that perforation ratios and airgap depth affect sound absorption coefficients. Adding a porous layer broadened frequency bandwidth [21].
Natural Materials
Hong et al. evaluated sound absorption by using bio-composite micro-perforated panels (BC-MPP) with polypropylene and natural fillers (rice husk, coconut coir) using an impedance tube. BC-MPP with rice husk showed maximum sound absorption coefficients (SAC) over coconut coir. Increases in filler content, perforation distance, and air gap size shifted SAC peaks to lower frequencies [22]. Cao et al. made an outstanding review on noise pollution mitigation through porous sound-absorbing materials, summarising recent advancements in design and fabrication. It covered absorption mechanisms, predictive models, and developments in foams and fibrous materials, offering future perspectives [23]. Taban et al. studied coconut fibre composites as sound absorbers by measuring their absorption coefficients using impedance tubes. MATLAB-based models confirm that increasing material thickness and air gap boosts low-frequency sound absorption, aligning with experimental data [24].
2.2. Morphological Analysis of Polyurethane (Pu) Foam
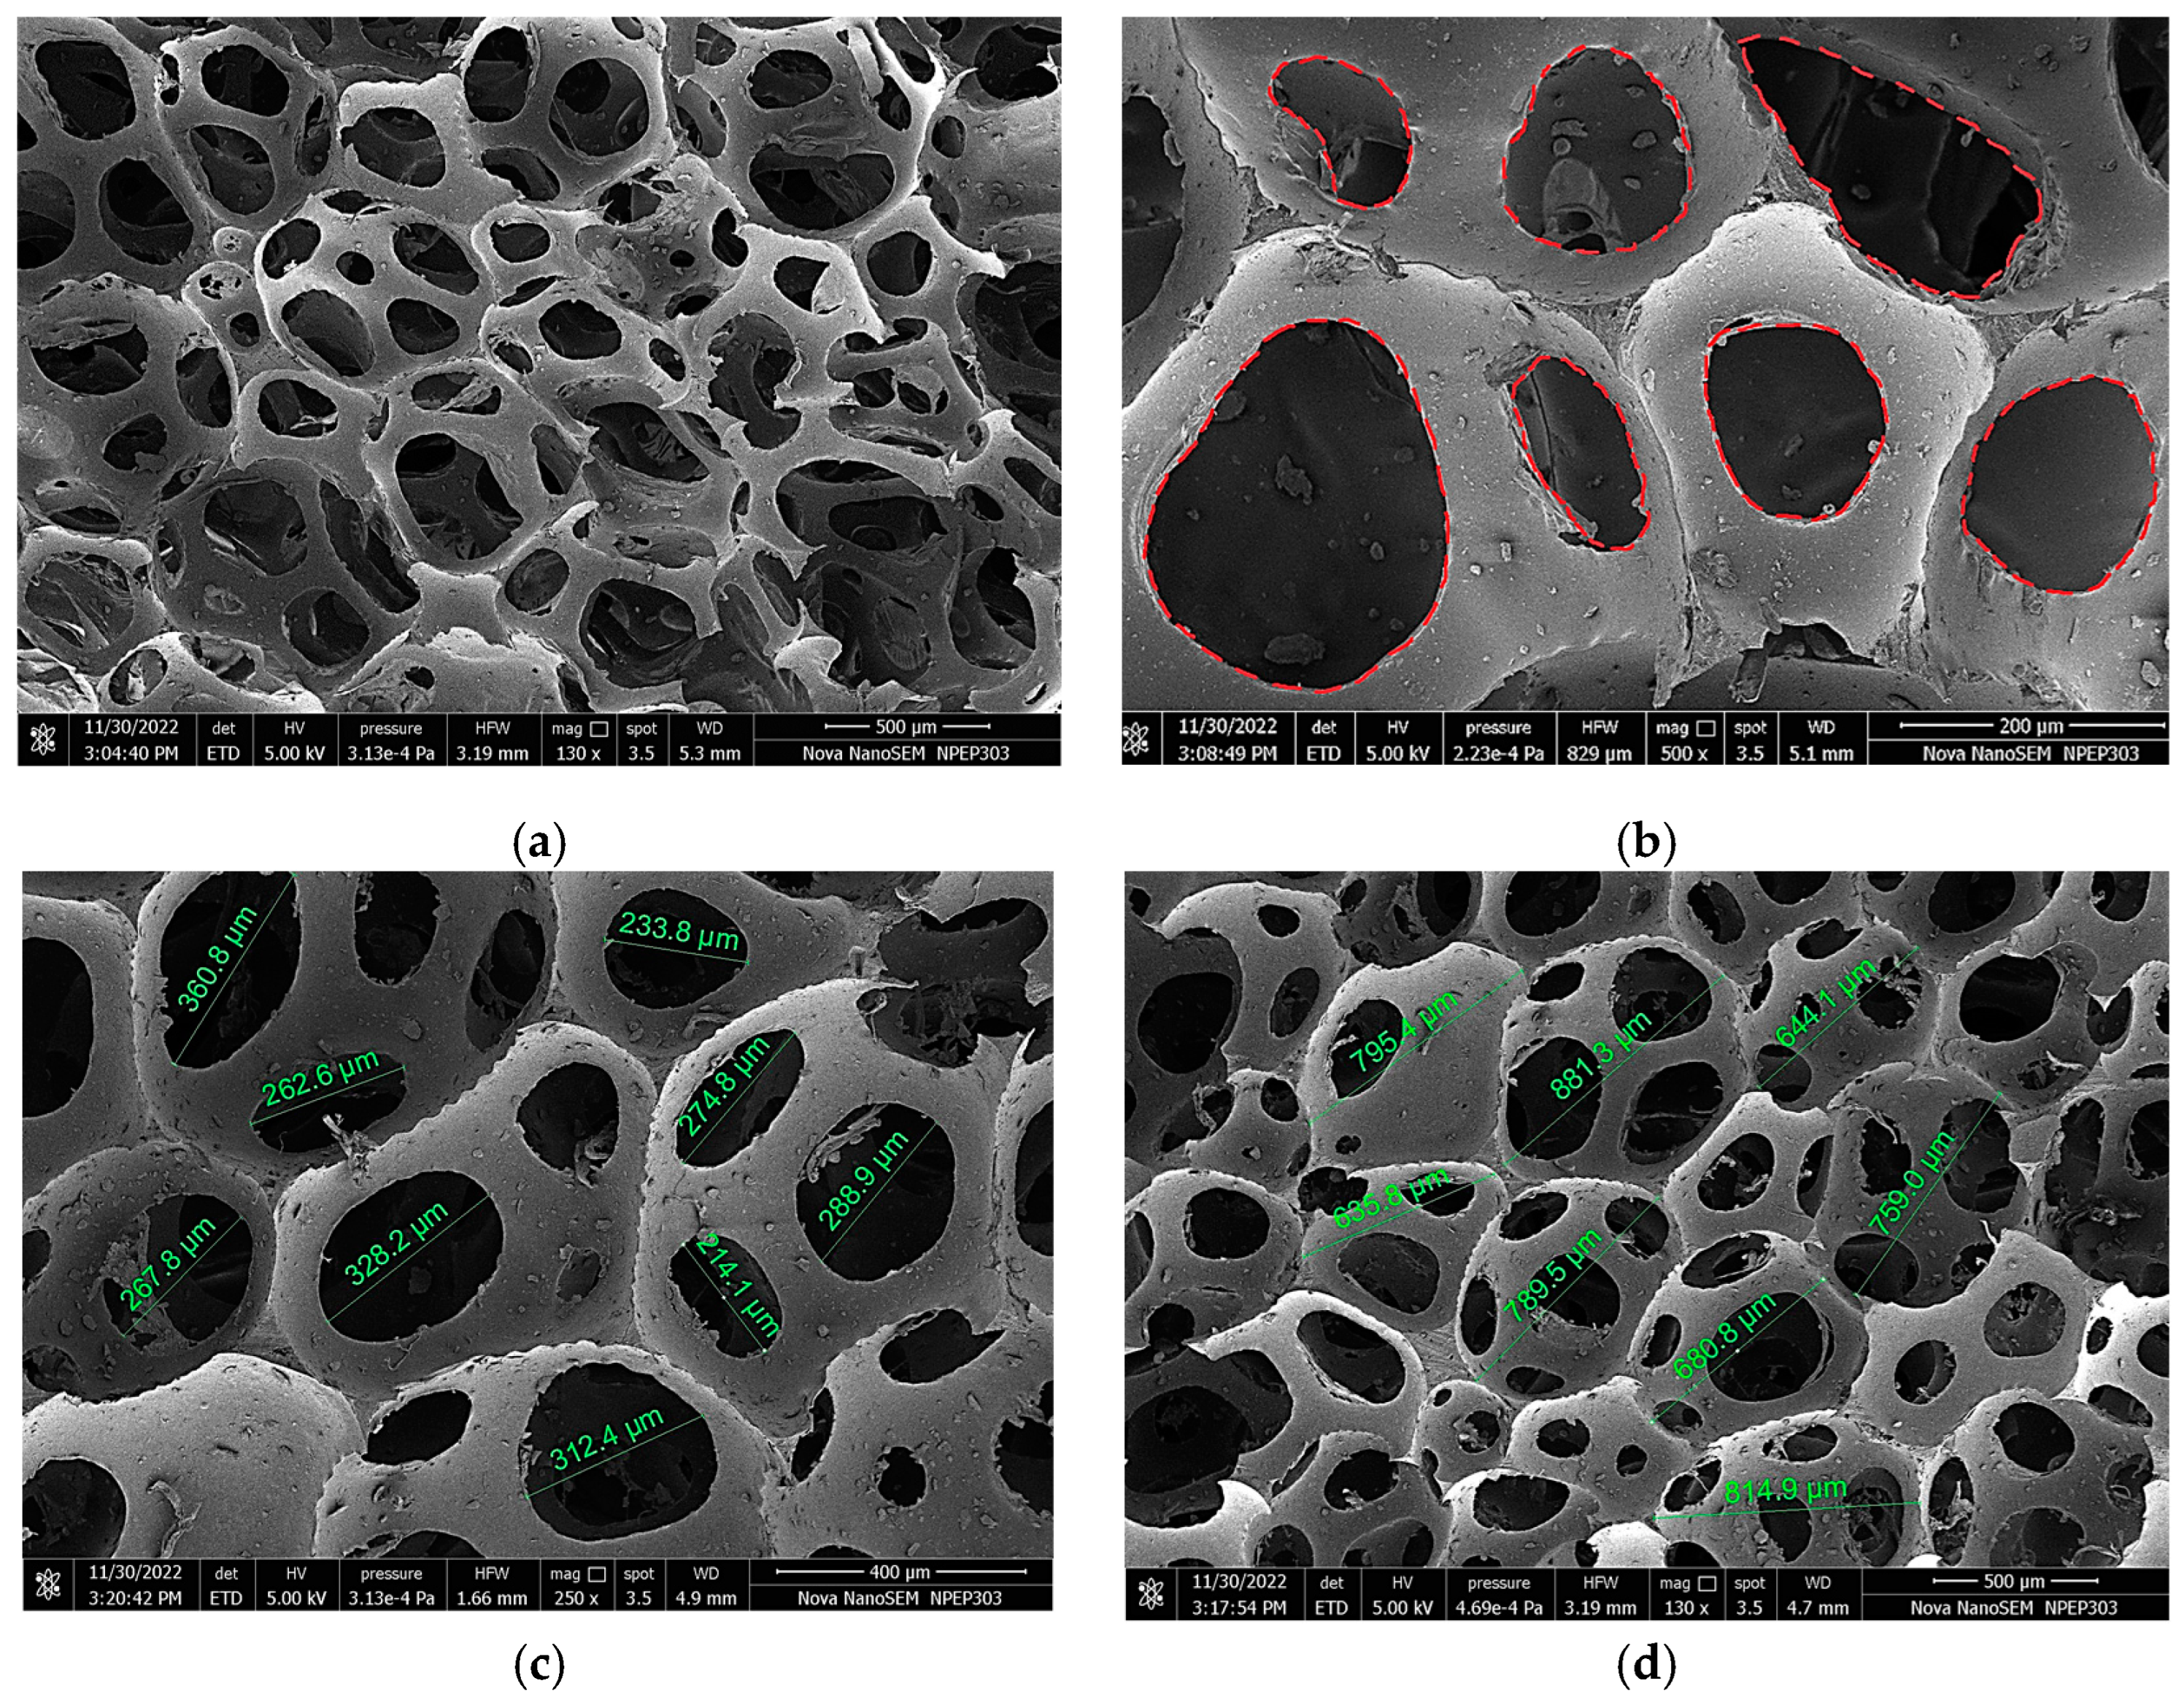
Opiela et al. investigated a way to improve sound absorption in closed-cell aluminium foams by drilling holes, facilitating acoustic wave penetration and energy dissipation. Based on computer tomography scans, multi-scale modelling simulates wave propagation and attenuation. These models are validated against impedance tube measurements and compared with results from perforated solid materials, underscoring the foam’s enhanced performance [25]. Polyurethane foams are used in the automotive industry for noise control due to their light weight, easy production, and high sound absorption capabilities. They are particularly effective against airborne noise because of high-frequency damping resulting from low density and malleability. The foam’s morphological properties influence sound absorption coefficients, as absorption occurs through energy dissipation via molecular collisions and mechanical frictions. Scanning Electron Microscopy (SEM), specifically FEI Nova Nano SEM 450 (Name of manufacturer: FEI, Country: USA), examined the cellular structure, revealing a resolution range from 1.0 nm to 1.8 nm at varying kV and Pa levels. The imaging confirmed the foams’ structural integrity and defect-free nature. Figure 1 displays the scanned images of polyurethane foam samples.

Figure 1.
SEM image of polyurethane foam. (a) Magnification at 130× magnification, highlights the foam’s open-pore structure; (b) Magnification taken at 1000×, uses a red dotted counter to indicate an open pore; (c) Magnification at 250×, reveals precise cell sizes ranging between 214.1 and 360.8 µm; (d) Magnification at 130×, shows pore sizes between 635.8 and 881.3 µm.
Scanning Electron Microscopy (SEM) images of polyurethane foam were taken at varying magnifications to study pore and cell sizes. These images offer quantitative insights into the foam’s microstructure, which is beneficial for understanding its acoustic and mechanical properties.
2.3. Methods
Yang et al. enhance polyurethane foam’s sound absorption using a microperforated polymethyl methacrylate panel: transfer matrix methods, Johnson–Champoux–Allard model, and Maa’s theory guide theoretical models. The cuckoo search algorithm optimises structural parameters, validated experimentally and through finite element simulations, demonstrating improved noise reduction efficacy [26]. Zhai et al. investigated the acoustic absorption in Inconel 625 open-cell foams with controlled porosities and cell sizes. Using the Delany–Bazley model, it finds smaller cell sizes yield better sound absorption, validated by experimental data [27]. Ruiz et al. introduced a hybrid acoustic model for plates with uneven macro perforations and woven microscopic meshes. Utilising Maa’s model for plate impedance and Johnson–Champoux–Allard for mesh impedance, introduces effective airflow resistivity in a multilayer system [28]. Xu et al. studied a novel MPP absorber with petal-shaped perforations, extending traditional Maa’s theory for circular perforations. Sound absorption theory is developed considering fluid velocity changes in petal-shaped holes. Finite element simulations validate that this morphology enhances sound absorption performance compared to traditional circular perforated MPPs [29]. Pereira et al. explored the variable sound absorption techniques in multi-purpose auditoriums, focusing on a perforated system for adaptable acoustic performance. Using transfer matrix and ray-tracing methods, it demonstrates optimised acoustic solutions while maintaining cost-effectiveness and surface aesthetics [30].
2.3.1. Contribution of Current Work
This study conducted a quantitative evaluation of sound absorption performance across a frequency spectrum of 100 to 4000 Hz, tailored for typical acoustic engineering scenarios. This assessment utilized impedance tube measurements and experimental validation of the structure, with further verification provided through COMSOL Multiphysics simulations. Utilizing a multiphysics-enabled acoustics module, the research offered a comprehensive platform for sound propagation analysis, enhancing material behaviour understanding within the stipulated frequency range. The research parameters were explicitly defined, considering resource availability and specific limitations. Detailed analyses were also performed to examine the effects of variations in perforated panel hole geometry and the integration of polyurethane foam on the Sound Absorption Coefficient (SAC) and Noise Reduction Coefficient (NRC). This research contributes to a better understanding of sound absorption mechanisms in complex acoustic systems, potentially guiding advancements in noise control and acoustic design methodologies.
2.3.2. Acoustic Structure
The sound absorption mechanisms of porous materials and perforated panels differ significantly. Porous materials absorb sound through viscous and thermal losses, converting sound energy into heat. In contrast, perforated panels rely on resonant behaviour, where sound waves interact with the panel’s structure, causing resonance and subsequent energy dissipation. This study uses additive manufacturing techniques to produce acoustically relevant perforated panels with variable hole spacings. A Markforged 3D-printer is precisely employed for this purpose, and onyx is selected as the material of choice for fabricating this one mm-thick panel. This material pairing plays a substantial role in fine-tuning sound control and elevating acoustic performance, offering versatile acoustic solutions adaptable to diverse environments. Increasing the centre-to-centre distance between holes (i.e., reducing the perforation ratio) improves low-frequency absorption. Due to production constraints, the centre-to-centre distance has been fixed at 18 mm.
Figure 2 shows the hole configuration of the perforated panel, which illustrates two perforated panel configurations. We investigated two scenarios: forward and reverse perforated panels.
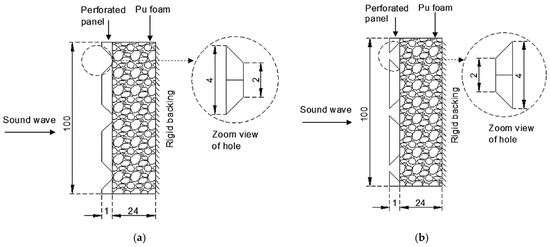
Figure 2.
Hole configuration of perforated panel. (a) Feature a ‘forward’ design where sound waves pass through larger to smaller holes before entering a porous absorber; (b) Employs a ‘reverse’ setup, transitioning from smaller to larger holes.
This panel is mounted 24 mm from a rigid wall with an interstitial layer of polyurethane foam. In the forward case, a perforated panel is used with a 4 mm hole diameter on the front side, through which sound waves entered, followed by a 2 mm hole diameter on the back side, allowing sound to discharge into the polyurethane foam. In the reverse case, we reversed the perforated panel, so the front side had a 2 mm hole diameter, and the back side had a 4 mm hole diameter. This approach allowed us to comprehensively evaluate the sound absorption characteristics of these perforated panels under different geometrical conditions, shedding light on their acoustic performance. These holes were configured in diverse combinations, including step and tapered portions, as shown in Figure 3.

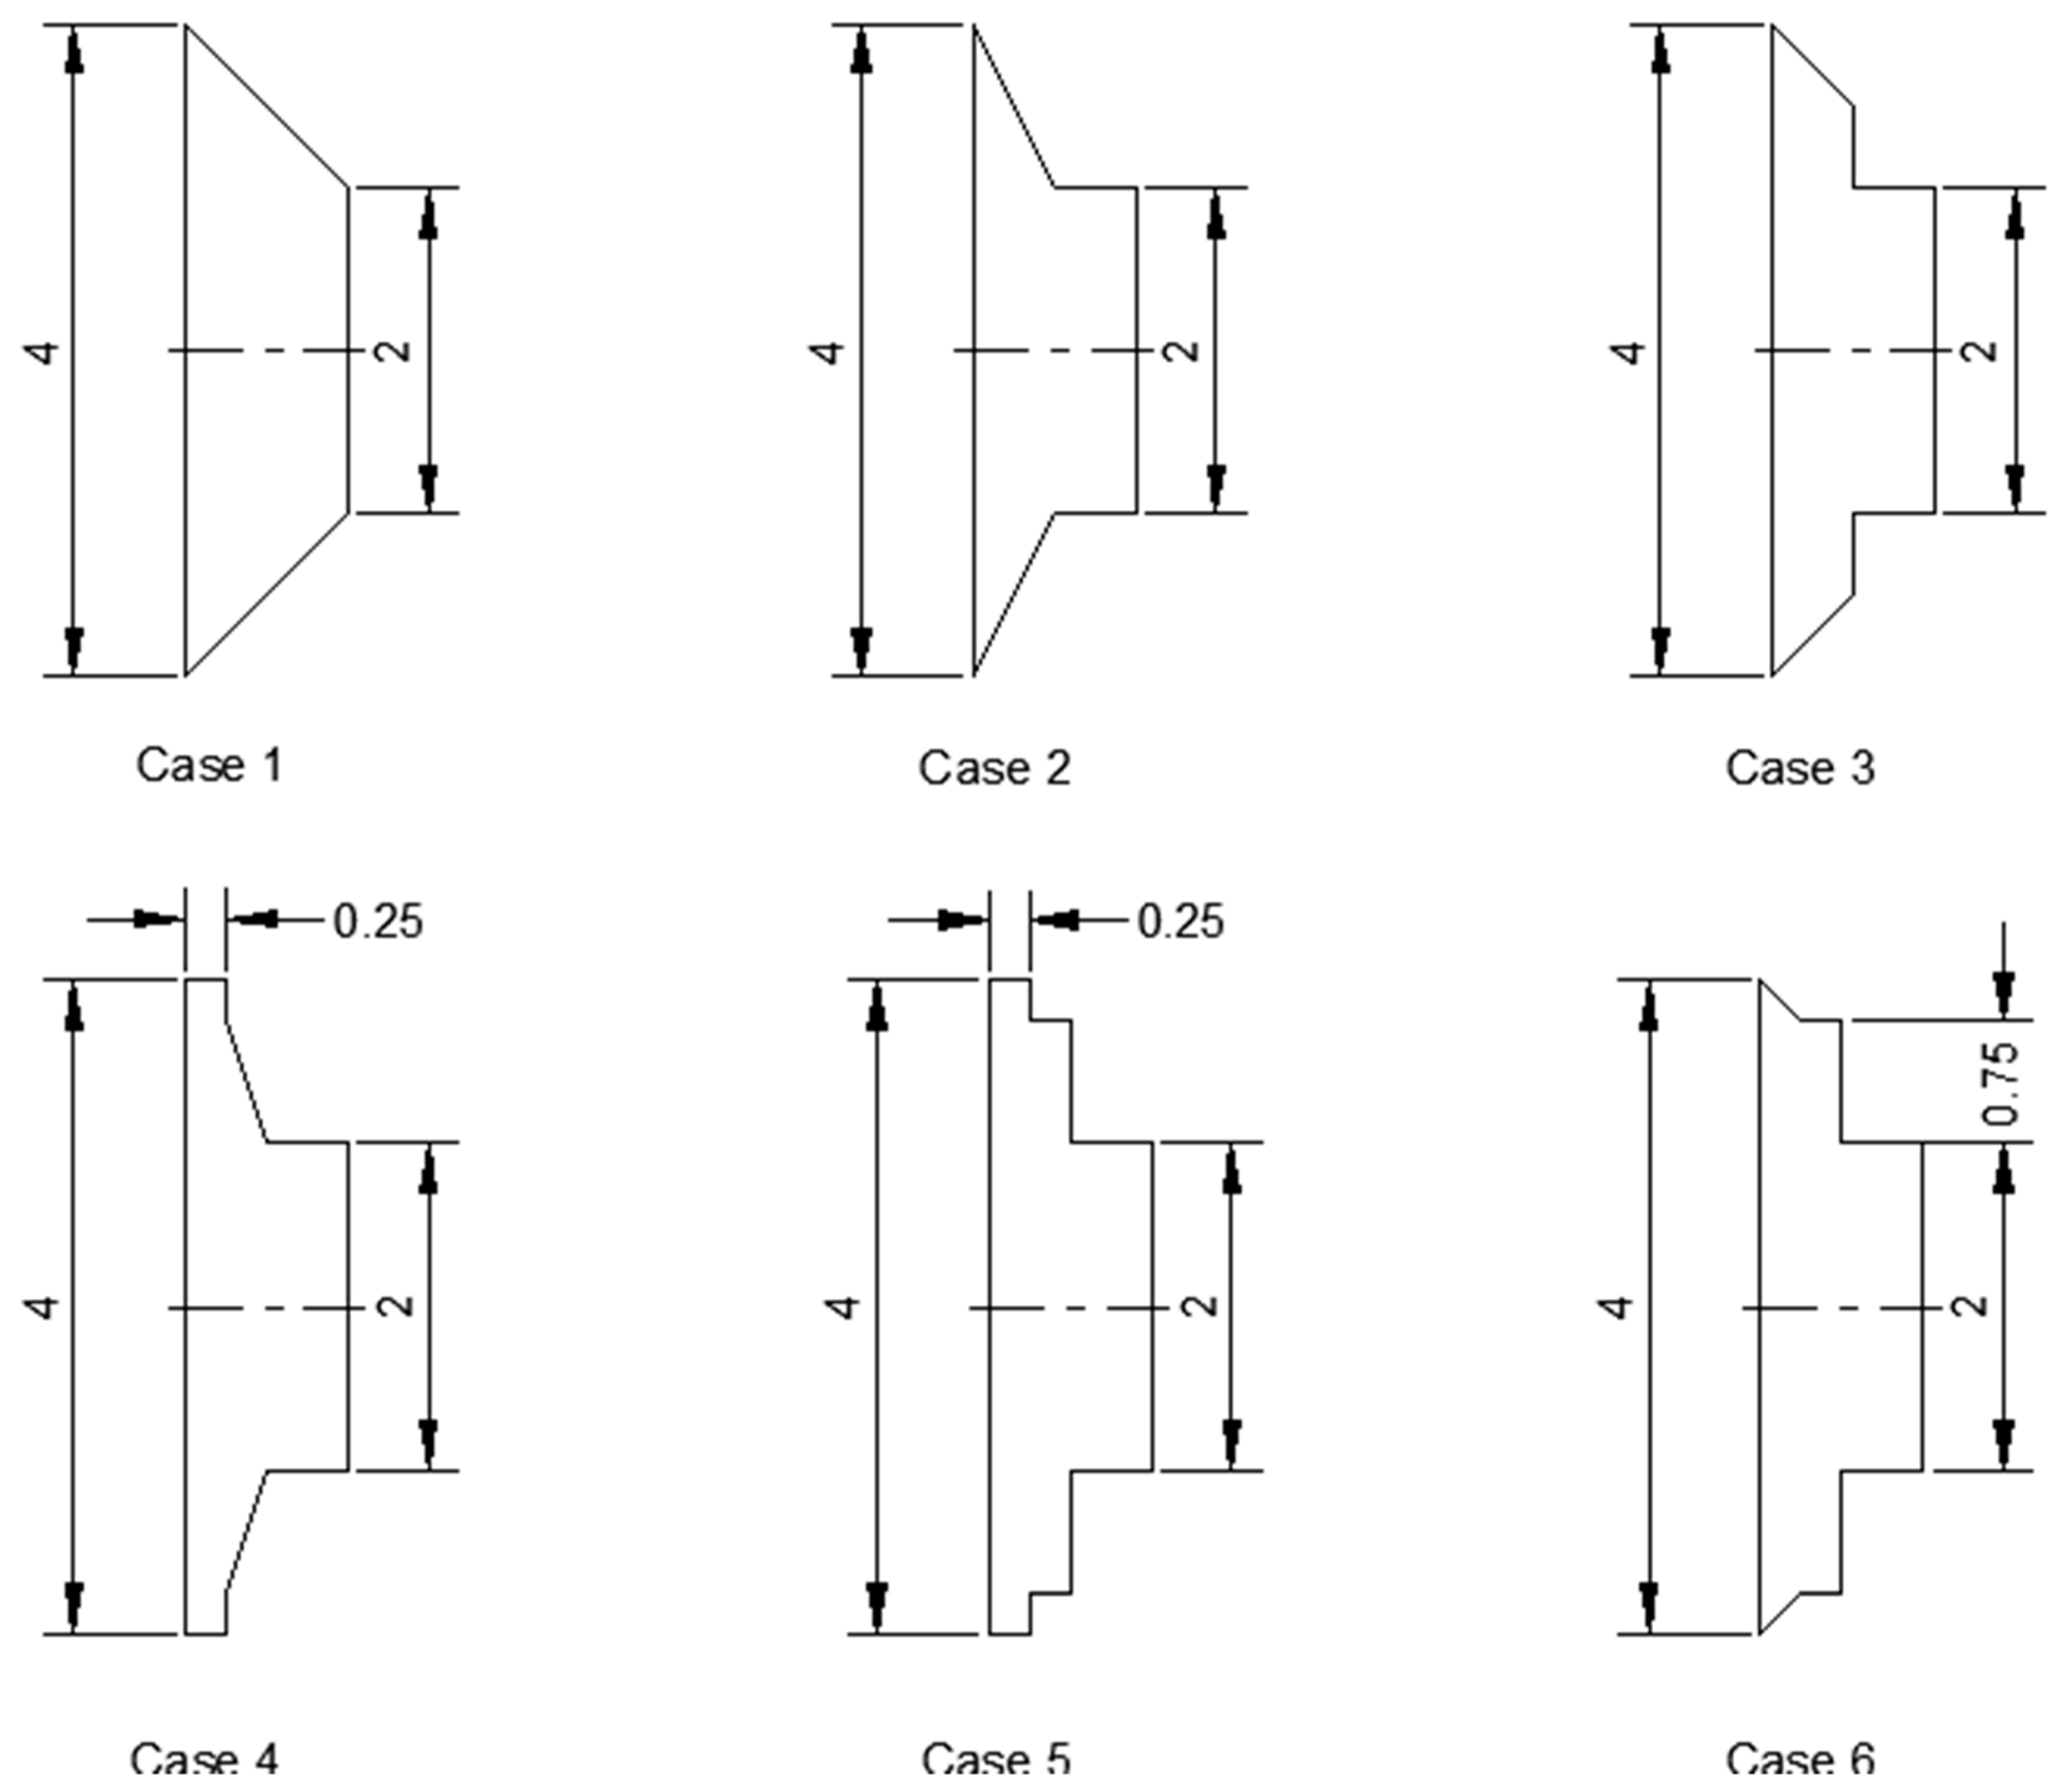
Figure 3.
Hole geometries on perforated panels.
The perforated panels were designed with circular holes of varying diameters on both the front and back sides. To enhance the sound absorption properties of the panels, a backing of polyurethane (Pu) foam was applied, with a uniform thickness of 24 mm. This deliberate variation in hole size and arrangement was a key aspect of the study, as it allowed for a systematic investigation into how different hole geometries, including variations in diameter, influence the sound absorption properties of the perforated panels. This work involves studying structures’ sound absorption properties (100–4000 Hz) via Finite Element Analysis (FEA) via COMSOL Multiphysics 6.0 and experimental measurements using an impedance tube conforming to ISO 10534-2 standards [31] for designing noise control.
3. Computational Model
Won et al. examined acoustic wave propagation in partitioned, porous-boundary ducts using the Finite Element Method (FEM) in COMSOL. It introduces a novel method for estimating unknown parameters of commercially available porous materials through impedance tube measurements, specifically targeting high-frequency noise reduction [32]. Wang et al. explored flat micro-perforated panels (MPP) with corrugated MPP in sound absorbers. A 3D-finite element model predicts performance at various incidences. Corrugated MPPAs offer enhanced absorption, particularly advantageous for large-space reverberation and broadband noise control. Experimental results validate the numerical model and findings [33]. Patil et al. investigated hybrid acoustic structures featuring 3D-printed panels and foam, enhancing the predictive capabilities of Delany and Bazley’s methodologies for modelling porous materials’ behaviour. Additionally, it examined how structural parameters influence sound absorption capabilities [34,35].
In COMSOL, the energy losses in perforations are adeptly managed by the thermoacoustic interface, utilising complex impedance boundary conditions tailored to address both viscous shear and heat conduction losses effectively. These conditions are significant for capturing resistive and reactive energy dissipation within the perforations, ensuring an accurate and detailed simulation of the acoustic dynamics. Structurally, the solid mechanics interface for the perforated panels sets parameters such as material symmetry, Poisson’s ratio, and Young’s modulus under a linear elastic framework. The pressure acoustic model integrates the atmospheric attenuation domain to account for the effects of thermal and viscous attenuation and variations due to environmental conditions like atmospheric pressure, temperature, and relative humidity. This model is significant for the precise simulation of sound propagation, ensuring accurate modelling of atmospheric influences on sound propagation.
3.1. Description of the Computational Model
The acoustics module in our simulation framework provides an environment with normal acoustics and interaction with an acoustic absorber for sound propagation analysis. The study explores the acoustic performance of a specific structure, focusing on frequencies up to 4000 Hz. The flowchart shown in Figure 4 serves as a roadmap for conducting in-depth acoustic assessments.
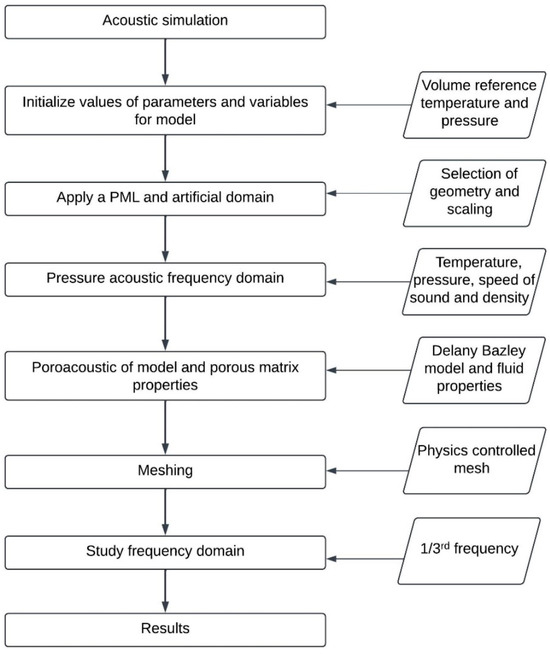
Figure 4.
Flowchart for acoustic analysis.
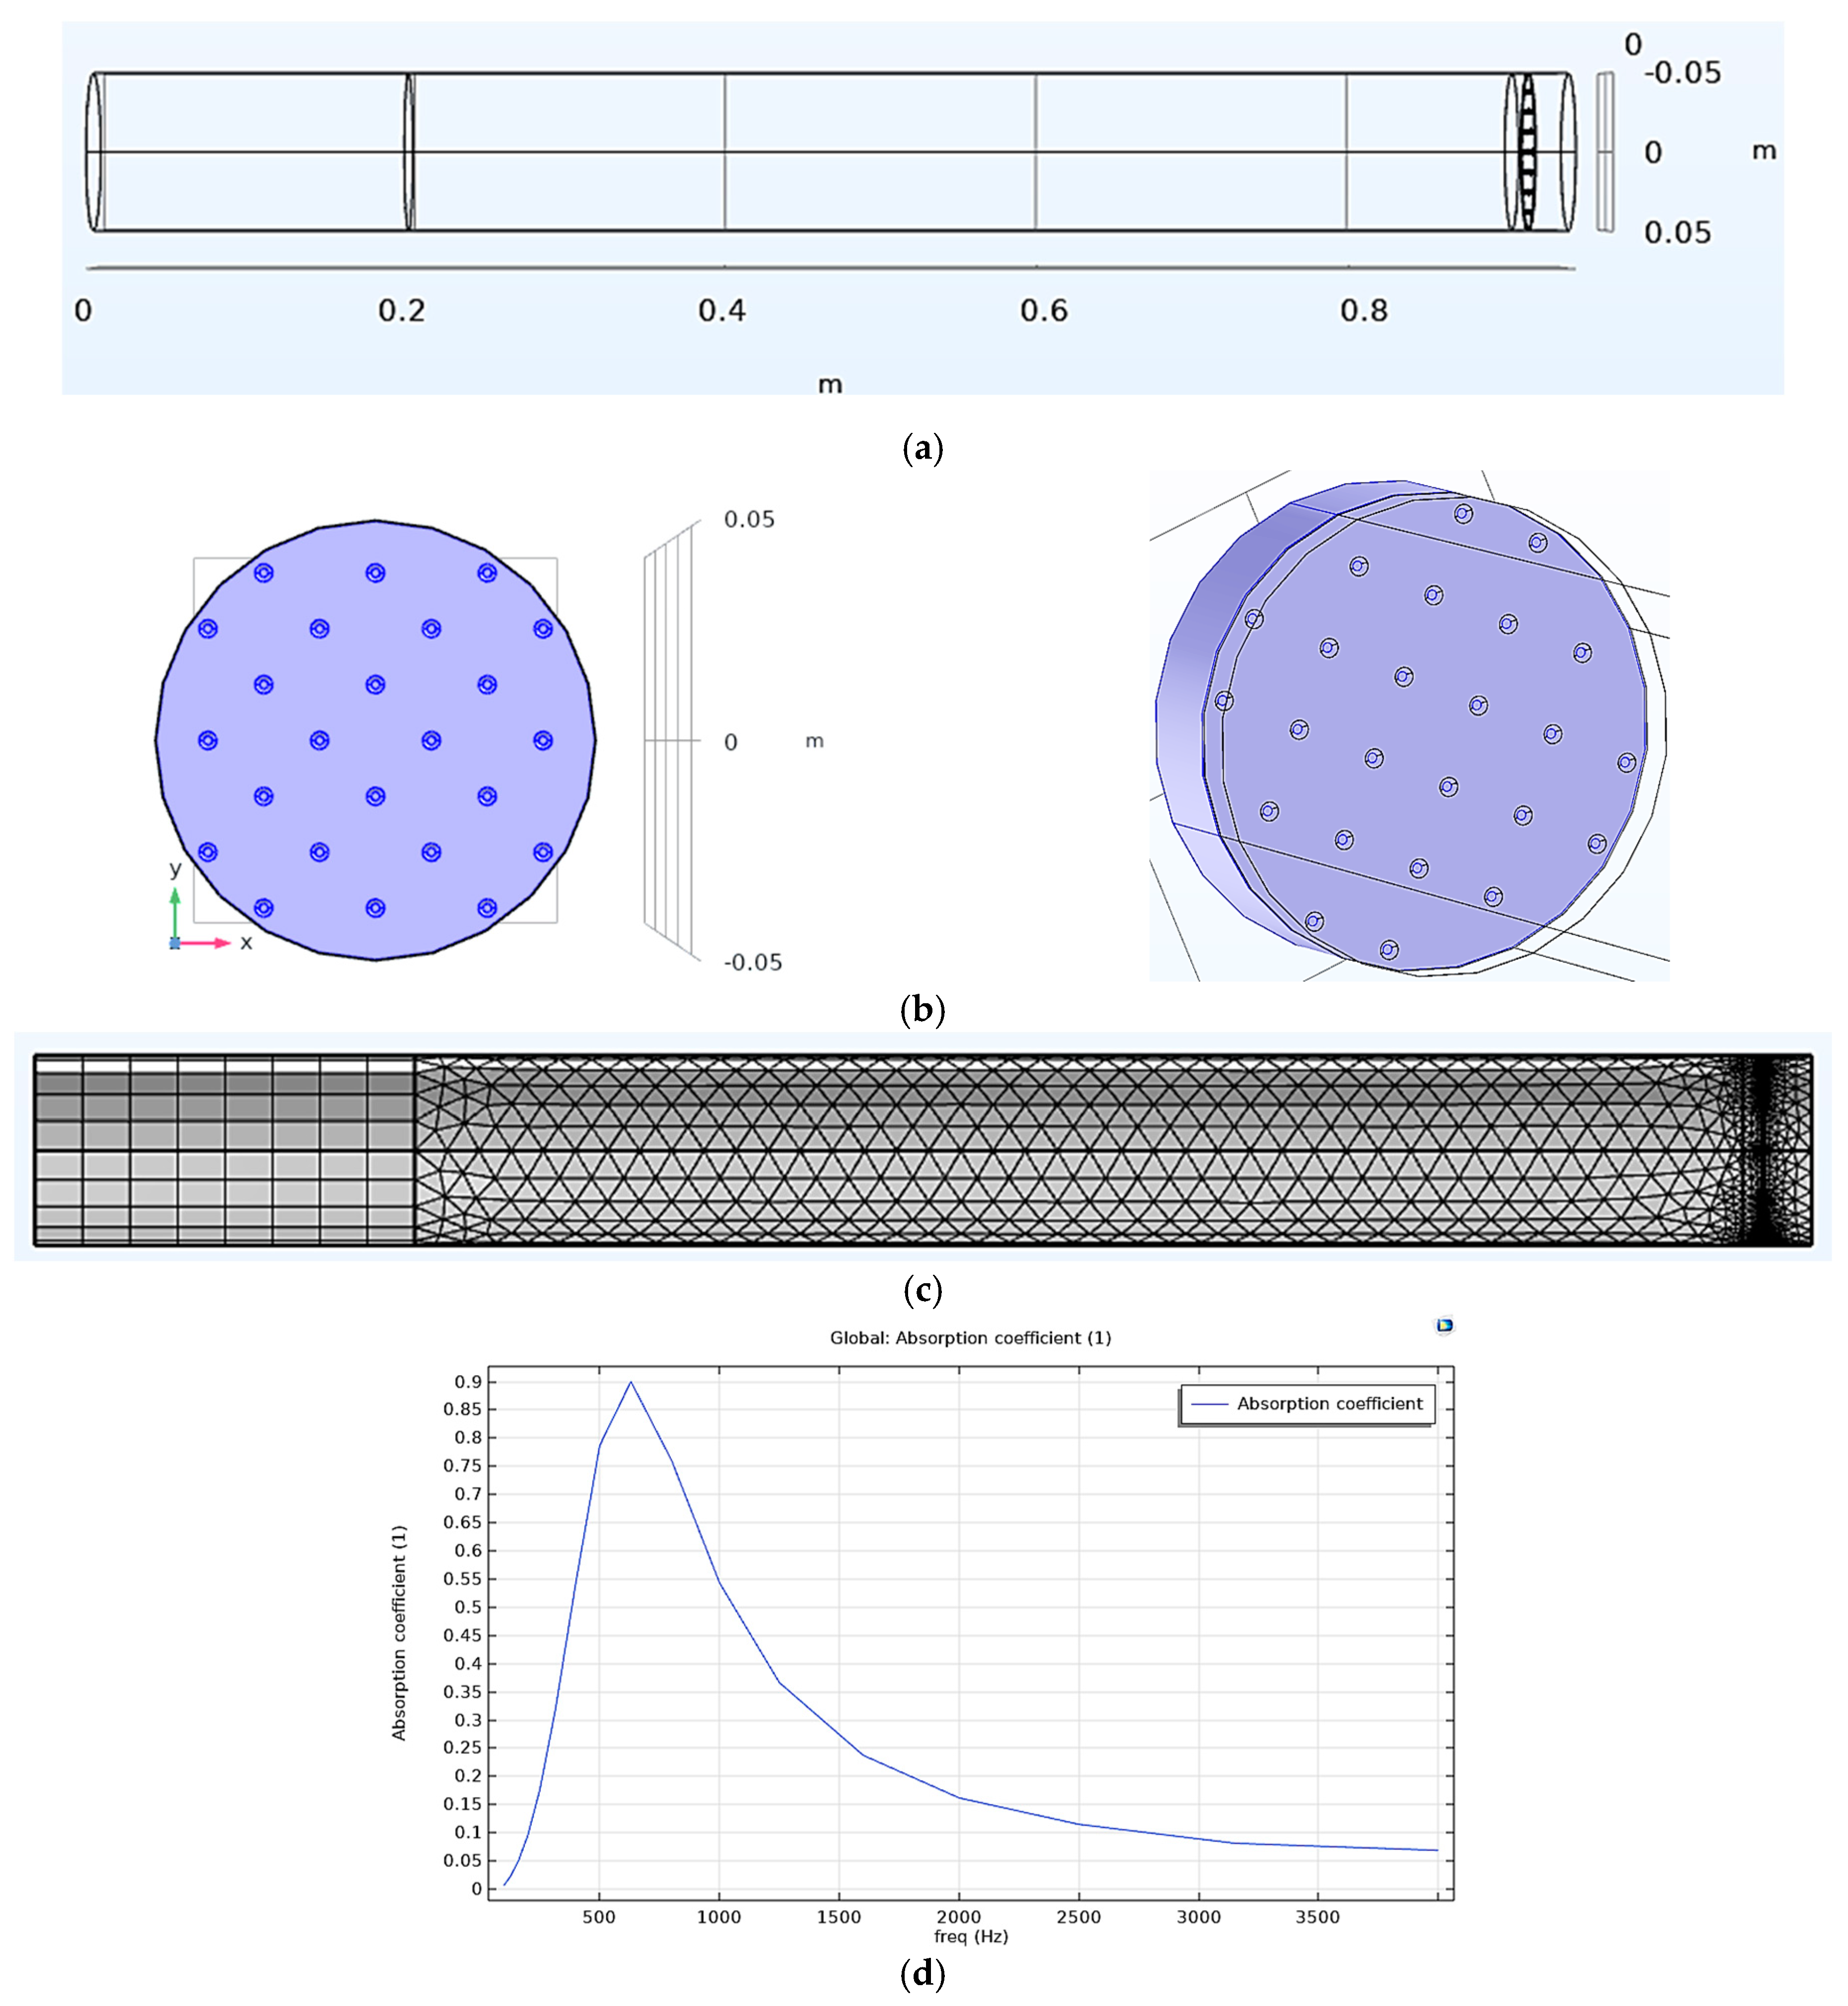
FEA employs a porous material model with parameters including sound speed (343 m/s), flow resistivity (13,498 Pa·s/m2), and a 25 mm acoustic structure thickness. The flow resistivity was measured using an airflow resistivity meter, adhering to the DIN EN 29053 standard [36]. Key parameters, such as plane wave direction, free field wave number, background plane wave properties, incident wave characteristics, specific surface forward impedance, and absorption coefficients, are specified. The mesh is complete with 49,513 vertices and a total of 286,629 elements, which include 285,925 tetrahedra, 704 prisms, 33,848 triangles, and 160 quads. There are also 1913 edge elements and 120 vertex elements. Element quality varies, with a minimum quality of 0.1316 and an average quality of 0.649. Mesh parameters include a maximum element size of 0.0515 and a minimum size of 0.00374. The curvature factor is 0.4, the resolution of narrow regions is 0.7, and the maximum element growth rate is 1.4. The predefined size is finer.
The Delany Bazley model, known for characterising porous material acoustics, calculates the sound absorption coefficient within the poroacoustic framework. Figure 5 shows the complete methodology for acoustic structure simulation in COMSOL Multiphysics 6.0 software.

Figure 5.
Acoustic structure in FEA. (a) Wireframe model of impedance tube containing acoustic structure; (b) Perforated panel with polyurethane foam; (c) Mesh model; (d) Sound absorption coefficient vs. frequency.
3.2. Presentation of Simulated Results
In our study, we harnessed the computational power of COMSOL Multiphysics 6.0 software to determine sound absorption coefficients in two distinct scenarios meticulously: forward and reverse configurations.
Forward case: The tabulated results in Table 1 present a comprehensive dataset of sound absorption coefficients, offering insights into how changes in perforation patterns can influence the acoustic properties of the structures under investigation.

Table 1.
Sound absorption coefficient for forward case.
Towards the table’s conclusion, the last rows showcase the Noise Reduction Coefficient (NRC) values for specific conditions. Case 1 exhibits the maximum NRC value compared to the other instances, implying maximum noise reduction performance in this configuration.
Reverse Case: Table 2 displays sound absorption coefficient values for the mentioned structures, with the last row indicating each structure’s Noise Reduction Coefficient (NRC). Importantly, all acoustic structures exhibit NRC values lower than that of Case 1 in the forward acoustic configurations.
Table 2.
Sound absorption coefficient for reverse case.
In this analysis, the Noise Reduction Coefficient (NRC) values for the forward configuration exhibit a range from 0.371 to 0.441 across various setups. Correspondingly, for the reversed configuration, NRC values span from 0.371 to 0.421. The proximity of these measurements indicates minimal variation. The configuration that includes tapered holes demonstrates improved performance in the forward case compared to all other cases.
3.3. Frequency-Dependent Sound Absorption Characteristics of Various Cases
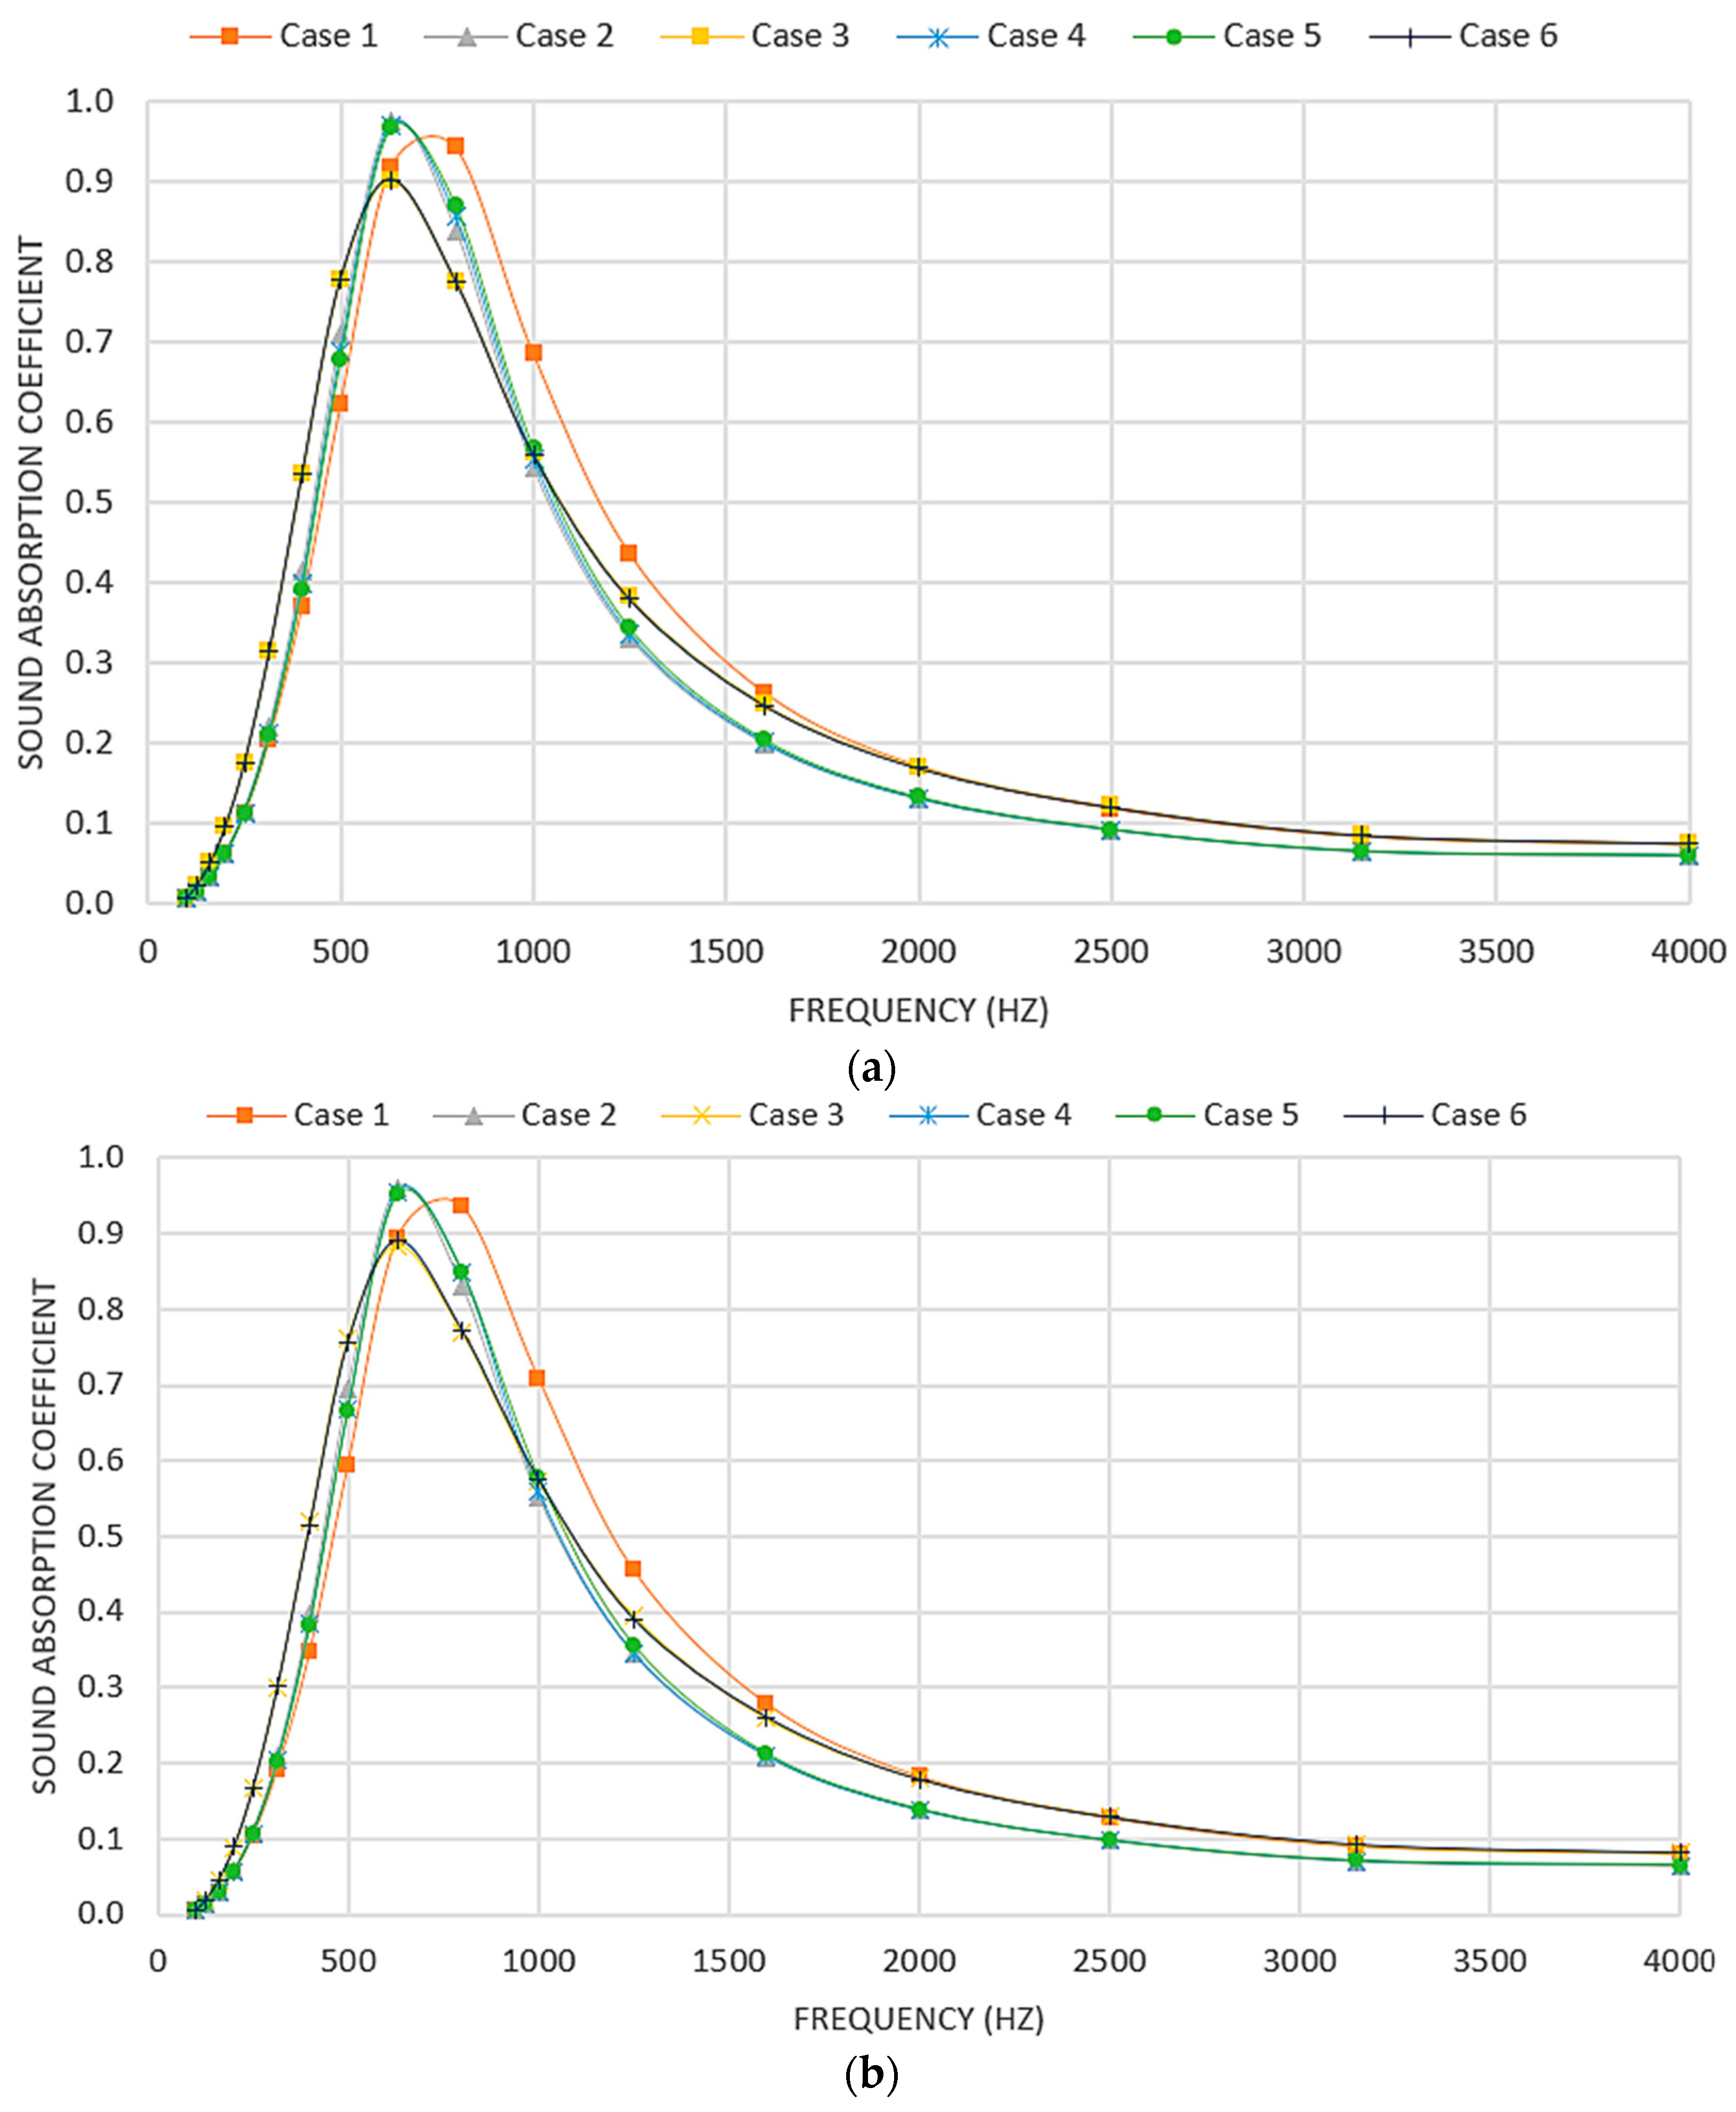
The following Figure 6 visualizes sound absorption coefficients as a function of frequency, ranging from 0 to 4000 Hz, for six cases in both forward and reversed configurations, represented by twelve curves. The coefficients, varying between 0 and 1.0, peak between 500 and 1000 Hz, highlighting optimal absorption. Post-peak, the curves decline, indicating reduced efficacy at higher frequencies. This pattern reflects how material properties or setup variations impact the sound absorption characteristics, providing a clearer understanding of the data presented in Table 1 and Table 2.
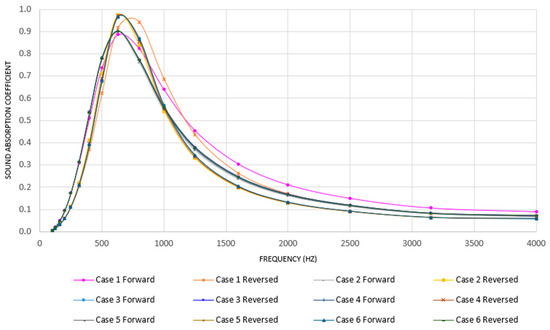
Figure 6.
Frequency-Dependent Sound Absorption for Different Cases in Forward and Reversed Configurations.
4. Experimental Validation
4.1. 3D-Printing of the Samples
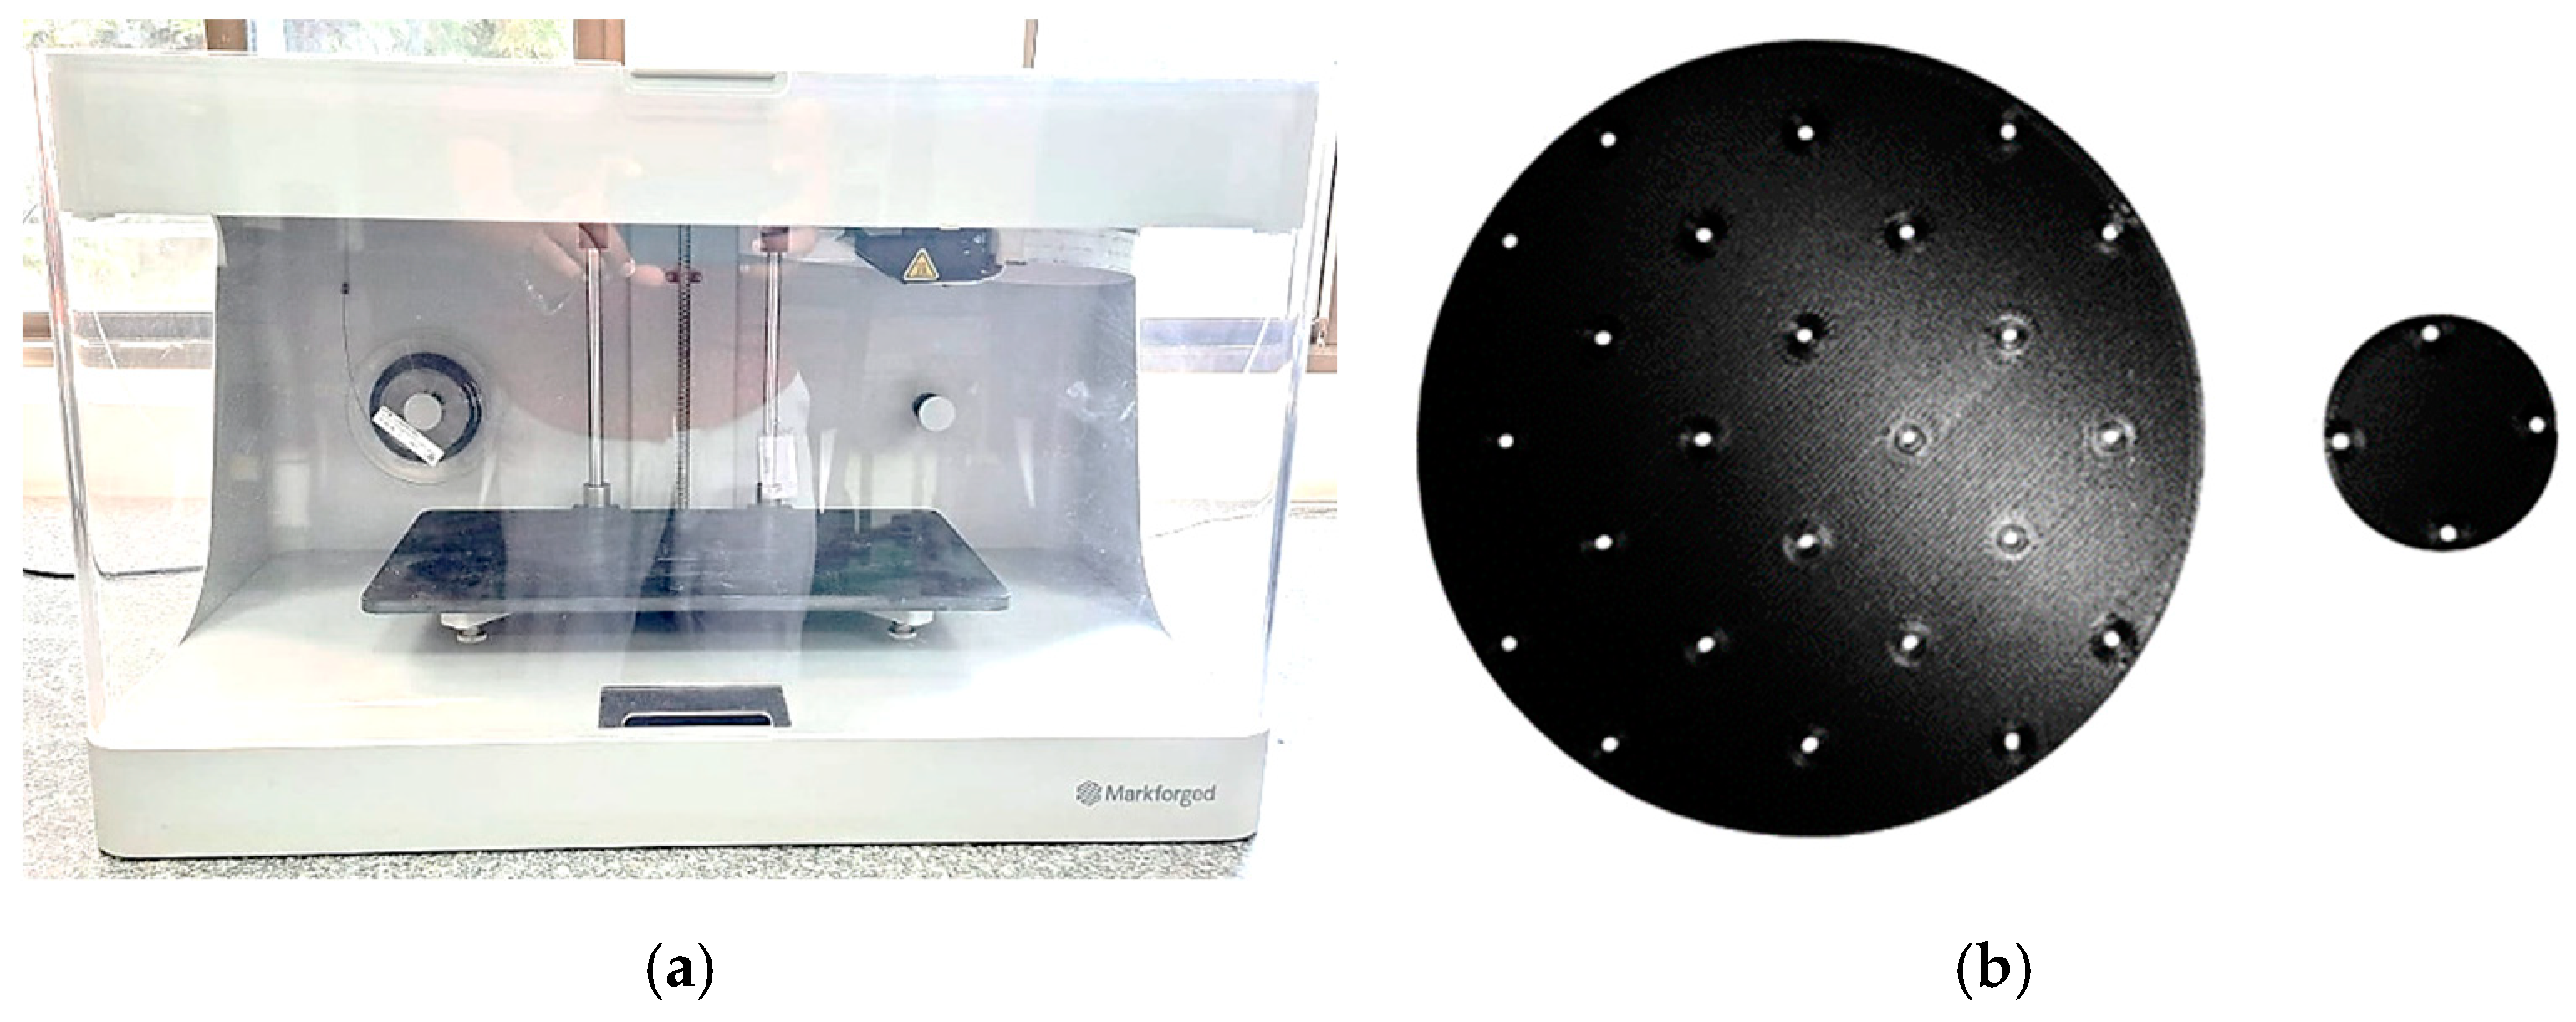
Figure 7 demonstrates proficiency in producing durable carbon fibre composite parts utilizing continuous fibre reinforcement (CFR). In this study, polymer samples were produced using a Mark forged 3D-printer, employing Onyx (chopped carbon fibre) and continuous carbon fibre. Onyx is a Composite Base material—a micro carbon fibre-filled nylon that yields accurate parts with near-flawless surface finish. Each sample featured a 100% fill density and a solid fill pattern, maintaining a consistent layer thickness of 1 mm with diameters of 100 mm and 30 mm.

Figure 7.
The 3D-printing of the samples. (a) Mark II, a professional-grade 3D-printer; (b) Perforated panel samples.
4.2. Test Setup for Acoustic Measurements
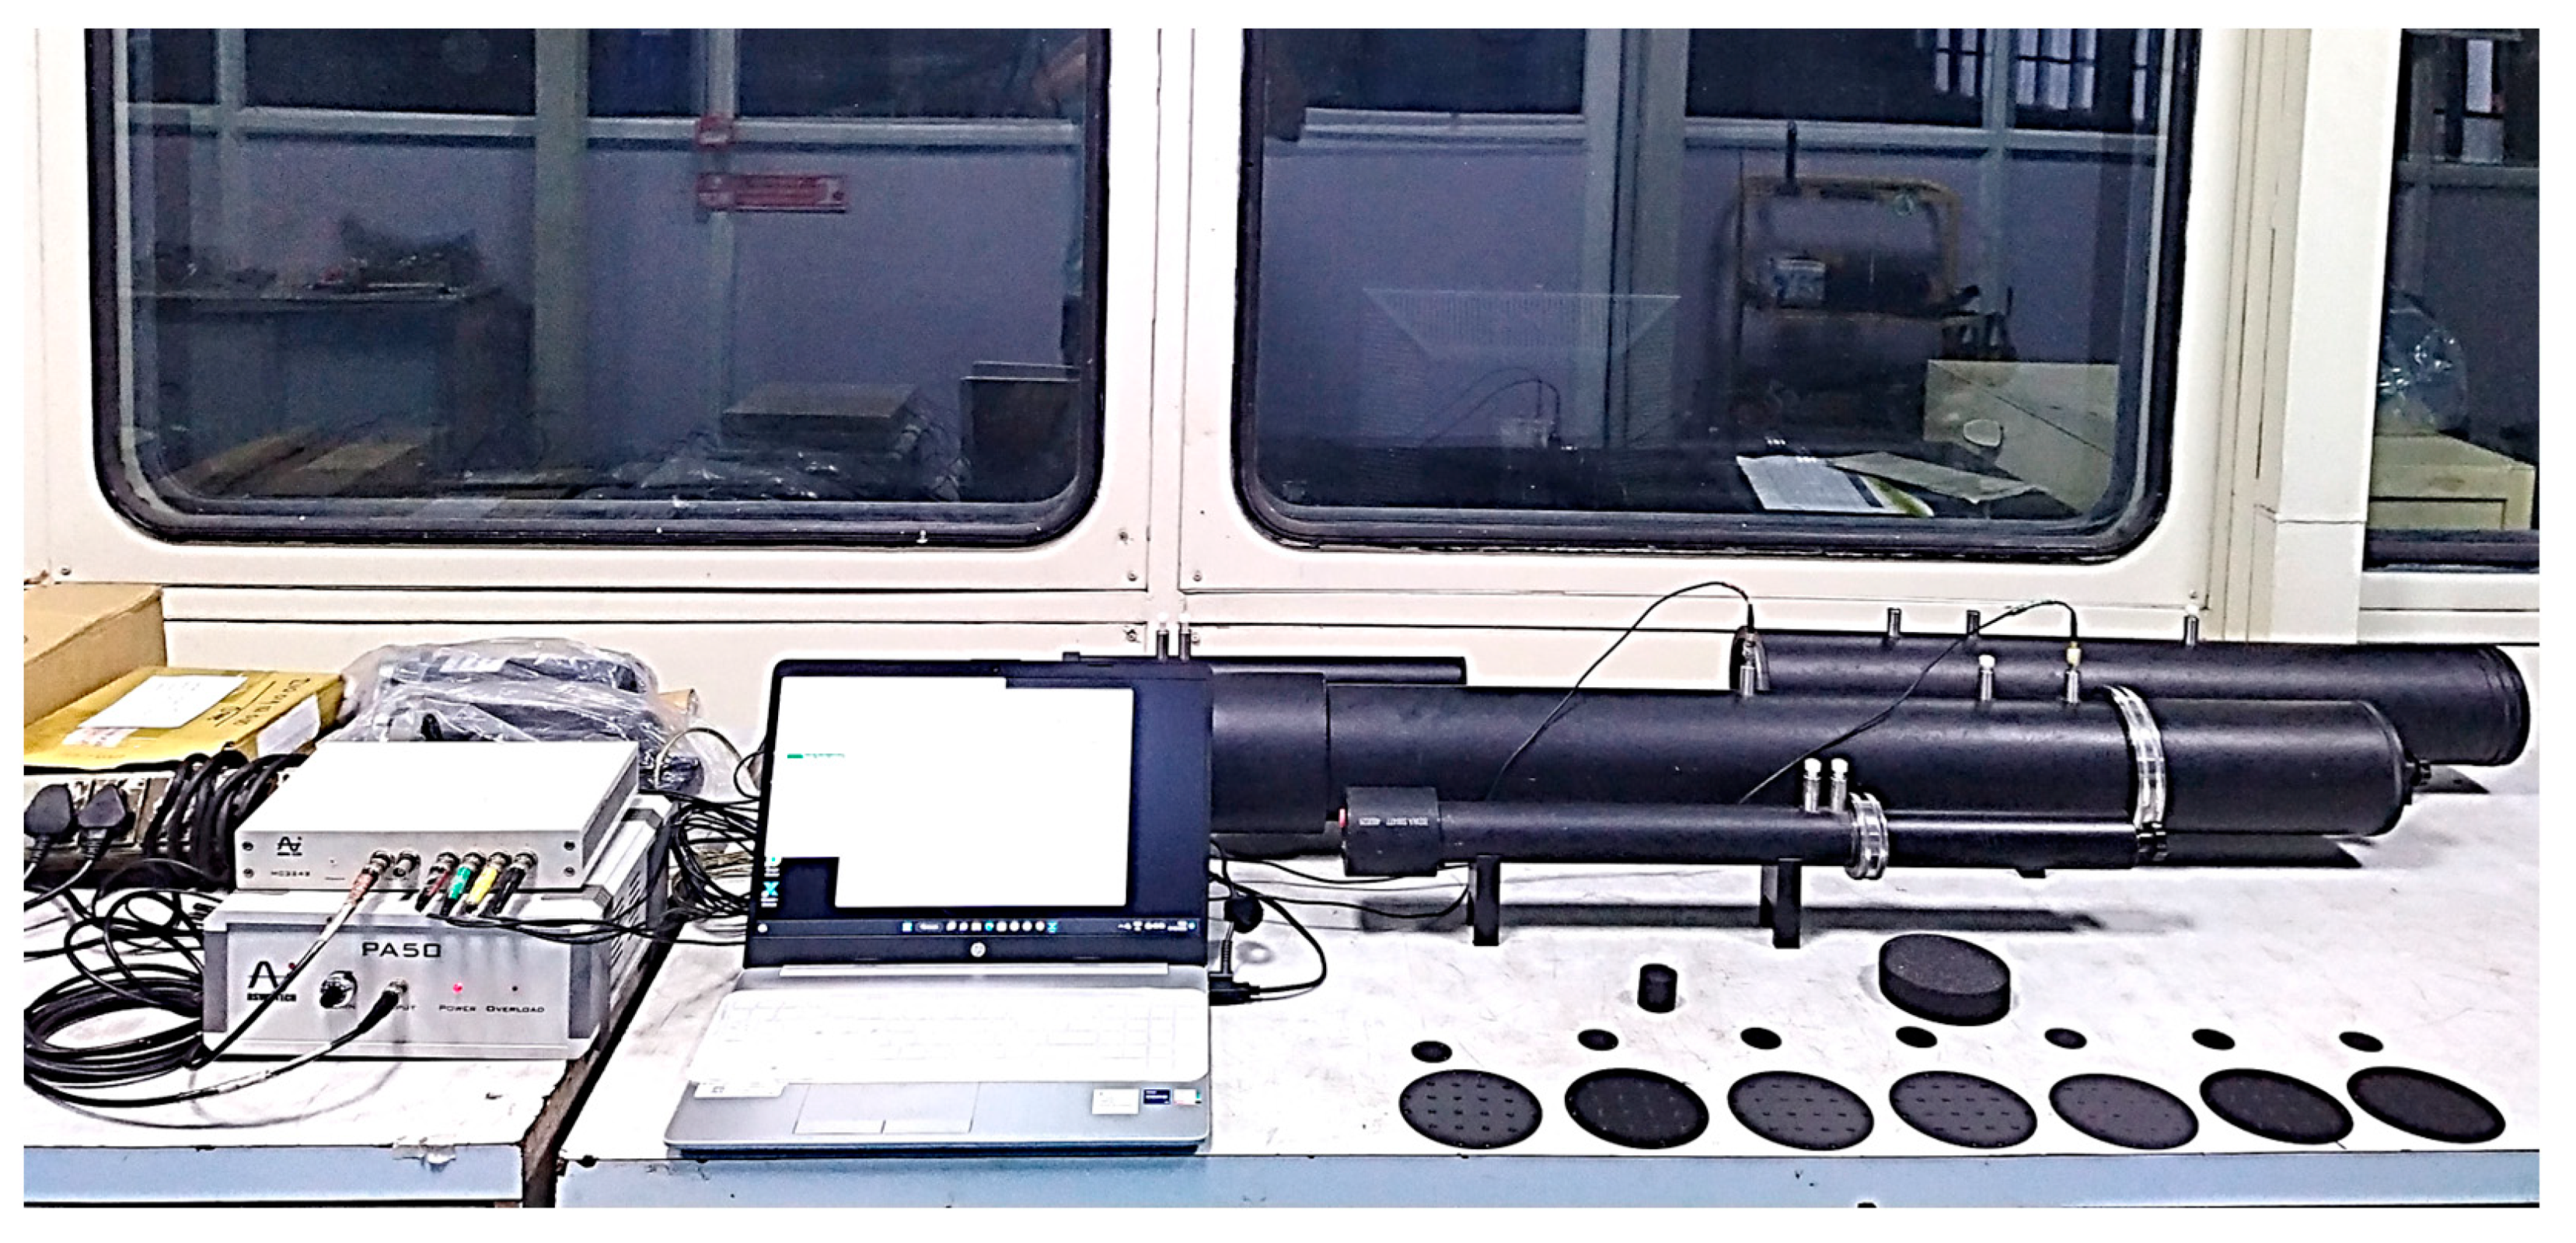
The experimental setup comprises polyurethane foam, perforated panels, loudspeakers, frequency analysers, and data acquisition systems within two impedance tubes (100 mm and 30 mm diameters) for low and high-frequency ranges. MEMS microphones and VA lab software handle data analysis. In this study, preparations were made using polyurethane (Pu) foam and perforated panels. The impedance tube method determined a sandwich structure’s Sound Absorption Coefficient (SAC). The experimental setup shown in Figure 8 for measuring the acoustic characteristics involved positioning a sound source (e.g., a loudspeaker or high-output acoustic driver) at one end of the impedance tube to generate the acoustic signal. At the opposite end, samples of the tested materials were secured in a sample holder. Behind the sample, a rigid plunger with adjustable depth was placed. Two microphones were strategically positioned to capture the incident wave simultaneously, before it entered the acoustic structure and the reflected wave after passing through the same structure.
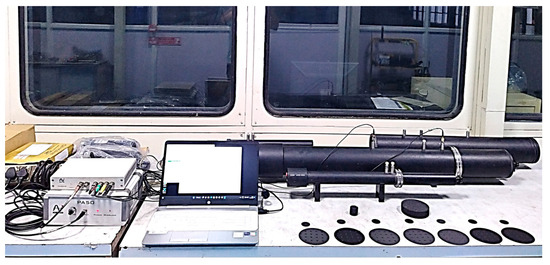
Figure 8.
Experimental set-up.
Using the transfer function method to extract the SAC, a signal analyser processed the data collected from both microphones. This method enables the calculation of the ratio between the reflected and incident waves, which directly represents the Sound Absorption Coefficient of the tested acoustic structure.
Forward Case: In this experiment, six samples underwent testing to assess the performance of various perforated panel hole configurations in conjunction with polyurethane foam. The table below presents sound absorption coefficient values within the 1/3rd frequency band (100–4000 Hz) for typical scenarios. NRC quantifies the sound absorption of materials. Calculated NRC values for each sandwich structure are presented in the last row of Table 3 for assessment.
Table 3.
Sound absorption coefficient for forward case.
The table highlights Case 1, which indicates the maximum NRC value among six different acoustic structures, offering insights into optimal sound absorption capabilities within this study. Case 1 exhibits the maximum NRC value (0.444) compared to the other cases.
Reverse Case: Table 4 shows the sound absorption coefficient values obtained for the six reverse cases. Calculated NRC values for each sandwich structure are presented in a table for assessment.
Table 4.
Sound absorption coefficient for reverse case.
Table 4 showcases NRC values for reverse configurations featuring various perforated panel hole geometries with PU foam. Significantly, all these values are lower than the NRC of Case 1 of the forward case (NRC = 0.444), representing the standard configuration employing a perforated panel and PU foam. Thus, Case 1 exhibits maximum sound absorption capabilities compared to other cases in forward and reverse designs, highlighting its efficacy in acoustic control applications.
5. Interpretation of Computational and Experimental Results
5.1. Comparative Analysis of Sound Absorption Coefficients from FEA and Experimental Data for Case 1 in the Forward Scenario
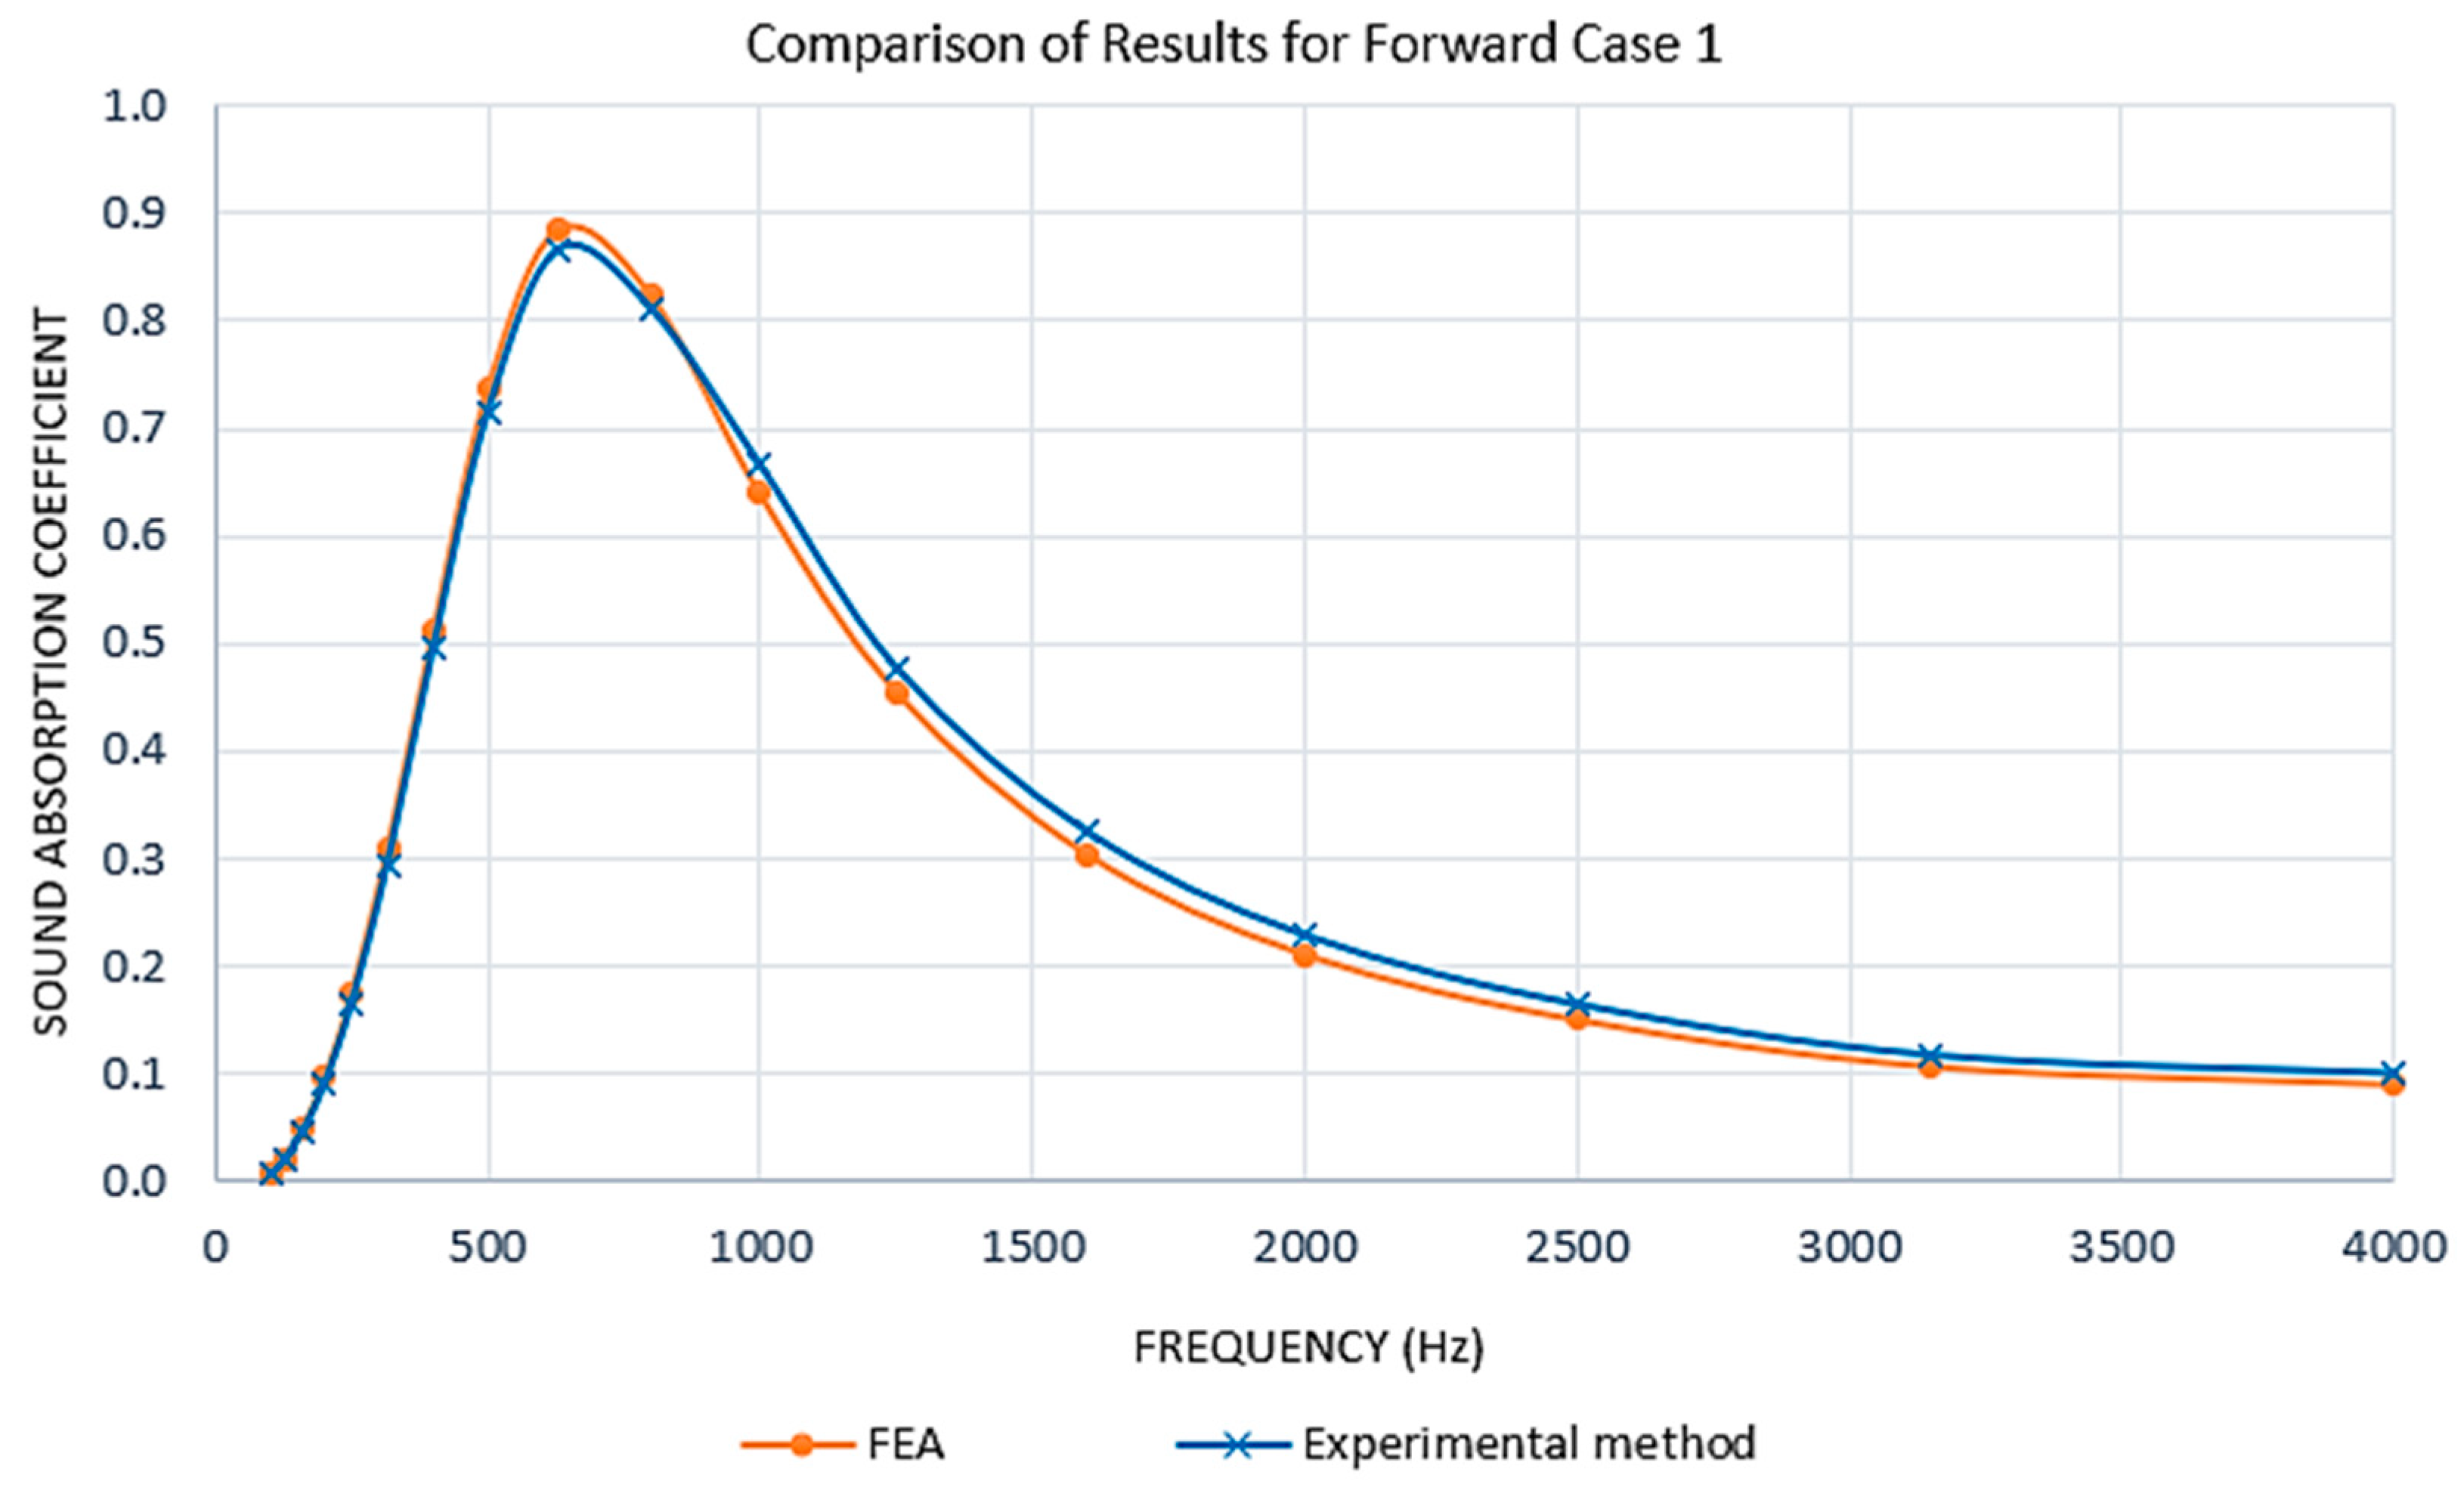
The comparison has been made using data from both FEA and experimental observations. This discussion specifically focuses on Case 1 of the forward scenario for simplicity. The subsequent Figure 9 illustrates a comparison of sound absorption coefficients as a function of frequency, ranging from 0 Hz to 4000 Hz. It presents two curves: one representing the FEA and the other obtained from experimental methods. Both curves reach a peak absorption at 630 Hz, where the coefficient nears a maximum of approximately 0.9. Following this peak, there is a consistent decline in absorption coefficients as the frequency continues to increase. This similar trajectory across the frequency spectrum indicates a strong correlation between the FEA predictions and experimental results, affirming the accuracy of the FEA model relative to the experimental conditions.
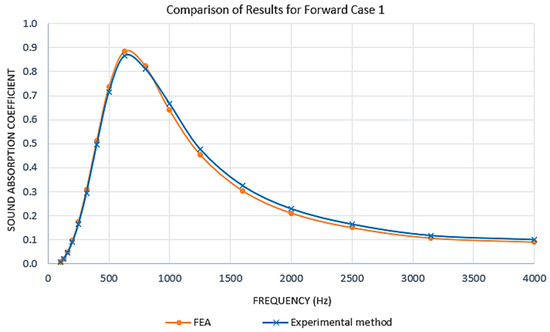
Figure 9.
Comparison of results from FEA and the experimental method for forward case 1.
5.2. Sound Absorption Coefficient for Forward Case
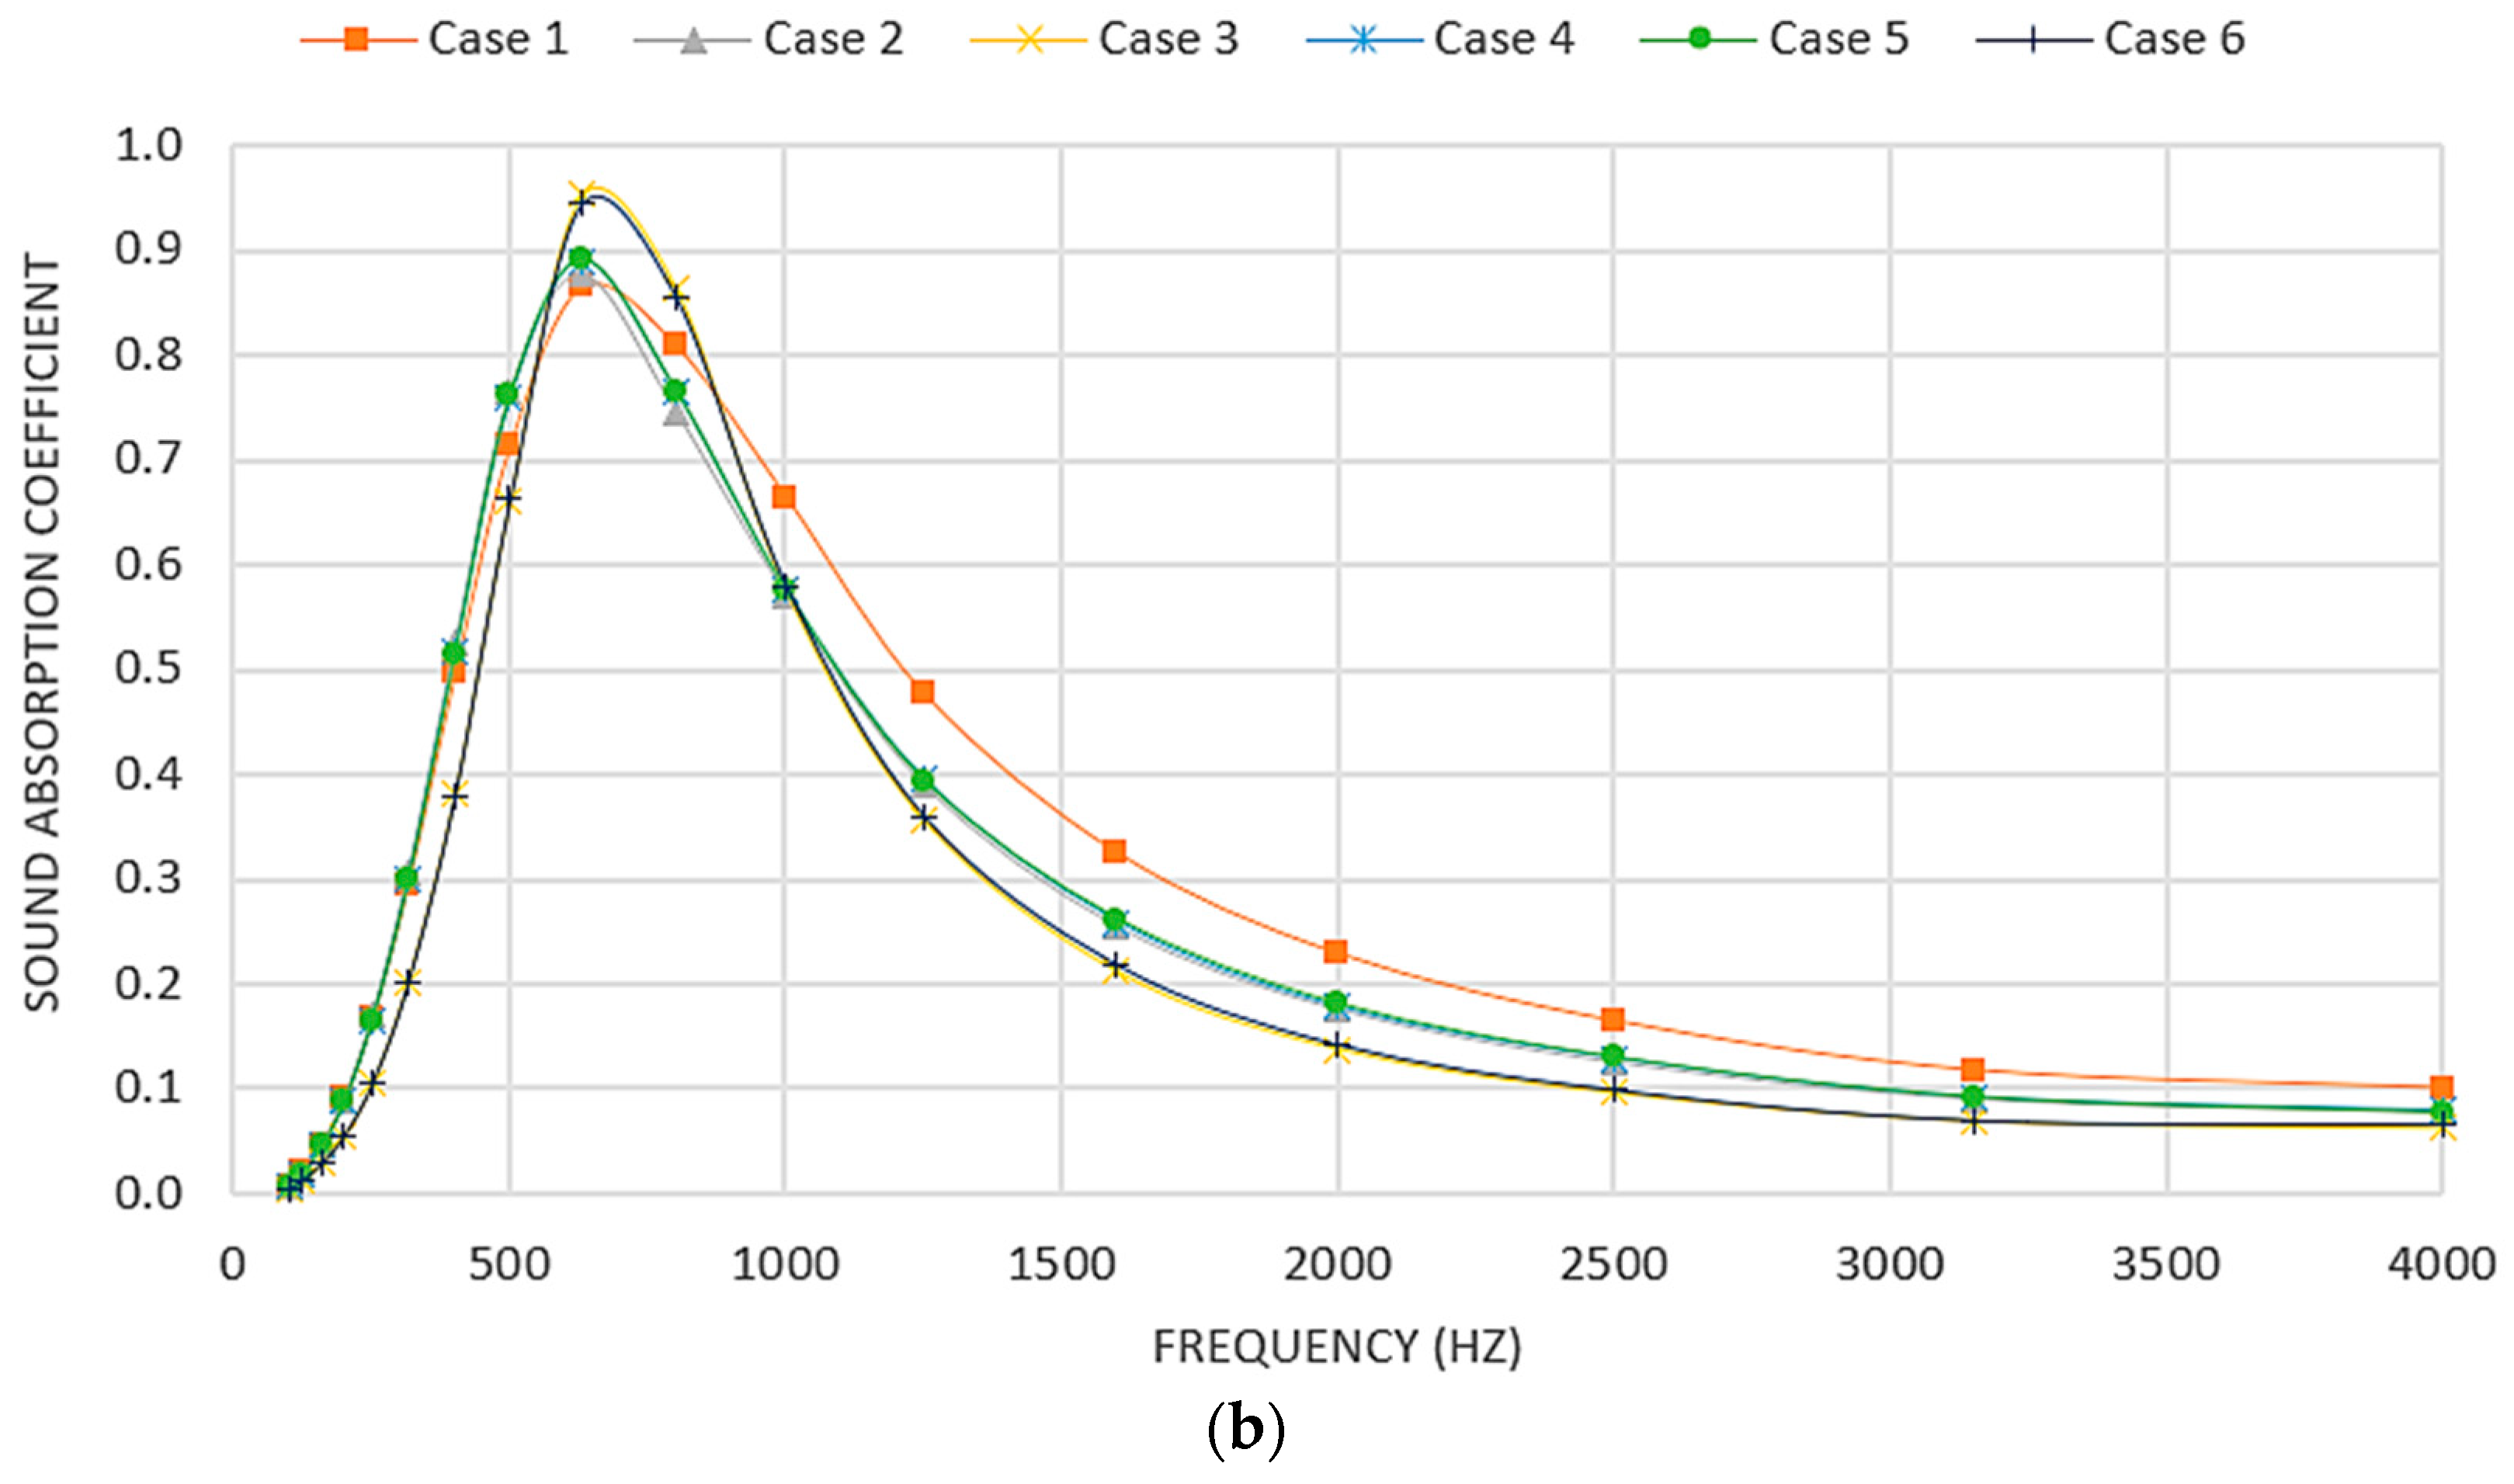
Figure 10 shows COMSOL Multiphysics 6.0 and experimental measurements using an impedance tube. This research informs material simulation results validated against experiments, confirming model accuracy.
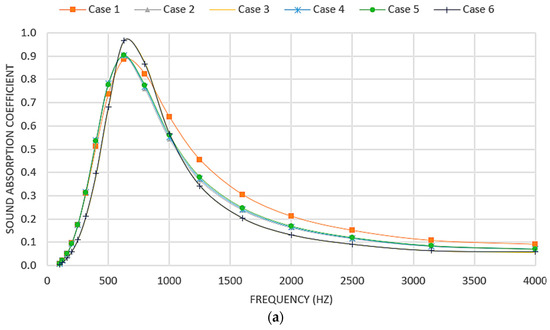
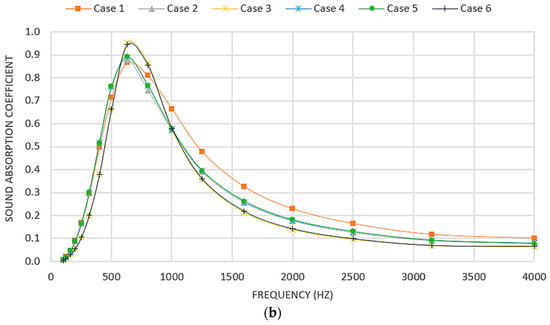
Figure 10.
Sound absorption coefficient vs. frequency for a forward case. (a) FEA; (b) Experimental method.
Among the examined cases, namely 1, 2, 4, and 5, the sound absorption coefficient displayed its peak performance up to 500 Hz. Cases 3 and 6, characterized by tapered step configurations, demonstrated distinctive characteristics. They exhibited peak absorption coefficients at 630 and 800 Hz while maintaining minimal absorption from 1250 Hz up to 4000 Hz. Conversely, Case 3 consistently registered the lowest NRC values, indicating poor sound absorption performance. Case 3 and Case 6 performed well in the 630 to 800 Hz frequency range, boasting the maximum Sound Absorption Coefficient values within this spectrum. However, Case 6 needed to improve with lower sound absorption coefficients below 630 Hz. In this range, a case (case 1) featuring a tapered hole exhibited the maximum sound absorption coefficient, implying its remarkable sound absorption capacity. Therefore, the empirical data establishes Case 1 as optimal for maximum noise reduction and sound absorption in these evaluated scenarios. This analysis highlights the effectiveness of the tapered hole design in enhancing both sound absorption and noise reduction coefficients, particularly in higher frequency ranges. In contrast, combining step and taper configurations proved less effective in achieving these acoustic goals. These findings provide valuable insights for optimizing sound absorption coefficient selection.
5.3. Sound Absorption Coefficient for the Reverse Case
Figure 11 shows COMSOL Multiphysics 6.0 simulation results validated against experiments for the reverse case, confirming the model’s accuracy for scientific research.
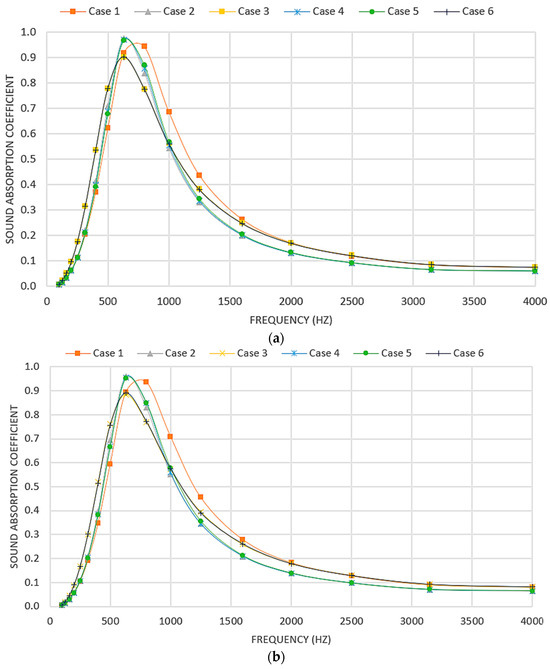
Figure 11.
Sound absorption coefficient vs. frequency for reverse case. (a) FEA; (b) Experimental Method.
Cases 2, 4, and 5 exhibited identical sound absorption coefficients, peaking at 630 Hz, while cases 3 and 6 showed maximum absorption up to 500 Hz. Case 1, featuring holes with a 2 mm to 4 mm inverted tapered design, demonstrated peak absorption between 800 to 1600 Hz. Notably, Case 6 achieved the maximum noise reduction coefficient of 0.42. However, this was surpassed by the forward configuration in Case 1, earning a maximum coefficient of 0.44. These findings underscore the complexity of panel perforation patterns in acoustic optimization.
6. Discussion
6.1. Implications of Varying Hole Geometries on Acoustic Performance
The investigation into the impact of hole geometry shown in Figure 3 on sound absorption coefficients provides significant insights into the acoustic behaviour of various perforated panel configurations under forward and reverse conditions across six distinct cases. As the perforation ratio increased and the acoustic hole mass decreased, the panel exhibited reduced resistance to sound waves travelling back and forth, influencing its sound absorption performance.
Forward Case 1, characterized by a gradual reduction in hole diameter, emerges as the most influential performer. It performs well across all frequencies in forward and reverse conditions. In contrast, the reverse case, where the panel is inverted, demonstrates limitations. While it achieves peak sound absorption coefficient values in the 630 to 1000 Hz range, it falls short of the forward Case 1 for other frequencies. Forward Case 2 introduces variation by tapering the first half of the panel and maintaining a constant 2 mm hole diameter afterwards. In the reverse condition, it performs well within the 630 to 800 Hz range but lags behind the forward Case 2 for other frequencies.
Case 3, featuring tapered and stepped features in the first half of the panel, consistently registers the lowest NRC values in the forward configuration. Surprisingly, in the reverse condition, it outperforms the forward Case 3 for frequencies outside the 630 to 1000 Hz range. Case 4, incorporating a step and tapered surface, exhibits peak sound absorption coefficients in the 100 to 500 Hz and 1200 to 4000 Hz ranges in the reverse condition but falls behind the forward Case 4 for other frequencies. Case 5′s design, featuring two stepped portions, delivers peak sound absorption coefficients in the 630 to 1000 Hz range in the reverse case but underperforms the forward Case 5 for other frequencies.
Case 6, a configuration with a tapered portion and a step, performs well in the 630 to 800 Hz range in forward and reverse conditions. However, in the reverse case, it achieves minimum sound absorption coefficients in the 630 to 1000 Hz range while surpassing the forward Case 6 for other frequencies.
In summary, hole geometry within perforated panels significantly influences sound absorption coefficients. Furthermore, noteworthy variations in the sound absorption peak were evident when altering hole geometry configurations. Mainly, tapered holes devoid of steps exhibited enhanced sound performance in the low-frequency spectrum and achieved maximum coverage of the sound absorption coefficient.
6.2. Comparisons with Prior Research
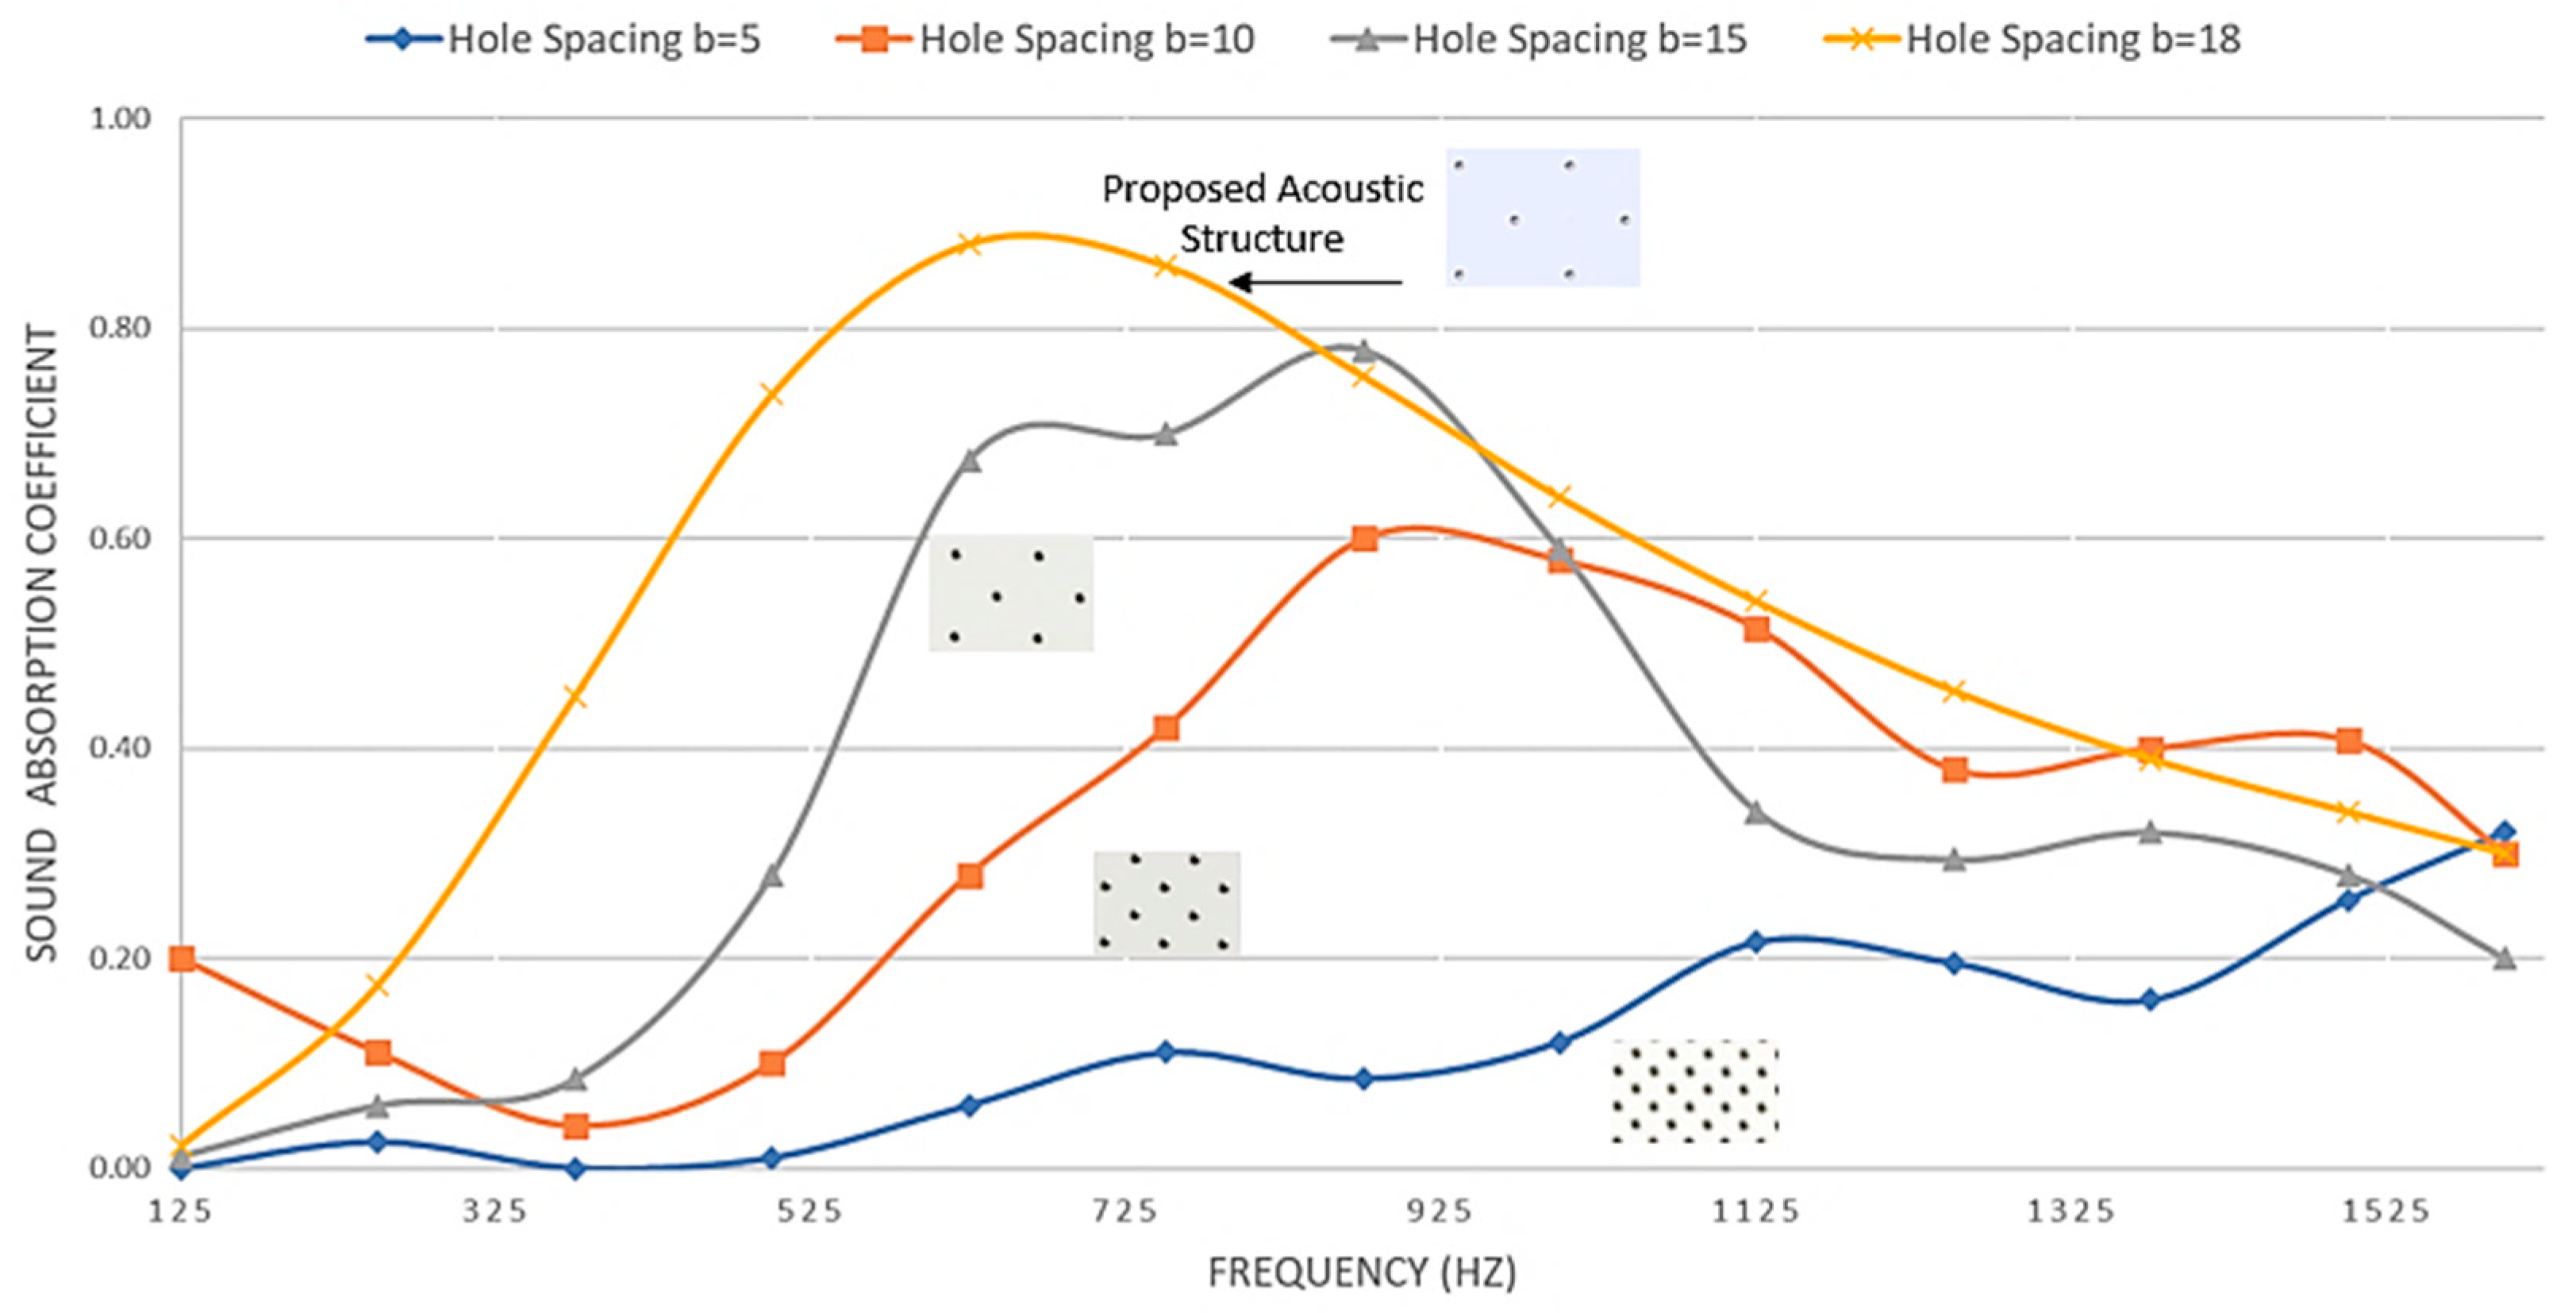
The current study explored a novel configuration of sound absorption characteristics examined by testing perforated panels coupled with a porous absorber. The study revealed distinct trends based on the perforation ratio and hole spacing. Yuvaraj et al. investigated the impact of hole spacing on the sound absorption coefficient. In Table 5, the first panel exhibited inadequate sound absorption capabilities, featuring a perforation ratio of 9.84% with a hole distance of 5 mm for the tapered configuration. This indicated the limited effectiveness of the perforation pattern in this configuration, as shown in Figure 12. Conversely, the second panel, characterized by a reduced perforation ratio of 2.49% and a more significant hole distance of 10 mm, demonstrated a notable enhancement in sound absorption performance. This suggested that modifying the perforation ratio and hole spacing could lead to more effective sound absorption. The third panel, with a perforation ratio of 1.09% and a hole distance of 15 mm, continued to display improved sound absorption compared to the first panel, reinforcing the notion that these parameters played a pivotal role in optimizing sound absorption [20].
Table 5.
Comparison with existing design.
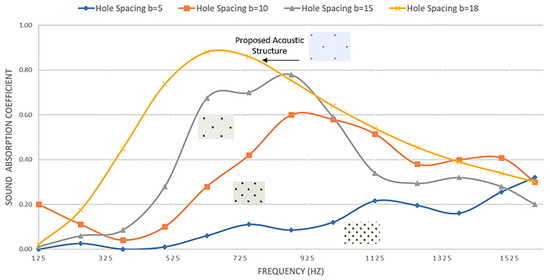
Figure 12.
Comparison of SAC with existing results.
The current study explored a novel configuration of forward case 1 featuring a 0.97% perforation ratio and a hole distance of 18 mm. The findings suggest that reducing the perforation ratio enhances sound absorption, especially within the lower frequency spectrum.
7. Conclusions
This research investigated the acoustic performance of open-pore polyurethane foam and perforated onyx panels fabricated using additive manufacturing, focusing on their sound absorption capabilities. Through both computational simulations using COMSOL Multiphysics 6.0 and experimental validations, the influence of diverse hole geometries and panel orientations on the sound absorption coefficient and noise reduction coefficient was assessed.
Our results show that the perforated panel with a tapered hole geometry achieved the maximum noise reduction coefficient of 0.444, performing better than other configurations. The geometry and orientation of the holes are vital for effective sound absorption.
The study provides insights into sound absorption in porous and perforated materials, offering a framework for material and design selection in noise-sensitive settings. It highlights rapid prototyping for panel fabrication as a promising area for further research and application in acoustic engineering. This research advances the understanding of complex acoustic structures, setting a foundational base for future innovations in noise control and acoustic design. Exploration of diverse hole geometries with varying depths in perforated panels is essential to assess their impact on sound absorption, advancing understanding of acoustic properties.
Author Contributions
Conceptualization, C.P. and R.G.; methodology, C.P., R.G. and R.A.; software, C.P.; validation, C.P. and R.A.; formal analysis, C.P., R.G. and R.A.; investigation, C.P., R.G. and R.A.; resources, R.G. and R.A.; data curation, C.P.; writing—original draft preparation, C.P.; writing—review and editing, R.G. and R.A.; visualization, C.P. and R.G.; supervision, R.G. and R.A.; project administration, C.P., R.G. and R.A. All authors have read and agreed to the published version of the manuscript.
Funding
This research received no external funding.
Data Availability Statement
The data that support the findings of this study are available from the corresponding author upon request.
Conflicts of Interest
The authors declare no conflicts of interest related to this publication. Despite their involvement in research, they confirm that the methodologies and evaluation criteria used were independently and objectively established. The results were obtained through standardized and recognized scientific procedures. All research adhered to the ethical guidelines of the scientific community, ensuring the transparency and reliability of the findings.
References
- Dah-You, M. Theory and Design of Microperforated Panel Sound-Absorbing Constructions. Sci. Sin. 1975, 18, 55–71. [Google Scholar]
- Maa, D.-Y. Microperforated-Panel Wideband Absorbers. Noise Control Eng. J. 1987, 29, 77–84. [Google Scholar] [CrossRef]
- Meng, H.; Galland, M.A.; Ichchou, M.; Bareille, O.; Xin, F.X.; Lu, T.J. Small Perforations in Corrugated Sandwich Panel Significantly Enhance Low Frequency Sound Absorption and Transmission Loss. Compos. Struct. 2017, 182, 1–11. [Google Scholar] [CrossRef]
- Li, X.; Liu, B.; Wu, Q. Enhanced Low-Frequency Sound Absorption of a Porous Layer Mosaicked with Perforated Resonator. Polymers 2022, 14, 223. [Google Scholar] [CrossRef]
- Sakagami, K.; Morimoto, M.; Koike, W. A Numerical Study of Double-Leaf Microperforated Panel Absorbers. Appl. Acoust. 2006, 67, 609–619. [Google Scholar] [CrossRef]
- Magliacano, D.; Catapane, G.; Petrone, G.; Verdière, K.; Robin, O. Sound Transmission Properties of a Porous Meta-Material with Periodically Embedded Helmholtz Resonators. Mech. Adv. Mater. Struct. 2023, 1–9. [Google Scholar] [CrossRef]
- Lee, F.C.; Chen, W.H. Acoustic Transmission Analysis of Multi-Layer Absorbers. J. Sound Vib. 2001, 248, 621–634. [Google Scholar] [CrossRef]
- Bravo, T.; Maury, C.; Pinhède, C. Enhancing Sound Absorption and Transmission through Flexible Multi-Layer Micro-Perforated Structures. J. Acoust. Soc. Am. 2013, 134, 3663–3673. [Google Scholar] [CrossRef] [PubMed]
- Cobo, P.; Simón, F. Multiple-Layer Microperforated Panels as Sound Absorbers in Buildings: A Review. Buildings 2019, 9, 53. [Google Scholar] [CrossRef]
- Lee, D.H.; Kwon, Y.P. Estimation of the Absorption Performance of Multiple Layer Perforated Panel Systems by Transfer Matrix Method. J. Sound Vib. 2004, 278, 847–860. [Google Scholar] [CrossRef]
- Bolton, J.S.; Green, E.R. Normal Incidence Sound Transmission through Double-Panel Systems Lined with Relatively Stiff, Partially Reticulated Polyurethane Foam. Appl. Acoust. 1993, 39, 23–51. [Google Scholar] [CrossRef]
- Asdrubali, F.; Pispola, G. Properties of Transparent Sound-Absorbing Panels for Use in Noise Barriers. J. Acoust. Soc. Am. 2007, 121, 214–221. [Google Scholar] [CrossRef]
- Mosa, A.I.; Putra, A.; Ramlan, R.; Esraa, A.-A. Absorption Coefficient of a Double-Layer Inhomogeneous Micro-Perforated Panel Backed with Multiple Cavity Depths. Acoust. Aust. 2020, 48, 69–78. [Google Scholar] [CrossRef]
- Chiang, Y.K.; Choy, Y.S. Acoustic Behaviors of the Microperforated Panel Absorber Array in Nonlinear Regime under Moderate Acoustic Pressure Excitation. J. Acoust. Soc. Am. 2018, 143, 538–549. [Google Scholar] [CrossRef]
- Lin, J.H.; Chuang, Y.C.; Li, T.T.; Huang, C.H.; Huang, C.L.; Chen, Y.S.; Lou, C.W. Effects of Perforation on Rigid PU Foam Plates: Acoustic and Mechanical Properties. Materials 2016, 9, 1000. [Google Scholar] [CrossRef]
- Min, H.; Guo, W. Sound Absorbers with a Micro-Perforated Panel Backed by an Array of Parallel-Arranged Sub-Cavities at Different Depths. Appl. Acoust. 2019, 149, 123–128. [Google Scholar] [CrossRef]
- Caniato, M.; Kyaw Oo D’Amore, G.; Kaspar, J.; Gasparella, A. Sound Absorption Performance of Sustainable Foam Materials: Application of Analytical and Numerical Tools for the Optimization of Forecasting Models. Appl. Acoust. 2020, 161, 107166. [Google Scholar] [CrossRef]
- Yuvaraj, L.; Jeyanthi, S.; Mailan Chinnapandi, L.B.; Pitchaimani, J. Experimental and Numerical Investigation on Sound Absorption Characteristics of 3D Printed Coupled-Cavity Integrated Passive Element Systems. J. Low Freq. Noise Vib. Act. Control 2022, 41, 60–73. [Google Scholar] [CrossRef]
- Kim, B.-S.; Cho, S.-J.; Min, D.; Park, J. Experimental Study for Improving Sound Absorption of a Composite Helical-Shaped Porous Structure Using Carbon Fiber. Compos. Struct. 2016, 145, 242–247. [Google Scholar] [CrossRef]
- Yuvaraj, L.; Jeyanthi, S. Acoustic Performance of Countersunk Micro-Perforated Panel in Multilayer Porous Material. Build. Acoust. 2020, 27, 3–20. [Google Scholar] [CrossRef]
- Liu, Z.; Zhan, J.; Fard, M.; Davy, J.L. Acoustic Properties of Multilayer Sound Absorbers with a 3D Printed Micro-Perforated Panel. Appl. Acoust. 2017, 121, 25–32. [Google Scholar] [CrossRef]
- Hong, T.W.; Wahab, F.; Jian, L.J.; Ishak, S.H. Sound Absorption Coefficient Measurement and Analysis of Bio-Composite Micro Perforated Panel (BC-MPP). J. Mech. Sci. Technol. 2023, 37, 3327–3334. [Google Scholar] [CrossRef]
- Cao, L.; Fu, Q.; Si, Y.; Ding, B.; Yu, J. Porous Materials for Sound Absorption. Compos. Commun. 2018, 10, 25–35. [Google Scholar] [CrossRef]
- Taban, E.; Tajpoor, A.; Faridan, M.; Samaei, S.E.; Beheshti, M.H. Acoustic Absorption Characterization and Prediction of Natural Coir Fibers. Acoust. Aust. 2019, 47, 67–77. [Google Scholar] [CrossRef]
- Opiela, K.C.; Zieliński, T.G.; Dvorák, T.; Kúdela, S., Jr. Perforated Closed-Cell Aluminium Foam for Acoustic Absorption. Appl. Acoust. 2021, 174, 107706. [Google Scholar] [CrossRef]
- Yang, X.; Shen, X.; Duan, H.; Yang, F.; Zhang, X.; Pan, M.; Yin, Q. Improving and Optimizing Sound Absorption Performance of Polyurethane Foam by Prepositive Microperforated Polymethyl Methacrylate Panel. Appl. Sci. 2020, 10, 2103. [Google Scholar] [CrossRef]
- Zhai, W.; Yu, X.; Song, X.; Ang, L.Y.L.; Cui, F.; Lee, H.P.; Li, T. Microstructure-Based Experimental and Numerical Investigations on the Sound Absorption Property of Open-Cell Metallic Foams Manufactured by a Template Replication Technique. Mater. Des. 2018, 137, 108–116. [Google Scholar] [CrossRef]
- Ruiz, H.; Cobo, P.; Dupont, T.; Martin, B.; Leclaire, P. Acoustic Properties of Plates with Unevenly Distributed Macroperforations Backed by Woven Meshes. J. Acoust. Soc. Am. 2012, 132, 3138–3147. [Google Scholar] [CrossRef]
- Xu, Z.; He, W.; Peng, X.; Xin, F.; Lu, T.J. Sound Absorption Theory for Micro-Perforated Panel with Petal-Shaped Perforations. J. Acoust. Soc. Am. 2020, 148, 18–24. [Google Scholar] [CrossRef]
- Pereira, A.; Gaspar, A.; Godinho, L.; Mendes, P.A.; Mateus, D.; Carbajo, J.; Ramis, J.; Poveda, P. On the Use of Perforated Sound Absorption Systems for Variable Acoustics Room Design. Buildings 2021, 11, 543. [Google Scholar] [CrossRef]
- ISO 10534-2:2023; Acoustics—Determination of Acoustic Properties in Impedance Tubes. ISO: Geneva, Switzerland, 2023.
- Won, K.S.; Choe, J. Transmission Loss Analysis in a Partitioned Duct with Porous Boundaries Based on Combination of FEM and Measurement of Sound Absorption Coefficients. Appl. Acoust. 2020, 165, 107291. [Google Scholar] [CrossRef]
- Wang, C.; Liu, X. Investigation of the Acoustic Properties of Corrugated Micro-Perforated Panel Backed by a Rigid Wall. Mech. Syst. Signal Process. 2020, 140, 106699. [Google Scholar] [CrossRef]
- Patil, C.; Ghorpade, R.; Askhedkar, R. Effect of Air Gap, Thickness of Polyurethane (PU) Foam, and Perforated Panel on Sound Absorption Coefficient for Acoustic Structures. In Proceedings of the Volume 1: Acoustics, Vibration, and Phononics, Columbus, OH, USA, 30 October 2022; American Society of Mechanical Engineers: New York, NY, USA, 2022. [Google Scholar]
- Patil, C.; Ghorpade, R.; Askhedkar, R. Impact of Structural Parameters on the Acoustic Performance of 3D-Printed Perforated Panels Combined with Polyurethane Foam. Int. J. Interact. Des. Manuf. 2024, 1–22. [Google Scholar] [CrossRef]
- DIN EN 29053:1993; Acoustic—Materials for Acoustical Applications; Determination of Airflow Resistance. German Institute for Standardisation (Deutsches Institut für Normung): Berlin, Germany, 1993.


Disclaimer/Publisher’s Note: The statements, opinions and data contained in all publications are solely those of the individual author(s) and contributor(s) and not of MDPI and/or the editor(s). MDPI and/or the editor(s) disclaim responsibility for any injury to people or property resulting from any ideas, methods, instructions or products referred to in the content. |
© 2024 by the authors. Licensee MDPI, Basel, Switzerland. This article is an open access article distributed under the terms and conditions of the Creative Commons Attribution (CC BY) license (https://creativecommons.org/licenses/by/4.0/).