Article

Impact of Bio-Ethanol, Bio-ETBE Addition on the Volatility of Gasoline with Oxygen Content at the Level of E10

by
Dimitra-Panagiota Michalopoulou
1,
Maria Komiotou
1,
Ypatia Zannikou
1 and
Dimitrios Karonis
1,2,*
1
School of Chemical Engineering, National Technical University of Athens, Zografou Campus, 15780 Zografou, Greece
2
Institute of Petroleum Research (IPR)-FORTH, Building M1, University Campus, Akrotiri, 73100 Chania, Greece
*
Author to whom correspondence should be addressed.
Fuels 2021, 2(4), 501-520; https://doi.org/10.3390/fuels2040029
Submission received: 1 November 2021 / Revised: 24 November 2021 / Accepted: 24 November 2021 / Published: 29 November 2021

Abstract

:
This study examines the impact of the addition of bio-ethanol/bio-ETBE on the main volatility properties of gasoline. Although several studies have been published on the addition of ethanol or ETBE to gasoline, the simultaneous addition of these oxygenates has not been studied by taking the maximum oxygen content of 3.7% m/m into account. The EN 228:2012-A1:2017 standard specifies the requirements for marketed unleaded gasoline. This standard is able to determine, among other things, a gasoline type with a maximum oxygen content of 3.7% m/m and sets the maximum limits for ethanol content at 10% v/v and 22% v/v for ethers with a minimum five carbon atoms, such as ΕΤΒΕ. Five refinery fractions were mixed in various proportions and were used as base fuels. A total of 30 samples were prepared by blending the base fuels with bio-ethanol/bio-ETBE. In each of these base fuels, bio-ethanol was added in concentrations up to 10% v/v. Subsequently, bio-ETBE was added to each of these fuels in concentrations up to 20.8% v/v for use as a stabilizer. All of the samples were examined using the EN ISO 13016-1 and EN ISO 3405 test methods while considering the volatility requirements set by EN 228. The results showed that the addition of bio-ETBE has a beneficial effect on the volatility characteristics of the samples, as it reduces the vapor pressure of the final blend and sets all fuels in compliance with the required specification limits set by the EN 228 standard.

1. Introduction

The last few decades have been defined by immense concerns regarding environmental pollution and climate change. Thus, sustainable development has become a global goal, especially in Europe, where the fight against climate change has become a political priority. As a means to this aim, the use of automotive fuels derived from biomass and severe strict fuel specifications have been introduced through stringent demanding environmental regulations [1,2].
The emissions that are produced by the transport sector make up a significant portion of the overall greenhouse gas (hereinafter GHG) emissions of the EU. Therefore, decarbonizing transport fuels or even just monitoring and reducing the GHG emissions produced by a fuel’s life cycle can significantly contribute to decreasing the total amount of GHG emissions. This information is necessary if the EU is to meet its GHG emission reduction goals. To achieve this, the EU has adopted various directives over the years that measures that are oriented to limiting pollutant emissions from light- and heavy-duty road vehicles [2,3].
Additionally, European Standards (EN) for conventional fuels have been established, which provide rules regarding the addition of renewable components to fuels [4,5]. For spark ignition gasoline engines, the possible biofuels that can be used as blending components are ethanol (EtOH: 100% renewable) and ethyl tert-butyl ether (ETBE: 47% renewable) [6]. Ethanol and ethyl-tert-butyl-ether (ETBE) have become components of increasing importance in the formulation of automotive gasoline, mainly because they are superior octane boosters and exhibit better exhaust-reducing emissions capabilities compared to hydrocarbon-only based gasoline and gasoline containing MTBE [7,8,9,10,11,12].
Specifically, EN 228:2012 [4] increased the permissible oxygen content to 3.7% m/m, allowing for the addition of up to 10% v/v ethanol in gasoline and additions of up to 22% v/v ethers with a minimum five atoms of carbon (such as ΕΤΒΕ). The previous European Standard EN 228:2008 [13] determined a lower oxygen limit in oxygenated gasoline, with the maximum oxygen limit being additions of up to 2.7% m/m for fuels with a maximum ethanol content of 5% v/v and for 15% v/v ethers with a minimum five atoms of carbon (such as ΕΤΒΕ).
Ethanol (ΕtOH) is added to gasoline in order to improve its octane number (Research Octane Number—RON,) and at the same time, it is able to assist in reducing exhaust emissions such as carbon monoxide, photochemical pollution (NOx and HC emissions), and toxic pollutants such as benzene, toluene, and xylenes. At the same time, toxic compounds such as formaldehyde and acetaldehyde can be increased. [14,15]. However, ethanol affects the volatility of gasoline by greatly altering both the distillation characteristics (E70, E100) and the vapor pressure and often leads them to be outside of the specification limits.
As a pure component, ethanol boils at 78.4 °C, a temperature that is significantly higher than the initial boiling point (IBP) of gasoline (~30 °C) but that is also lower than the mid-range of the gasoline distillation curve (~100 °C). Additionally, the vapor pressure of pure ethanol (about 16 kPa) is much lower than that of gasoline [16].
At the same time, ethanol forms azeotropes with the hydrocarbons of the gasoline. This phenomenon results in an essentially flat distillation curve in the ISO 3405 (or ASTM D86) standard measurement, which is maintained until the azeotropes and hydrocarbons of the ethanol have been eliminated from the liquid. When the ethanol has completely distilled from the liquid, the distillation curve returns to that of typical (hydrocarbon-only) gasoline [16].
Apart from the changes in the distillation profile, the vapor pressure of gasoline increases due to the formation of the azeotropes [17,18].
The addition of ETBE into gasoline reduces the evaporative emissions of the fuel. ETBE can be prepared by reacting bio-ethanol with isobutylene (bio-ETBE) [19]. ETBE has a blending vapor pressure of 28 kPa, and when added to gasoline, it reduces its vapor pressure. Moreover, due to its boiling point (73.0 °C), ETBE affects the mid-range temperatures of gasoline’s distillation curve [20].
Moreover, adding a mixture of ethanol–ETBE to gasoline offers advantages over adding ethanol (lower volatility) or ETBE (higher octane number and lower production costs) alone. In this case, the vapor pressure is lower than the vapor pressure of gasoline with ethanol, and therefore, the volatile organic compound emissions are lower [14,15].
The addition of ethanol can have impact on engine performance and emissions. Ethanol can alter the lubricity of the gasoline, and it can therefore have an impact on the engine components. Ethanol improves lubricity when added to gasoline; therefore, it helps to reduce the possible failures of the fuel delivery system [21,22]. According to the European Association of Engine Manufactures (ACEA), the majority of gasoline-powered vehicles can operate with E10 blends without experiencing any problems [23]. Regarding the combustion parameters, the addition of ethanol (and other oxygenates) leads to the so-called “leaning effect”, an effect that decreases CO and HC emissions [24,25].
Many researchers have studied the effect of adding oxygen components such as ethanol or ETBE on both gasoline volatility and engine performance, but to the authors’ knowledge, the common presence of both oxygenates at the maximum oxygen content of 3.7% m/m has not been presented.
This work presents the effects of adding mixtures of ETBE and ethanol to gasoline blends of different hydrocarbon compositions on the volatility of the gasoline blends, which is measured by the vapor pressure, the distillation characteristics, and the vapor lock index (VLI). In each case, a mixture comprising a different ethanol and ETBE content was used, with the 3.7% m/m upper limit for oxygen content always being considered in the final blends.

2. Materials and Methods

2.1. Materials

2.1.1. Base Fuels

In order to study the behavior of gasoline composition/bio-ethanol/bio-ETBE blends, five base fuels were prepared using five refinery gasoline components produced from different refinery processes, originating from Motor Oil Hellas refinery. The refinery fractions used in the different proportions were reformate, fluid catalytic cracking (FCC) gasoline, alkylate, isomerate, and dimate. The properties of the refinery fractions are shown in Table 1.
The distillation profiles of the refinery fractions are shown in Figure 1. It is clear that the volatilities of these refinery fractions differ from each other based on the process that was used for their production as well as on their composition. These refinery fractions were mixed in different proportions in order to prepare the base fuels, which were called I, II, III, IV, and V.
The percentage (v/v) of each refinery fraction in each base gasoline blend is given in Table 2.
The blending percentages were chosen in order to prepare samples with different compositions but that also had a vapor pressure close to 60 kPa, the upper limit for class A gasoline. At the same time, the octane numbers that were calculated using the blending index calculations were close to 95 and 85 for RON and MON, respectively, in all cases [26].
From the data in Table 1 and Table 2, it appears that the isomerate fraction has a very high vapor pressure (exceeds the maximum of 80.0 kPa according to EN 228 standard), which can set the mixture out of the specification limit. At the same time, this fraction is present at a high percentage in all blends (>25% v/v). The properties and composition of the base fuels are shown in Table 3.
From the data in Table 3, it appears that the properties of all of the blends meet the specification limits of the EN 228 standard. Only the vapor pressure of blend V is above the maximum limit set by the EN 228 standard for gasoline to be used in the summer in Greece (class A).

2.1.2. Oxygenates

The bio-ethanol used in the preparation of the ternary samples has a purity grade of 99.9% (fuel grade) and meets the EN 15376 standard requirements [27]. It was provided by Tarımsal Kimya Teknolojileri A.Ş. (TARKİM), Turkey.
The bio-ETBE was provided by Ecofuel SpA, Italy, and had a purity of 95%

2.2. Samples and Methods

The addition of the oxygenates was conducted based on the oxygen percentages (% m/m), with the maximum limit of 3.7% m/m determined according the EN 228 being used as a reference.
Five samples were prepared from each of the base fuels: I, II, III, IV, and V, which received the addition of 10% v/v bio-ethanol, and other five samples received an addition of 20.8% v/v bio-ETBE.
The next step was the preparation of the ternary blends of the base fuel/bio-ethanol/bio-ETBE in various concentrations for bio-ethanol and for bio-ETBE. The blending strategy was to increase the share of the final amount of oxygen in the blend by 25%, 50%, and 75% from bio-ethanol, with the rest of the oxygen (up to 100%) coming from bio-ETBE. Fifteen samples were prepared from each base fuel, with additions of bio-ethanol ranging from 2.3% to 7.3% and additions of bio-ETBE ranging from 16% to 5.7%. The percentages of the base fuels and the bio-components used in the blends are shown in Table 4.
Finally, a total of 30 samples were prepared and examined according to the methods outlined in EN 13016-1 and EN ISO 3405 in order to test their volatility characteristics [28,29]. These measurements were also used for the calculation of the vapor lock index (VLI) for all of the samples.

2.2.1. Vapor Pressure Measurements

The vapor pressure of the gasoline samples was measured on the Grabner VPXpert apparatus using the EN ISO 13016-1 method. Four measurements were run on each sample. The repeatability of the apparatus is ±0.3 kPa, and the reproducibility is ±0.7 kPa.

2.2.2. Distillation Measurements

All of the samples were analyzed for their distillation characteristics using the method outline in EN ISO 3405. In order to check the precision of the measurements, each sample was measured in an automated distillation unit (Anton Paar, model ADU 5). Four distillation tests were performed for each sample. According to standard EN 228, E70, E100, E150, FBP, and the distillation residue were recorded. The reported sensor uncertainty of the apparatus is ±0.35 at 100 °C and ±0.55 at 200 °C.

2.2.3. Calculation of VLI

After the end of the vapor pressure and the distillation measurements, the VLI, which is also one of the volatility parameters of gasoline, was calculated using the formula VLI = 10·VP + 7·E70, which is mentioned in the standard EN 228 [4].

3. Results and Discussion

3.1. Vapor Pressure Measurements

The specification according to European standard EN 228 sets limits on vapor pressure (DVPE, equivalent to Reid method). In addition, it employs six volatility classes, which are adopted by each member state for winter, summer, and transition periods. Vapor pressure was measured in all of the samples employed in this study.
The vapor pressure results of the base fuels and their blends with only bio-ethanol or bio-ETBE are shown in Figure 2.
Table 5 presents the expanded uncertainties for the vapor pressure of the base fuels. The expanded uncertainty was estimated following the ISO GUM principles and the ISO 4259 standard [30,31]. The uncertainties are depicted as error bars in Figure 2.
The low uncertainty of the measurements (from 0.18 to 0.41) allows us to observe differences in the vapor pressure values when the blend composition changes.
The addition of bio-ethanol to the base gasoline samples resulted in an increase in their vapor pressure. In all of the base fuels, to which only bio-ethanol has been added to the maximum permissible content of 10% v/v, the vapor pressure is higher than the specification limit for “summer grade” gasoline. On the other hand, the addition of bio-ETBE alone up to the max oxygen content of 3.7% m/m reduces the vapor pressure compared to the vapor pressure of the base fuels. All of the samples with the addition of bio-ETBE alone demonstrate vapor pressure within the specification limits. The results are in accordance with the results from other publications [6,7,32,33,34,35].
The increase in the vapor pressure that occurs when bio-ethanol is added can be explained by the formation of minimum-boiling-point azeotropic mixtures between ethanol and lighter fractions of gasoline [6]. This positive deviation from the ideal mixture behavior (Raoult’s Law) occurs because there are less intermolecular interactions between ethanol and hydrocarbon molecules than there are in individual pure liquids, making it easier for molecules to evaporate in the resulting mixture [26,36].
The addition of bio-ETBE, which is of relatively low polarity, leads to a proportional decrease in the vapor pressure in gasoline because the behavior of the formulations of the hydrocarbons with bio-ETBE is very close to the ideal. Bio-ETBE is relatively inert, and thus, minimal bonds are formed between its molecules and the gasoline molecules [26].
The results depicting the effect of the simultaneous addition of bio-ethanol and ETBE on the vapor pressure of the gasoline samples are shown in Figure 3.
The vapor pressure values of these samples are between the vapor pressure values of the samples to which only bio-ethanol has been added and the vapor pressure of the samples to which only bio-ETBE has been added. The increasing trend is similar for all of the blends where the amount of bio-ethanol/bio-ETBE in the blend is the same, but significant differences in the vapor pressure change values were observed.
The blends of the base fuels with bio-ETBE and bio-ethanol show an increase in vapor pressure as the ethanol content is increased, and the ETBE content decreases while the total oxygen content remains almost constant. However, this increase is lower than that of the relative increase for the base fuel without ETBE.
Bio-ethanol has a greater effect on vapor pressure than bio-ETBE, even when present at a lower percentage (2.3% bio-EtOH) in the gasoline samples. The vapor pressure of the samples is not only affected by the components of the base fuel and their % v/v content but also by the interactions between oxygenates and the hydrocarbons in the gasoline [7,37].
The vapor pressure of the samples with a 2.3% bio-ethanol content, except for the blend of Sample V (with increased Isomerate content) and the vapor pressure of Sample I (with high Reformate content and FCC) with 4.7% v/v bio-ethanol, are within the specification limit for the vapor pressure summer-grade gasolines (Class A in EN 228). The vapor pressure of the rest of the samples, which have a bio-ethanol content of up to 10% v/v, are not acceptable during the summer period even though they contain bio-ETBE since they have a vapor pressure that is higher than 60 kPa.
Similar conclusions can be drawn by observing Figure 4. This figure shows the relationship between the vapor pressure and the bio-ETBE content in the samples and the corresponding amount of bio-ethanol needed to be at a level where the maximum oxygen content limit of 3.7% m/m is not exceeded.
In each sample, the vapor pressure decreases as the bio-ETBE content increases (and the bio-ethanol content decreases). The increasing amount of bio-ETBE prevents the formation of bonds between the hydrocarbon–ethanol molecules as the bonds are formed between the ETBE and the ethanol, thus reducing the vapor pressure of the samples [7].
However, if the permissible vapor pressure deviation for unleaded gasoline is taken into account according to EN 228 (as shown in Table 6) [4], then all of the gasoline samples are within the specifications determined by the standard.
In all of the cases where bio-ethanol/bio-ETBE have been added to the mixtures in different concentrations, Sample V shows the highest vapor pressure. This sample has an increased content of volatile iso-paraffins that mainly have five and six carbon atoms (due to the increased percentage of the sample produced from the isomerization process). Most of these iso-paraffins have six carbon atoms, resulting in a large number of electrons that are available for deformation. This results in the formation of stronger Van der Waals forces, thus increasing the activity of the molecule and the tendency for azeotropic formation with the ethanol molecules [38].
On the other hand, Sample I shows the lowest vapor pressure in all of the cases where bio-ethanol/bio-ETBE were added to the mixtures. Sample I, which is a mixture with a high percentage of reformate and FCC gasoline fractions and that has the lowest isomerate fraction percentage of, has a high content of aromatic hydrocarbons that mainly have seven and eight carbon atoms; these carbon atoms tend to have a high boiling point and a lower percentage of volatile iso-paraffins, which justifies it having the lowest vapor pressure values [39].

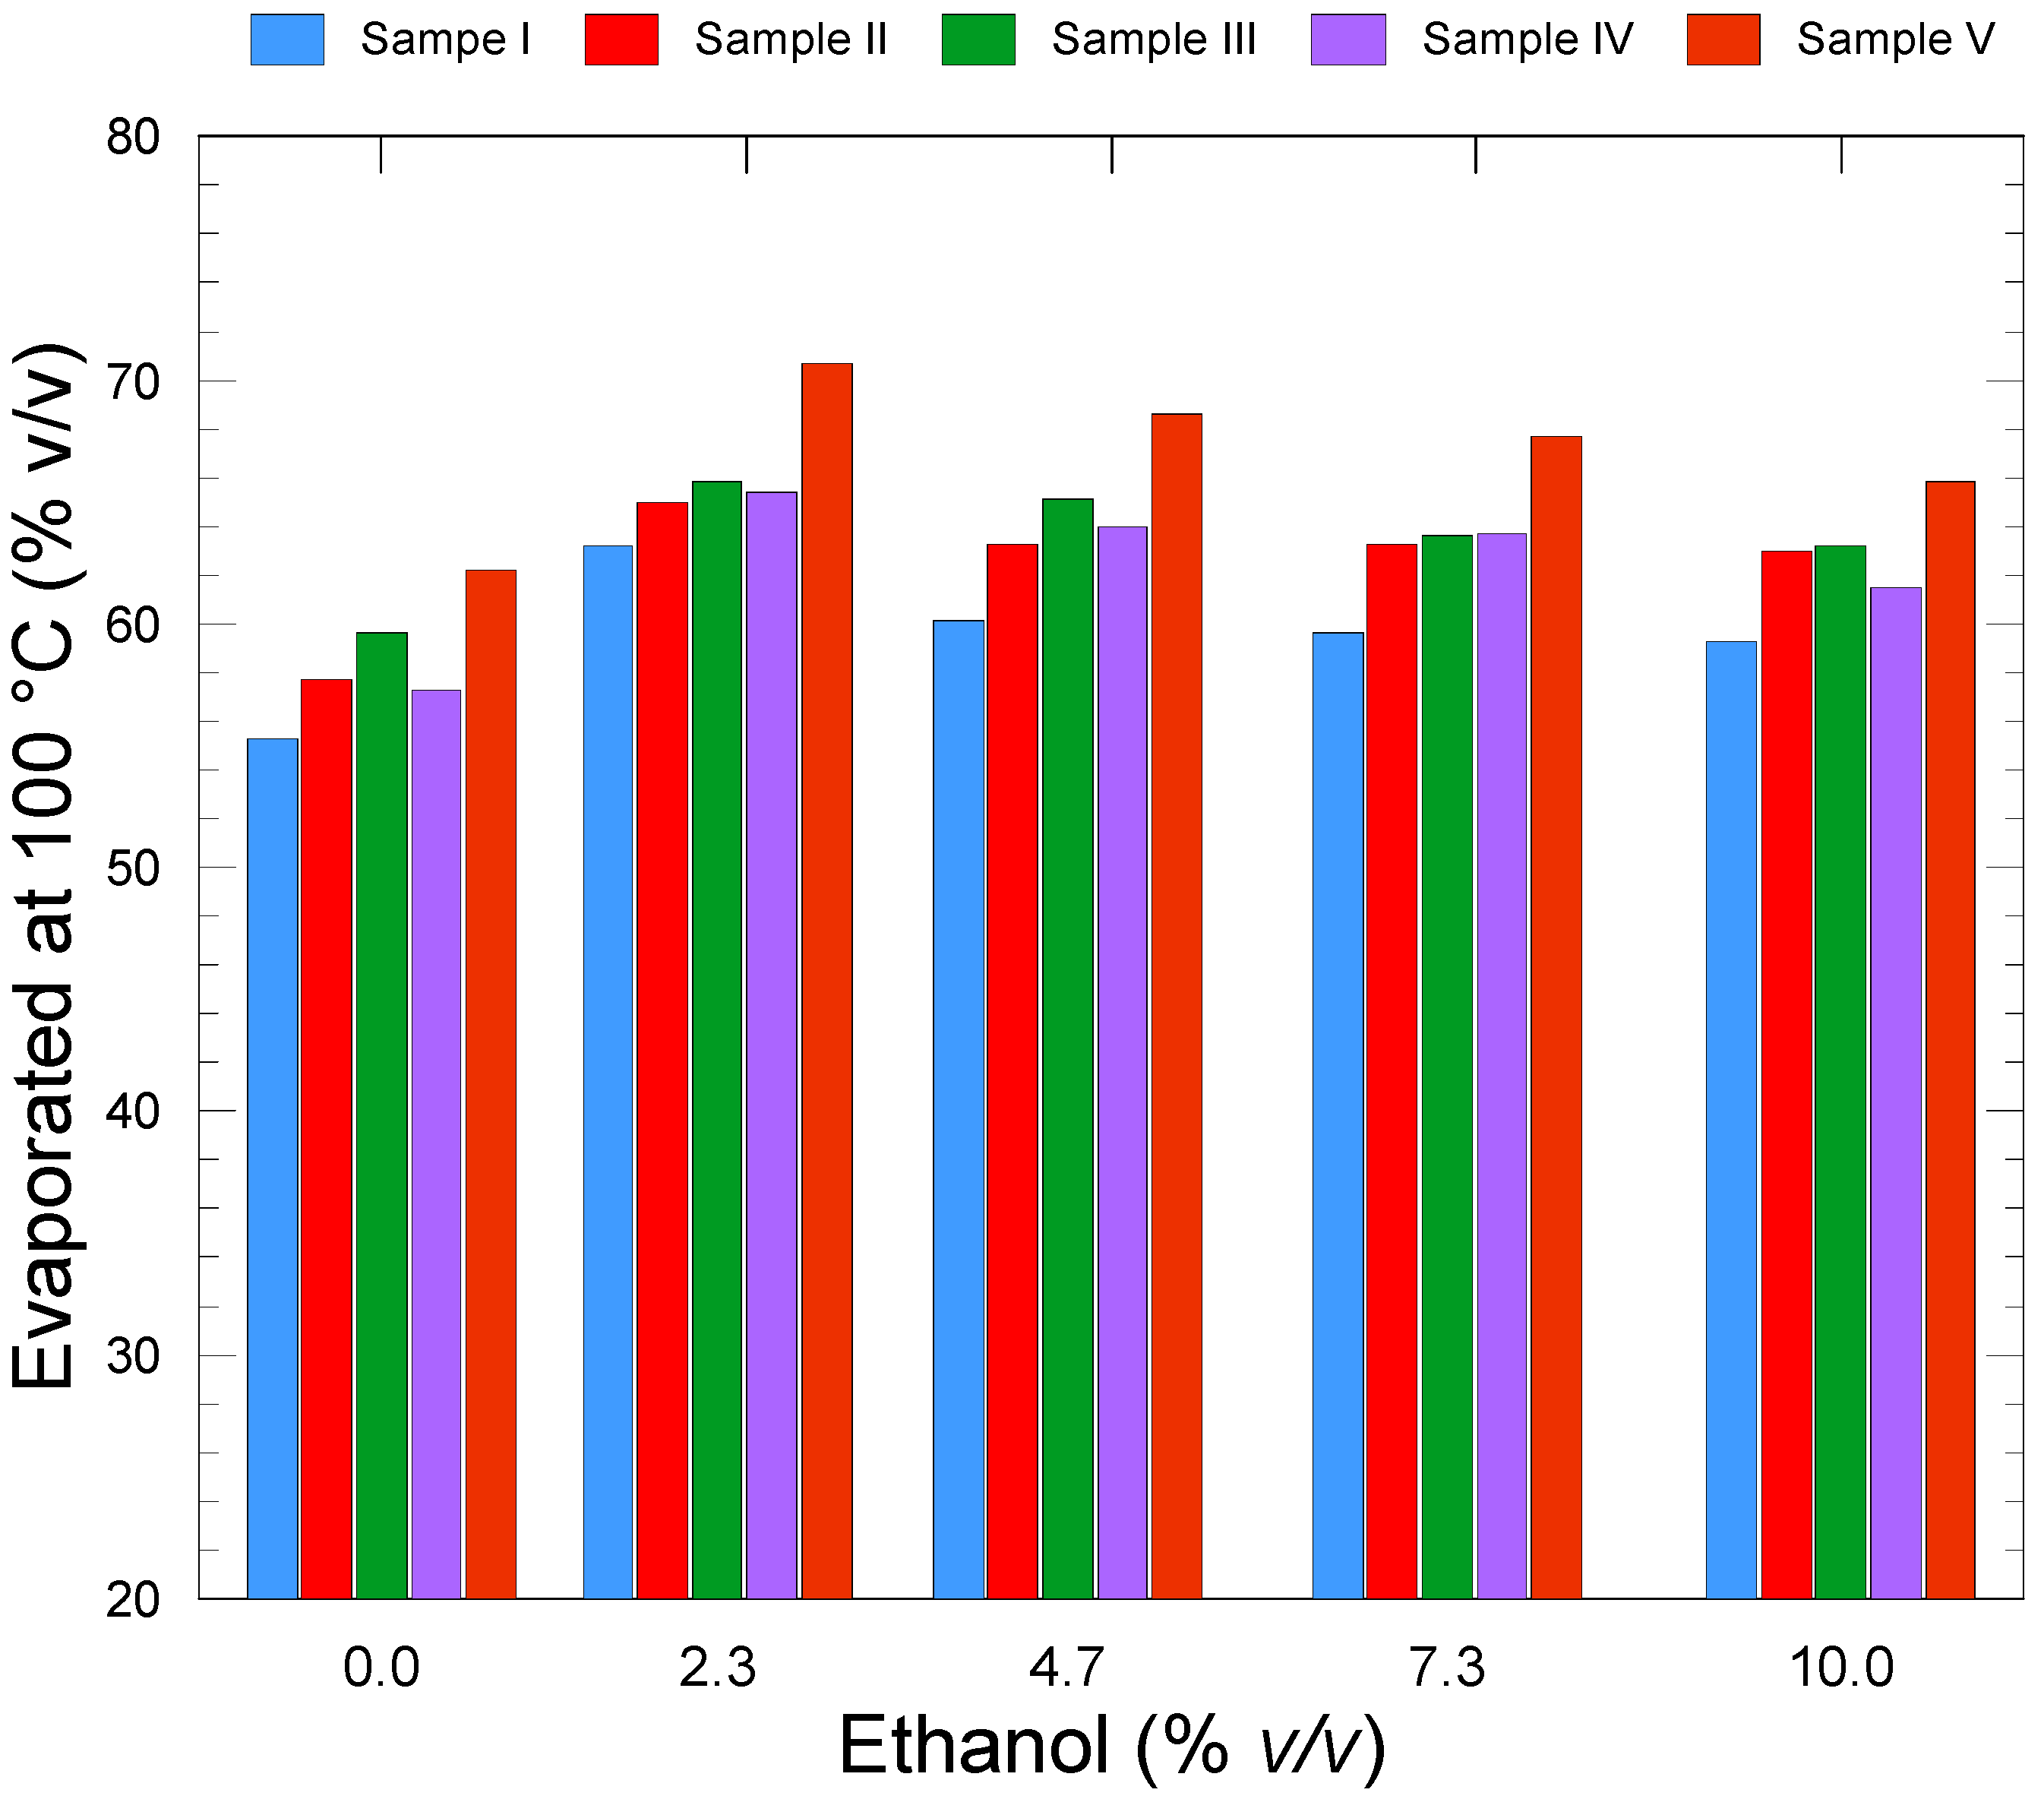
3.2. Distillation Measurements

EN ISO 3405 is the official method that is used to measure the distillation characteristics of petroleum products in the EU. The specification sets limits on distillation characteristics (percent evaporated at three temperatures 70 °C, 100 °C, and 150 °C, named E70, E100, and E150, respectively), final boiling point (FBP), distillation residue, and VLI through EN 228 standard. The standard also sets limits on other properties. The determination of the distillation characteristics at atmospheric pressure is the most common method that can be used to classify petroleum products into volatility classes. The boiling range of gasoline falls in the range 30–210 °C. Additionally, it should be mentioned that the boiling point of bio-ethanol and bio-ETBE are 78.4 °C and 73.0 °C, respectively. Blending all of the available refinery components can maintain a balance between the different volatility requirements [7,33].
There is a significant number of publications dealing with the impact of oxygenates on the front end and medium range of gasoline volatility [8,16,40]. Additionally, some publications have shown that with some oxygenates, the back-end volatility can be also affected [32,41]. The use of some less common oxygenates has been reported to increase the final boiling point of the distillation to 225 °C, setting the fuel out of the specification limits [9].
The distillation curves of the base fuels used for this set of experiments are shown in Figure 5.
The distillation characteristics of Samples I, II, III, IV, and V (the base fuels) are shown in Table 7. This table also includes the expanded uncertainties for the distillation characteristics of the automated distillation apparatus used for the measurements. The expanded uncertainty was estimated following ISO GUM principles and the ISO 4259 standard [31,32]. The low uncertainty of the distillation equipment allows us to observe differences in the distillation profiles when the blend composition changes.
All of the distillation characteristics for all of the base fuels comply with the required specification limits set by EN 228 and can be adopted for summer and winter grade gasoline in Greece (classes A and C/C1).
In Samples I, II, III, IV, and V, bio-ethanol was added in a concentration 10% v/v in order to examine the impact of the maximum addition of bio-ethanol on the distillation characteristics.
The addition of bio-ethanol in gasoline causes an increase in vapor pressure and depresses the boiling temperature. [6]
Figure 6 depicts the impact of the 10% v/v ethanol addition on the distillation characteristics for all of the base fuels.
As the bio-ethanol was added to the base fuels, the front-end volatility of the blend shifted to lower temperatures. The situation is similar for all of base fuels with a 10% v/v bio-ethanol content, as shown in Figure 6. This reduction in the front-end volatility values of the samples is caused by the formation of minimum temperature azeotropes between the ethanol and hydrocarbons of the fuel blends [12,16,26].
On the other hand, bio-ETBE and other ethers have no azeotropic effects on the distillation curve of gasoline. Therefore, ETBE is incorporated into gasoline in a smooth manner, similar to that of any other hydrocarbon that is able to boil in the same temperature range [20]. The addition of bio-ETBE in the base fuels were not so different that they set the distillation characteristics outside of specification limits. This effect is demonstrated in Figure 7, where the distillation curves of the base fuels and their blends with ETBE 20.8% v/v are depicted. Figure 7 shows that the front-end volatility has not been altered, whereas a slight shift to lower temperatures after the mid-range distillation is observed, similar to what has been shown in other publications [8,19].
The distillation characteristics E70 and E100 of Samples I, II, III, IV, and V, and bio-ethanol/ bio-ETBE blends are shown in Table 8 and Table 9. The values in Table 8 and Table 9 also include the expanded uncertainties for these parameters.
The E70 values are depicted in Figure 8 as a function of bio-ethanol content in the blend. As the expanded uncertainties shown in Table 7 have very small values, they are not presented in Figure 8, as they cannot be observed graphically.
The addition of the bio-ethanol and bio-ETBE affects the front end of the distillation curve due to the presence of bio-ethanol and also affects the middle area due to the presence of bio-ETBE. The five base fuels show that the distillation curve demonstrates similar behavior at the different concentrations of bio-ethanol and bio-ETBE.
At all of the oxygenate concentrations, Sample V shows a slightly higher E70 value than the other four base fuels. This is due to the composition of this base fuel. This base fuel has a high iso-paraffins content that mainly comprises five and six carbon atoms (high isomerate content), which have low boiling point temperatures.
Sample I has the lowest E70 value compared to the other base fuels. Sample I contains a higher reformate content, which mostly consists of aromatic compounds, which evaporate at higher temperatures compared to iso-paraffins and olefins of the same carbon number.
All of the E100 values are within the specification limits. According to EN 228, the E100 limits are 46–72% v/v. When the bio-ETBE content is high in Sample V, the E100 value is close to the upper limit according EN 228 (70.8 v/v). The E100 values are shown in Figure 9.
Similar to E70, the expanded uncertainties are not depicted in Figure 9 because their calculated values are too low.
It can be observed that the changes in E100 are very small for all of the blends with the oxygenates. It seems that the relatively different composition of the base fuels regarding olefin, aromatic, and iso-paraffin content does not significantly affect the change of the E100 value due to the addition of oxygenates to the base fuel.
As it can be seen from Table 8 and Figure 9, the value of E100 is more affected by the addition of bio-ETBE than the addition of bio-ethanol. This was also depicted from the distillation curves in Figure 6 and Figure 7.
The E150 values are shown in Table 10, and the final boiling point (FBP) temperatures are shown in Table 11. The expanded uncertainties are also shown in Table 10 and Table 11 as they were calculated for these two parameters. The expanded uncertainties have very small values, similar to the values for E70 and E100.
The E150 values are shown graphically in Figure 10. As it can be seen in Table 10 and in Figure 10, there is a very small statistically significant change regarding E150 when comparing the distillation characteristics of the base fuels and blends containing bio-ethanol and bio-ETBE.
Due to their very low values (shown in Table 10), the expanded uncertainties are not depicted in Figure 10.
The final boiling point (FBP) is depicted in Figure 11 as a function of the bio-ethanol content. As it can be seen in Table 10, there is no statistically significant change (reproducibility 6.78) regarding FBP when comparing the distillation characteristics of the base fuels and blends containing bio-ethanol and bio-ETBE.
The very small values of the expanded uncertainties, as they are shown in Table 11, support the observation of no statistically significant changes occurring in the FBP values due to the addition of the oxygenates.
All of the results from these measurements show that the distillation characteristics were consistent with the requirements set by the EN 228 Standard.

3.3. Vapor Lock Index (VLI)

After the measurements of the vapor pressure and the distillation characteristics in all of the samples were calculated according to the EN 13016-1 and EN ISO 3405 methods outlined in, VLI was calculated, and the results are shown in Table 12.
The VLI values are depicted in Figure 12. The VLI is lower than the upper limit of the EN 228 standard for the C1 class, which is 1064. It should be mentioned that there is no limit for class A that covers the summer-grade gasoline; this is also the case for class C (winter grade gasoline), as VLI is used to characterize the volatility in the transition period between the summer grade and the winter grade [4].
Τhe VLI has a maximum value when the bio-ethanol concentration is 10% and when bio-ETBE has not been added. As the bio-ETBE content increases, the VLI is reduced [37].

4. Conclusions

In this study, the effect of the addition of bio-ethanol/bio-ETBE in five base fuels was examined. The addition of bio-ethanol into gasoline affects its properties and mainly increases its the vapor pressure. In countries such as Greece, where temperatures can become quite high during the summer period, gasoline with a high vapor pressure becomes unsuitable for use in that specific time period. Therefore, the simultaneous addition of bio-ethanol and bio-ETBE reduces the vapor pressure, and the fuels become suitable for use in the summer period.
In each of the five base fuels that were used in this study, all of which were prepared by blending reformate, alkylate, isomerate, dimate, and FCC in different percentages, bio-ethanol and bio-ETBE were added in different percentages. All of the blends that were prepared contained an oxygen content that was in accordance with the maximum limit set by the EU specifications (3.7% m/m). In the ternary gasoline/bio-ethanol/bio-ETBE blends, the blending strategy was to have 25%, 50%, and 75% of the oxygen content in the final blend come from bio-ethanol and to have the rest come from oxygen (75%, 50%, and 25%, respectively, from bio-ETBE. The main results of this research can be summarized as follows:
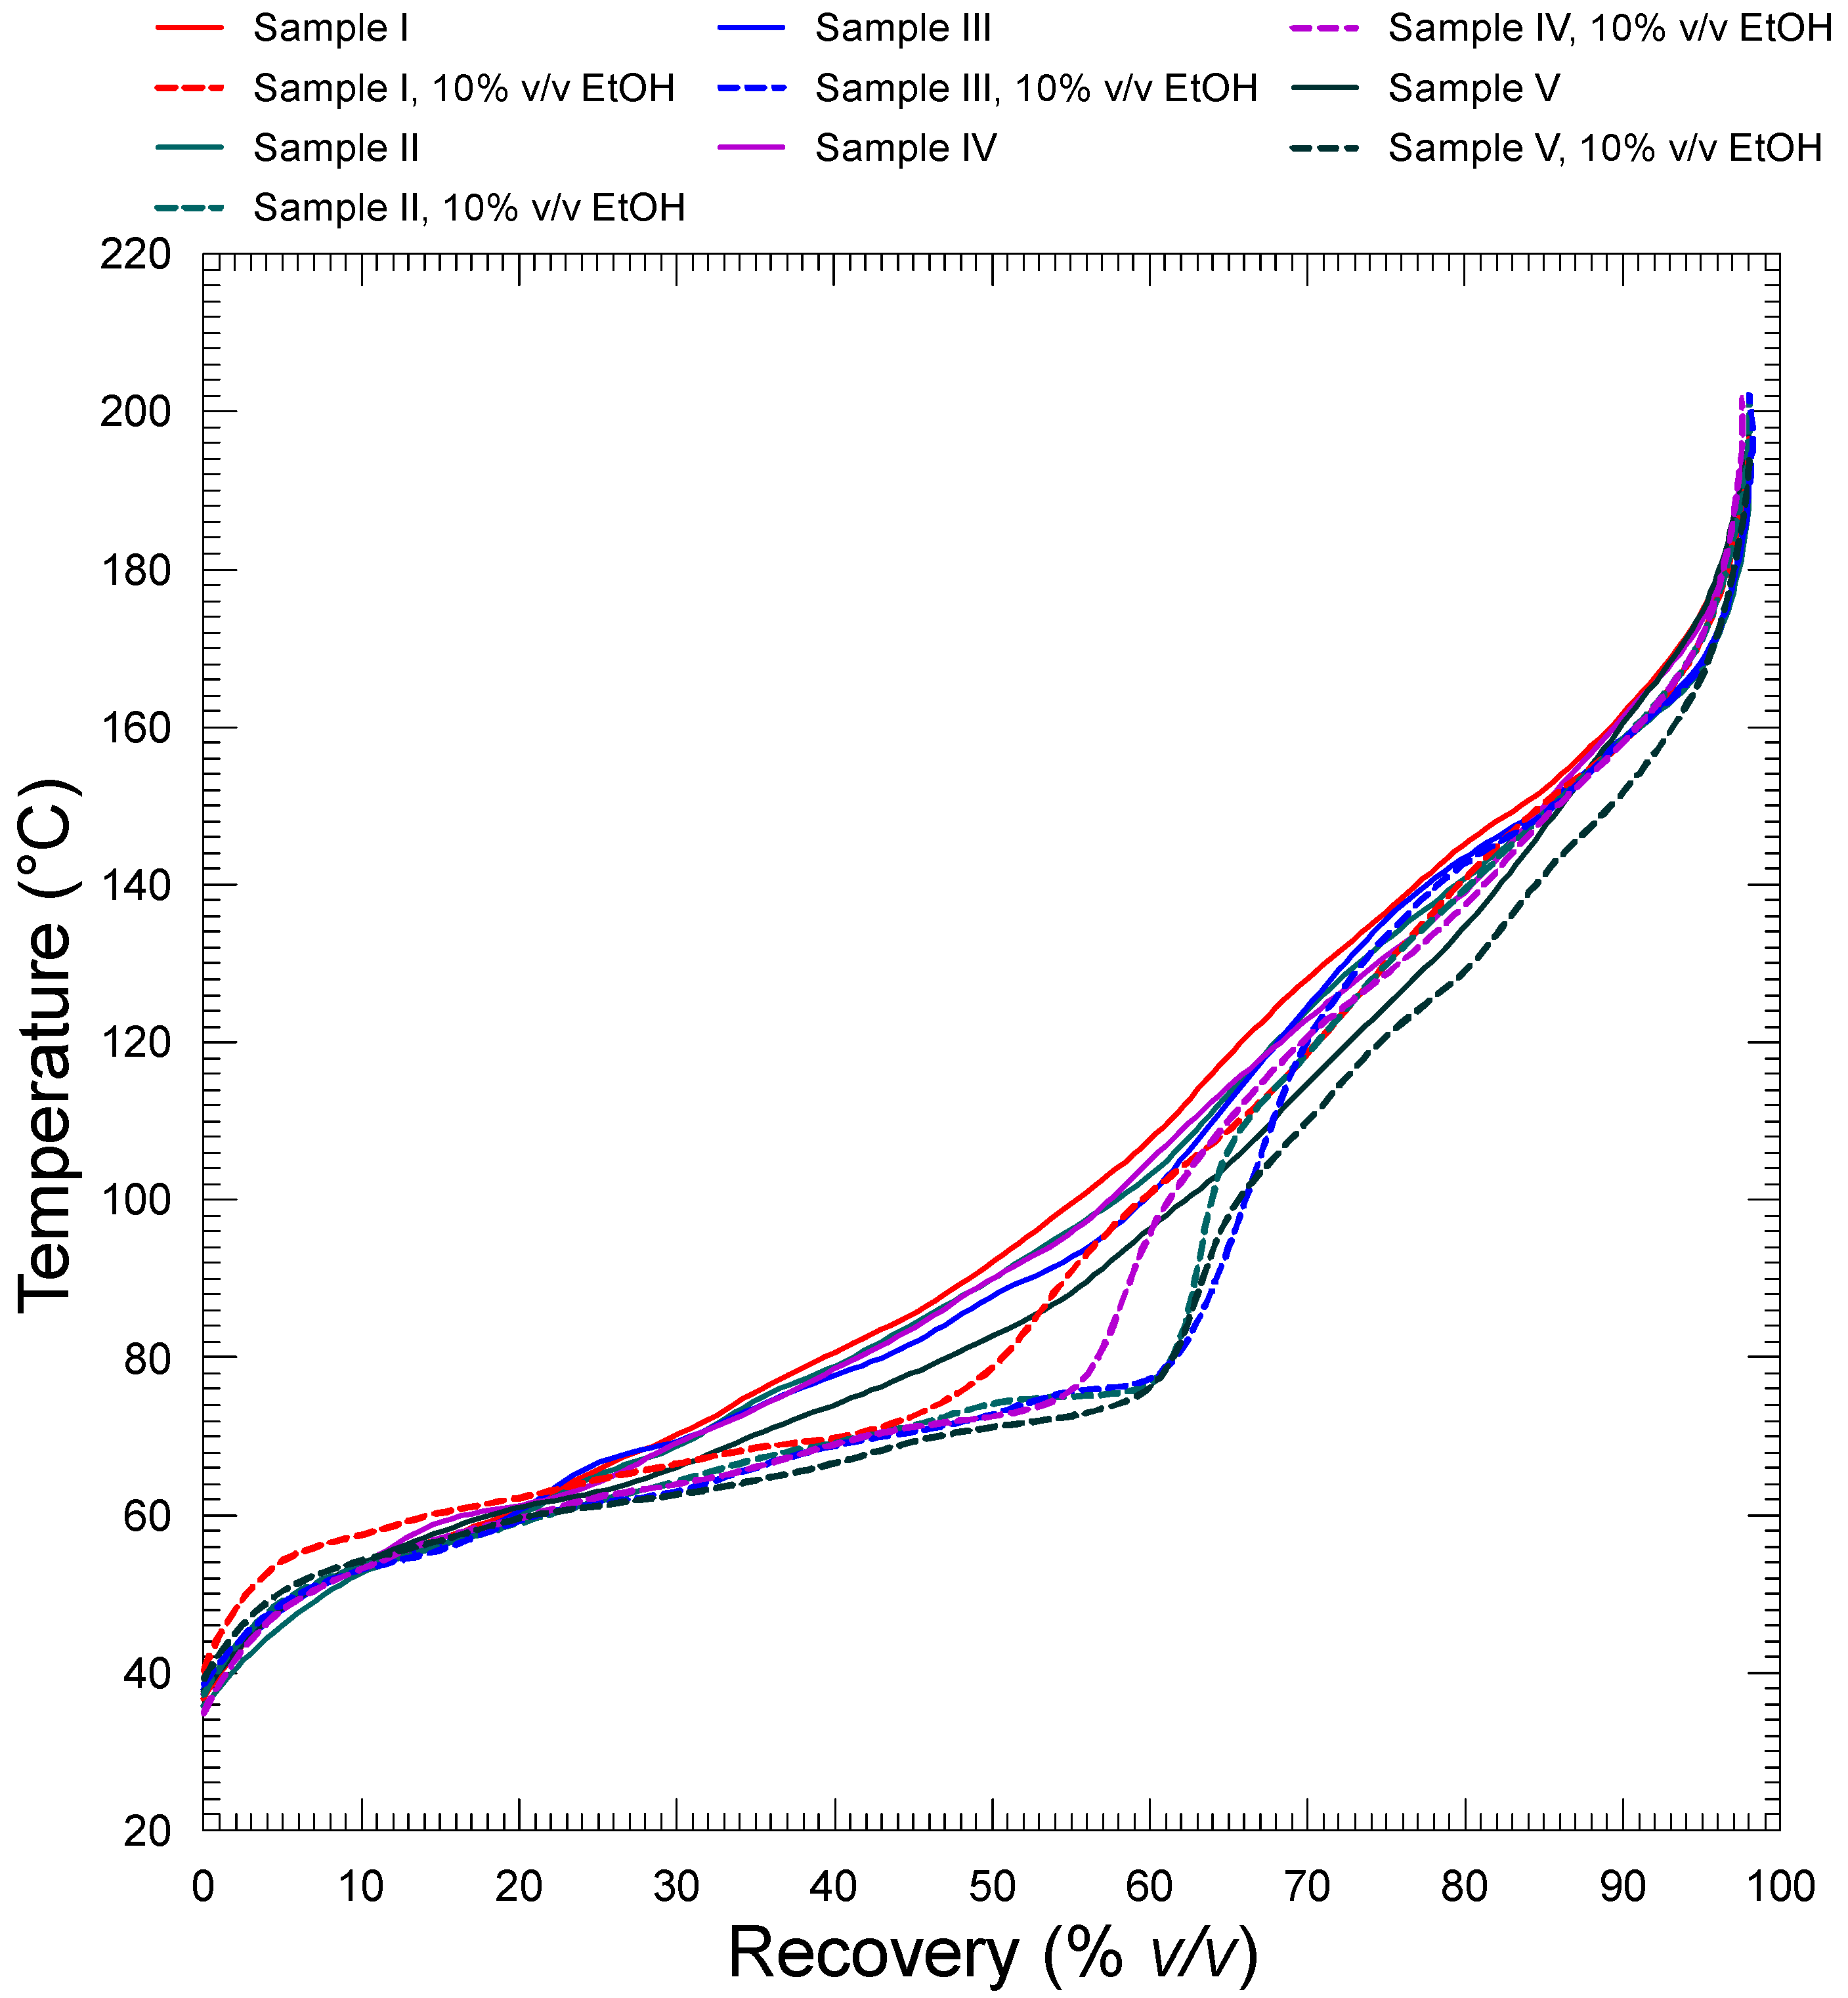
  • In the base fuels to which only bio-ethanol had been added to the maximum allowable content (10% v/v), the vapor pressure was higher than the value of the specifications for “summer” gasoline.
  • The addition of bio-ethanol/bio-ETBE set all of the samples within the EN 228 specification limits.
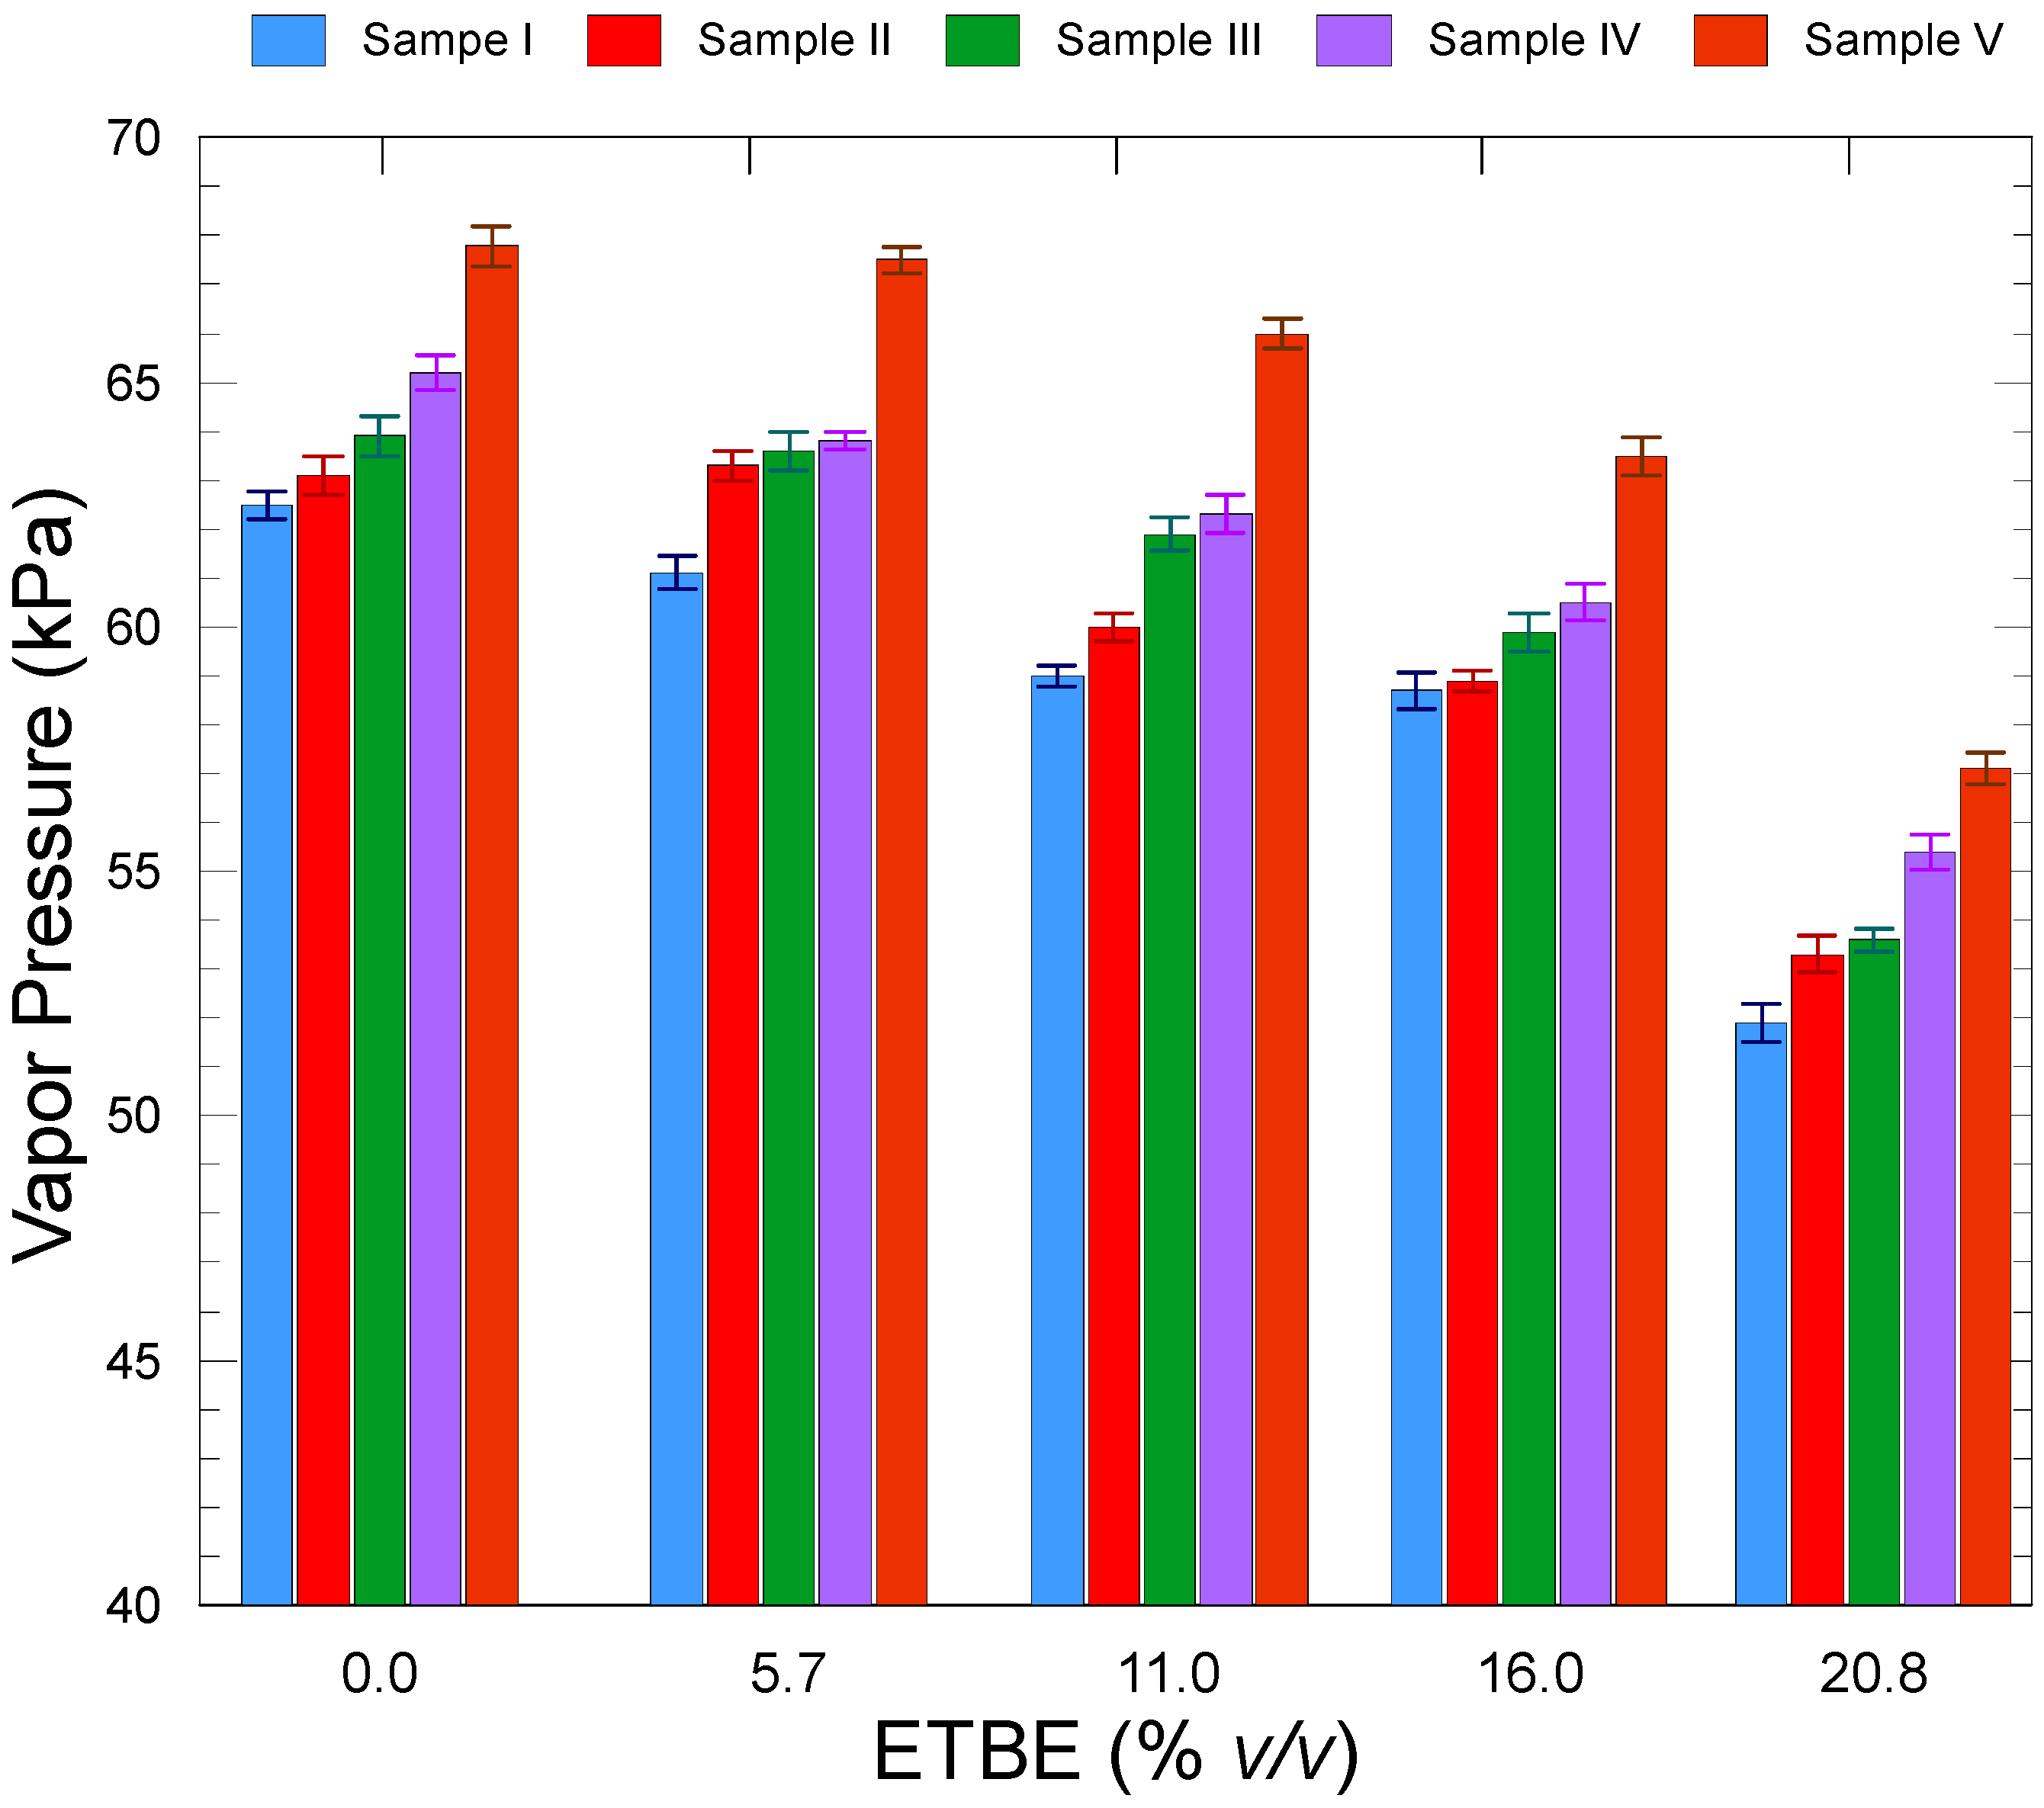
  • The vapor pressure values of the samples with both bio-ethanol and bio-ETBE were between the vapor pressure of the samples to which only bio-ethanol or bio-ETBE had been added. The change in the vapor pressure was similar for all samples.
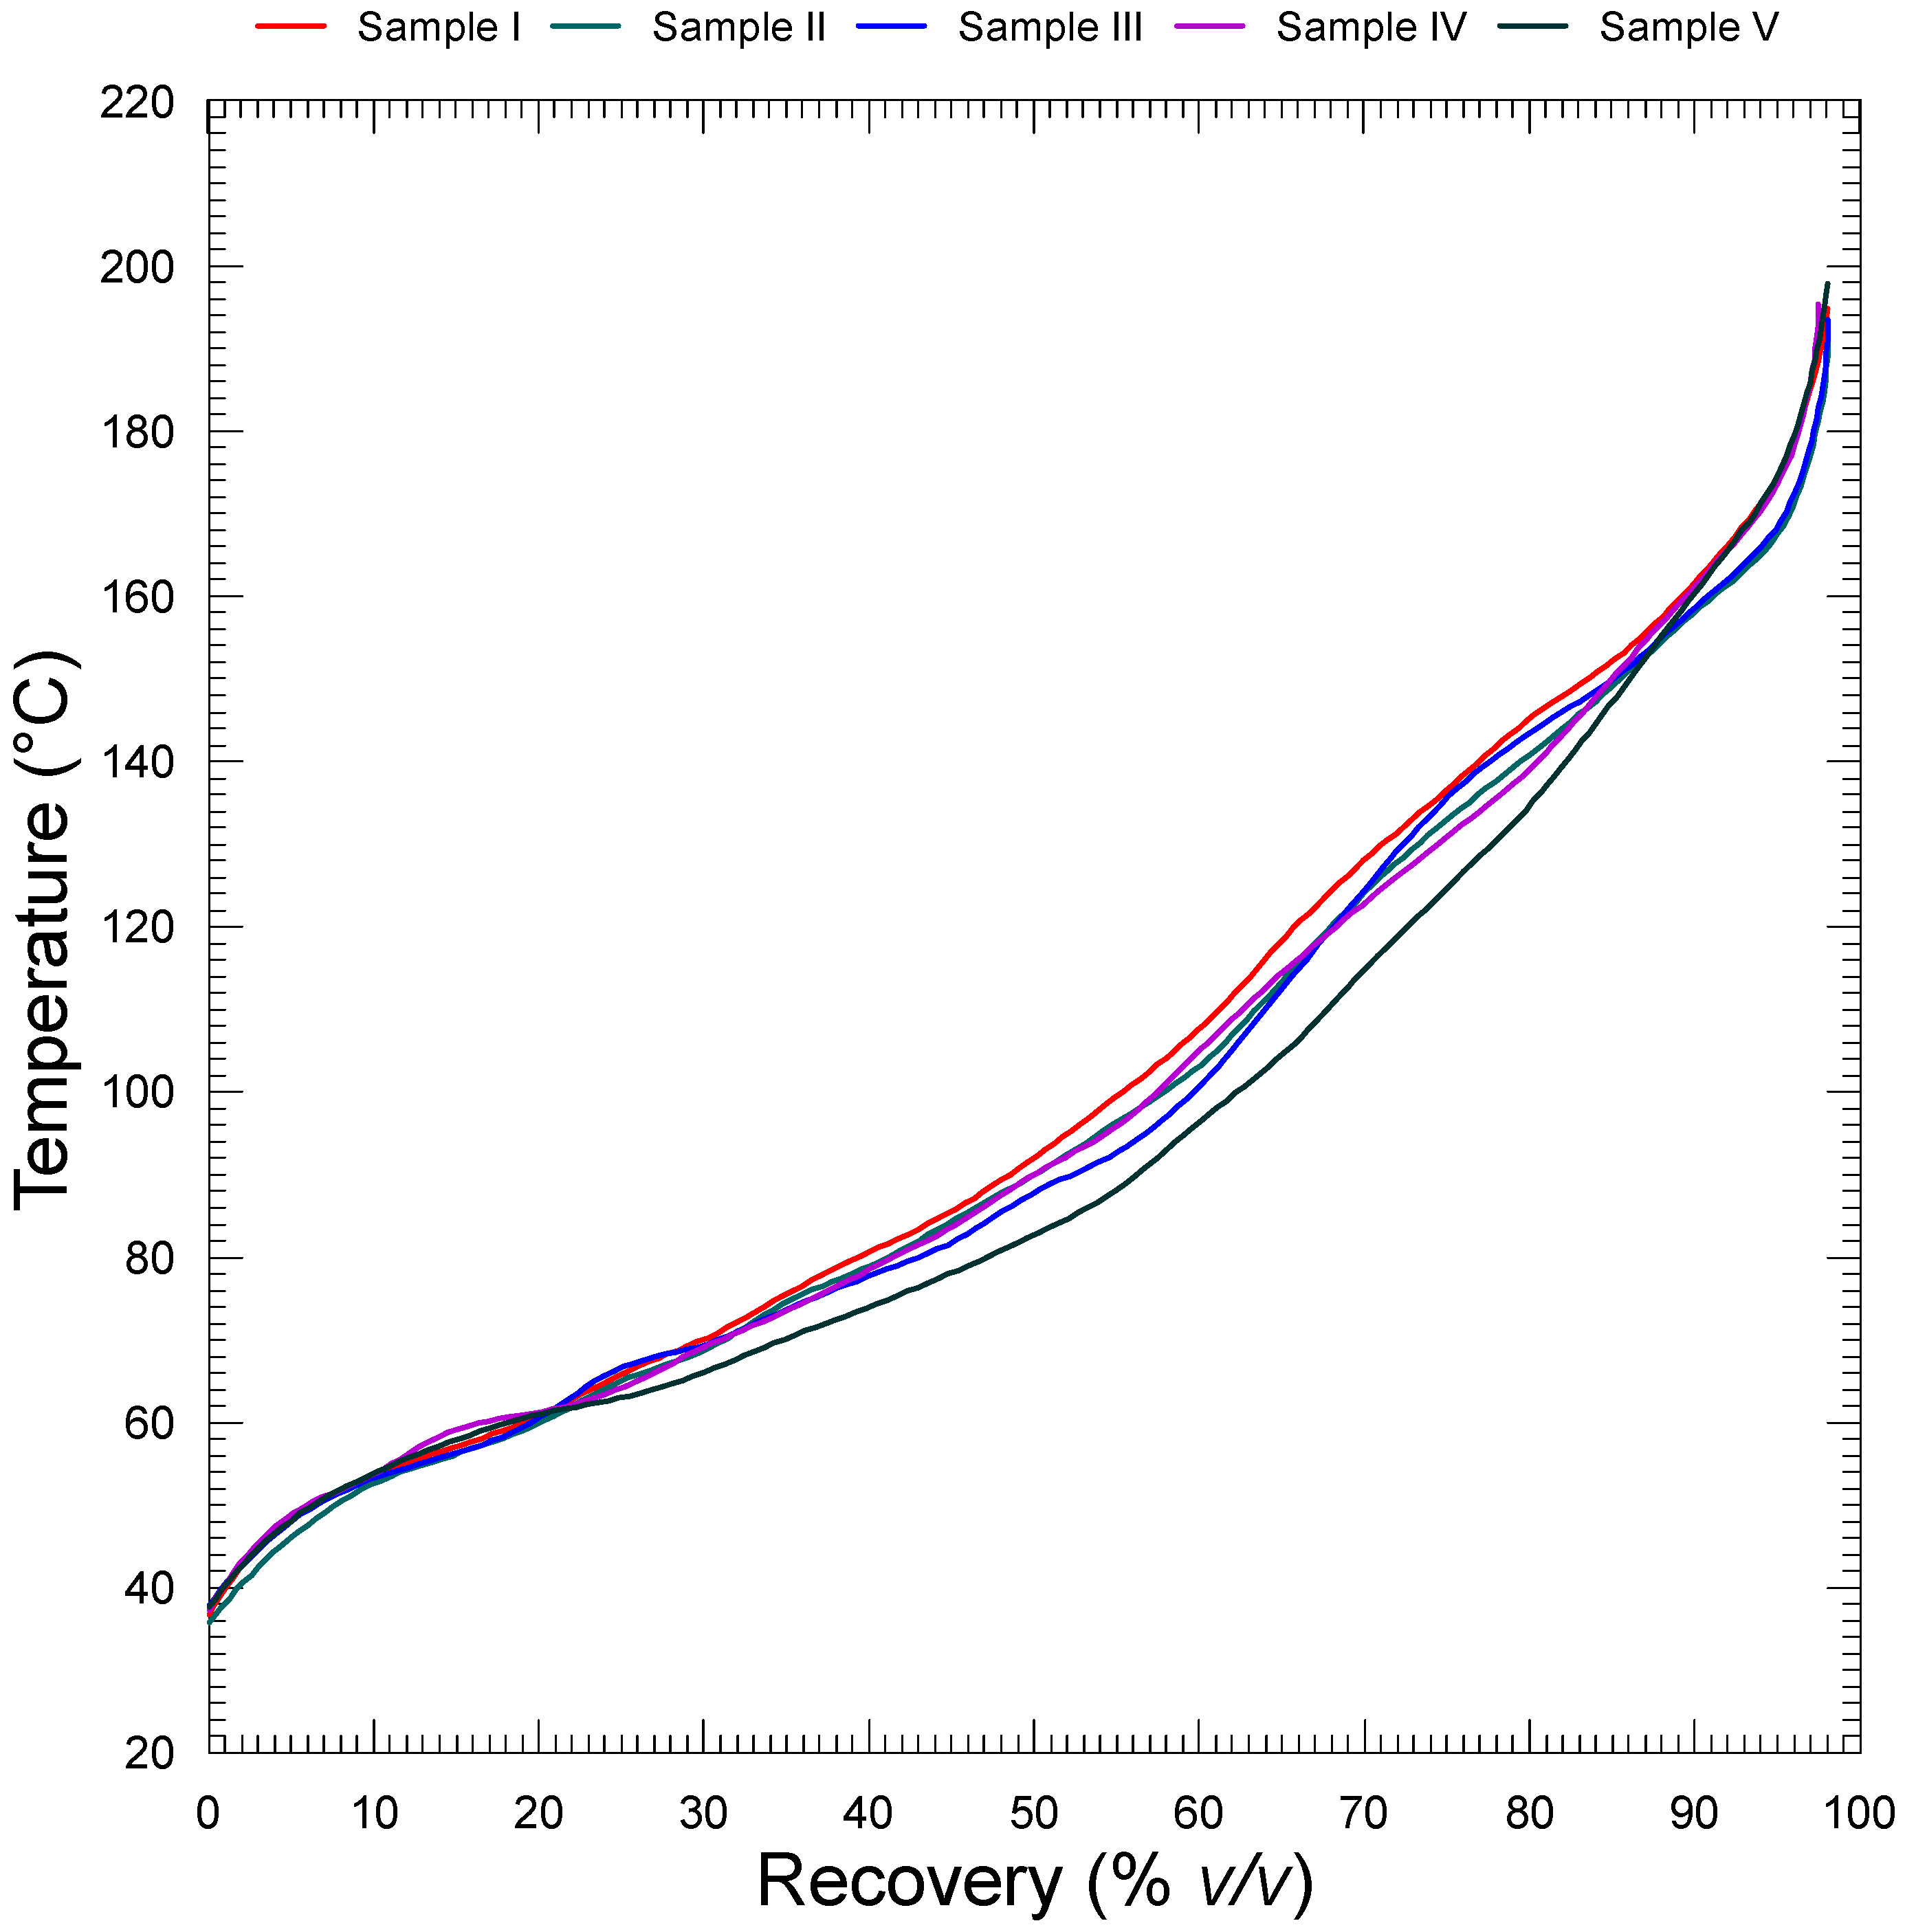
  • The five base fuels showed similar changes of their distillation characteristics for the same level of bio-ethanol and bio-ETBE in the blend.
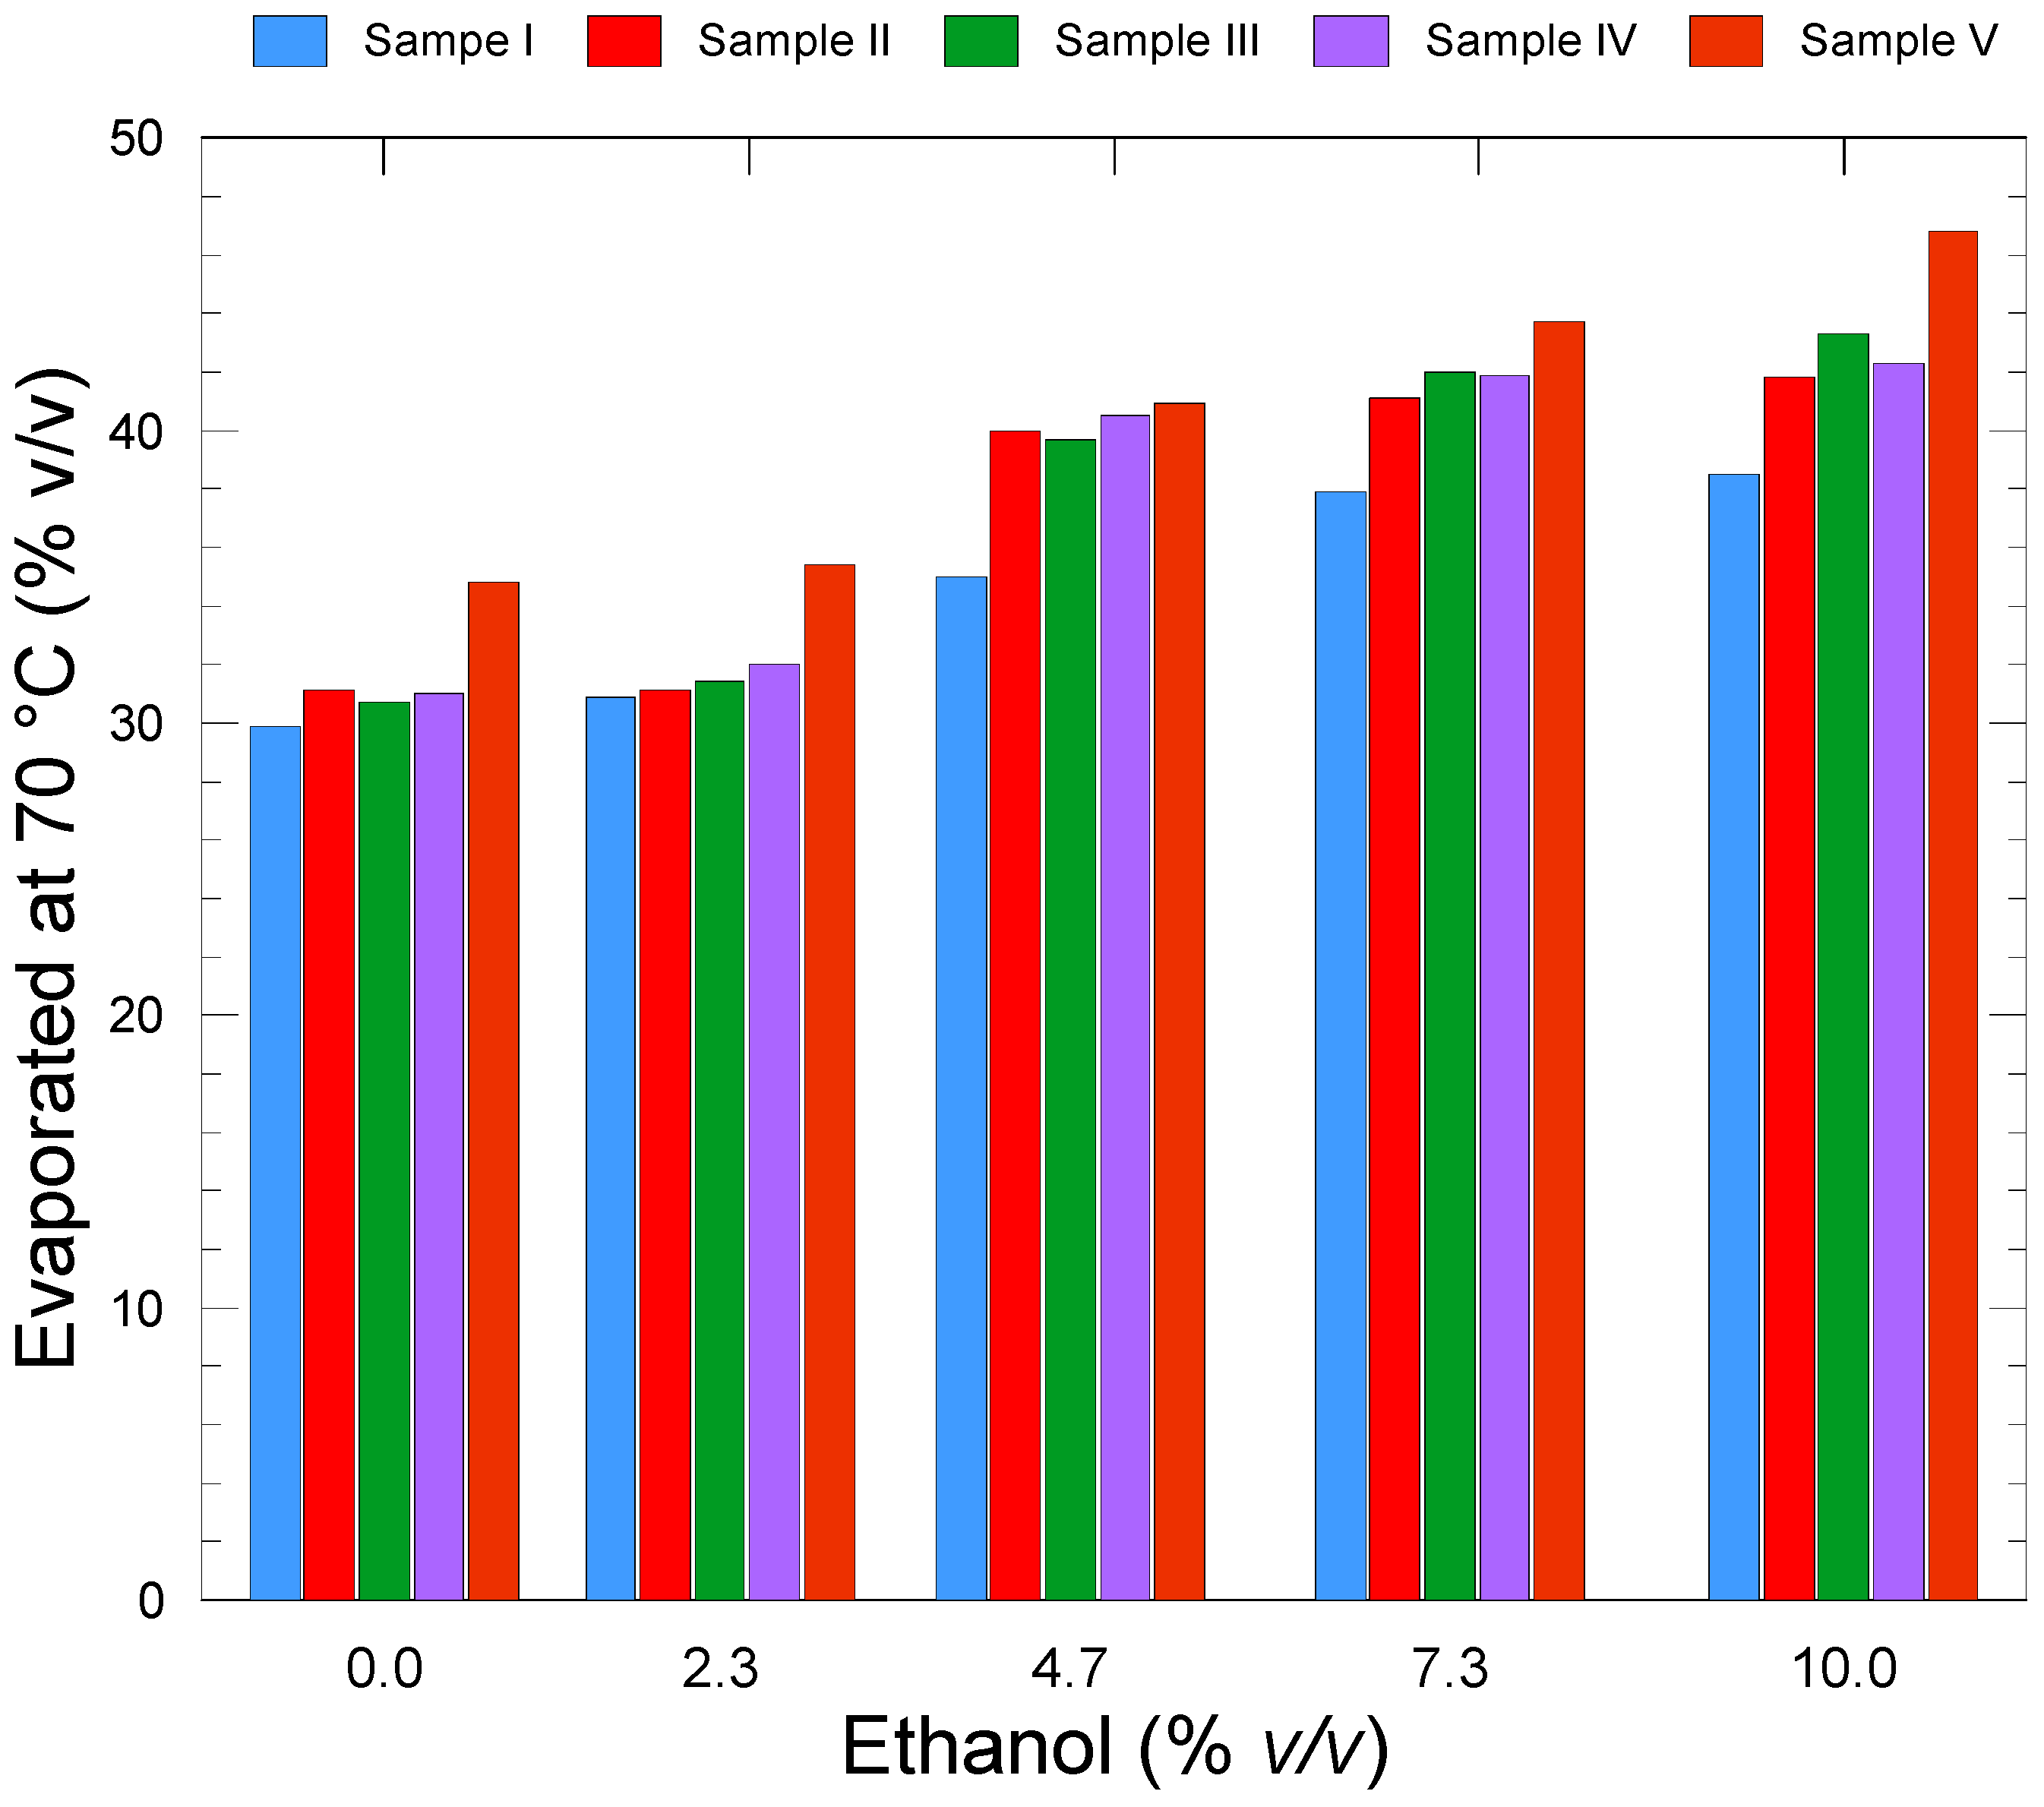
  • As for the vapor pressure value and distillation characteristics (E70 and E100), Sample V (with increased C5 and C6 iso-paraffins) showed higher values than the other four base fuels at all oxygenate contents.
  • Sample I shows the lowest vapor pressure as well as the lowest E70 and E100 values in all of the cases where bio-ethanol/bio-ETBE was added in different concentrations. The high content of aromatic hydrocarbons, most of which had seven or eight carbon atoms, and the low percentage of volatile iso-paraffins justify the low volatility characteristics seen for Sample I.
  • As for the VLI, this was lower than the upper limit for gasoline class C1 according to the EN 228 standard. The VLI achieved its maximum value when the bio-ethanol concentration was 10% v/v and when the bio-ETBE had not been added. As the bio-ETBE content increases, the VLI is reduced.
In conclusion, the simultaneous addition of bio-ethanol and bio-ETBE in the percentages under consideration produces blends within the volatility specifications based on EN 228.

Author Contributions

Conceptualization, D.K.; methodology, M.K. and Y.Z.; experimental work, D.-P.M.; data analysis, M.K. and Y.Z.; writing—original draft preparation, M.K. and Y.Z.; writing—review and editing, D.K.; supervision, D.K. All authors have read and agreed to the published version of the manuscript.

Funding

This work was funded by the project “Development of the Research Infrastructure “Centre of Excellence for Future Vehicle Environmental Performance”-Fuvep” (MIS 5002370), which is implemented under the Action “Reinforcement of the Research and Innovation Infrastructure”, funded by the Operational Programme “Competitiveness, Entrepreneurship and Innovation” (NSRF 2014–2020), and co-financed by Greece and the European Union (European Regional Development Fund).

Institutional Review Board Statement

Not applicable.

Informed Consent Statement

Not applicable.

Data Availability Statement

Not applicable.

Acknowledgments

The authors would like to acknowledge that this work received support from the project “Development of the Research Infrastructure “Centre of Excellence for Future Vehicle Environmental Performance”-FuVEP” (MIS 5002370), which is implemented under the Action “Reinforcement of the Research and Innovation Infrastructure”, funded by the Operational Programme “Competitiveness, Entrepreneurship and Innovation” (NSRF 2014–2020), and co-financed by Greece and the European Union (European Regional Development Fund).

Conflicts of Interest

The authors declare no conflict of interest.

Abbreviations

DVPEdry vapor pressure equivalent
E70evaporated at 70 °C
E100evaporated at 100 °C
E150evaporated at 150 °C
ENEuropean norm
ETBEethyl tert butyl ether
EUEuropean Union
FBPfinal boiling point
FCCfluid catalytic cracking
GHGgreenhouse gases
IBPinitial boiling point
MONmotor octane number
RONresearch octane number
VLIvapor lock index

References

  1. European Union. Directive 2015/1513 of the European parliament and of the Council of 9 September 2015 amending directive 98/70/EC relating to the quality of petrol and diesel fuels and amending directive 2009/28/EC on the promotion of the use of energy from renewable sources, L 239/1 EN. Off. J. Eur. Union. 2015, 58, 1–29. Available online: https://eur-lex.europa.eu/legal-content/EN/TXT/?uri=celex%3A32015L1513 (accessed on 26 September 2021).
  2. European Union. Directive 2009/28/EC of the European Parliament and of The Council of 23 April 2009 on the promotion of the use of energy from renewable sources and amending and subsequently repealing Directives 2001/77/EC and 2003/30/EC, L 140/16 EN. Off. J. Eur. Union. 2009, 5, 16–62. Available online: https://eur-lex.europa.eu/legal-content/EN/ALL/?uri=celex%3A32009L0028 (accessed on 13 September 2021).
  3. European Union. Directive 2009/30/EC of the European Parliament and of The Council of 23 April 2009 amending Directive 98/70/EC as regards the specification of petrol, diesel and gas–oil and introducing a mechanism to monitor and reduce greenhouse s emissions and amending Council Directive 1999/32/EC as regards the specification of fuel used by inland waterway vessels and repealing Directive 93/12/EEC, L 140/88 EN. Off. J. Eur. Union 2009, 52, 88–113. Available online: https://eur-lex.europa.eu/legal-content/EN/TXT/?uri=celex%3A32009L0030 (accessed on 15 September 2021).
  4. EN 228:2012+A1:2017 Automotive Fuels—Unleaded Petrol—Requirements and Test Methods; Irish Standard: Dublin, Ireland, 2017.
  5. EN 590:2013+A1:2017 Automotive Fuels—Diesel—Requirements and Test Methods; Slovakia Standard: Bratislava, Slovakia, 2017.
  6. Rodríguez-Antón, L.M.; Hernández-Campos, M.; Sanz-Pérez, F. Experimental determination of some physical properties of gasoline, ethanol and ETBE blends. Fuel 2013, 112, 178–184. [Google Scholar] [CrossRef]
  7. Weber de Menezes, E.; Cataluña, R.; Samios, D.; Da Silva, R. Addition of an azeotropic ETBE/ethanol mixture in eurosupertype gasolines. Fuel 2006, 85, 2567–2577. [Google Scholar] [CrossRef]
  8. Karonis, D.; Anastopoulos, G.; Lois, E.; Stournas, S. Impact of simultaneous ETBE and ethanol addition on motor gasoline properties. SAE Int. J. Fuels Lubr. 2009, 1, 1584–1594. [Google Scholar] [CrossRef]
  9. AlRamadan, A.S.; Sarathy, S.M.; Badra, J. Unraveling the octane response of gasoline/ethanol blends: Paving the way to formulating gasoline surrogates. Fuel 2021, 299, 120882. [Google Scholar] [CrossRef]
  10. Magnusson, R.; Nilsson, C. The influence of oxygenated fuels on emissions of aldehydes and ketones from a two-stroke spark ignition engine. Fuel 2011, 90, 1145–1154. [Google Scholar] [CrossRef]
  11. Yücesu, S.H.; Topgül, T.; Çinar, C.; Okur, M. Effect of ethanol–gasoline blends on engine performance and exhaust emissions in different compression ratios. Appl. Therm. Eng. 2006, 26, 2272–2278. [Google Scholar] [CrossRef]
  12. CONCAWE. Gasoline Volatility and Vehicle Performance. CONCAWE Review; Report No. 2/12, February 2012. Available online: https://www.concawe.eu/wp-content/uploads/2017/01/rpt_12-2-2012-00657-01-e.pdf (accessed on 15 July 2021).
  13. EN 228:2008 Automotive Fuels—Unleaded Petrol—Requirements and Test Methods; Slovakia Standard: Bratislava, Slovakia, 2008.
  14. Myung, C.L.; Choi, K.; Cho, J.; Kim, K.; Baek, S.; Lim, Y.; Park, S. Valuation of regulated, particulate, and BTEX emissions inventories from a gasoline direct injection passenger car with various ethanol blended fuels under urban and rural driving cycles in Korea. Fuel 2020, 262, 116406. [Google Scholar] [CrossRef]
  15. Zhang, M.; Ge, Y.; Wang, X.; Thomas, D.; Su, S.; Hu, L. An assessment of how bio-E10 will impact the vehicle-related ozone contamination in China. Energy Rep. 2020, 6, 572–581. [Google Scholar] [CrossRef]
  16. CONCAWE. Volatility and Vehicle Drivability Performance of Ethanol/Gasoline Blends. CONCAWE Review; Report No. 8/09, October 2009. Available online: https://www.concawe.eu/wp-content/uploads/2017/01/rpt_09-8-2009-05087-01-e.pdf (accessed on 20 July 2021).
  17. Anderson, V.F.; Anderson, J.E.; Wallington, T.J.; Mueller, S.A.; Nielsen, O.J. Distillation Curves for Alcohol−Gasoline Blends. Energy Fuels 2010, 24, 2683–2691. [Google Scholar] [CrossRef]
  18. Hirshfeld, D.S.; Kolb, J.A.; Anderson, J.E.; Iqbal, A.; Moore, M.E.; Studzinski, W.M.; Sutherland, I. Refining Economics of Higher Octane Sensitivity, Research Octane Number and Ethanol Content for U.S. Gasoline. Energy Fuels 2021, 35, 14816–14827. [Google Scholar] [CrossRef]
  19. ETBE Technical Product Bulletin. European Fuel Oxygenates Association. ETBE Technical Product Bulletin. June 2006. Available online: https://www.petrochemistry.eu/wp-content/uploads/2018/01/ETBE-Product-Bulletin-Jun-2006.pdf (accessed on 15 June 2021).
  20. Petre, M.; Rosca, P.; Dragomir, R.E. The effect of bio-ethers on the volatility properties of oxygenated gasoline. Rev. Chim. 2011, 62, 567–574. Available online: https://www.revistadechimie.ro/Articles.asp?ID=2987 (accessed on 15 June 2021).
  21. Dubois, T.; Abiad, L.; Caine, P. Investigating the Impact of Ethanol on the Lubricity of Gasoline and on the Lubricity Improvers Efficiency. In SAE Technical Paper Series; SAE International: Warrendale, PA, USA, 2017; Volume 1. [Google Scholar] [CrossRef]
  22. Khuong, L.S.; Masjuki, H.H.; Zulkifli, N.W.M.; Mohamad, E.N.; Kalam, M.A.; Alabdulkarem, A.; Arslan, A.; Mosarof, M.H.; Syahir, A.Z.; Jamshaid, M. Effect of gasoline–bioethanol blends on the properties and lubrication characteristics of commercial engine oil. RSC Adv. 2017, 7, 15005–15019. [Google Scholar] [CrossRef] [Green Version]
  23. ACEA. ACEA E10 Compatibility List. ACEA, August 2018. Available online: https://www.acea.auto/files/ACEA_E10_compatibility.pdf (accessed on 26 July 2021).
  24. Iodice, P.; Senatore, A.; Langella, G.; Amoresano, A. Advantages of ethanol-gasoline blends as fuel substitute for last generation Si engines. Environ. Prog. Sustain. Energy 2017, 36, 1173–1179. [Google Scholar] [CrossRef]
  25. Iodice, P.; Cardone, M. Ethanol/Gasoline Blends as Alternative Fuel in Last Generation Spark-Ignition Engines: A Review on CO and HC Engine Out Emissions. Energies 2021, 14, 4034. [Google Scholar] [CrossRef]
  26. Dalli, D.; Lois, E.; Karonis, D. Vapor Pressure and Octane Numbers of Ternary Gasoline–Ethanol–ETBE Blends. J. Energy Eng. 2014, 140, A4014002. [Google Scholar] [CrossRef]
  27. EN 15376:2014 Automotive Fuels—Ethanol as a Blending Component for Petrol—Requirements and Test Methods; Slovakia Standard: Bratislava, Slovakia, 2014.
  28. EN 13016-1:2018 Liquid Petroleum Products—Vapour Pressure—Part 1: Determination of Air Saturated Vapour Pressure (ASVP) and Calculated Dry Vapour Pressure Equivalent (DVPE); Slovakia Standard: Bratislava, Slovakia, 2018.
  29. ISO. EN ISO 3405:2019 Petroleum and Related Products from Natural or Synthetic Sources—Determination of Distillation Characteristics at Atmospheric Pressure; Slovakia Standard: Bratislava, Slovakia, 2019. [Google Scholar]
  30. ISO. ISO 4259:2017 Petroleum Products—Determination and Application of Precision Data in Relation to Methods of Test; ISO: Geneva Switzerland, 2017. [Google Scholar]
  31. ISO/IEC. BIMP-ISO/IEC Guide 98-3:2008 Uncertainty of Measurement—Part 3: Guide to the Expression of Uncertainty in Measurement (GUM: 1995); ISO/IEC: Geneva, Switzerland, 2008; Available online: http://www.bipm.org/utils/common/documents/jcgm/JCGM_100_2008_E.pdf (accessed on 28 June 2021).
  32. Da Silva, R.; Cataluna, R.; Weber de Menezes, E.; Samios, D.; Clarisse, M.; Piatnicki, S. Effect of additives on the antiknock properties and Reid vapor pressure of gasoline. Fuel 2005, 84, 951–959. [Google Scholar] [CrossRef]
  33. Mužíková, Z.; Pospíšil, M.; Šebor, G. Volatility and phase stability of petrol blends with ethanol. Fuel 2009, 88, 1351–1356. [Google Scholar] [CrossRef]
  34. Pumphrey, J.A.; Brand, J.I.; Scheller, W.A. Vapour pressure measurements and predictions for alcohol–gasoline blends. Fuel 2000, 79, 1405–1411. [Google Scholar] [CrossRef]
  35. Gaspar, D.J.; Phillips, S.D.; Polikarpov, E.; Albrecht, K.O.; Jones, S.B.; George, A.; Lander, A.; Santos, D.M.; Howe, D.T.; Baldwin, A.J.; et al. Measuring and predicting the vapor pressure of gasoline containing oxygenates. Fuel 2019, 243, 630–644. [Google Scholar] [CrossRef]
  36. Chilari, D.; Karonis, D. Influence of Ethanol on Vapor Pressure of Refinery Components and Commercial Type Gasoline Blends. J. Appl. Chem. 2017, 10, 19–28. Available online: https://www.iosrjournals.org/iosr-jac/papers/vol10-issue12/Version-1/C1012011928.pdf (accessed on 25 June 2021). [CrossRef]
  37. Rodriguez-Anton, L.M.; Gutierrez-Martin, F.; Martinez-Arevalo, C. Experimental determination of some physical properties of gasoline, ethanol and ETBE ternary blends. Fuel 2015, 156, 81–86. [Google Scholar] [CrossRef] [Green Version]
  38. Amine, M.; Awad, E.; Baraka, Y. Volatility criteria of isomerate-enriched gasoline-ethanol blends. Egypt. J. Pet. 2020, 29, 227–233. [Google Scholar] [CrossRef]
  39. Amine, M.; Awad, E.; Baraka, Y. Reformate-enriched gasoline-ethanol blends: Volatility criteria and azeotrope formation. Egypt. J. Pet. 2019, 28, 377–382. [Google Scholar] [CrossRef]
  40. CONCAWE. Understanding Volatility of Ethanol/Gasoline Blends. CONCAWE Review; Springer: Berlin/Heidelberg, Germany, 2011. Available online: https://www.concawe.eu/wp-content/uploads/2017/01/concawe_cr201-2011-04592-01-e.pdf (accessed on 18 June 2021).
  41. Bruno, T.J.; Wolk, A.; Naydich, A. Composition-Explicit Distillation Curves for Mixtures of Gasoline with Four-Carbon Alcohols (Butanols). Energy Fuels 2009, 23, 2295–2306. [Google Scholar] [CrossRef]
Figure 1. Distillation profiles of the refinery fractions used.
Fuels 02 00029 g001
Figure 2. Vapor pressure of base gasoline blends/blends with bio-ethanol/blends with bio-ETBE.
Fuels 02 00029 g002
Figure 3. Vapor pressure of blends with bio-ethanol and bio-ETBE in relation to the bio-ethanol content (oxygen content 3.7% m/m in all cases).
Fuels 02 00029 g003
Figure 4. Vapor pressure of blends with bio-ethanol and bio-ETBE in relation to the bio-ETBE content (oxygen content 3.7% m/m in all cases).
Fuels 02 00029 g004
Figure 5. Distillation curves of base fuels.
Fuels 02 00029 g005
Figure 6. Distillation curves of base fuels and base fuels with 10% v/v bio-ethanol.
Fuels 02 00029 g006
Figure 7. Distillation curves of base fuels and base fuels with 20.8% v/v bio-ETBE.
Fuels 02 00029 g007
Figure 8. E70 values for all blends against bio-ethanol content.
Fuels 02 00029 g008
Figure 9. E100 values for all blends against bio-ethanol content.
Fuels 02 00029 g009
Figure 10. E150 values for all blends against bio-ethanol content.
Fuels 02 00029 g010
Figure 11. Final boiling point (FBP) values for all blends against bio-ethanol content.
Fuels 02 00029 g011
Figure 12. Vapor lock index (VLI) values for all of the blends against bio-ethanol content.
Fuels 02 00029 g012
Table 1. Properties of the refinery fractions.
PropertiesUnitReformateFCC GasolineAlkylateIsomerateDimateTest Method
Density (at 15 °C)kg/m3788.7734.6704.0653.4689.9EN ISO 12185
Vapor Pressure (at 37.8 °C)kPa36.547.842.692.360.7EN 13016-1
n-Paraffins% v/v8.43.74.08.30.1EN ISO 22854
iso-Paraffins% v/v18.221.795.883.34.2EN ISO 22854
Naphthenes% v/v2.86.60.18.30.1EN ISO 22854
Olefins% v/v0.040.90.20.095.3EN ISO 22854
Aromatics% v/v70.723.00.00.10.2EN ISO 22854
Benzene% v/v2.140.690.00.00.0EN ISO 22854
RON-100.492.594.786.495.1EN ISO 5164
MON-88.980.792.083.580.9EN ISO 5163
IBP°C46.737.531.456.753.7EN ISO 3405
E 70% v/v9.627.76.784.613.9EN ISO 3405
E100% v/v23.153.19.797.981.6EN ISO 3405
E150% v/v82.273.292.3-89.8EN ISO 3405
FBP°C179.6209.8190.3100.1189.3EN ISO 3405
Table 2. Percentage of refinery fractions in the base fuels.
Refinery FractionsIIIIIIIVV
% v/v
Reformate3540403025
Alkylate5501010
FCC Gasoline3020203025
Isomerate2530303035
Dimate551005
Table 3. Properties and composition of base fuels.
PropertiesUnitIIIIIIIVVLimits EN 228
(O: 3.7% m/m)
Test Method
Densitykg/m3759.3744.9743.2737.6730.9720.0–775.0EN ISO 12185
Vapor Pressure (at 37.8 °C)kPa53.856.757.759.261.8class A: 45.0–60.0EN 13016-1
class C/C1: 50.0–80.0
n-Paraffins% v/v6.46.76.76.56.3-EN ISO 22854
Iso-paraffins%v/v40.241.743.447.750.0-EN ISO 22854
Naphthenes% v/v5.14.94.95.35.3-EN ISO 22854
Olefins% v/v17.113.017.712.315.018.0 maxEN ISO 22854
Aromatics% v/v31.732.932.928.123.535.0 maxEN ISO 22854
Benzene% v/v0.961.001.000.860.721.00 maxEN ISO 22854
IBP°C36.835.737.837.337.6-EN ISO 3405
E 70% v/v29.931.130.731.034.8class A: 22.0–50.0EN ISO 3405
class C/C1: 24.0–52.0
E100% v/v55.357.759.657.362.246.0–71.0EN ISO 3405
E150% v/v83.585.585.185.086.175.0 minEN ISO 3405
FBP°C194.7191.5193.4195.3197.8210EN ISO 3405
Table 4. Composition of blends of base fuels with bio-components.
Base Fuel (%)90.087.084.381.779.2
bio-ethanol (%)10.07.34.72.3-
bio-ETBE (%)-5.711.016.020.8
Table 5. Average values of vapor pressure for base fuels and expanded uncertainties.
IIIIIIIVV
Vapor pressure kPa
(EN ISO 13016-1)
53.856.757.759.961.8
Reproducibility, R2.892.942.963.003.03
Expanded Uncertainty, U±0.37±0.41±0.18±0.37±0.26
Table 6. Vapor pressure waiver permitted for gasoline.
Ethanol Content of Blends
(%v/v)
Vapor Pressure Waiver Permitted
EN 13016-1 (kPa)
0.00.0
2.36.4
4.78.0
7.37.9
10.07.8
Table 7. Distillation characteristics of base fuels.
PropertiesUnitsSample ISample IISample IIISample IVSample V
E70% v/v29.9 ± 0.05631.1 ± 0.04830.7 ± 0.05731.0 ± 0.04834.8 ± 0.050
E100% v/v55.3 ± 0.05457.7 ± 0.05359.6 ± 0.05957.3 ± 0.04962.2 ± 0.059
E150% v/v83.5 ± 0.02685.5 ± 0.02885.1 ± 0.02785.0 ± 0.02986.1 ± 0.029
FBP(°C)194.7 ± 0.028191.5 ± 0.030193.4 ± 0.029195.3 ± 0.034197.8 ± 0.038
Table 8. E70 of base fuels and bio-EtOH/bio-ETBE blends.
0% EtOH/
0% ETBE
2.3% EtOH/
16.0% ETBE
4.7% EtOH/
11.0%ETBE
7.3% EtOH/
5.7% ETBE
10% EtOH/
0% ETBE
0% EtOH/
20.8% ETBE
Units% v/v
Sample I29.9 ± 0.05630.9 ± 0.06535.0 ± 0.06437.9 ± 0.05538.5 ± 0.06222.9 ± 0.061
Sample II31.1 ± 0.04831.1 ± 0.05440.0 ± 0.05841.1 ± 0.05441.8 ± 0.05423.9 ± 0.047
Sample III30.7 ± 0.05731.4 ± 0.06239.7 ± 0.05442.0 ± 0.05543.3 ± 0.05523.3 ± 0.058
Sample IV31.0 ± 0.04832.0 ± 0.04640.5 ± 0.04741.9 ± 0.04842.3 ± 0.04526.6 ± 0.046
Sample V34.8 ± 0.05035.4 ± 0.04540.9 ± 0.04543.7 ± 0.04846.8 ±0.04728.1 ± 0.046
Table 9. E100 of base fuels and bio-EtOH/bio-ETBE blends.
0% EtOH/
0% ETBE
2.3% EtOH/
16.0% ETBE
4.7% EtOH/
11.0%ETBE
7.3% EtOH/
5.7% ETBE
10% EtOH/
0% ETBE
0% EtOH/
20.8% ETBE
Units% v/v
Sample I55.3 ± 0.05463.2 ± 0.05060.1 ± 0.04959.6 ± 0.04959.3 ± 0.05863.8 ± 0.055
Sample II57.7 ± 0.05365.0 ± 0.05663.3 ± 0.04963.3 ± 0.05563.0 ± 0.05666.3 ± 0.049
Sample III59.6 ± 0.05965.8 ± 0.05465.1 ± 0.05363.6 ± 0.05163.2 ± 0.04966.9 ± 0.055
Sample IV57.3 ± 0.04965.4 ± 0.05464.0 ± 0.05362.7 ± 0.05161.5 ± 0.05065.6 ± 0.054
Sample V62.2 ± 0.05970.7 ± 0.05868.6 ± 0.05667.7 ± 0.05565.8 ±0.04170.8 ± 0.056
Table 10. E150 of base fuels and bio-EtOH/bio-ETBE blends.
0% EtOH/
0% ETBE
2.3% EtOH/
16.0% ETBE
4.7% EtOH/
11.0%ETBE
7.3% EtOH/
5.7% ETBE
10% EtOH/
0% ETBE
0% EtOH/
20.8% ETBE
Units% v/v
Sample I83.5 ± 0.02686.1 ± 0.02485.3 ± 0.03984.8 ± 0.02784.5 ± 0.02586.3 ± 0.035
Sample II85.5 ± 0.02889.0 ± 0.02687.4 ±0.02587.4 ± 0.02685.5 ± 0.02688.9 ± 0.029
Sample III85.1 ± 0.02787.3 ± 0.03186.8 ± 0.03286.3 ± 0.02685.5 ± 0.02487.9 ± 0.030
Sample IV85.0 ± 0.02989.6 ± 0.02889.5 ± 0.02887.7 ± 0.02685.8 ± 0.02689.4 ± 0.027
Sample V86.1 ± 0.02990.2 ± 0.02889.7 ± 0.02689.4 ± 0.02789.2 ± 0.02690.0 ±0.029
Table 11. Final boiling point of base fuels and bio-EtOH/bio-ETBE blends.
0% EtOH/
0% ETBE
2.3% EtOH/
16.0% ETBE
4.7% EtOH/
11.0%ETBE
7.3% EtOH/
5.7% ETBE
10% EtOH/
0% ETBE
0% EtOH/
20.8% ETBE
Units% v/v
Sample I194.7 ± 0.028191.5 ± 0.029193.0 ± 0.027196.5 ± 0.035202.7 ± 0.025191.9 ± 0.035
Sample II191.5 ± 0.030185.4 ± 0.029193.5 ± 0.031194.3 ± 0.027201.5 ± 0.028186.4 ± 0.031
Sample III193.4 ± 0.029190.0 ± 0.025193.6 ± 0.026197.5 ± 0.025202.1 ± 0.026188.8 ± 0.027
Sample IV195.3 ± 0.034185.4 ± 0.035187.0 ± 0.039195.1 ± 0.037201.7 ± 0.035185.8 ± 0.039
Sample V197.8 ± 0.038185.2 ± 0.034188.2 ± 0.035195.0 ± 0.035195.0 ± 0.037186.1 ± 0.036
Table 12. VLI of ternary blends base fuels/bio-EtOH/bio-ETBE.
0% EtOH/
0% ETBE
2.3% EtOH/
16.0% ETBE
4.7% EtOH/
11.0%ETBE
7.3% EtOH/
5.7% ETBE
10% EtOH/
0% ETBE
0% EtOH/
20.8% ETBE
Units-
Sample I747.3810.3835876.3894.5679.3
Sample II784.7791.3880.0920.7923.6700.3
Sample III791.9813.2896.9930.0942.1692.1
Sample IV816.0829.0906.5931.3948.1740.2
Sample V861.6882.8946.3980.91005.6767.7
Publisher’s Note: MDPI stays neutral with regard to jurisdictional claims in published maps and institutional affiliations.

