Abstract
The current investigation aims to offer fundamental, molecular- to microscopic-level descriptions of methane gas inside natural source clay minerals. Texas montmorillonite (STx-1), Georgia kaolinite (KGa-2), and Ca2+-saturated Texas montmorillonite (Ca-STx-1, Ca-bentonite) were utilized as subsurface model clay minerals for elucidating nano-confinement behaviors of 13C-labeled methane gas. High-pressure magic angle spinning (MAS) nuclear magnetic resonance (NMR) was used to describe the interactions between methane and the clays by varying temperature and pressure. Proton-decoupled 13C-NMR spectra were acquired at 28.2 bar at 307 K, 32.6 bar at 346 K, 56.4 bar at 307 K, 65.1 bar at 346 K, 112.7 bar at 307 K, and 130.3 bar at 346 K. In the pure state, no significant thermal effect on the behavior of methane was observed. However, there was a perceptible variation in the chemical shift position of confined methane in the mixtures with the clays up to 346 K. Conversely, the 13C-NMR chemical shift of methane altered by varying pressure in a pure state, and the mixtures with clays, attributed to the interaction of methane with the clay surfaces or the nanopore network of the clay–silica mixed phase. Pressure-induced shifts in methane peak positions were observed: 0.25 ppm (28.2–56.4 bar) and 0.47 ppm (56.4–112.3 bar) at 307 K. For methane in a montmorillonite mixture, shifts were 0.32 ppm for bulk-like methane and 0.20 ppm for confined methane under similar conditions. At 346 K, increasing pressure from 65.1 to 130.3 bar caused shifts exceeding 0.50 ppm, with bulk-like methane showing a 0.64 ppm shift and confined methane a 0.57 ppm shift. There was only one 13C-NMR methane peak in the mixture with either kaolinite (KGa-2) or Ca-bentonite with line broadening compared to that of pure methane. Still, two peaks were observed in the mixture with STx-1, explained by the imbibition and mobility of methane in the pore network.
Keywords:
natural gas; shale gas; confinement; montmorillonite; kaolinite; methane; high-pressure NMR 1. Introduction
It is widely accepted that the properties of bulk fluids are altered by solid substrates, confinement between solid surfaces, or narrow pores, driven by the interaction between the fluid’s intrinsic length scales and the confinement-induced length scale [1]. Fluids (i.e., gases and liquids) exhibit behavior in confined geometries, such as pores and fractures, that differs significantly from their bulk properties in various ways [2,3]. Modifications can occur in phase transitions (e.g., freezing and capillary condensation), sorption and wetting characteristics, and dynamic properties like diffusion and relaxation, with the most notable changes observed in pores ranging from <2 nm to 50 nm, corresponding to the micro- and mesoporous regimes [3]. Key factors influencing the structure and dynamics of confined fluids include the average pore size, pore size distribution, degree of pore interconnection, and the strength of the fluid–substrate interaction. Achieving a quantitative understanding of these complex solid–fluid interactions under diverse thermodynamic conditions is crucial for developing improved substrates for technological applications (e.g., chromatography, fluid capture, storage and release, and heterogeneous catalysis) and for advancing energy-related environmental processes (e.g., fluid and waste mitigation, carbon sequestration, gas shale recovery, etc.).
The exploration and exploitation of shale gas reserves, such as the Marcellus, Utica, and Barnett formations, have prioritized understanding the fundamental interactions between volatile hydrocarbons and the rock matrix [4,5]. Hydrocarbon fluids, including methane (the most abundant), ethane, and other longer-chain alkanes, are stored in three forms: as free gas in pores, as free gas in natural fractures, and adsorbed on the surfaces of organic matter and silicate minerals [6]. These pores are typically submicron in size, with cylindrical or slit-like shapes, and are often dominated by pores as small as a few nanometers [7]. Investigating the molecular features of methane’s structure and dynamics in narrow silica-based pores could provide insights into the molecular processes during natural gas production following hydraulic fracturing. Clarifying the adsorption and diffusion of hydrocarbons in narrow pores may enhance our understanding and prediction of several subsurface phenomena, including hydrocarbon migration [8]. Gaining insight into methane behavior in narrow pores might have industrial applications, such as catalytic reactions. Moreover, revealing the characteristics of methane molecules in mixtures with natural clay might help explore “unconventional” shale gas reservoirs for large-quantity production of natural gas [9].
Background and Objectives
In the recent contributions to understanding methane behavior under nanoconfinement relevant to subsurface energy systems, to overcome technical issues in mimicking the high-pressure conditions, the high-pressure magic angle spinning (MAS) nuclear magnetic resonance (NMR) method is employed in the current study [10,11]. High-pressure MAS NMR allows systematic investigation of methane dynamics in confined states at pressures such as 60 and 120 bar. In MAS, if the sample is spun at spinning frequencies in the range between 5 and 65 kHz [12] around an axis with an angle of 54.74° with respect to the static magnetic field, the anisotropy of nuclear interactions, exhibiting frequency dependence on the orientation according to a second order Legendre polynomial, is averaged out. Applying MAS NMR for investigating gases was rare [13] until the mid-2000s. In 2006, Deuchande et al. built a high-pressure insert composed of the polymer (poly ether ether ketone) (PEEK) [14]. Hoyt et al. [10] and Turcu et al. [11] upgraded the high-pressure MAS NMR technique by developing a unique gas loading chamber that permitted pressurization of the gas-tight rotors capable of hosting variable density gasses like methane and carbon dioxide (CO2). As emphasized by Hoyt et al. [10] and Turcu et al. [11], the high-pressure MAS NMR method offers a unique capability to simulate real-life high-pressure and high-temperature conditions, which are difficult to replicate using conventional techniques. This advanced system includes a reusable high-pressure rotor, a loading chamber for in situ sealing and reopening, and a MAS probe designed to minimize background signals. By employing modified ceramic materials with enhanced internal surfaces and precision sealing mechanisms, the technique achieves and maintains internal pressures exceeding 150 bars for up to 72 h under ambient external conditions.
This innovative design enables detailed investigations of processes such as mineral carbonation reactions, providing insights into intermediates and final products under conditions relevant to geological carbon sequestration. The method’s ability to operate at such extreme conditions makes it invaluable for studying phenomena critical to energy storage, environmental science, and industrial applications.
The high-pressure MAS NMR technique has been utilized to investigate methane and/or CO2 in mixtures with natural clays, including smectites [15,16], natural shale [17,18], and clay swelling in dry supercritical CO2 [19]. The results by Bowers et al. [16] showed CO2 and CH4 in natural shale with nanopores smaller and larger than 10 nm, and bulk fluid could be discriminated from each other. The fractionation of CH4 between the pores smaller and greater than 10 nm relied on the ratio of CO2 and CH4. The nanopores preferred H2O instead of CH4. On the contrary, the major finding of Bowers et al. [19] was that CH4 might be absorbed in smectite interlayers when the concentration of H2O is low. If the smectite has divalent (Ca2+ and Pb2+) cations rather than Na+, CH4 intercalation is larger. These results implied the potential alteration of the extension of the interaction between CH4 molecules and clays in the rocks. One more remarkable result was that Cs-exchanged smectites could be efficient systems for CH4 sorption and partitioning.
In the current contribution, Texas montmorillonite from Gonzales County [20,21] was utilized as a subsurface model system for studying the nano-confinement behavior of 13C-labeled methane gas. Montmorillonite is a natural aluminosilicate having negatively charged layers balanced by cations [22]. The montmorillonite structure contains two tetrahedral sheets of silica and a central octahedral sheet. The sheets are connected by oxygen atoms shared by both sheets [23,24]. The unit layers are approximately 1–2 nm thick, and the clay minerals consist of micrometer-sized crystalline particles [25,26]. The clay minerals’ layered structure has two surface types: edges and basal planes [27]. Due to surface activity and the large surface area, clay minerals have been used in industrial catalysis, providing adsorption sites for gases such as methane [28,29].
Among different natural clays, Texas montmorillonite (STx-1) is known to be dioctahedral, with low iron content [30]. Recently characterized STx-1 reportedly contains 73% smectite and ~25% silica (as cristobalite > tridymite > quartz) [31]. The study by Chipera and Bish [32] identified the silica as primarily opal-CT, a weakly ordered crystalline version of silica, plus 3% quartz + feldspar + kaolinite + talc (?) [32]. Referring to the literature, this mineral assemblage could be represented by an inter-grown pore network model [33]. According to this model, the pore network comprises pores and throats, where the pores govern the storage of the confined fluid, while the throats direct the fluid flow during the production procedures. There could also be an irregular network of pores and pore throats [34]. Such network models motivate us to consider that the silica could be intimately intergrown with the STx-1, resulting in a partially mixed-ordered and disordered network system. In STx-1, quartz, silica, and carbonate minerals are considered contaminants. The octahedral sheet has a charge of −0.68 per formula unit, and the tetrahedral sheet has no permanent charge [35]. According to the report by Castellini et al. [31], STx-1 has a MgO concentration of 1.87 and CaO of 1.59 wt.%. Mg2+ is the main reason for the elevated permanent charge of STx-1 montmorillonite [35,36]. According to the transmission electron microscopy (TEM) findings of Thao [36], the particle size of STx-1 could be categorized as follows: (i) the bigger one with about 0.5 μm of thickness, moré, and curled edge particles, (ii) the smaller one as thin, moré, and xenomorphic particles.
The other natural silicate of interest is kaolinite, which has a one-to-one aluminosilicate with two layers. The octahedrally coordinated aluminum layer is bridged to a tetrahedrally coordinated silicon sheet via oxygen atoms [27]. Kaolinite has no active layer, but OH groups are on the structure’s surface [37]. The kaolinite sample from Warren County, Georgia (KGa-2) contains 96% kaolinite, 3% anatase, 1% crandallite, and mica and/or illite [32]. Kaolinite (KGa-2) has a zero tetrahedral charge and a positive octahedral charge of 0.16 e, probably from substituting Al3+ with Ti4+ in the octahedral sheet [35].
Our work with novelty explores the molecular-level behavior of methane confined within natural clay minerals, focusing on Texas montmorillonite, kaolinite, and purified Ca-bentonite, free of any natural metal carbonates [38,39]. By leveraging high-pressure MAS NMR, we provide novel insights into how methane’s interaction and mobility are influenced by the layered and intergrown pore network structures of these minerals. This study is the first to systematically investigate methane’s response to confinement within montmorillonite interlayers, shedding light on its potential implications for gas storage and production processes.
2. Materials and Methods
2.1. Materials
Clay minerals were purchased from the Source Clays Repository, the Clay Minerals Society entity at Purdue University (West Lafayette, IN, USA). A kaolinite sample was obtained from Warren County, Georgia, as a high-defect kaolin (KGa-2), while a montmorillonite sample was obtained from Gonzales County, Texas (STx-1). To have a representation of a natural heterogeneous environment for methane gas, the clay minerals KGa-2 and STx-1 were used without any purification. The clay minerals’ BET surface area values were measured with nitrogen adsorption and desorption at 77 K in liquid nitrogen with a Micromeritics ASAP 2020 surface area and porosity analyzer (Micromeritics, Norcross, GA, USA) (Table 1). Before the adsorption–desorption measurements, kaolinite and montmorillonite were degassed at 423 K for 120 h by applying a vacuum pressure of 10 µmHg.

Table 1.
Surface areas of the clay minerals.
In addition, the Ca2+-saturated bentonite sample (Ca-STx-1) was purified from naturally occurring metal carbonate solids and had a <2 µm fraction prepared by following the procedures in the literature [38,39]. For two weeks, Ca2+ saturation was also designed by suspending the clay in a 5 M CaCl2 solution. The excess salt was removed by dialysis in deionized water. Furthermore, CO2 intercalation into Ca-STx-1 was studied by in situ Attenuated total reflection Fourier Transform Infrared (ATR-FTIR) and in situ X-ray Diffraction (XRD) with anhydrous supercritical CO2 [20]. The swelling property of Ca-STx-1 was also reported recently [21].
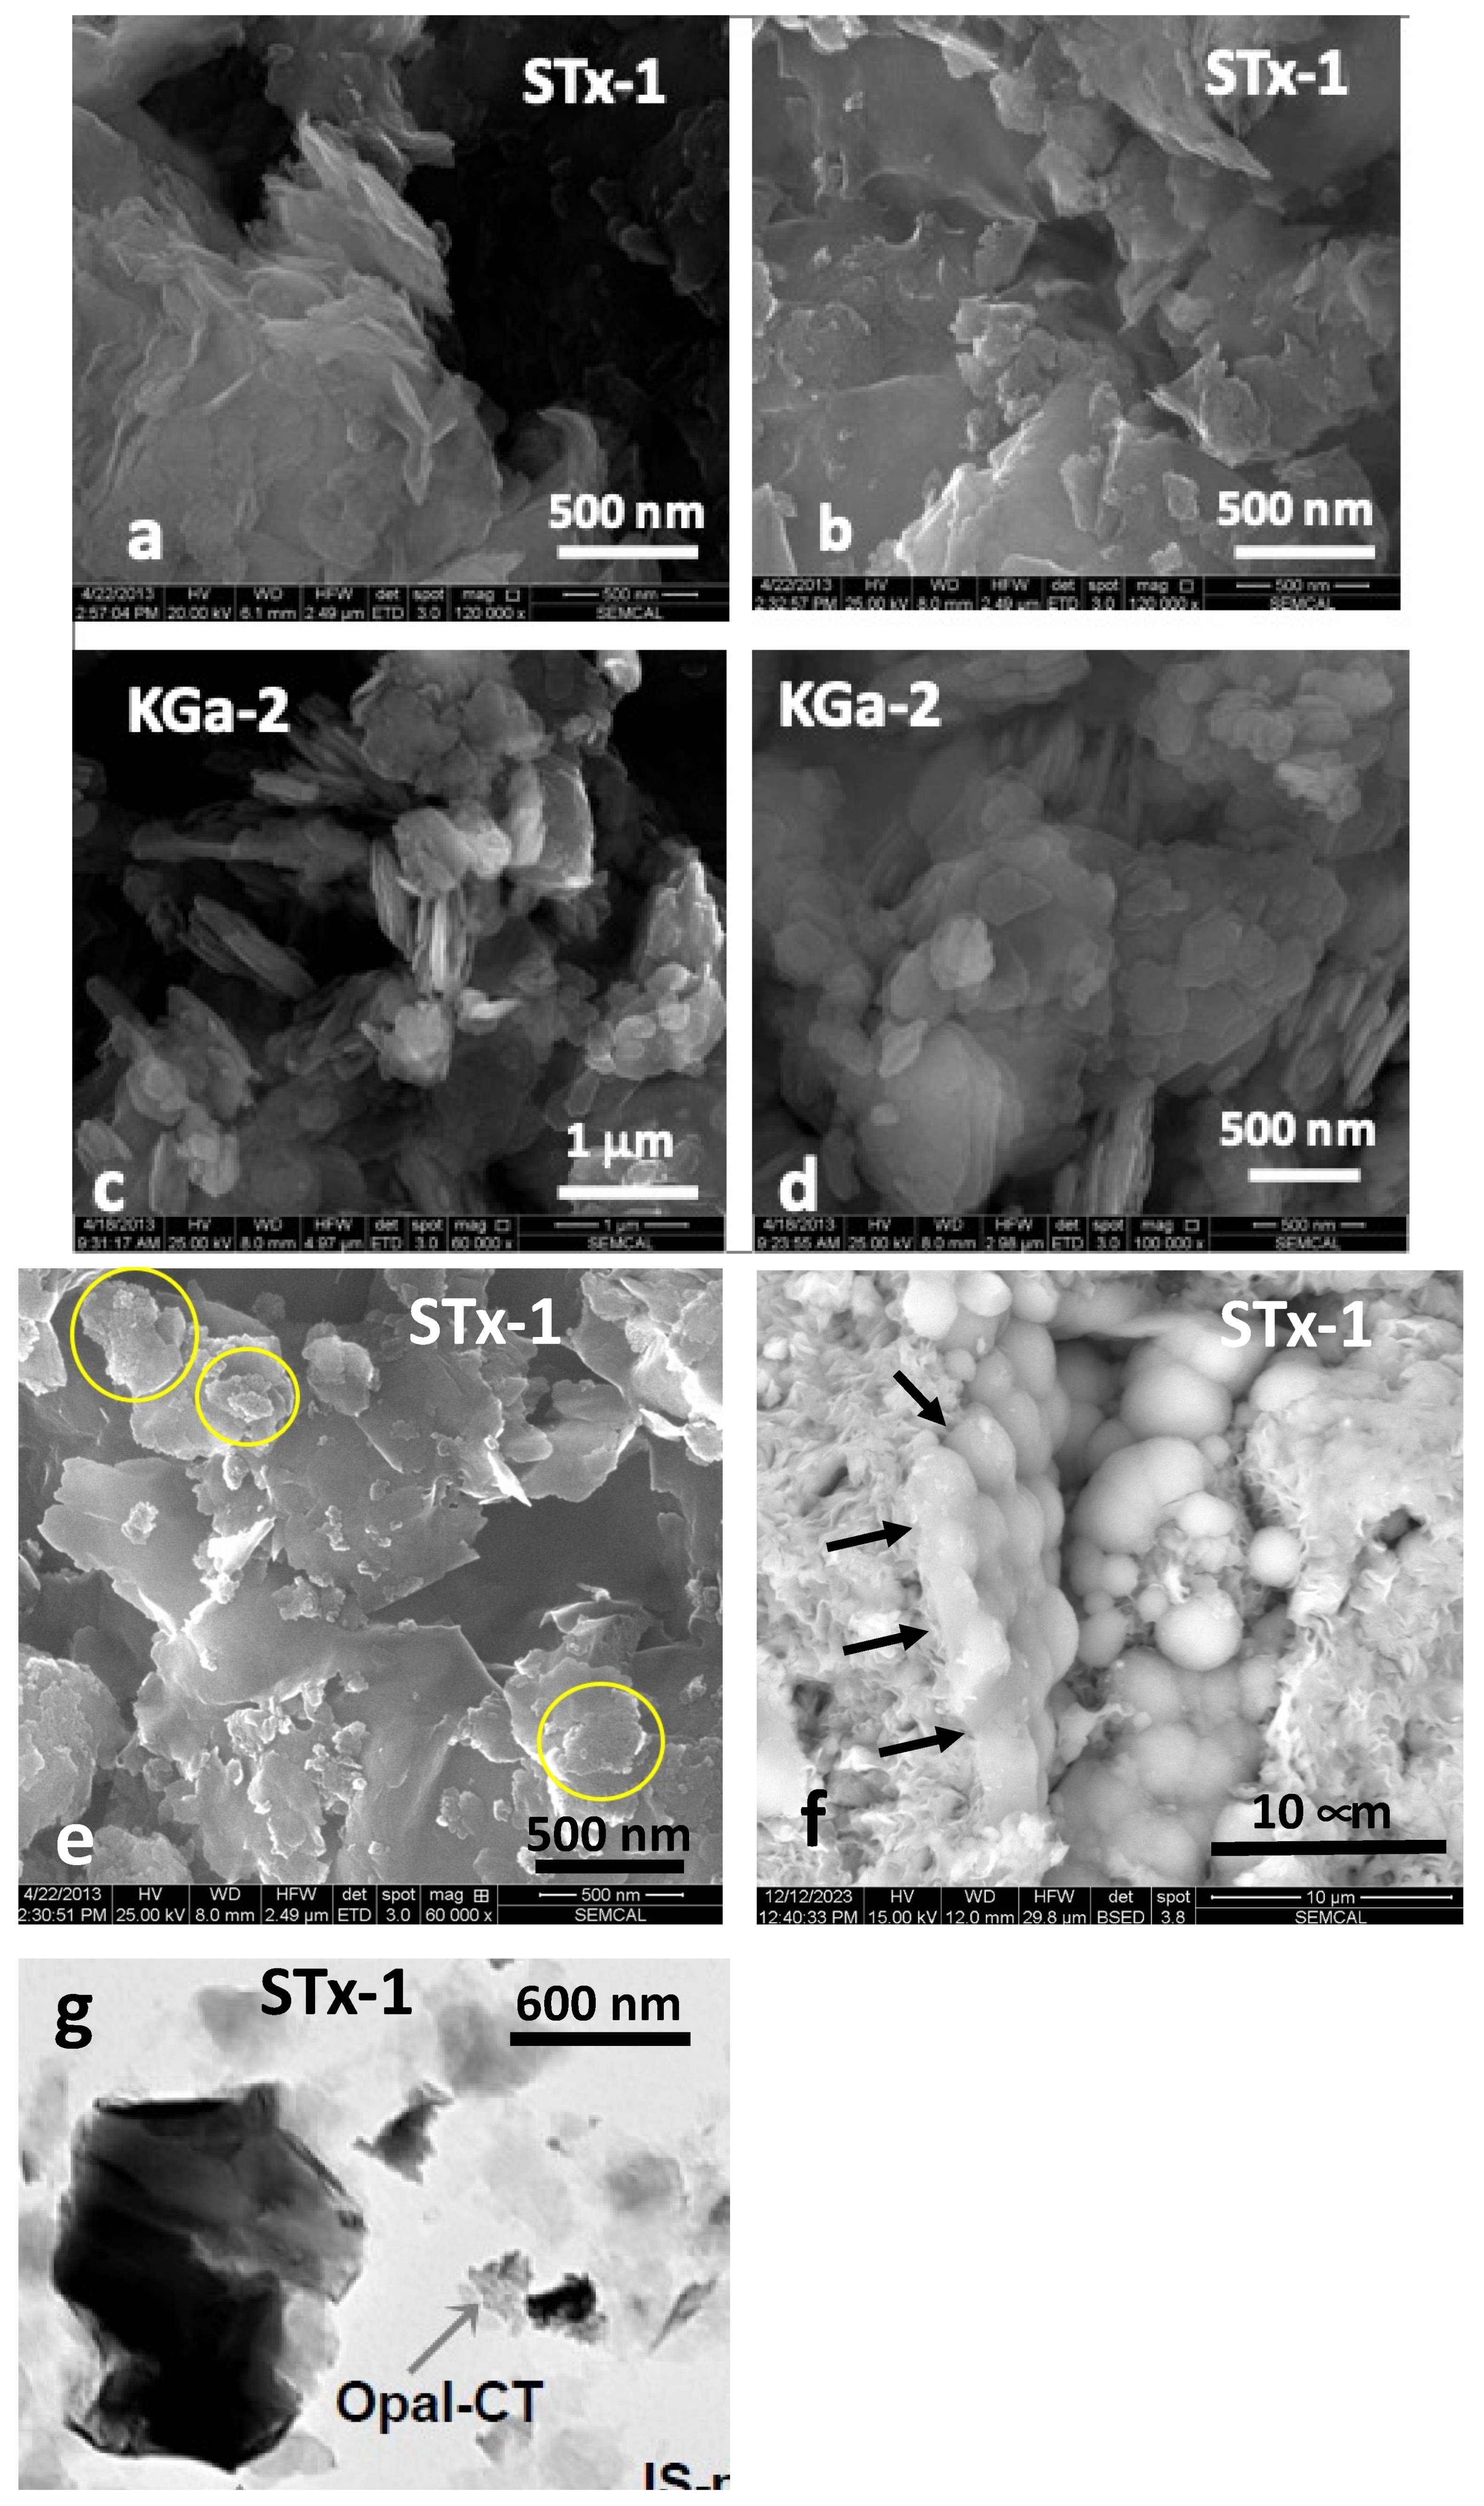
The morphology of the clays and silica (Figure 1a–f) was characterized by scanning electron microscopy using an FEI Quanta 250 Field Emission Gun scanning electron microscope (SEM), while Figure 1g (Bright Field TEM image of STx-1) is taken from literature [36]. SEM samples were prepared by depositing small amounts of untreated and unground clay particles onto carbon tape affixed to aluminum stubs, followed by a light coating of Au/Pd using a Denton Desk V sputter coater.

Figure 1.
(a–g). Representative examples of scanning (SEM) and transmission electron microscopy (TEM) images: (a,b) SEM images of STx-1 (Au/Pd coated on conductive carbon tape) depicting morphology of irregularly shaped variable size platy grains that occur individually or as clusters that can exhibit curling along the edges; (c,d) SEM images of KGa-2 (Au/Pd coated on conductive carbon tape) generally as clusters of plates and grains of diverse size, revealing basal plane morphology; (e) varying size clusters of silica outlined in yellow circles dispersed among the STx-1; (f) more magnified view of the silica with “opal-like” spherical textural habit, in part, intimately connected with the montmorillonite (black arrows); and (g) Bright Field TEM image of STx-1 capturing one of the silica “opal-like” clusters revealing a mottled appearance (with permission of H-M Thao, 2006 Ph.D. dissertation) [36].
2.2. Nuclear Magnetic Resonance: 13C Direct Polarization (DP) and 1H–13C Cross Polarization (CP)
The high-pressure MAS experiments were performed on a Varian 300 MHz spectrometer operating at 75.4 MHz for the 13C channel with 7.5 mm high-pressure specially designed rotors. Temperature calibration of the high-pressure probe was performed by obtaining 207Pb NMR spectra of lead nitrate by varying temperature, as mentioned in the literature [40,41]. The details of the high-pressure chamber are explained elsewhere [10,11]. First, the high-pressure resistant NMR rotors were filled properly by clay mineral for appropriate spinning during the MAS NMR measurements, and the mass of MAS NMR rotors was weighed with a high-sensitive microbalance (Table 2). As described previously [42], the samples for 13C NMR spectra were loaded with pressures of approximately 30.0, 60.0, and 120.0 bar and at 323 K ± 1.0 K. After loading, before the NMR measurements, and after the acquisition of the 13C NMR spectra, the mass of MAS NMR rotors was weighed again with the highly sensitive microbalance (Table 2). Two temperatures were applied for studies at each pressure (307 and 346 K ± 1.0 K) for obtaining the 13C NMR spectra, resulting in internal sample pressures of 28.2, 56.4, 112.7, or 32.6 bar, 65.1 bar, 130.3 bar (±0.3 bar). Changing the pressure varied the density of methane and allowed the interrogation of the influence that phase change (gas to supercritical state) had on the fluid–silica interaction. The critical pressure (Pc) and critical temperature (Tc) of bulk methane are 45.992 bar and 190.564 K (−82.7 °C), respectively [43]. The high-pressure MAS NMR method explored the temperature−pressure (density) regimes characteristic of shale gas systems at specific subsurface depths. The methane quantity, either in its pure form or in mixtures with clays, was measured using an ultra-sensitive microbalance by recording the mass before and after methane loading into the NMR rotors. Proton-decoupled 13C NMR spectra were acquired under various conditions: 28.2 bar at 307 K, 32.6 bar at 346 K, 56.4 bar at 307 K, 65.1 bar at 346 K, 112.7 bar at 307 K, and 130.3 bar at 346 K. Adjusting the pressure changed the clay-to-methane gas ratio. Moreover, to mimic a natural environment, the clay minerals (excluding Ca-STx-1, which is free from natural metal carbonates) were not exposed to further purification before the NMR measurements.
Table 2.
Sample conditions, compositions, and measured 13C isotropic chemical shift values of methane in the pure state and mixtures with clay minerals.
Further, switching the pressure from 28.2 to 56.4 bar or even to 112.7 bar allowed changing the state from gas to supercritical state. The spinning frequency was 3 kHz. Proton-decoupled 13C NMR spectra were acquired with 120 repetitions. Therefore, the temperature–pressure (density) capabilities of the newly developed high-pressure MAS technique aligned with those observed in shale gas systems found at subsurface depths.
3. Results and Discussion
3.1. Natural Clay Characterization
3.1.1. BET
Table 1 summarizes the results of the BET measurements. Texas montmorillonite (STx-1) has a larger surface area than Georgia kaolinite (KGa-2). The surface area of both clays is slightly lower than the values mentioned in the literature [27].
3.1.2. SEM Measurements
The natural clay SEM images (Figure 1a–d) show morphology as clusters composed of irregularly shaped flakes, often curled along the edges, for STx-1 (Figure 1a,b) and basal plane morphology for KGa-2 (Figure 1c,d). Silica occurs as distinct assemblies of spherical grains generally clustered together (Figure 1e) and in intimate contact with the clay (Figure 1f). Our XRD characterization, coupled with the SEM images and associated Energy Dispersive X-ray (EDX) spectroscopy, would suggest this silica is more opal-like than cristobalite or tridymite, so for the purposes of this study, we will simply refer to it as “silica”. Figure 1g comes from the work of Thao, who used TEM to characterize a number of clays, including STx-1, revealing a mottled appearance reflecting the spherical texture observed in the SEMs. In addition, detailed characterization of the reactive surface area of both clays has been performed by solid-state NMR [27]. The details of the Ca-STx-1 properties can be found in the literature [20,21,38,39]. According to Leong et al. [35], STx-1 has a BET surface area of 83.8 m2/g, while the BET surface area of KGa-2 is reported as 23.5 m2/g. Widjaja and Inkiriwang also reported a BET surface area of 69.3 m2/g for Ca-bentonite [44].
3.2. High-Pressure MAS NMR
Earlier NMR reports in the literature focused on the methane behavior at pressures below the Pc of methane [45,46,47]. The temperature and pressure ranges in our study are above methane’s critical point values, allowing us to probe clay–supercritical methane interactions. The observations of the methane behavior in mixtures with clays demonstrate how the unique high-pressure MAS method helps follow the NMR shifts by temperature, pressure, composition, etc. The high-pressure MAS NMR [46] gives maximal NMR sensitivity, with low 1H and 13C background signals. MAS NMR also allows the collection of high-resolution spectra because the line broadening arising from various internal and external nuclear interactions is averaged by the mechanical spinning of the samples [10,11]. In addition, anisotropic contributions to the 13C-NMR spectrum of methane are also eliminated by MAS [45]. Thus, separate spectral components can be distinguished by rotating the sample at the magic angle and recording the proton-decoupled 13C spectrum. In our previous high-pressure MAS-NMR study [42] of 4 nm nanoporous silica–methane interaction, we observed two distinct peaks, one like bulk methane and a second attributed to methane nanopore confinement. In the case of the silica–methane study, the bulk-like fluid could include the fluids between nanoporous particles and/or more free fluid in the center of the 4 nm pores. It is hypothesized that methane confinement within a clay–silica pore network may exhibit a two-peak NMR spectrum. This outcome could potentially include variations in peak broadening and chemical shifts relative to adamantane, as observed through high-pressure MAS NMR spectroscopy.
3.2.1. Methane Interaction with Kaolinite: Role of Surfaces
Kaolinite is a non-expandable clay and, as such, acts as a control sample due to the absence of an accessible interlayer [48]. Methane molecules can interact only with the external surfaces of kaolinite, dominated primarily by aluminum hydroxide gibbsite-like layers. The kaolinite–methane spectrum exhibits a single 13C NMR peak in Figure 2a, with two distinct changes compared to bulk methane. There is a noticeable isotropic 13C chemical shift of the mixture compared to the bulk fluid, ranging from 0.15 to 0.28 ppm depending on the temperature–pressure condition (Table 2). Further, there is a definite line broadening in the kaolinite–methane peak relative to bulk methane. The lack of an accessible interlayer does not result in two peaks, as hypothesized for methane behavior associated with nanoconfinement. The observations can also be explained by susceptibility effects, where the broadened line-shapes are a result of inhomogeneities in the sample.

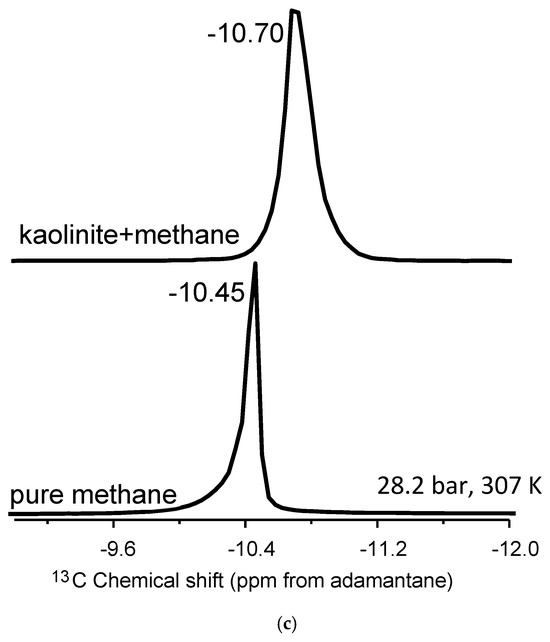
Figure 2.
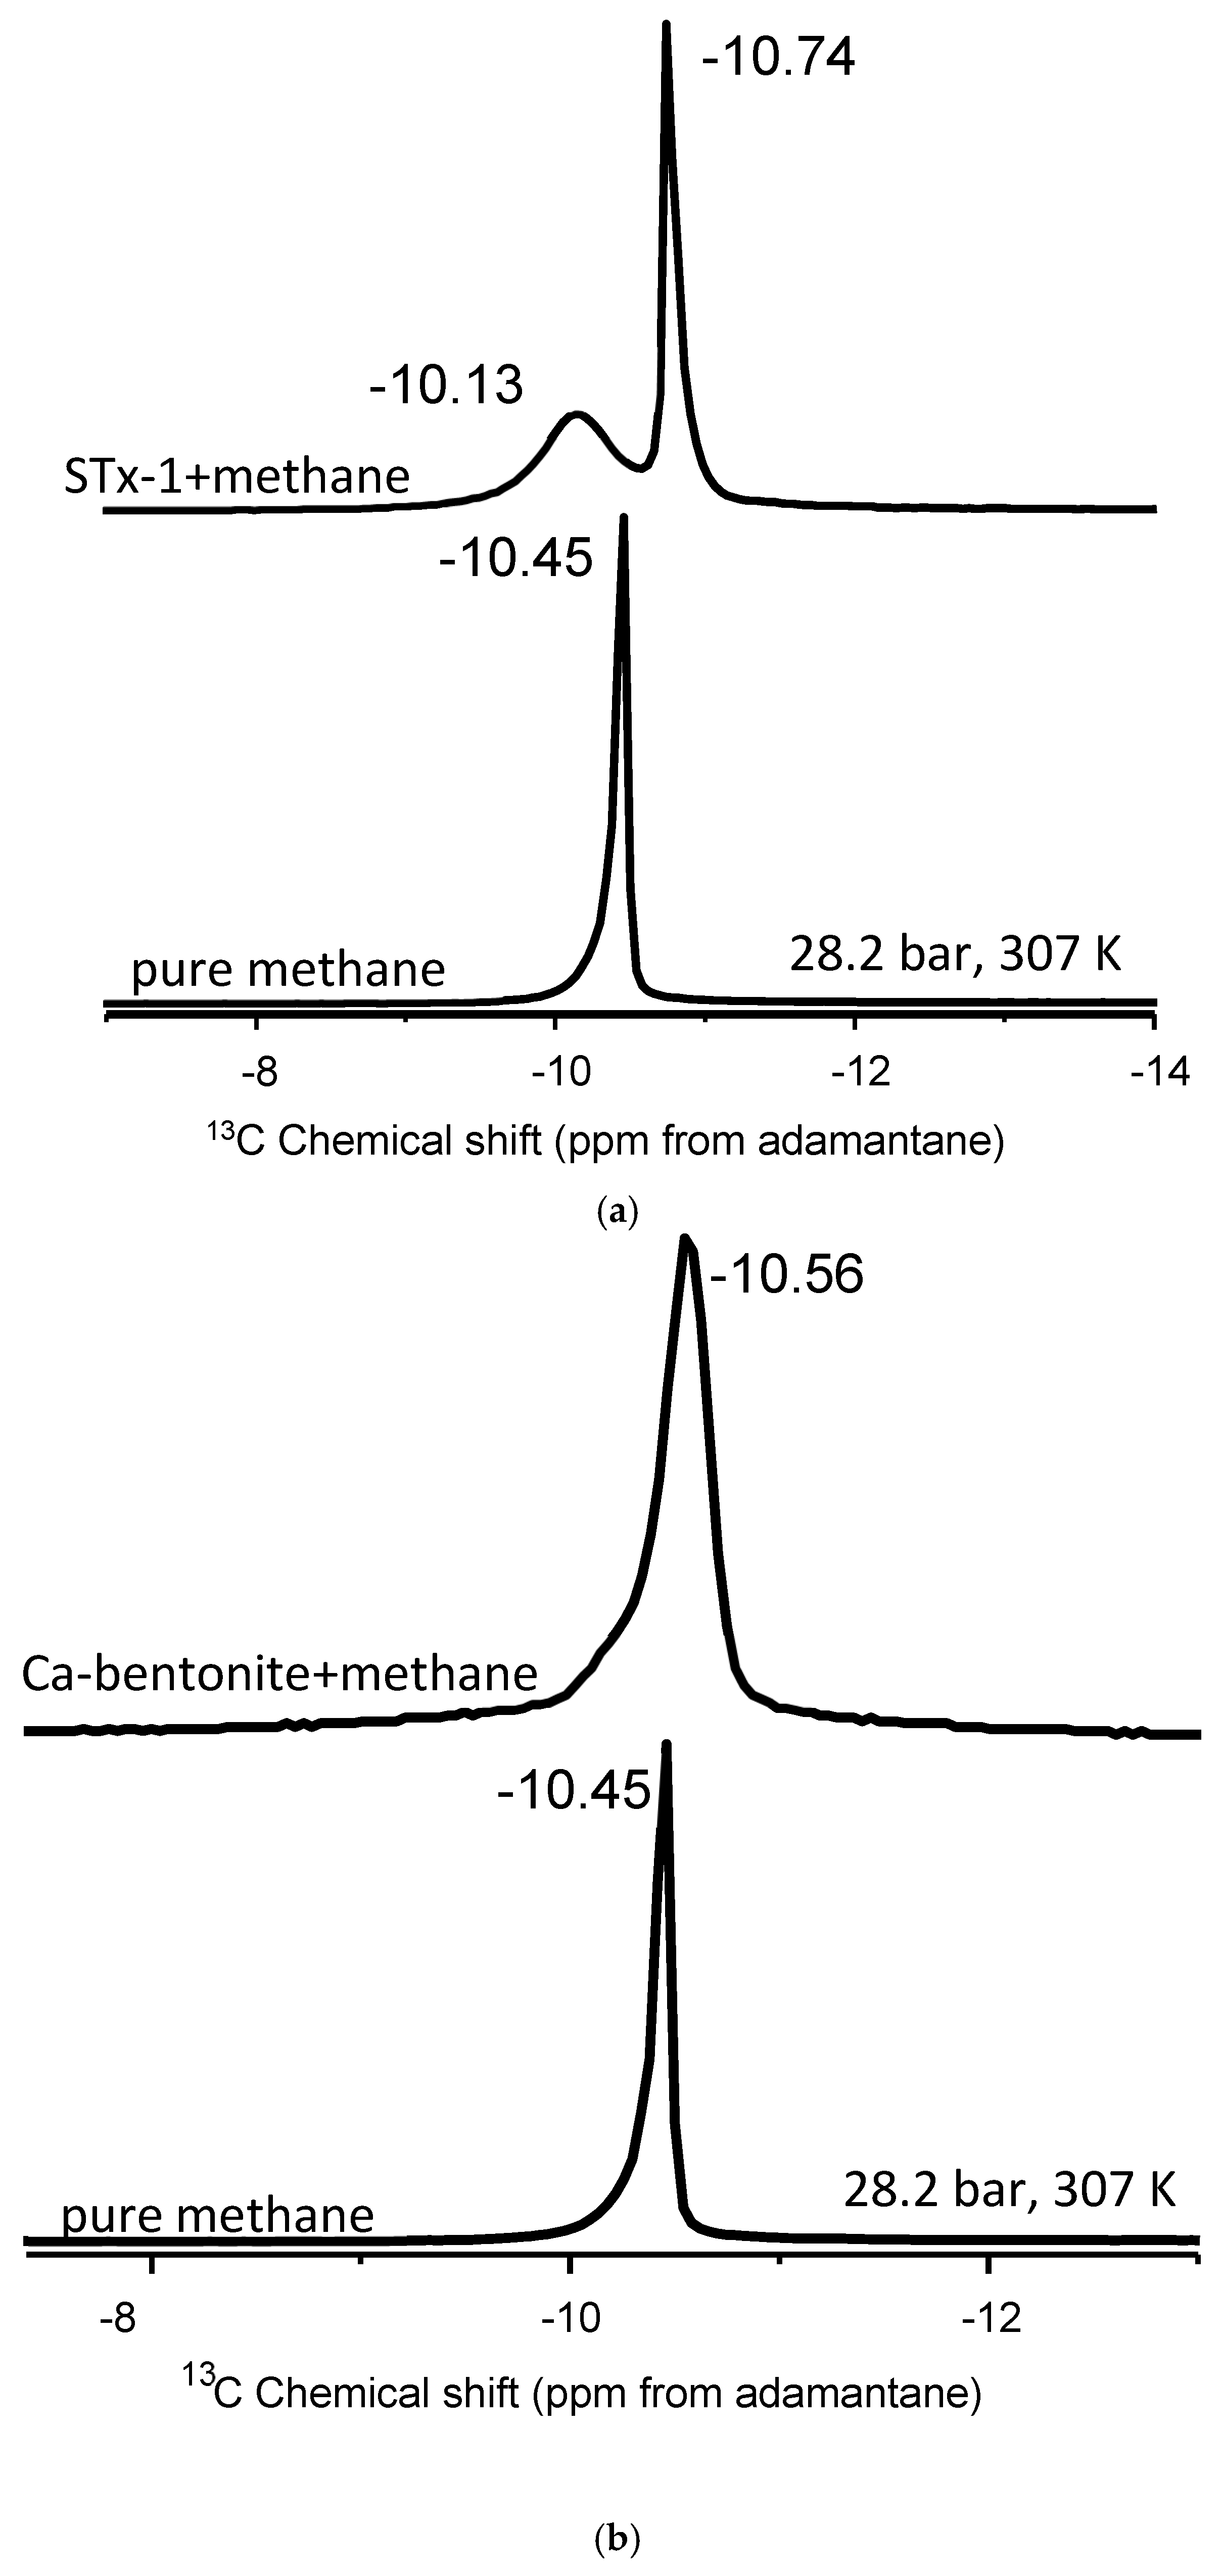
(a–c). (a) Stack plot of proton-decoupled 13C NMR spectra of methane in the pure state and in mixture with montmorillonite. (b) Stack plot of proton-decoupled 13C NMR spectra of methane in the pure state and in mixture with Ca-bentonite. (c) Stack plot of proton-decoupled 13C NMR spectra of methane in the pure state and in mixture with kaolinite. The spectra were acquired at 28.2 bar and 307 K.
The -OH groups on the kaolinite surface may induce a “dynamic order” in a portion of the methane molecules at the surface. Due to the exchange between the utterly free methane molecules and those interacting with the kaolinite surface, and because the motion of the methane molecules is averaged on the NMR time scale, the methane molecules experience an average of 13C shielding. Since the exchange occurs rapidly relative to the NMR time scale, this results in a lifetime-averaged shielding, leading to a single signal in the spectrum [46].
3.2.2. Methane Interaction with Ca-Saturated Montmorillonite (Ca-Bentonite) and Montmorillonite–Silica Assemblage
Although the Ca-bentonite is an expandable clay at the nanoscale, its interaction with methane does not yield the two peak spectra as we hypothesized (Figure 2b). Instead, we observe a similar behavior as kaolinite, wherein the single 13C NMR peak exhibits line broadening compared to bulk methane, but where the half-width-at-half-maximum (HWHM) of the kaolinite peak is approximately 25% greater than the HWHM of Ca-bentonite. There is a much more subtle 13C isotropic chemical shift than in kaolinite, ranging from 0.04 to 0.11 depending on the temperature and pressure (Table 2). For example, the delta value in the mixture with Ca-bentonite is only 0.05 ppm compared to bulk methane at the highest pressure of 130.3 bar at 346 K. Close inspection of the Ca-bentonite peak does reveal a subtle but perceptible shoulder on the less-negative 13C isotropic chemical shift side of the peak. The “subtle” shoulder can be explained with a fraction of confined “methane”. At the same time, the broadening of peaks in the absence of change of chemical shifts compared to pure CH4 could be attributed to the susceptibility of the clay.
The interaction of methane and Texas montmorillonite (STx-1) yielded two distinct 13C peaks (Figure 2c). The more-intense signal is derived from “bulk-like” fluid behavior, whereas the less-intense peak is identified as “confined” methane [42,49] upon mixing methane with montmorillonite (Figure 2c). Unlike kaolinite and Ca-bentonite, there is no perceptible line broadening of the major peak. Previously, we observed two 13C NMR signals in the mixtures of methane and 4 nm nanoporous engineered silica proxies, and a controlled release experiment also confirmed the “confined” methane resonance [42]. In the Koskela et al. [46] study of methane behavior in the gas state with mixtures of AlPO4-11, three 13C-NMR methane signals were observed at temperatures above 250 K. The three components changed the NMR signal intensities dramatically with temperature. For instance, as the temperature increases, the signal from the adsorbed gas diminishes, while the signal from the free gas becomes more prominent [46].
Regarding the two peaks, it is essential to refer to Ok et al. [42]. Figure 3 summarizes the study by Ok et al. [42], where methane was mixed with non-porous silica and ordered nanoporous silica with 200 nm average particle size and 4 nm pore diameter, respectively. Only one 13C NMR peak of methane was observed when methane was mixed with non-porous silica. However, as methane was mixed with ordered nanoporous silica, two methane peaks were observed. The peak with higher intensity was assigned to confined methane in the nanopores of the silica with a 4 nm pore diameter. The other one with lower intensity arose from “bulk-like” methane [42]. In the present study, we also observe two 13C NMR peaks arising from methane, as methane was mixed with STx-1. Moreover, the peak explained by interfacial methane has a lower intensity than the “bulk-like” methane. The difference in 13C chemical shifts for methane confined in clay minerals versus ordered nanoporous silica can largely be attributed to the reference standard used in NMR spectroscopy (tetramethyl silane (TMS) vs. adamantane). TMS universally defines 0 ppm, while adamantane introduces a systematic offset due to its distinct chemical structure. Therefore, the use of adamantane can cause shifts to appear more negative, as in the case of lower intensity peak in the present study. In Texas montmorillonite, the strong interactions between methane and reactive sites, such as hydroxyl groups, lead to greater deshielding and a more-negative shift. The observed variations highlight the importance of reference selection in interpreting chemical shifts, consistent with findings in Ok et al. [42], where confinement effects were shown to influence NMR results significantly.
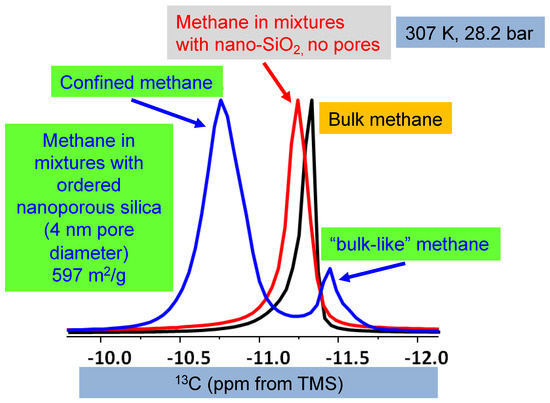
Figure 3.
The 13C NMR spectra of pure methane, methane in non-porous silica, and mixtures with ordered nanoporous silica with 4 nm pore diameter. The comparison is prepared from Ok et al. [42], and the experimental details are given there. In the study by Ok et al. [42], tetramethyl silane (TMS) was used as a reference. Copyright permission granted by the American Chemical Society.
As described above, STX-1 is a complex mixture of several phases dominated by montmorillonite and silica (opal-like in habit). The SEM images in Figure 1e,f show complex textural relationships between the clay and silica with an array of different types of nanoscale grain boundaries, including numerous pore throats and what appears to be intergrowth features. A non-trivial fraction of methane molecules could imbibe and move in this heterogeneous porous network. The nanoscale dimensionality of the network could confine methane molecules in a manner like how it was confined in 4 nm nanopores in silica [42]. Further, we envision a smaller contribution to confinement from methane entering the clay interlayers and any pores in the silica. Opal and cristobalite are known to have complex microstructures that accommodate pores [50]. As a result, the nuclei of methane molecules have different shielding, which resulted in the two peaks detected by MAS NMR, rather than a single peak that the limitations of static data acquisition would have produced [46].
3.2.3. Effect of Pressure and Temperature
Experiments varying pressure and/or temperature were performed to better constrain the “bulk-like” and “confined” methane peak assignments by comparing the peak position and intensity. The full data set is given in Table 2. Figure 4a depicts the change in the 13C chemical shift positions as a function of pressure from 28.2 to 112.7 bar at 307 K. Conversely, Figure 4b provides an example of the effect of temperature (307 versus 345 K) at approximately the same pressure (112.7 versus 130.3 bar).

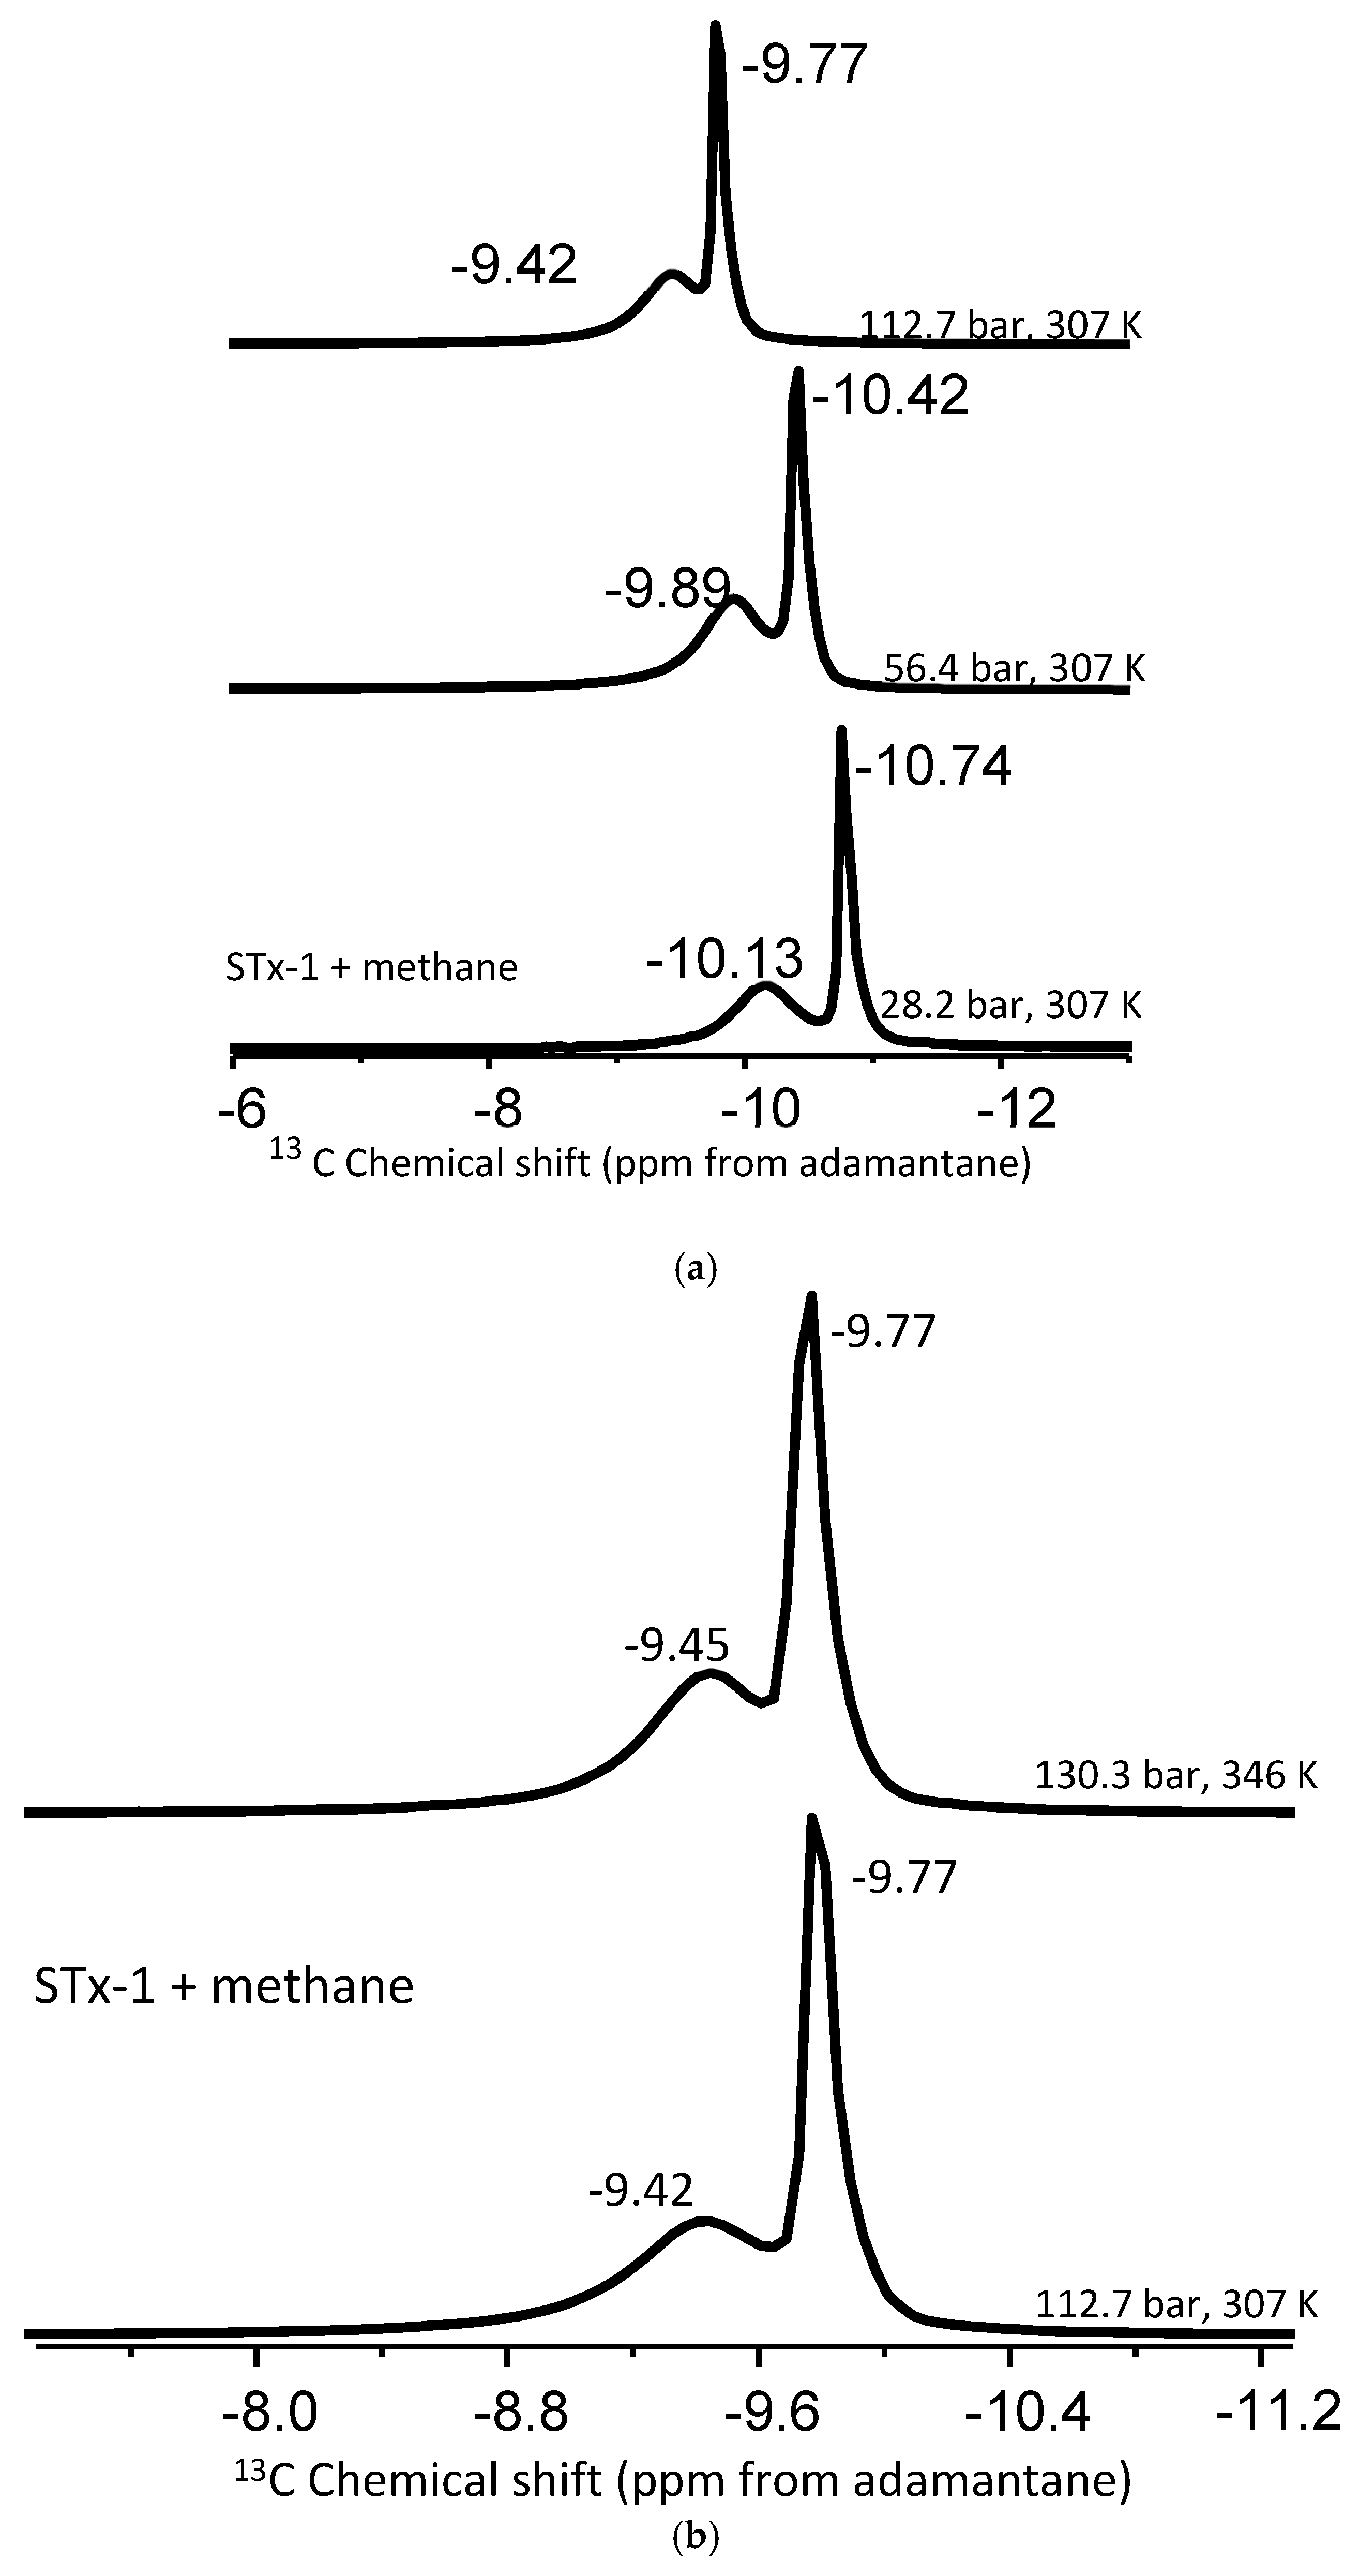
Figure 4.
(a,b). (a) Stack plot of proton-decoupled 13C NMR spectra of methane in mixture with montmorillonite acquired at a constant temperature of 307 K and pressures of 28.2 bar, 56.4 bar, and 112.7 bar. (b) Stack plot of proton-decoupled 13C NMR spectra of methane in mixture with montmorillonite acquired at a constant pressure of 28.2 bar and temperatures of 307 K and 346 K.
Pressure induces shifts in the pure methane peak position: 0.25 ppm going from 28.2 to 56.4 bar at 307 K and 0.47 ppm shift from 56.4 to 112.3 bar again at 307 K (Table 3). The change is around 0.32 ppm for “bulk-like” methane and 0.20 ppm for confined methane in a mixture with montmorillonite. However, when the pressure is increased to 130.3 from 65.1 bar at 346 K, the shift is greater than 0.50 ppm for methane peaks in the mixture with montmorillonite. For example, the bulk-like methane peak depicted a 0.64 ppm change in its position, while the confined methane had a 0.57 ppm shift. Such peak shift changes observed in the mixture of methane and montmorillonite exceed that of pure methane and are indicative of methane molecules interacting with reactive sites of the clay. The delta values summarized in Table 3 are in the same order as those observed in mesoporous silica systems [42].
Table 3.
The change in 13C isotropic chemical shift of methane as a function of pressure and temperature.
The data in Table 2, demonstrating the 13C chemical shifts in baseline experiments with pure methane, exhibit no apparent dependency in the temperature range studied between 307 K and 346 K for each of the three pressure groups—i.e., 28.2–32.6; 56.4–61.2; 112.7–130.3b. Both temperatures are well above the critical temperature of methane. Still, it undergoes a phase change from gas to supercritical at pressures above 45.992 b and an associated modest density decrease from 307 to 346 K.
Similarly, for the montmorillonite–methane mixtures, the “bulk-like” methane peak remains unchanged as a temperature function for a given pressure group. The less-intense “confined” methane peaks exhibit a very slight temperature dependence for pressures at or below 65.1 b, on the order of 0.12–0.13 ppm. The confined peaks move up the field with increased temperature (Table 2). However, it is clear the magnitude of the change in the peak position of confined methane as a function of temperature is less than the effect of pressure on the chemical shift position. Our results are valid for the temperature range only up to 346 K.
The similarity in positions of the 13C chemical shifts, intensities, and response to pressure and temperature change indicates that a higher intensity peak observed in the montmorillonite–methane system arises from “bulk-like” methane (Figure 4b), which is consistent with the literature [42,46,49]. Although there was only one 13C NMR peak of methane observed upon mixing with Ca-bentonite and kaolinite, that single peak also yielded the same response as a function of pressure and temperature as in pure methane (see Table 2). The results are valid for those cases where methane occurs as a gas or supercritical fluid. Depending on the phase diagram of methane and the possible contribution of confinement into the interlayers of montmorillonite, the thermal effect may be more pronounced.
As noted in the literature, an equilibrium exchange between “bulk-like” and confined methane molecules is expected when introduced to mesoporous silica [42,46,49]. This equilibrium may result in a dynamic equilibrium between confined and “bulk-like” methane molecules, which can manifest when two distinct peaks are observed. Furthermore, increasing pressure may cause densification that alters the chemical shift positions. For example, the study by Wu et al. [51] on the wettability influence on the adsorption attitude of nanoconfined methane showed that the ratio of bulk methane to the nanoconfined average density ranges from 0.55 to 0.71 as pressure increases. The adsorption peak density can increase up to threefold by manipulating the solid-phase wettability effect, and the adsorption volume in organic-rich shale is 1.72 times greater than in inorganic-rich shale. Due to the adsorption mechanism, the amount of methane near the solid phase can reach two to five times that in its bulk state. We propose that similar densification may occur on the natural clay surface when methane is mixed with natural clays. This densification could be reflected as a shift in the chemical shift position of methane in the 13C NMR spectra.
3.2.4. Comparison with Other Systems
It is instructive to compare the 13C chemical shift results from clay–methane interactions with others reported in the literature. The deviation of our data from the literature values is related mainly to the differences in experimental conditions, such as higher pressures up to 130.3 bar, applied in the present study. The reported value of the methane gas chemical shift is δ = −7.00 ppm [52]. In the CH4/C3H8 gas mixture, the methane peak has a chemical change δ = −8.52 ppm [47]. The methane chemical shift value was recorded between 0.00 and 5.00 ppm in mixtures with either Al- and Si-based molecular sieves, such as SAPO-11 or aluminophosphates (AlPO4-11) [45,46]. These molecular sieves have different arrangements of atoms and surface charges compared to the clays [45,47,52]. Further, the studies do not identify external or internal referencing [45,46,47,52]. In our contribution, the methane 13C NMR signal is externally referenced to the adamantane 13C NMR signal.
AlPO4-11 has no lattice charges or cations [45]. In SAPO-11 containing Al and Si, negative lattice changes are formed and compensated by cations distributed in the framework [10]. AlPO4-11 and SAPO-11 have the same framework structure of straight channels with elliptical cross sections and no interconnections. The current report has utilized expandable montmorillonite and nonexpendable kaolinite-type natural clays. Montmorillonite has an active surface area in the interlayers, while kaolinite has hydroxide groups on the external surfaces. Bentonite is also enriched with Ca2+ ions. These physical and chemical differences of subsurface natural clays used in the current study, in addition to external referencing to the adamantane signal, may contribute to the observed difference of chemical shift values of methane compared to the values reported in the literature.
Bowers et al. [19] studied methane behavior in mixtures with smectite (the natural San Bernardino hectorite) and revealed that the 13C NMR peak of methane is around −10.4 ppm in bulk. Moreover, the methane resonance appears between −10.0 and −10.3 ppm at the site of external pores. Depending on the hectorite type, such as PbH, CaH, NaH, and CsH, the “interlayer” methane peak is observed around −6.0 ppm for PbH and CaH and −8.2 and −7.8 ppm for NaH and CsH, respectively. In continuation of their efforts, Bowers et al. [16] observed three methane 13C NMR peaks assigned to bulk, the ones in mesopores and the ones in nanopores. The bulk peak appears around −10.41 ppm, while the one arising from methane molecules in mesopores is seen around −10.34 ppm. Referring to these studies, we suggest that in the current study, the second 13C NMR signal of methane in mixtures with STx-1 arises from the methane molecules inside interfacial space with mesopores [53] having different dimensions between 2 and 4 nm diameter [42]. The delta value between these two peaks is also consistent with our previous results, where the behavior of methane was studied in mixtures with nanoporous silica having a 4.0 nm pore diameter [42].
A critical consideration regarding nanoconfined geometry is the reduction in the symmetry of the 13C labeled methane [45]. Natural clays have reactive sites [27]. The interactions between methane gas molecules and the charge-compensating protons of reactive sites, such as –OH groups, are likely to contribute to a reduction in symmetry [45]. Methane adsorption on silica was studied by Fourier Transform Infrared (FT-IR) spectroscopy by Wu et al. [54]. Adsorbed methane showed three IR bands at 3008, 2904, and 1304 cm−1, which were attributed to the V1 (2904 cm−1), V3 (3008 cm−1), and V4 (1304 cm−1) modes of methane. The V1 band, forbidden in infrared vibration, indicates that the Td symmetry of the methane molecule is distorted on the silica surface.
Additionally, a slight frequency shift (30 cm−1) of the OH stretching vibration suggests a weak hydrogen-bonding interaction between hydroxyl groups and adsorbed methane [54]. Therefore, it is likely that the hydroxyl groups of natural clays reduce the symmetry of methane molecules, leading to line broadening and shifts in the chemical shift. This change in chemical shift can be understood in terms of the average electron density experienced by the 13C nucleus. When the methane molecule interacts with the hydroxyl groups on the clay surface, the electron cloud distribution around the 13C nucleus is altered due to the induced dipolar interactions and potential hydrogen bonding. These interactions reduce the electron density shielding the 13C nucleus, leading to a shift in the observed resonance frequency. Such effects directly result from the altered local electronic environment caused by methane adsorption on reactive clay surfaces.
The other possible explanation for the observed changes in chemical shift positions could be the inhomogeneous distribution of methane in mixtures with natural clays, local magnetic susceptibility, and the varying response of NMR-active nuclei to the applied magnetic field [45,55,56]. The interfacial interaction of methane within silica matrix systems may also introduce heterogeneity in the local magnetic susceptibility. Regions with different magnetic susceptibilities [57] on the external surface of control kaolinite, where the interaction between -OH groups and methane may experience varying magnetic field strengths and Larmor frequencies, thereby shifting the position of the isotropic chemical shift of methane.
3.2.5. Rates of Methane Release
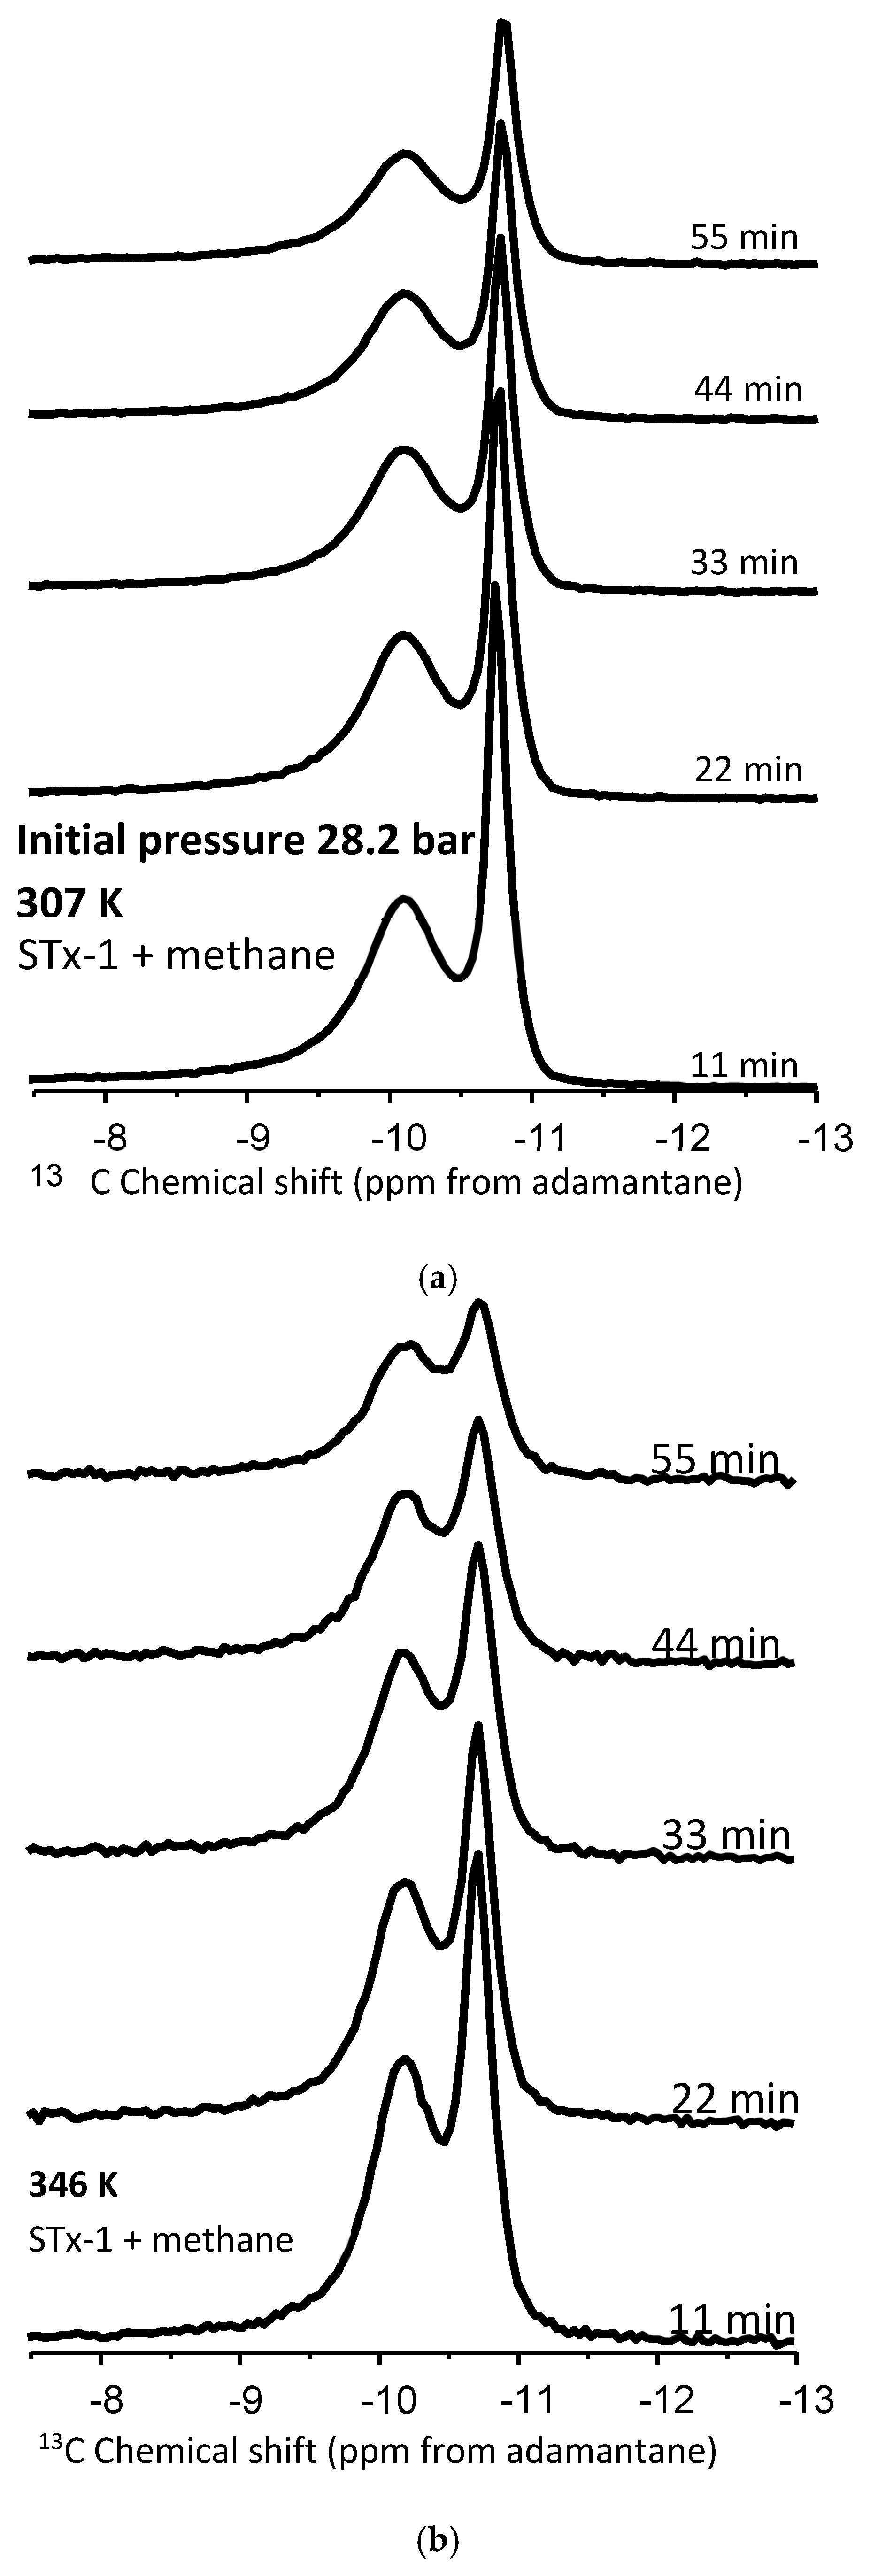
To better elucidate the nature of methane nanoconfinement in the montmorillonite/silica material, controlled pressure release experiments were conducted at the two temperatures, 307 and 346 K, and an initial pressure of 28.2 b (Figure 5a,b). The hypothesis was that we should expect the “confined” methane to be released more slowly compared to the bulk methane and hence exhibit an observable difference in peak intensity versus time—i.e., with pressure decrease. Using peak heights from Figure 5a,b, estimates were made of the fractional change as a function of time for the four experimental scenarios—bulk and confined peaks at 307 and 346 K (Figure 6). The fractional change of peak height means how the volumes of confined versus bulk-like methane decrease as a function of time during the controlled-release experiment.

Figure 5.
(a,b) Proton-decoupled 13C NMR spectra of methane in a mixture with montmorillonite acquired at 307 K and 346 K before and during the controlled release of methane as a function of time. The initial pressure was 28.2 bar.
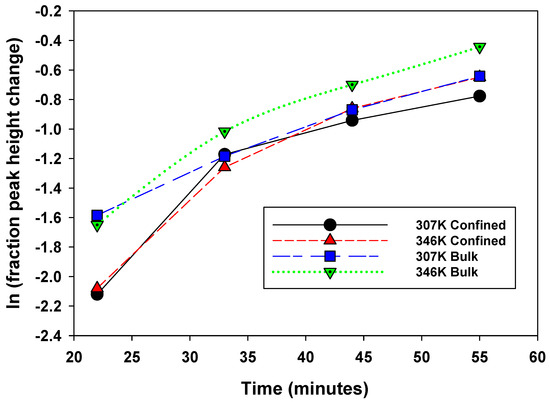
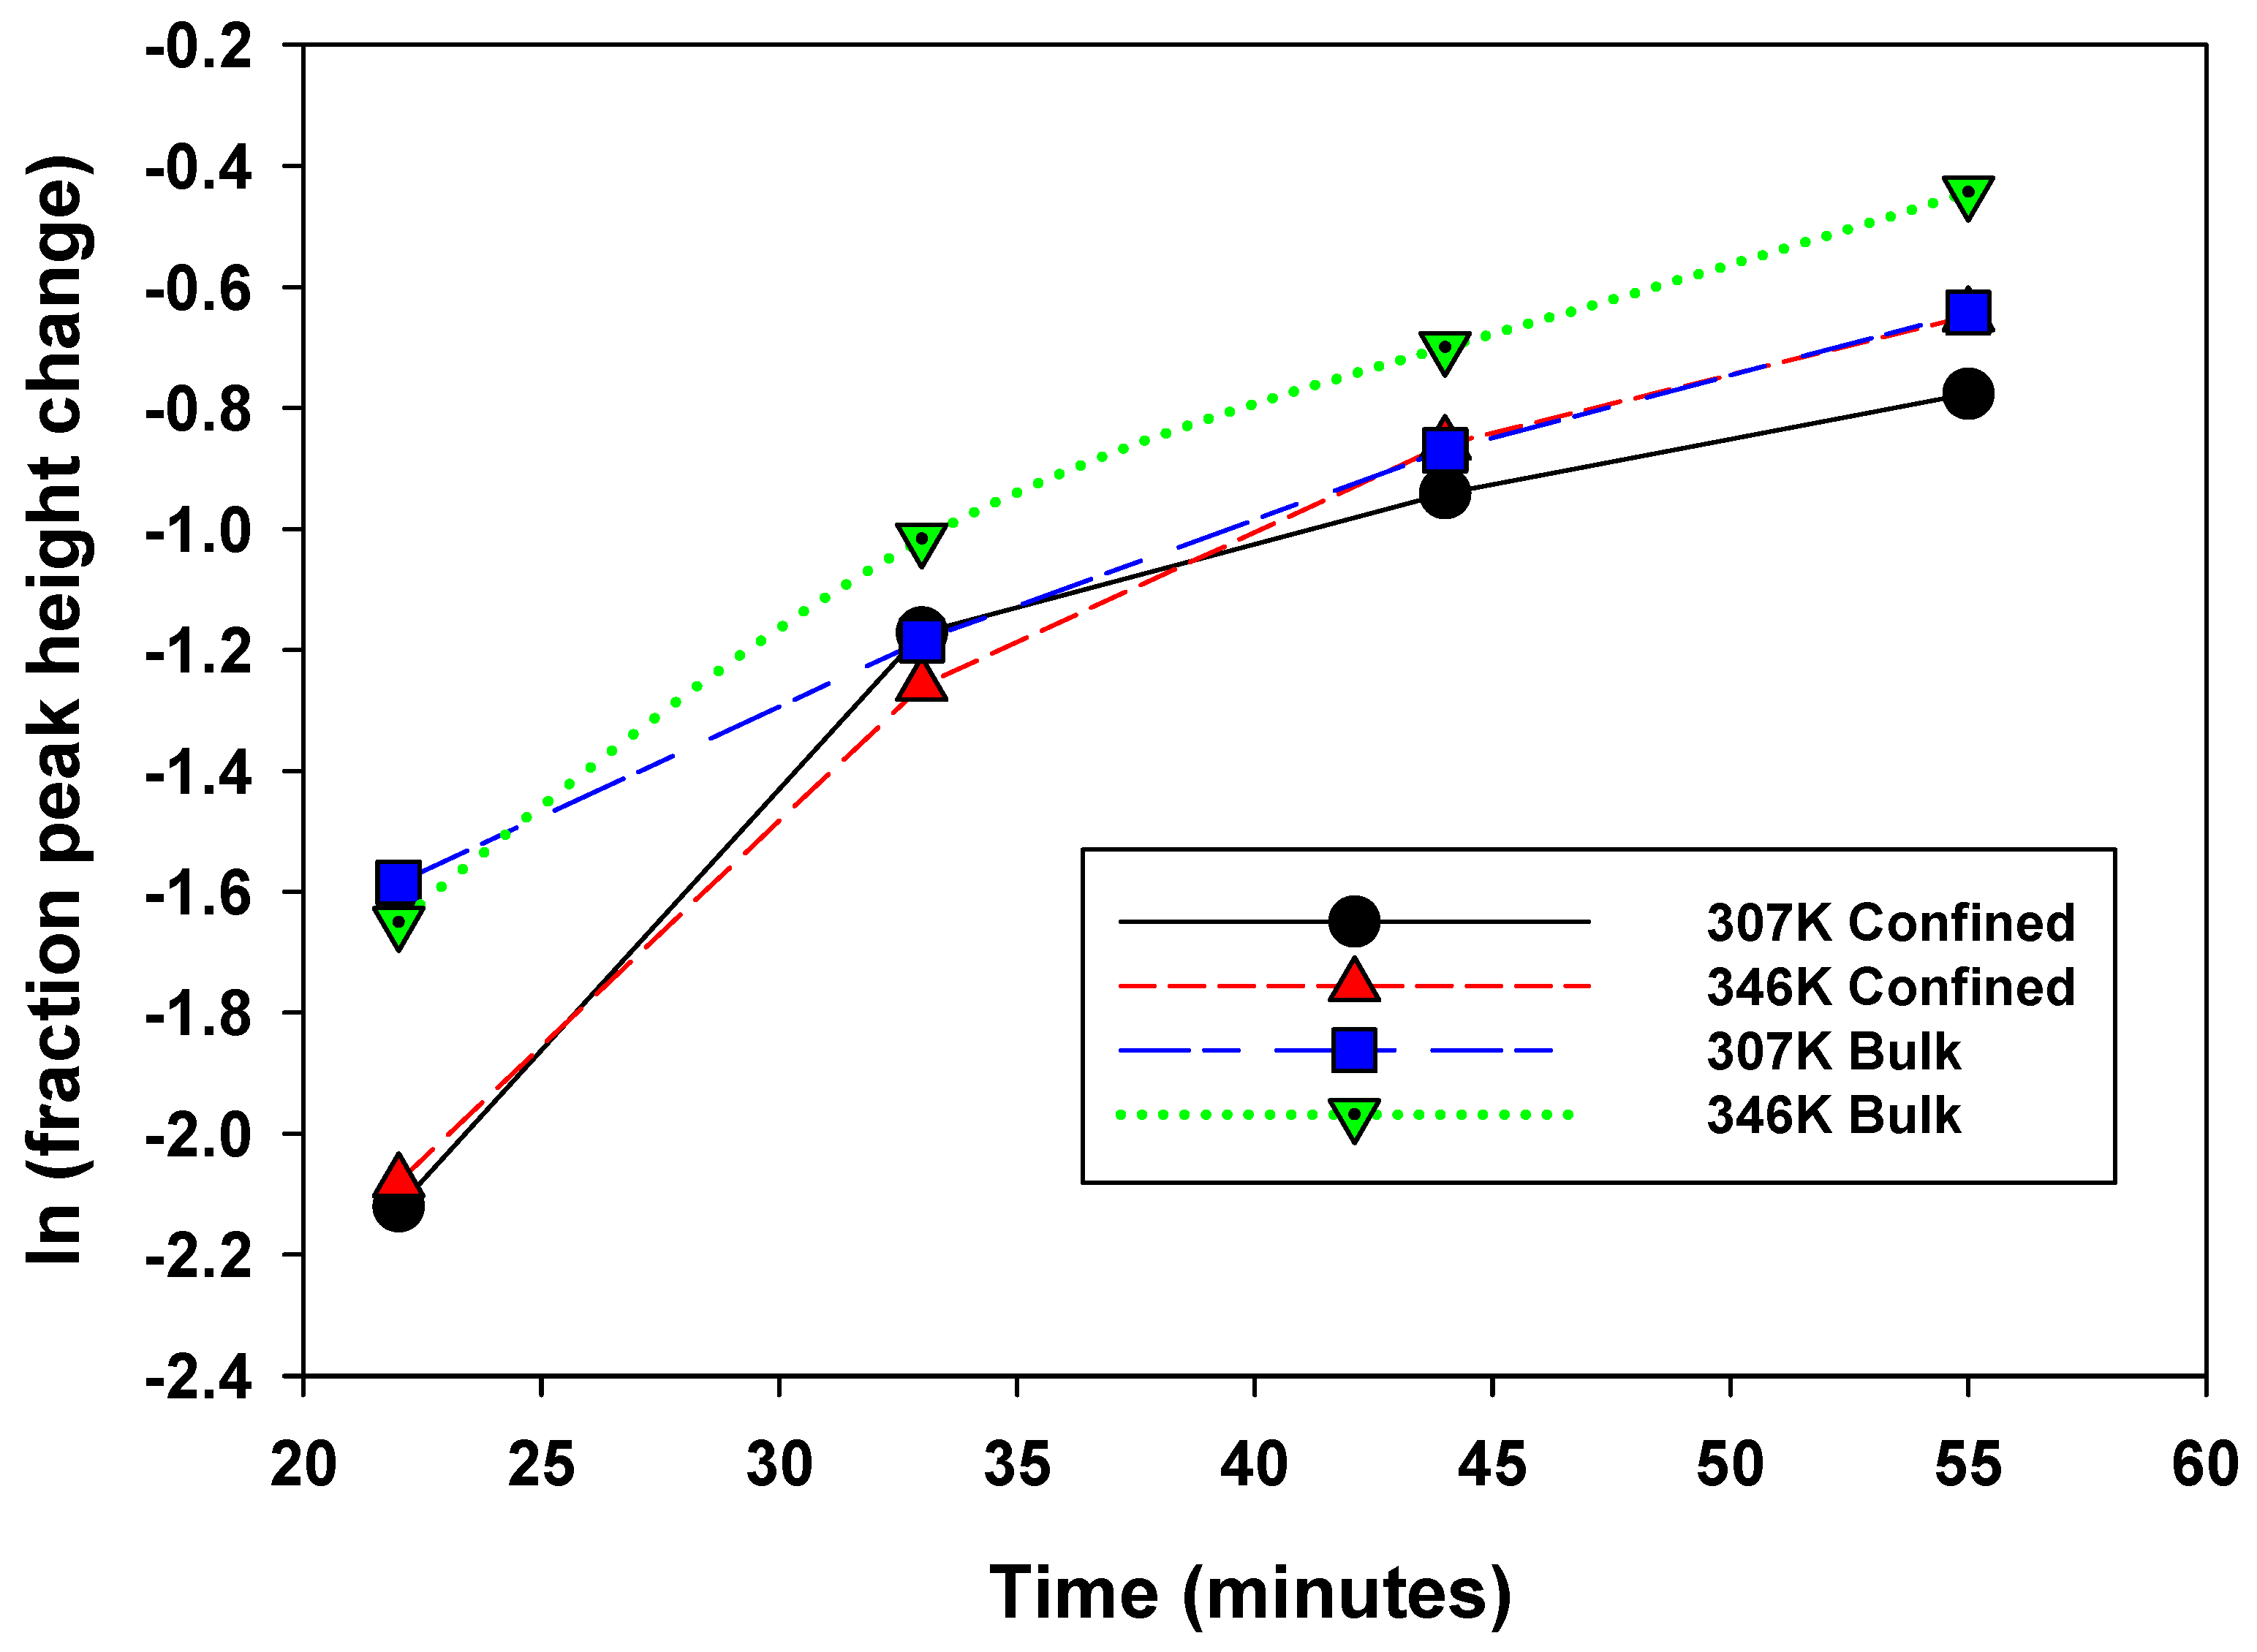
Figure 6.
Change in peak height as a function of time during the controlled release experiment. Series 1: 307 K confined, Series 2: 346 confined, Series 3: 307 K bulk, Series 4: 346 K bulk.
- (a)
- Peak intensities decrease for both types of peaks at both temperatures with increasing time as pressure is released (Figure 5a,b).
- (b)
- At 22 min, there is a clear trend where the release rates of the bulk exceed those of the confined system: fractional change in peak heights of 0.2 versus 0.12, respectively,
- (c)
- Overall, the bulk fluid’s fastest release rate is observed at 346 K.
- (d)
- The slowest release rate is observed for confined peaks at 307 K.
- (e)
- The difference between release rates for bulk at 307 and confined at 346 is not easily distinguishable.
This data comparison indicates an observable difference in release rates between bulk and confined methane, as we have defined these. That said, this behavior is not unequivocal, as we do observe some overlap. This indicates that “confined” methane is released through the clay–silica pore network more slowly than “bulk-like” methane. Such a slower release rate of “confined” methane relative to “bulk-like” methane is consistent with the assignment of the two peaks. The confinement not only retards the release of the gas molecules, it also likely hinders the translational and rotational motion of any methane gas molecules imbibed in the interlayer space of montmorillonite. These results are roughly comparable to similar release experiments conducted using 4 nm nanoporous silica reported by Ok et al. [42].
The other major issue in this controlled release experiment is how the confined fluid’s density changes as time passes. Density plays a crucial role in several classical phase transitions. In the gas–liquid and liquid–solid transitions, density is the order parameter. In addition, when a fluid is confined, the phase behavior of the fluid is changed, and excluded-volume effects become apparent. For this reason, density fluctuations in confined geometry have been reported, for instance, for water [58,59] and cyclohexane [60]. Homogeneous density fluctuations of cyclohexane have been mentioned and attributed to thermal reasons [60]. However, in the present study, the controlled release experiment was performed isothermally, and the pressure was decreased as the methane molecules were released from the montmorillonite matrix. Hence, as time passes, the ratio of methane molecules per pore volume becomes smaller. This leads to a decrease in confined methane density. This change in the density of “confined methane” does not influence the chemical shift position of the “confined methane”. Therefore, the isotropic chemical shift of confined methane was not changed during the controlled released experiment.
4. Conclusions
Methane is an essential component in natural gas [61], and the combustion of methane has significance in energy production, practical applications, and research purposes. Moreover, the recent increase in the human population motivates researchers to find new energy resources [62]. In this regard, it is vital to research methane behavior at solid interfaces in confined states by mimicking the natural environment. To fill that vital gap of a better understanding of methane behavior at solid interfaces in mixtures with natural clay minerals, the present study provides insight into the methane behavior in mixtures with clay minerals. In the pure state, no significant thermal effect was observed for the behavior of methane. A subtle change in the chemical shift position of confined methane in the mixtures with the clays up to 346 K was revealed by high-pressure 13C-NMR. Interestingly, there was only one 13C-NMR methane peak in the mixture with either kaolinite (KGa-2) or Ca-bentonite with line broadening compared to pure methane. Still, two peaks were observed in the mixture with montmorillonite (STx-1). Methane molecules can interact only with the external surfaces of kaolinite, with mainly aluminum hydroxide gibbsite-like layers. The interaction between methane molecules and the outer surfaces of kaolinite, with primarily aluminum hydroxide gibbsite-like layers, causes line broadening. Compared to the isotropic shift position of pure methane in the 13C NMR spectrum, this line broadening was accompanied by 0.15–0.28 ppm changes in the mixtures with kaolinite. Still, only a 0.05 ppm change was observed in the mixtures with purified Ca-bentonite. There was a noticeable shoulder on the single peak for the Ca-saturated montmorillonite, suggesting the imbibition of a minor amount of methane in the interlayer.
The 13C-NMR chemical shift of methane changed as a function of pressure for the range between 28.2 and 130.3 bar (from gas to supercritical state). The two peaks observed in the mixtures of methane with montmorillonite (STx-1) are assigned as “bulk-like” and “confined”. This is attributed to the densification of methane and the filling of the nanopore network present in the clay–silica mixture. The controlled pressure release experiments of methane interacting with Texas montmorillonite–silica STx-1 revealed a slower release rate of the confined methane, consistent with the sorption and densification in the complex nanopore network. The two major findings of the present work are as follows: (i) no significant thermal effect was observed on methane for the given temperature range in pure state and in mixtures with the clay minerals, and (ii) pressure has subtle influence on methane in pure state and in mixtures with the clay minerals. Moreover, methane behaves differently depending on the clay mineral. This gives insight into potential industrial applications. These results highlight methane’s unique interaction with clay surfaces and pressure-sensitive behavior, essential for optimizing gas storage, improving energy efficiency, and designing materials for carbon capture in confined systems. In other words, in setting the parameters in natural gas production, the current findings might give hints and clues on the pressure-sensitive behavior of methane for proper planning of production.
Author Contributions
Conceptualization, D.R.C. and S.O.; methodology, J.M.S., S.A.W. and S.O.; software, S.O., J.M.S. and S.A.W.; validation, D.R.C. and S.O.; formal analysis, D.R.C., S.O., J.M.S. and S.A.W.; investigation, D.R.C. and S.O.; resources, D.R.C.; data curation, D.R.C. and S.O.; writing—original draft preparation, D.R.C., S.O., J.M.S. and S.A.W.; writing—review and editing, D.R.C., S.O., J.M.S. and S.A.W.; visualization, D.R.C.; supervision, D.R.C.; project administration, D.R.C. and S.O.; funding acquisition, D.R.C. All authors have read and agreed to the published version of the manuscript.
Funding
The A.P. Sloan Foundation provided support for S.O. sponsored Deep Carbon Observatory. D.R.C., J.M.S., and S.A.W. were supported by the Department of Energy, Basic Energy Sciences Geosciences Program under Grant DE-SC0006878.
Data Availability Statement
Data are contained within the article.
Acknowledgments
The authors are grateful to David Hoyt from Pacific Northwest National Laboratory (PNNL) for the receipt of the Ca-montmorillonite sample and his help with the high-pressure MAS NMR measurements.
Conflicts of Interest
The authors declare no conflicts of interest. The funders had no role in the design of the study; in the collection, analyses, or interpretation of data; in the writing of the manuscript; or in the decision to publish the results.
References
- Gelb, L.D.; Gubbins, K.E.; Radhakrishnan, R.; Sliwinska-Bartkowiak, M. Phase Separation in Confined Systems. Rep. Prog. Phys. 1999, 62, 1573–1659. [Google Scholar] [CrossRef]
- Cole, D.R.; Striolo, A. The Influence of Nanoporosity on the Behavior of Carbon-bearing Fluids. In Deep Carbon: Past and Present; Cambridge University Press: Cambridge, UK, 2019; pp. 358–387. [Google Scholar]
- Cole, D.R.; Ok, S.; Striolo, A.; Phan, A. Hydrocarbon Behavior at Nanoscale Interfaces. Rev. Mineral. Geochem. 2013, 75, 495–545. [Google Scholar] [CrossRef]
- Cole, D.R.; Arthur, M.A. Unconventional Hydrocarbons. Elements 2014, 10, 257–296. [Google Scholar]
- Striolo, A.; Cole, D.R. Understanding Shale Gas: Recent Progress and Remaining Challenges. Energy Fuels 2017, 31, 10300–10310. [Google Scholar] [CrossRef]
- Ambrose, R.J.; Hartman, R.C.; Campos, M.D.; Akkutlu, I.Y.; Sondergeld, K. New Pore-scale Considerations for Shale Gas in Place Calculations. In Proceedings of the SPE Unconventional Gas Conference, Pittsburgh, PA, USA, 23–25 February 2010; 131772-MS. Society of Petroleum Engineers: Calgary, AB, Canada, 2010. [Google Scholar]
- Ruhle, B.; Davies, M.; Lebold, T.; Brauchle, C.; Bein, T. Highly Oriented Mesoporous Silica Channels Synthesized in Microgrooves and Visualized with Single-molecule Diffusion. ACS Nano 2012, 6, 1948–1960. [Google Scholar] [CrossRef]
- Yethiraj, A.; Striolo, A. Fracking: What Can Physical Chemistry Offer? J. Phys. Chem. Lett. 2013, 4, 687–690. [Google Scholar] [CrossRef]
- Wang, H.-J.; Mutina, A.; Kausik, R. High-Field Nuclear Magnetic Resonance Observation of Gas Shale Fracturing by Methane Gas. Energy Fuels 2014, 28, 3638–3644. [Google Scholar] [CrossRef]
- Hoyt, D.W.; Turcu, V.F.; Sears, J.A.; Rosso, K.M.; Burton, S.D.; Felmy, A.R.; Hu, J.Z. High-pressure Magic Angle Spinning Nuclear Magnetic Resonance. J. Magn. Reson. 2011, 212, 378–385. [Google Scholar] [CrossRef]
- Turcu, R.V.F.; Hoyt, D.W.; Rosso, K.M.; Sears, J.A.; Loring, J.S.; Felmy, A.R.; Hu, J.Z. Rotor Design for High-Pressure Magic Angle Spinning Nuclear Magnetic Resonance. J. Magn. Reson. 2013, 226, 64–69. [Google Scholar] [CrossRef]
- Chen, P.-H.; Gao, C.; Price, L.E.; Urban, M.A.; Popp, T.M.O.; Barnes, A.B. Two Millimeter Diameter Spherical Rotors Spinning at 68 kHz for MAS NMR. J. Magn. Res. 2021, 8–9, 100015. [Google Scholar] [CrossRef]
- Miyoshi, T.; Takegoshi, K.; Terao, T. A Simple Method for 13C CPMAS NMR Measurements under High Gas Pressures. J. Magn. Reson. 1997, 125, 383–384. [Google Scholar] [CrossRef]
- Deuchande, T.; Breton, O.; Haedelt, J.; Hughes, E. Design and Performance of a High Pressure Insert for Use in a Standard Magic Angle Spinning NMR Probe. J. Magn. Reson. 2006, 183, 178–182. [Google Scholar] [CrossRef] [PubMed]
- Bowers, G.M.; Schaef, H.T.; Loring, J.S.; Hoyt, D.W.; Burton, S.D.; Walter, E.D.; Kirkpatrick, R.J. Role of Cations in CO2 Adsorption, Dynamics, and Hydration in Smectite Clays under In Situ Supercritical CO2 Conditions. J. Phys. Chem. C 2017, 121, 577–592. [Google Scholar] [CrossRef]
- Bowers, G.M.; Schaef, H.T.; Miller, Q.R.S.; Walter, E.D.; Burton, S.D.; Hoyt, D.W.; Horner, J.A.; Loring, J.S.; McGrail, B.P.; Kirkpatrick, R.J. 13C Nuclear Magnetic Resonance Spectroscopy of Methane and Carbon Dioxide in a Natural Shale. ACS Earth Space Chem. 2019, 3, 324–328. [Google Scholar] [CrossRef]
- Bowers, G.M.; Loring, J.S.; Schaef, H.T.; Cunniff, S.S.; Walter, E.D.; Burton, S.D.; Larsen, R.K.; Miller, Q.R.; Bowden, M.E.; Ilton, E.S.; et al. Chemical Trapping of CO2 by Clay Minerals at Reservoir Conditions: Two Mechanisms Observed by in Situ High-Pressure and -Temperature Experiments. ACS Earth Space Chem. 2019, 3, 1034–1046. [Google Scholar] [CrossRef]
- Loganathan, N.; Bowers, G.M.; Yazaydin, A.O.; Schaef, H.T.; Loring, J.S.; Kalinichev, A.G.; Kirkpatrick, R.J. Clay Swelling in Dry Supercritical Carbon Dioxide: Effects of Interlayer Cations on the Structure, Dynamics, and Energetics of CO2 Intercalation Probed by XRD, NMR, and GCMD Simulations. J. Phys. Chem. C 2018, 122, 4391–4402. [Google Scholar] [CrossRef]
- Bowers, G.M.; Loring, J.S.; Schaef, H.T.; Walter, E.D.; Burton, S.D.; Hoyt, D.W.; Cunnif, S.S.; Loganathan, N.; Kirkpatrick, R.J. Interaction of Hydrocarbons with Clays at Reservoir Conditions: In situ IR and NMR Spectroscopy and X-ray Diffraction for Expandable Clays with Variably Wet Supercritical Methane. ACS Earth Space Chem. 2018, 2, 640–652. [Google Scholar] [CrossRef]
- Loring, J.S.; Schaef, H.T.; Turcu, R.V.F.; Thompson, C.J.; Miller, Q.R.S.; Martin, P.F.; Hu, J.; Hoyt, D.W.; Qafoku, O.; Ilton, E.S.; et al. In Situ Molecular Spectroscopic Evidence for CO2 Intercalation into Montmorillonite in Supercritical Carbon Dioxide. Langmuir 2012, 28, 7125–7128. [Google Scholar] [CrossRef]
- Schaef, H.T.; Loring, J.S.; Glezakou, V.-A.; Miller, Q.R.S.; Chen, J.; Owen, A.T.; Lee, M.-S.; Ilton, E.S.; Felmy, A.R.; McGrail, B.P.; et al. Competetive Sorption of CO2 and H2O in 2:1 Layer Phyllosilicates. Geochim. Cosmochim. Acta 2015, 161, 248–257. [Google Scholar] [CrossRef]
- Geist, M.F.; Boussois, K.; Smith, A.; Peyratout, C.S.; Kurth, D.G. Nanocomposites Derived from Montmorillonite and Metallosupramolecular Polyelectrolytes: Modular Compounds for Electrorheological Fluids. Langmuir 2013, 29, 1743–1747. [Google Scholar] [CrossRef]
- Zhu, R.; Chen, Q.; Liu, H.; Ge, F.; Zhu, L.; Zhu, J.; He, H. Montmorillonite as a Multifunctional Adsorbent can Simultaneously Remove Crystal Violet, Cetyltrimethylammonium, and 2-naphtol from Water. Appl. Clay Sci. 2014, 88–89, 33–38. [Google Scholar] [CrossRef]
- Bertuoli, P.T.; Piazza, D.; Scienza, L.C.; Zattera, A.J. Preparation and Characterization of Montmorillonite Modified with 3-aminopropylethoxysilane. Appl. Clay Sci. 2014, 87, 46–51. [Google Scholar] [CrossRef]
- Ji, L.; Zhang, T.; Milliken, K.L.; Qu, J.; Zhang, X. Experimental Investigation of Main Controls to Methane Adsorption in Clay-rich Rocks. Appl. Geochem. 2012, 27, 2533–2545. [Google Scholar] [CrossRef]
- Yeon, S.-H.; Seol, J.; Seo, Y.; Park, Y.; Koh, D.-Y.; Park, K.-P.; Huh, D.-G.; Lee, J.; Lee, H. Effect of Interlayer Ions on Methane Hydrate Formation in Clay Sediments. JPCB Lett. 2009, 113, 1245–1248. [Google Scholar] [CrossRef] [PubMed]
- Sanders, R.L.; Washton, N.M.; Mueller, K.T. Measurement of the Reactive Surface Area of Clay Minerals Using Solid-state NMR Studies of a Probe Molecule. J. Phys. Chem. C 2010, 114, 5491–5498. [Google Scholar] [CrossRef]
- Cheng, A.L.; Huang, W.-L. Selective Adsorption of Hydrocarbon Gases on Clays and Organic Matter. Org. Geochem. 2004, 35, 413–423. [Google Scholar] [CrossRef]
- Michalopoulos, P.; Aller, R.C. Rapid Clay Mineral Formation in Amazon Delta Sediments: Reverse Weathering and Oceanic Elemental Cycles. Science 1995, 270, 614–617. [Google Scholar] [CrossRef]
- Breen, C.; Moronta, A. Influence of Layer Charge on the Catalytic Activity of Mildly Acid-activated Tetramethylammonium-exchanged Bentonites. J. Phys. Chem. B 1999, 103, 5675–5680. [Google Scholar] [CrossRef]
- Castellini, E.; Malferrari, D.; Bernini, F.; Brigatti, M.F.; Castro, G.R.; Medici, L.; Mucci, A.; Borsari, M. Baseline Studies of the Clay Minerals Society Source Clay Montmorillonite STx-1b. Clays Clay Miner. 2017, 65, 220–233. [Google Scholar] [CrossRef]
- Chipera, S.J.; Bish, D.L. Baseline Studies of the Clay Minerals Society Source Clays: Powder X-Ray Diffraction Analyses. Clays Clay Miner. 2001, 49, 398–409. [Google Scholar] [CrossRef]
- Fatt, I. The Network Model of Porous Media. Trans. AIME 1956, 207, 144–181. [Google Scholar] [CrossRef]
- Kewen, W.; Ning, L. Numerical Simulation of Rock Pore-throat Structure Effects on NMR T2 Distribution. Appl. Geophys. 2008, 5, 86–91. [Google Scholar] [CrossRef]
- Leong, Y.-K.; Liu, P.; Au, P.-I.; Clode, P.; Liu, J. Microstructure and Time-dependent Behavior of STx-1b Calcium Montmorillonite Suspensions. Clays Clay Miner. 2021, 69, 787–796. [Google Scholar] [CrossRef]
- Thao, H.-M. Characterization of Clays and Clay Minerals for Industrial Applications: Substitution Non-Natural Additives by Clays in UV Protection. Ph.D. Thesis, Ernst-Moritz-Arndt-University Greifswald, Greifswald, Germany, 2006. [Google Scholar]
- Bhattacharyya, K.G.; SenGupta, S.; Sarma, G.K. Interactions of the Dye, Rhodamine B with Kaolinite and Montmorillonite in Water. Appl. Clay Sci. 2014, 99, 7–17. [Google Scholar] [CrossRef]
- Ilton, E.S.; Schaef, H.T.; Qafoku, O.; Rosso, K.M.; Felmy, A.R. In situ X-ray Diffraction Study of Na+ Saturated Montmorillonite Exposed to Variably Wet Supercritical CO2. Environ. Sci. Technol. 2012, 46, 4241–4248. [Google Scholar] [CrossRef]
- Schaef, H.T.; Ilton, E.S.; Qafoku, O.; Martin, P.F.; Felmy, A.R.; Rosso, K.M. In situ XRD Study of Ca2+ Saturated Montmorillonite (STX-1) Exposed to Anhydrous and Wet Supercritical Carbon Dioxide. Int. J. Greenh. Gas Control 2012, 6, 220–229. [Google Scholar] [CrossRef]
- Bielecki, A.; Burum, D.P. Temperature Dependence of 207Pb MAS Spectra of Solid Lead Nitrate. An Accurate, Sensitive Thermometer for Variable-Temperature MAS. J. Magn. Reson. Ser. A 1995, 116, 215–220. [Google Scholar] [CrossRef]
- Langer, B.; Schnell, I.; Spiess, H.W.; Grimmer, A.-R. Temperature Calibration under Ultrafast MAS Conditions. J. Magn. Reson. 1999, 138, 182–186. [Google Scholar] [CrossRef]
- Ok, S.; Hoyt, D.W.; Andersen, A.; Sheets, J.; Welch, S.; Cole, D.R.; Mueller, K.; Washton, N.M. Surface Interactions and Confinement of Methane: A High Pressure Magic Angle Spinning NMR and Computational Chemistry Study. Langmuir 2017, 33, 1359–1367. [Google Scholar] [CrossRef]
- Thermophysical Properties of Fluid Systems. Available online: http://webbook.nist.gov/chemistry/fluid/ (accessed on 13 February 2025).
- Widjaja, B.; Inkiriwang, C.B. Empirical Correlations among Liquid Limit, Clay Fraction, and Specific Surface Area for Kaolin and Calcium Bentonite Compounded Samples. In Proceedings of the Fifth International Conference on Advances in Civil and Structural Engineering—CSE 13 March 2016, Kuala Lumpur, Malaysia, 12–13 March 2016; pp. 42–44. [Google Scholar]
- Koskela, T.; Ylihautala, M.; Vaara, J.; Jokisaari, J. 13C NMR Spectroscopy of Methane Adsorbed in SAPO-11 Molecular Sieve. Chem. Phys. Lett. 1996, 261, 425–430. [Google Scholar] [CrossRef]
- Koskela, T.; Ylihautala, M.; Jokisaari, J.; Vaara, J. C-13 NMR of Methane in an AlPO4-11 Molecular Sieve: Exchange Effects and Shielding Anisotropy. Phys. Rev. B 1998, 58, 14833–14836. [Google Scholar] [CrossRef]
- Fleyfel, F.; Song, K.Y.; Kook, A.; Martin, R.; Kobayashi, R. Interpretation of C-13 NMR of Methane Propane Hydrates in the Metastable Nonequilibrium Region. J. Phys. Chem. 1993, 97, 6722–6725. [Google Scholar] [CrossRef]
- Loring, J.S.; Ilton, E.S.; Chen, J.; Thompson, C.J.; Martin, P.F.; Benezeth, P.; Rosso, K.M.; Felmy, A.R.; Schaef, H.T. In Situ Study of CO2 and H2O Partitioning between Na-Montmorillonite and Variably Wet Supercritical Carbon Dioxide. Langmuir 2014, 30, 6120–6128. [Google Scholar] [CrossRef] [PubMed]
- Ok, S.; Gautam, S.; Liu, K.-H.; Cole, D.R. Surface Interactions and Nanoconfinement of Methane and Methane plus CO2 Revealed by High-Pressure Magic Angle Spinning NMR Spectroscopy and Molecular Dynamics. Membranes 2022, 12, 1273. [Google Scholar] [CrossRef] [PubMed]
- Bish, D. (Department of Chemistry at Indiana University Bloomington, Bloomington, IN, USA). Personal communication, 2024.
- Wu, S.; Luo, W.; Fang, S.; Sun, Z.; Yan, S.; Li, Y. Wettability Impact on Nanoconfined Methane Adsorption Behavior: A Simplified Local Density Investigation. Energy Fuels 2022, 36, 14204–14219. [Google Scholar] [CrossRef]
- Jameson, A.K.; Jameson, C.J. Gas-Phase 13C Chemical Shifts in the Zero-Pressure Limit: Refinements to the Absolute Shielding Scale for 13C. Chem. Phys. Lett. 1987, 134, 461–466. [Google Scholar] [CrossRef]
- Ok, S. Low-field NMR Investigations on Dynamics of Crude Oil Confined into Nanoporous Silica Rods and White Powder. Front. Chem. 2023, 11, 1087474. [Google Scholar] [CrossRef]
- Wu, J.; Li, S.; Li, G.; Li, C.; Xin, Q. FT-IR Investigation of Methane Adsorption on Silica. Appl. Surf. Sci. 1994, 81, 37–41. [Google Scholar] [CrossRef]
- Terenzi, C.; Dvinskikh, S.V.; Furo, I. Wood Microstructure Explored by Anisotropic H-1 NMR Line Broadening: Experiments and Numerical Simulations. J. Phys. Chem. B 2013, 117, 8620–8632. [Google Scholar] [CrossRef]
- Bonardet, J.L.; Fraissard, J.P. Method of Correcting Chemical Shifts of Adsorbate Molecules for Adsorbent Susceptibility. J. Magn. Reson. 1976, 22, 543–548. [Google Scholar] [CrossRef]
- Schurr, J.M. Phenomena Associated with Gel-Water Interfaces. Analyses and Alternatives to the Long-Range Ordered Water Hypothesis. J. Phys. Chem. B 2013, 117, 7653–7674. [Google Scholar] [CrossRef] [PubMed]
- Perret, E.; Nygard, K.; Satapathy, D.K.; Balmer, T.E.; Bunk, O.; Heuberger, M.; van der Veen, J.F. Molecular Liquid under Nanometre Confinement: Density Profiles Underlying Oscillatory Forces. J. Phys.-Cond. Matt. 2010, 22, 235102. [Google Scholar] [CrossRef] [PubMed]
- Zhang, Y.; Faraone, A.; Kamitakahara, W.A.; Liu, K.H.; Mour, C.Y.; Leao, J.B.; Chang, S.; Chen, S.H. Density Hysteresis of Heavy Water Confined in a Nanoporous Silica Matrix. Proc. Natl. Acad. Sci. USA 2011, 108, 12206–12211. [Google Scholar] [CrossRef] [PubMed]
- Heuberger, M.; Zach, M.; Spencer, N.D. Density Fluctuations under Confinement: When is a Fluid not a Fluid? Science 2001, 292, 905–908. [Google Scholar] [CrossRef]
- Zettervall, N.; Fureby, C.; Nilsson, E.J.K. Evaluation of Chemical Kinetic Mechanisms for Methane Combustion: A Review from a CFD Perspective. Fuels 2021, 2, 210–240. [Google Scholar] [CrossRef]
- Lackner, M.; Fei, Q.; Guo, S.; Yang, N.; Guan, X.; Hu, P. Biomass Gasification as a Scalable, Green Route to Combined Heat and Power (CHP) and Synthesis Gas for Materials: A Review. Fuels 2024, 5, 625–649. [Google Scholar] [CrossRef]


Disclaimer/Publisher’s Note: The statements, opinions and data contained in all publications are solely those of the individual author(s) and contributor(s) and not of MDPI and/or the editor(s). MDPI and/or the editor(s) disclaim responsibility for any injury to people or property resulting from any ideas, methods, instructions or products referred to in the content. |
© 2025 by the authors. Licensee MDPI, Basel, Switzerland. This article is an open access article distributed under the terms and conditions of the Creative Commons Attribution (CC BY) license (https://creativecommons.org/licenses/by/4.0/).