Article

Impact of Hyperferritinemia on Immune Modulation in Septic Diabetic Patients

1
Department of Internal Medicine, Kyungpook National University Chilgok Hospital, School of Medicine, Kyungpook National University, Daegu 41404, Republic of Korea
2
Department of Anatomy, School of Medicine, Daegu Catholic University, Daegu 42472, Republic of Korea
3
Department of Internal Medicine, Kyungpook National University Hospital, School of Medicine, Kyungpook National University, Daegu 41944, Republic of Korea
*
Author to whom correspondence should be addressed.
Diabetology 2024, 5(3), 344-355; https://doi.org/10.3390/diabetology5030026
Submission received: 19 July 2024 / Revised: 1 August 2024 / Accepted: 5 August 2024 / Published: 8 August 2024
(This article belongs to the Special Issue Feature Papers in Diabetology 2024)

Abstract

:
Diabetes significantly impacts the immune system; however, its role in worsening sepsis prognosis remains poorly understood. This study investigated the effect of hyperferritinemia on immune modulation in septic diabetic patients. A cohort study at Kyungpook National University Hospital stratified sepsis patients by diabetes status and followed them for 28 days. Additionally, CD4+ T cells from mice were analyzed for proliferation, apoptosis, and metabolic changes under ferritin treatment. Results from the clinical study showed higher ferritin levels in diabetic patients, and those with lower lymphocyte counts had increased mortality. In the mice study, ferritin inhibited T cell activation and proliferation by shifting metabolism from glycolysis to oxidative phosphorylation without increasing cell death. These findings suggest that the suppression of T cell proliferation due to elevated ferritin levels contributes to an immunosuppressive environment, leading to worse outcomes. In conclusion, hyperferritinemia is a biomarker for sepsis severity, particularly in diabetic patients, highlighting potential therapeutic strategies targeting ferritin levels or glycolytic pathways.

1. Introduction

Diabetes, especially type 2 diabetes mellitus (DM), is a metabolic disorder involving hyperglycemia, insulin resistance, and relative insulin deficiency. It can significantly affect immune cell function [1]. It disrupts normal immune responses by impairing the function of crucial immune cells, particularly affecting the dynamics of T cells [2,3]. These T cells are essential for adaptive immunity and cytokine secretion [4]. Excessive glucose can lead to the overproduction of proinflammatory cytokines, creating an imbalance that can result in impaired immune responses and various pathological conditions.
Hyperferritinemia is often observed in septic patients, particularly those with diabetes, due to the chronic inflammatory state and altered iron metabolism associated with diabetes [1,5]. It may play a significant role in immune regulation [5]. Elevated ferritin levels during sepsis are emerging as a crucial host defense mechanism, inhibiting bacterial growth and protecting immune cells [6]. However, hyperferritinemia is associated with an increased risk of in-hospital mortality among patients with sepsis and may also be linked to suppressed immune regulation [5], although overall prognosis in diabetic septic patients and how elevated ferritin affects T cell function remain unclear.
This study investigated whether increased ferritin levels in diabetic septic patients are associated with immune cell function suppression, particularly affecting T cells, and if they contribute to higher mortality rates. Changes in immune cell metabolic processes in septic patients with hyperferritinemia and how ferritin increase as part of the host–cell protection mechanism might suppress inflammatory cell activity were determined. Understanding this relationship could highlight ferritin as a significant biomarker for sepsis severity, particularly in diabetic patients.

2. Materials and Methods

2.1. Participants and Study Design

This was a cohort study involving patients with sepsis over 18 years of age diagnosed through the emergency department of Kyungpook National University Hospital. This study was approved by the Institutional Review Board (IRB) of Kyungpook National University Hospital (IRB no. KNUH 2020-09-020-001). Patients diagnosed with sepsis or septic shock according to the SEPSIS-3 diagnostic criteria [7] were enrolled from September 2020 to September 2023. Diabetes was defined as a history of taking diabetes medication or having a glycated hemoglobin (HbA1c) level of 6.5% or higher. Mortality was defined as death occurring within 28 days from the date of emergency department admission. Laboratory results were obtained at the time of emergency department admission.

2.2. Primary Culture

Male C57BL/6J mice aged eight weeks (mean weight: 20 g) were obtained from DooYeol Biotech in Seoul, South Korea. All animal procedures were performed in accordance with protocols sanctioned by Kyungpook National University (Permit Number: 2019-0003), ensuring adherence to guidelines for appropriate use and care of animals in specific pathogen-free facilities at Kyungpook University. Spleens were collected under isoflurane anesthesia for isolating CD4+ T cells.

2.3. CD4+ T Cell Isolation

CD4+ T cells were isolated from spleens of C57BL/6J mice using a CD4+ T Cell Isolation Kit (Miltenyi Biotec, Bergisch Gladbach, Germany). Spleens were processed into single-cell suspensions using mechanical dissociation. Each spleen cell suspension was incubated at 4 °C with a biotin–antibody cocktail containing monoclonal antibodies against CD8a, CD11b, CD11c, CD19, CD45R (B220), CD49b (DX5), CD105, Anti-MHC Class II, Ter-119, and TCRγ/δ, followed by incubation with anti-biotin microbeads. After incubation, the cell suspension was passed through an LS column placed in a magnetic field of an MACS separator (Miltenyi Biotec). The column was washed with phosphate-buffered saline (PBS) containing 0.5% bovine serum albumin (BSA) and 2 mM EDTA to collect an unlabeled fraction representing enriched CD4+ T cells. These isolated CD4+ T cells were used for subsequent assays.

2.4. qRT-PCR

Total RNA was extracted from CD4+ T cells and cDNA was synthesized using a RevertAid First Strand cDNA Synthesis Kit (Thermo Fisher Scientific, Waltham, MA, USA). Quantitative real-time PCR was performed with SYBR Green qPCR Master Mix on a QuantStudio™ 5 Real-Time PCR System. The PCR protocol consisted of an initial denaturation step at 95 °C for 10 min, followed by 40 cycles of denaturation at 95 °C for 15 s and annealing/extension at 60 °C for 1 min. Gene expression was quantified using the delta–delta Ct method, with glyceraldehyde 3-phosphate dehydrogenase (GAPDH) serving as the housekeeping gene for normalization. Results are presented as relative mRNA levels compared to control samples set as the baseline.

2.5. qRT-PCR Primer Sequences

For quantitative real-time PCR, the following specific primer pairs were used to amplify target genes: mHK2 (Forward: AGAAGGATGAAGGTGGAAATGGA, Reverse: CTGGAGTGGCACACACATAAGTG), mLDHa (Forward: GGATGAGCTTGCCCTTGTTG, Reverse: ATCCATCATCTCGCCCTTGA), mPKM2 (Forward: GGTGACCTGGGCATTGAGA, Reverse: TCGCCCGATCATCATCTTCT), mEno1 (Forward: TACCGCCACATTGCTGACTTGG, Reverse: GCTTGTTGCCAGCATGAGAACC), mNdufv1 (Forward: GTGGAGGAAGAGATGTCTGTGC, Reverse: ATGAGCCACCAGGAATCACAGC), mPGC1a (Forward: GAATCAAGCCACTACAGACACCG, Reverse: CATCCCTCTTGAGCCTTTCGTG), mCox6a2 (Forward: GCTCCCTTAACTGCTGGATGCA, Reverse: TGGAAAAGCGTGTGGTTGCCGT), and the housekeeping gene mGAPDH (Forward: CATCACTGCCACCCAGAAGACTG, Reverse: ATGCCAGTGAGCTTCCCGTTCAG).

2.6. Flow Cytometry

Cells were stained using PE-Cy7-conjugated anti-CD4, APC-labeled anti-IFNγ, PerCP Cy5.5-conjugated anti-IL17, and FITC-labeled anti-IL4 antibodies (BioLegend, San Diego, CA, USA). Reactive oxygen species (ROS) quantification was conducted with a DCFDA cellular ROS detection assay kit (Abcam, Cambridge, UK). Lipid peroxidation was measured using C11-BODIPY 581/591 (Thermo Fisher Scientific, MA, USA). CD4+ T cells were identified after intracellular staining using a Fixation/Permeabilization Solution Kit (BioLegend, San Diego, CA, USA). All flow cytometry data were collected and processed using a FACS LSR Fortessa system. Data were analyzed with BD CELL Quest Pro software, version 5.1.

2.7. Proliferation Analysis

Mouse spleen cells were used to isolate CD4+ T cells for T cell proliferation analysis. CFSE-labeled CD4+ T cells were incubated in 24-well plates in RPMI 1640 medium using a CellTrace CFSE Cell Proliferation Kit (Thermo). Analysis was performed using a flow cytometer with 488 nm excitation and emission filters.

2.8. Measurement of Oxygen Consumption Rate (OCR)

OCR was assessed using a Seahorse XF-96 Flux Analyzer (Seahorse Biosciences, Billerica, MA, USA). Cells were cultured in RPMI1640 supplemented with 10% fetal bovine serum (FBS) along with penicillin and streptomycin. Isolated CD4+ T cells were incubated at an activated density of 2 × 10⁵ cells per well in CD3-coated plates with or without ferritin for 48 h. These cells were then reseeded into XF-96 plates before OCR measurement. The assay utilized an XF base medium from Seahorse Biosciences, which was supplemented with 5.5 mM D-glucose (Sigma-Aldrich, St. Louis, MO, USA), 1 mM sodium pyruvate (Sigma-Aldrich), and 1× GlutaMAX™ (Gibco, St. Louis, MO, USA) with pH adjusted to 7.4. The experiment involved the application of specific inhibitors in defined concentrations: 2 μmol/L of oligomycin A (Sigma-Aldrich) to inhibit ATP synthase impacting cellular ATP production and consequently lowering OCR; 1 μmol/L FCCP (Sigma-Aldrich), an uncoupling agent to evaluate spare respiratory capacity; and a combination of 3 μmol/L rotenone (Sigma-Aldrich), a complex I inhibitor, with 3 μmol/L antimycin A (Sigma-Aldrich), a complex III inhibitor, to cease mitochondrial respiration and measure non-mitochondrial respiratory activity.

2.9. Statistical Analysis

All data are presented as mean ± SD of 3~4 independent experiments. Individual data points were compared using Student’s t-test. Analysis was performed using R software (version 4.0.3). Differences between groups were considered significant at p < 0.05.

3. Results

3.1. High Ferritin Levels in Diabetic Patients Are Associated with Lymphopenia and Increased Mortality Rates

A total of 261 sepsis patients who presented to the emergency department of Kyungpook National University Hospital were analyzed. They were stratified by diabetes status. In our cohort, diabetic patients exhibited significantly higher ferritin levels than non-diabetic patients (diabetic: 1945.1 ± 329.6 ng/mL; non-diabetic: 907.3 ± 250.8 ng/mL; p = 0.021) (Figure 1a and Table 1). Several variables also showed statistically significant differences between the two groups. Diabetic patients had lower lymphocyte counts (1.2 ± 1.6 × 10³/µL) than non-diabetic patients (2.1 ± 3.6 × 10³/µL, p = 0.007). They also had lower platelet counts (180.5 ± 141.5 × 10³/µL) than non-diabetic patients (244.8 ± 135.2 × 10³/µL, p = 0.001). Additionally, diabetic patients showed higher CRP levels (14.8 ± 12.2 mg/L) than non-diabetic patients (8.7 ± 10.0 mg/L, p < 0.001) (Table 1).
The predicted probability of death within 28 days relative to ferritin levels revealed an increase in mortality risk associated with higher ferritin levels (Figure 1b). There was a weak negative correlation between lymphocyte counts and ferritin levels (R2 = 0.020, p = 0.03), indicating that higher ferritin levels were associated with lymphocytopenia, although the correlation strength is low (Figure 1c). However, hyperferritinemia in acute sepsis does not correlate strongly with serum iron levels (R2 = 0.060, p = 0.682) or transferrin saturation (R2 = −0.014, p = 0.926), indicating that ferritin levels do not consistently reflect these iron parameters (Supplementary Figure S1). There was a significant difference in ferritin level between survivors and non-survivors, with non-survivors having markedly higher levels (Figure 1d). Diabetic patients with lower lymphocyte counts (<950/µL) had significantly (p = 0.001) higher mortality rates compared to those with higher lymphocyte counts (≥950/µL) (Figure 1e). These findings suggest that elevated ferritin levels and reduced lymphocyte counts in diabetic sepsis patients may be more indicative of the increased severity of sepsis rather than a direct effect of diabetes and are associated with higher mortality and impaired immune function. Thus, hyperferritinemia could serve as an important biomarker for assessing sepsis severity and prognosis, particularly in diabetic patients.

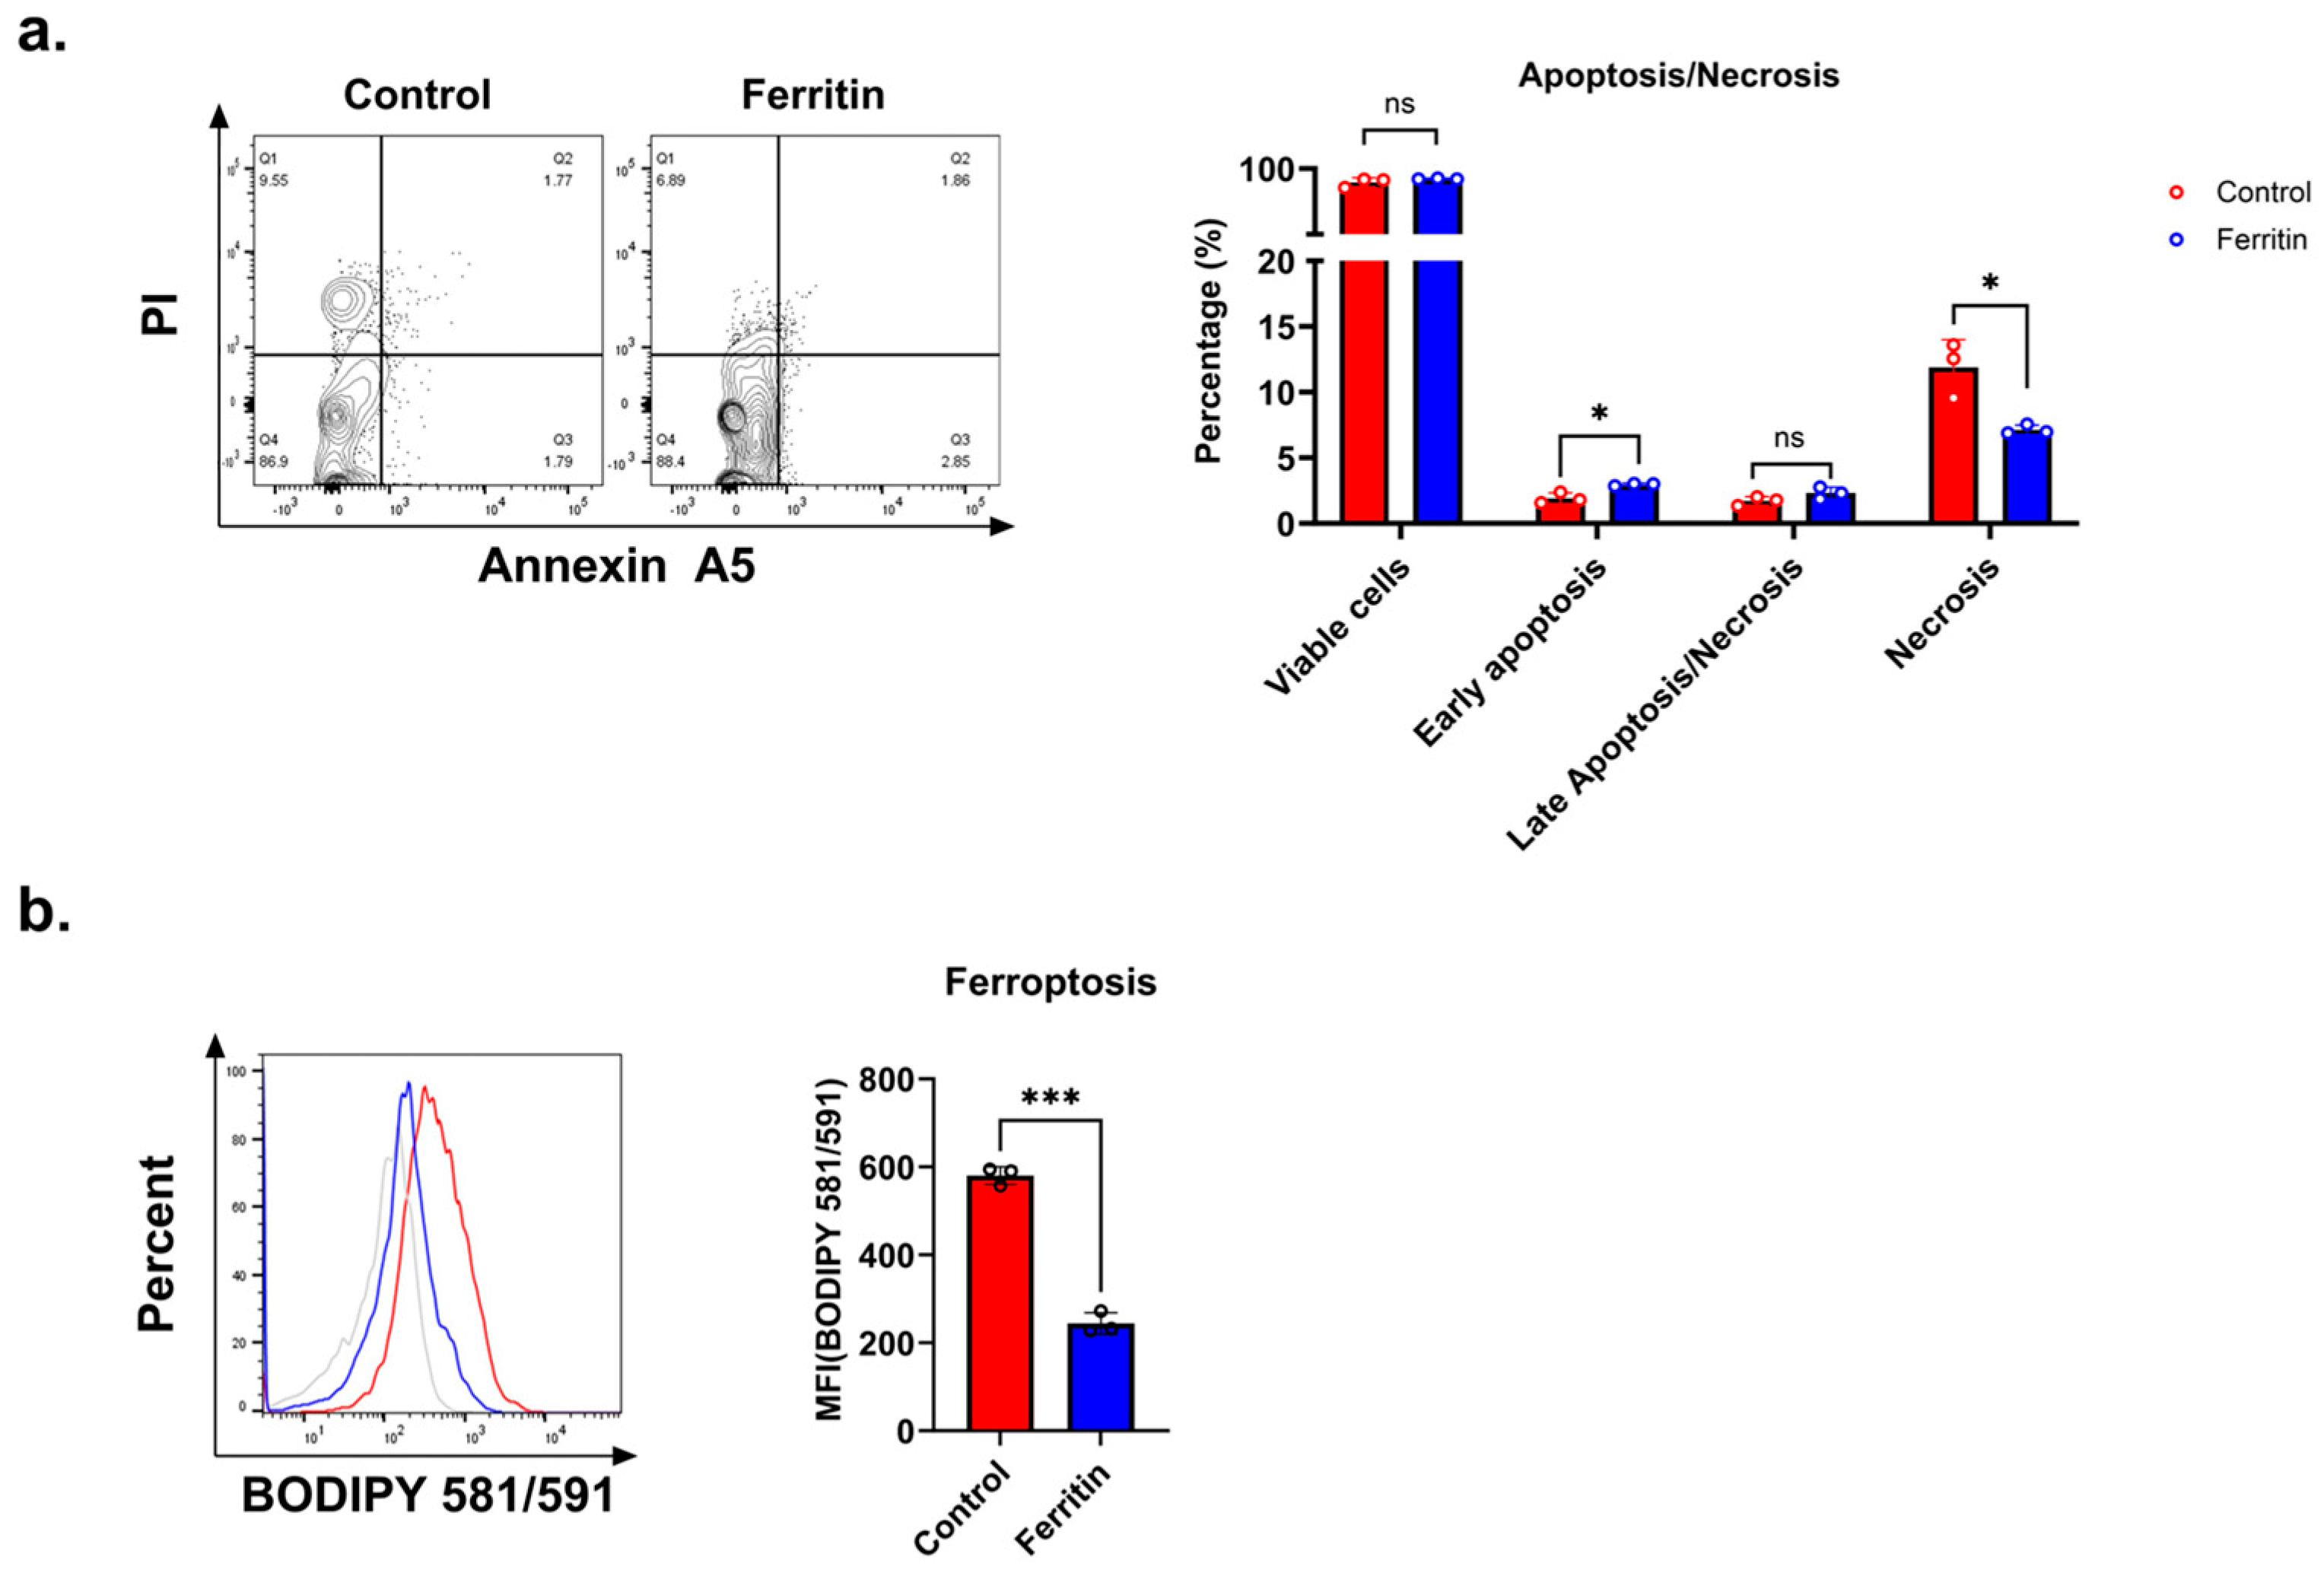
3.2. Elevated Ferritin Levels Do Not Directly Cause Increased CD4+ T Cell Death

To investigate whether ferritin-induced lymphopenia was related to increased cell death, we analyzed CD4+ T cells that were isolated, activated on CD3-coated plates, and cultured with or without ferritin for 48 h using Annexin A5 and PI staining followed by flow cytometry analysis. As shown in Figure 2a, the percentage of viable cells (Annexin A5−/PI−) was not significantly different between control and ferritin-treated groups, indicating that ferritin did not reduce overall cell viability. The proportion of early apoptotic cells (Annexin A5+/PI−) was slightly elevated in the ferritin-treated group compared to that in the control. However, the necrotic cell population (Annexin A5−/PI+) was significantly lower in the ferritin-treated group, while the late apoptotic/necrotic cell population (Annexin A5+/PI+) did not show a significant difference between the two groups.
To further understand the type of cell death involved, we measured lipid peroxidation levels using BODIPY 581/591 staining to assess ferroptosis. As shown in Figure 2b, ferritin-treated cells had a significantly lower mean fluorescence intensity (MFI) of BODIPY than control cells, indicating a reduction in ferroptosis.
These findings suggested that ferritin did not increase CD4+ T cell death. Instead, ferritin treatment reduced necrosis and ferroptosis, implying that the lymphopenia observed in diabetic patients with high ferritin levels was not due to enhanced CD4+ T cell death but likely due to other mechanisms such as the suppression of cell proliferation.

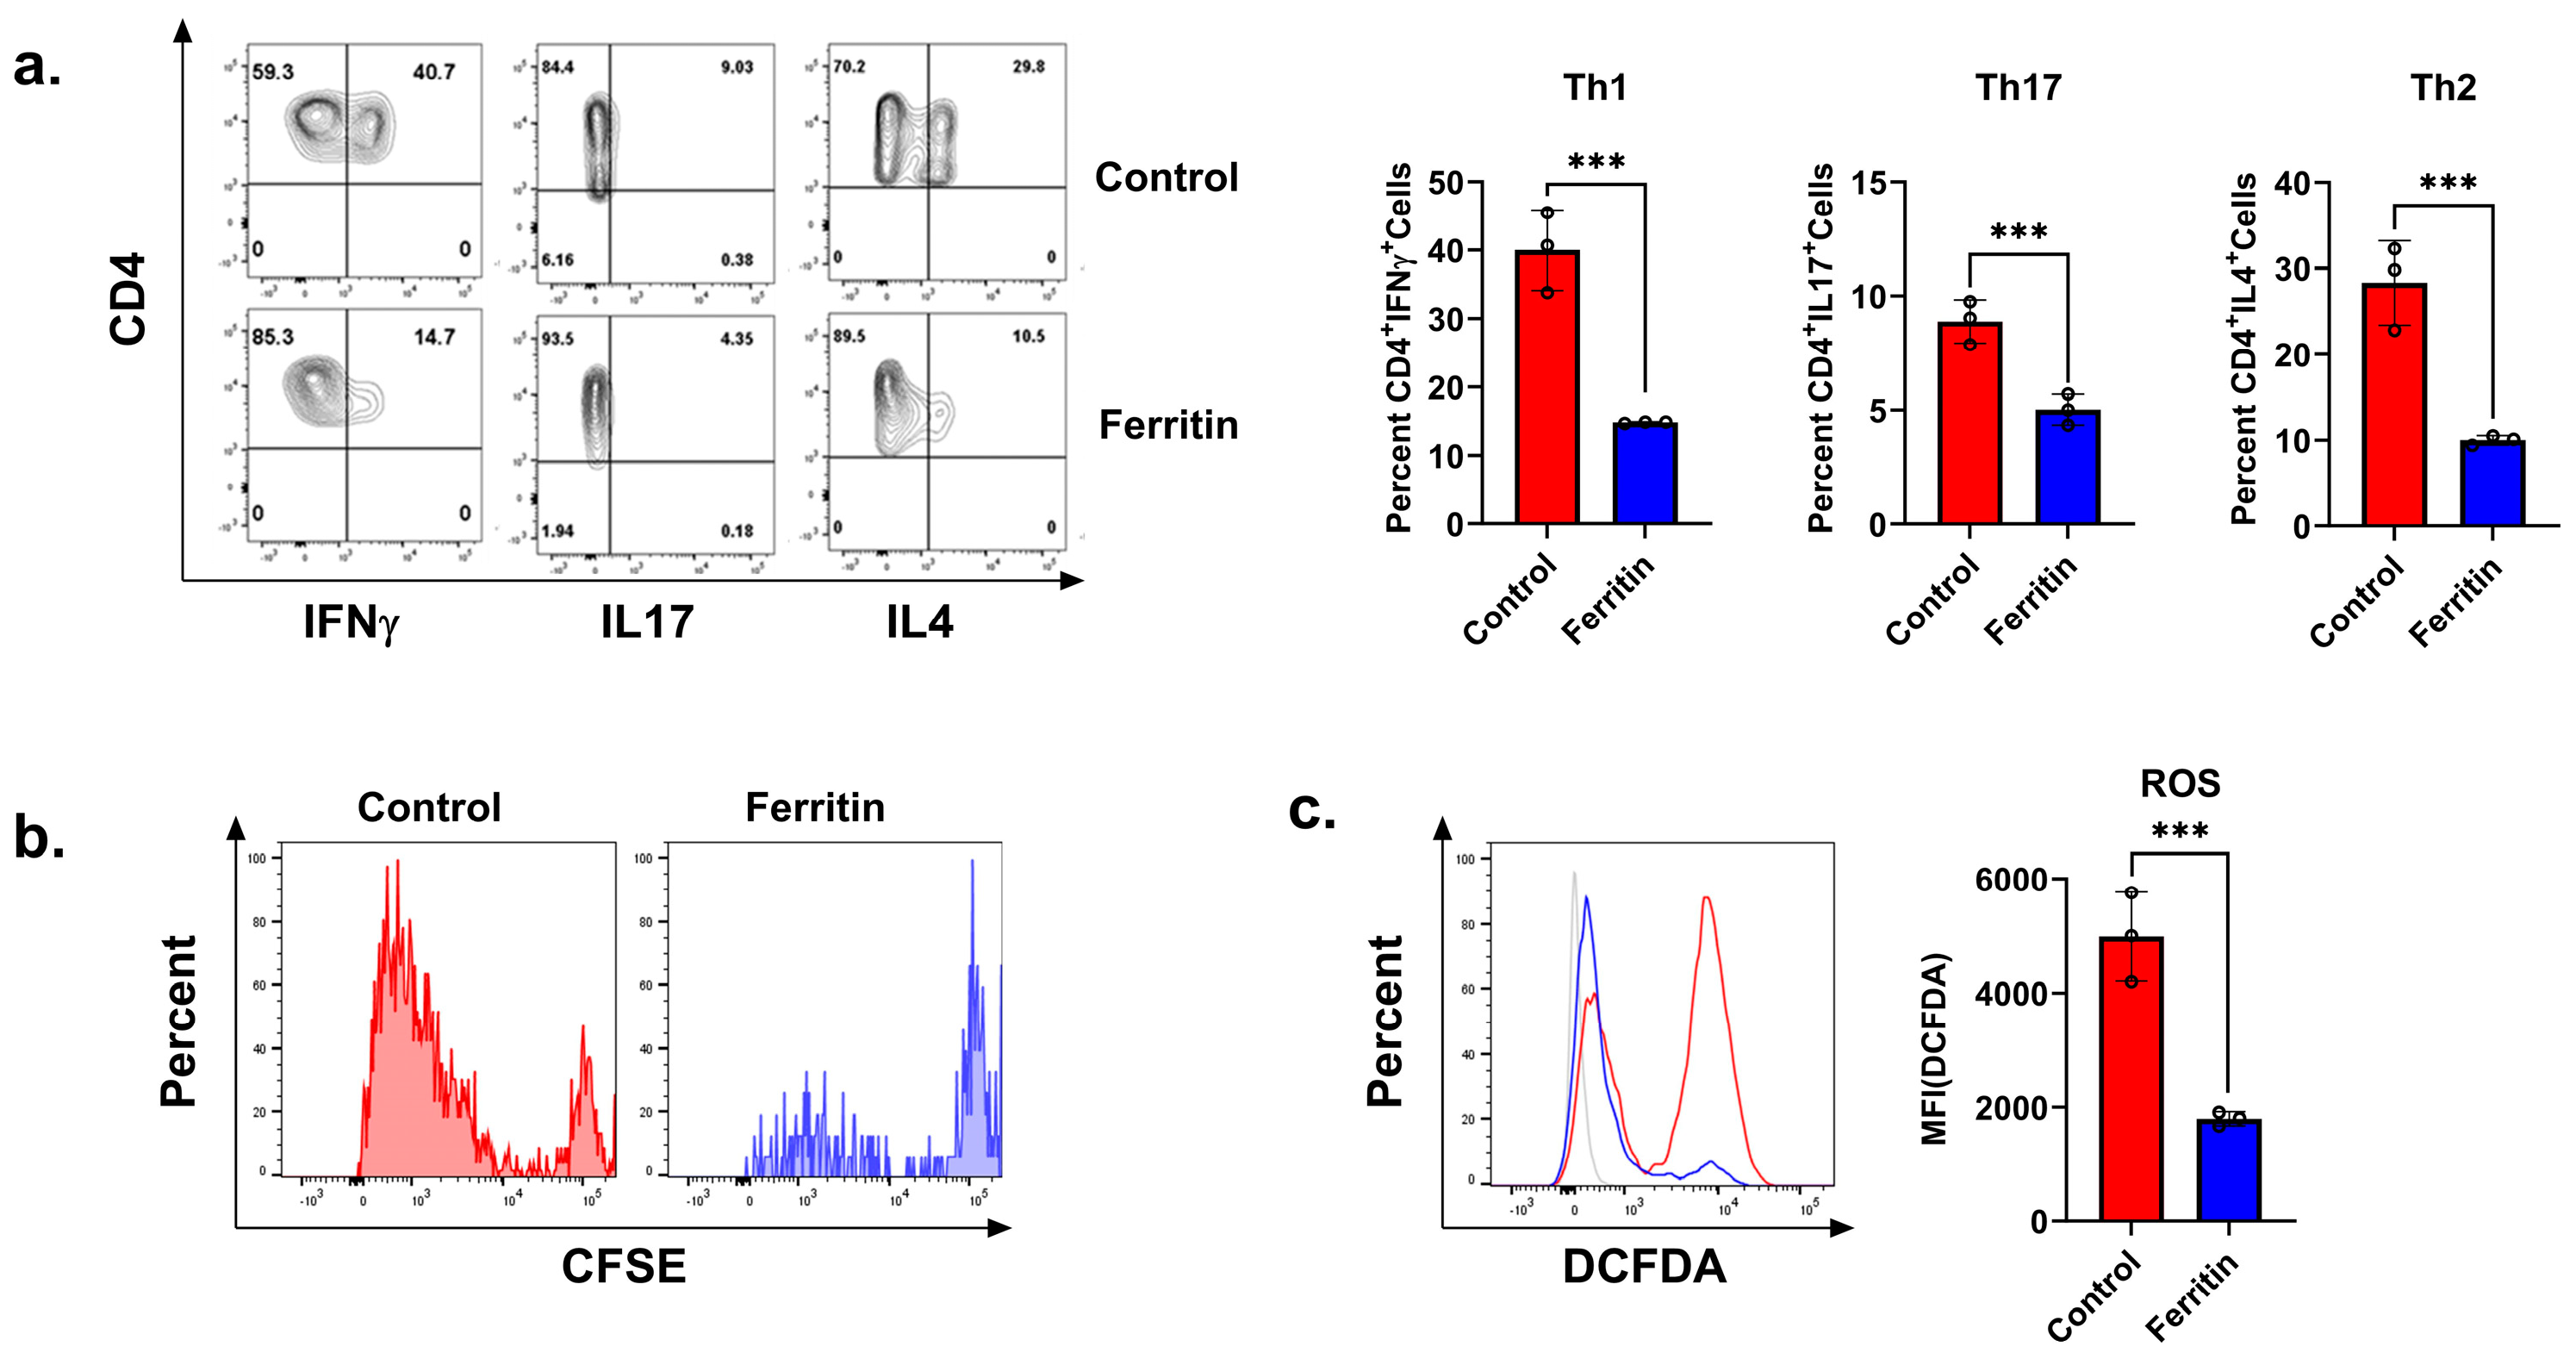
3.3. Ferritin Inhibits CD4+ T Cell Activation and Proliferation

To investigate the impact of ferritin on CD4+ T cell activation and proliferation, isolated CD4+ T cells were analyzed for cytokine production, proliferation, and reactive oxygen species (ROS) levels after treatment. Flow cytometry analysis revealed a substantial reduction in the percentage of cytokine-producing CD4+ T cells after ferritin treatment. Specifically, the percentage of Th1 cells decreased from 40.7% in the control group to 14.7% in the ferritin-treated group (Figure 3a). Similarly, after ferritin treatment, percentages of Th17 cells and Th2 cells decreased from 8.51% to 1.75% and from 20.8% to 10.5%, respectively. These data suggest that ferritin can markedly suppress the activation of Th1, Th17, and Th2 cells, which is critical for understanding how elevated ferritin levels can affect immune responses.
Assessment of cell proliferation using CFSE dilution showed that cell proliferation was significantly inhibited in the ferritin-treated group compared to that in the control group (Figure 3b). The control group displayed extensive proliferation indicated by a broad CFSE dilution profile, whereas ferritin-treated cells exhibited limited proliferation evidenced by a narrow CFSE profile. This finding underscores the role of ferritin in suppressing immune cell proliferation, which is a crucial factor contributing to lymphopenia observed in patients with high ferritin levels.
ROS levels were measured using DCFDA staining. Mean fluorescence intensity (MFI) was significantly decreased in the ferritin-treated group compared to that in the control group (Figure 3c). This reduction in ROS level further supports the notion that ferritin can inhibit CD4+ T cell activation by affecting their metabolic state. This observation serves as a basis for further investigating metabolic alterations in the subsequent figure. These results collectively highlight the inhibitory effects of ferritin on CD4+ T cell activation, cytokine production, proliferation, and ROS level.

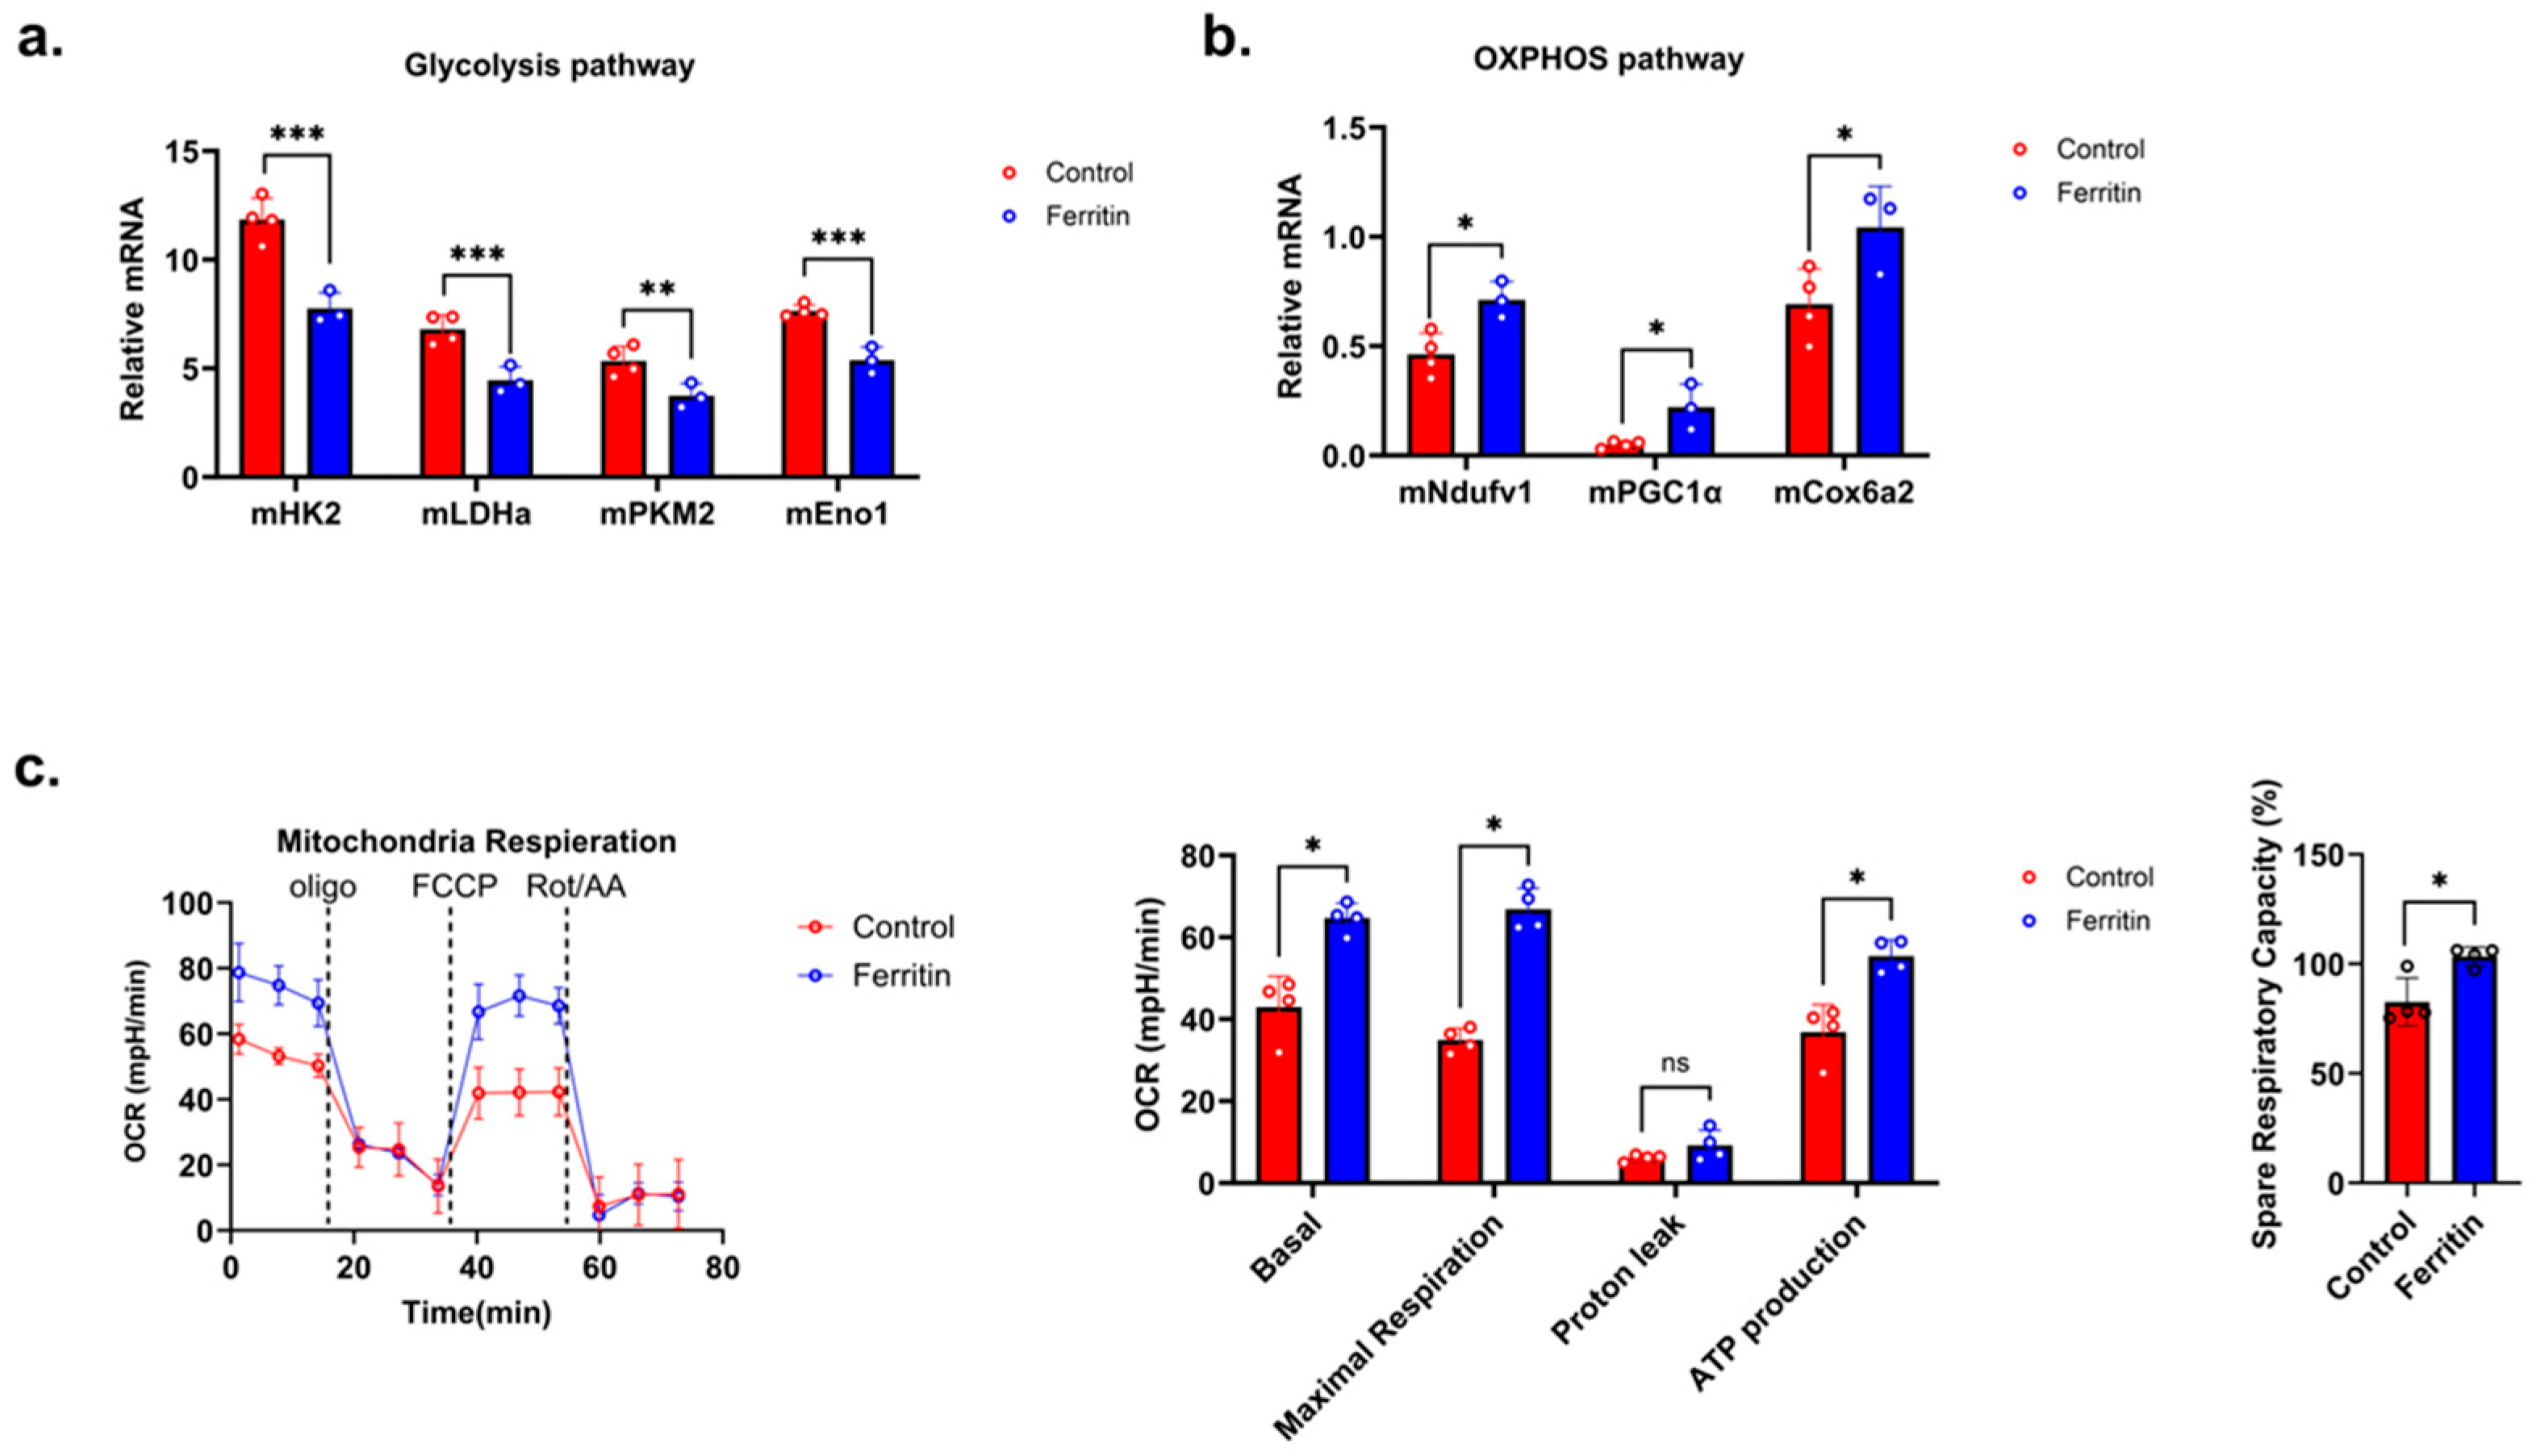
3.4. Ferritin Modulates CD4+ T Cell Proliferation by Enhancing OXPHOS and Suppressing Glycolytic Shift

Recent studies have indicated that ferritin can enhance a shift from glycolysis to oxidative phosphorylation (OXPHOS) in mammalian cells [8,9]. Such a shift from glycolysis to OXPHOS is crucial for T cell activation and function [10]. Upon activation, T cells can switch from mitochondrial respiration to intensive aerobic glycolysis, a process vital for rapid proliferation and robust cytokine production essential for effective immune responses [11]. In this context, CD4+ T cells were treated with ferritin to explore its effects on metabolic pathways and mitochondrial respiration. Quantitative real-time PCR revealed that genes related to glycolysis were markedly downregulated after treatment with ferritin (Figure 4a), suggesting a suppression of glycolytic activity essential for rapid energy generation. Conversely, expression levels of genes associated with the OXPHOS pathway (Figure 4b) were significantly increased after treatment with ferritin, indicating a metabolic shift towards enhanced mitochondrial activity.
This shift was further confirmed by measurements of oxygen consumption rate using a flux analyzer (Figure 4c), which showed increased basal respiration, maximum respiration capacity, and ATP production, alongside improved spare respiratory capacity. These findings substantiate the notion that ferritin can initiate a metabolic shift from glycolysis to oxidative phosphorylation in CD4+ T cells, possibly limiting their proliferation and contributing to lymphopenia by reducing the swift generation of energy through glycolysis.

4. Discussion

Our findings highlight the association between elevated ferritin levels and immune function in diabetic patients with sepsis. While elevated ferritin levels correlate with immune dysregulation and lymphopenia, our study does not establish causation. Notably, our in vitro experiments demonstrated that ferritin did not directly cause CD4+ T cell death; however, it did inhibit CD4+ T cell activation and proliferation, contributing to a decrease in overall lymphocyte counts. This suppression of T cell function suggests that elevated ferritin levels may impair immune responses in septic conditions, potentially serving as a biomarker for sepsis severity and prognosis in diabetic patients. Further research is needed to elucidate the mechanisms underlying these associations and to determine whether these observed effects are secondary to the overall severity of the illness or have direct causal pathways.
Sepsis is known to induce significant alterations in iron metabolism, leading to a complex interplay between iron availability and immune function. One critical aspect of this is the behavior of labile iron pools in plasma and cytosol. During acute septic shock and inflammatory diseases, hyperferritinemia is often accompanied by hypoferremia. This is primarily driven by the overexpression of hepcidin, an iron-regulatory hormone produced by the liver in response to inflammatory signals [12].
Hepcidin induces the internalization and degradation of ferroportin, the only known iron exporter in macrophages and enterocytes [13]. Consequently, this leads to iron sequestration within macrophages, reducing serum iron levels and transferrin saturation [14]. This mechanism is part of the body’s strategy to limit iron availability to pathogens, as iron is a critical nutrient for bacterial growth [15]. Ferritin, which sequesters iron, is elevated as a protective response to limit free iron’s pro-oxidant effects [14]. However, excessive ferritin can also indicate underlying chronic inflammation and iron overload within macrophages, exacerbating immune dysregulation [15]. The overexpression of hepcidin reduces serum iron and transferrin saturation while increasing intracellular labile iron [16,17]. Labile iron can catalyze the formation of ROS via the Fenton reaction, contributing to oxidative stress and cellular damage [18]. This oxidative stress can exacerbate the inflammatory response and further compromise immune function. Elevated intracellular iron within macrophages may contribute to immune dysregulation and increased mortality. Elevated ferritin levels, often seen in conjunction with decreased transferrin saturation, act as a marker of this dysregulated iron homeostasis [19].
In sepsis, iron modulation presents conflicting outcomes. Iron supplementation in dialysis patients has been associated with reduced sepsis-related mortality [20]. However, another study reported that parenteral iron supplementation during sepsis increased oxidative stress and TNF-α levels, leading to worse outcomes [21]. These conflicting results highlight the complexity of iron metabolism in sepsis and suggest that increased ferritin cannot be solely explained as a host defense mechanism through iron depletion. In our study, iron levels were found to be within normal ranges in both diabetic and non-diabetic patients (Table 1), regardless of ferritin levels. This suggests that the observed increase in ferritin is not directly related to iron depletion but may reflect underlying inflammatory processes. Our findings indicate that while hyperferritinemia is a significant marker of sepsis severity, its role is multifaceted. Elevated ferritin levels in septic patients may reflect a complex interplay between iron sequestration and immune dysregulation rather than a straightforward mechanism of iron depletion for host defense.
Lymphopenia, a condition characterized by abnormally low levels of lymphocytes in the blood, poses a serious problem for diabetic patients as lymphocytes are crucial components of the immune system [22,23,24]. A reduced number of these cells compromises the body’s ability to mount effective immune responses, making patients more susceptible to secondary infections [25,26,27]. Depletion of immune cells such as CD4+ and CD8+ T cells through apoptosis and immune exhaustion contributes to this increased vulnerability. This vulnerability is particularly problematic in septic conditions, where the immune system is already under significant stress [28].
Ferritin-induced metabolic alterations can lead to lymphopenia in diabetic patients [29]. We presented real patient data that supported the correlation between high ferritin levels and lymphopenia in diabetic patients. By analyzing causes of lymphopenia from two perspectives [30,31]—the suppression of immune cell proliferation and increased cell death—we found that the suppression of proliferation played a more crucial role than increased cell death. This finding is essential for understanding the impact of ferritin on immune response, offering a deeper insight into how ferritin influences immune cell dynamics.
Furthermore, we reported for the first time that ferritin could inhibit the proliferation of CD4+ T cells, acting as a major factor in altering the glycolysis pathway [32]. This discovery sheds light on the intricate mechanisms by which high ferritin levels can lead to lymphopenia, emphasizing the pivotal role of metabolic pathways in immune cell function. By identifying glycolysis pathway alterations as a key factor, this study provides a practical foundation for developing new therapeutic strategies for counteracting adverse effects of high ferritin levels on the immune system.
Implications of this study are particularly relevant for diabetic patients, suggesting that elevated ferritin levels could be a contributing factor to impaired immune function. This insight offers foundational data for exploring therapeutic methods to promote T cell proliferation. Specifically, it highlights the potential of targeting energy metabolism pathways as a therapeutic approach to treat lymphopenia in diabetic patients with high ferritin levels. Regulating the energy metabolism of T cells to promote their proliferation could ultimately support and enhance immune function, addressing a critical need in this patient population.
These findings pave the way for the development of targeted therapies that can modulate T cell energy metabolism. Such therapies could have practical applications in improving immune function in diabetic patients suffering from hyperferritinemia. By advancing our understanding of the interplay between ferritin levels and immune cell function, this study represents a crucial step forward in addressing immune modulation challenges in diabetic patients.
While our study highlights significant associations between elevated ferritin levels and impaired immune function—particularly reduced CD4+ T cell proliferation and increased mortality in diabetic patients—establishing causality remains challenging. The immunosuppressive effects observed in vitro, where ferritin directly inhibited T cell proliferation, may not directly translate to clinical settings. In real-world scenarios, these effects might be more complex and could result from the overall severity of sepsis, rather than being solely attributed to hyperferritinemia. Furthermore, it is unclear whether ferritin acts merely as a biomarker or as an active modulator of immune responses. The potential confounding effects of co-existing metabolic and inflammatory conditions also warrant consideration. Future studies should focus on longitudinal analyses and mechanistic investigations to disentangle these complex interactions and determine whether targeting ferritin levels or related metabolic pathways can provide therapeutic benefits.

5. Conclusions

In conclusion, we highlight the significant impact of elevated ferritin levels on immune function in diabetic septic patients. We found that high ferritin levels were associated with lymphopenia and increased mortality. Lymphopenia is primarily due to suppressed CD4+ T cell proliferation, driven by a metabolic shift from glycolysis to oxidative phosphorylation, impairing effective immune responses. Clinically, monitoring ferritin levels could help identify patients at higher risk of severe outcomes. Therapeutic strategies that can modulate ferritin levels or boost glycolytic pathways in T cells might improve immune function and reduce mortality in these patients. In summary, our findings suggest that addressing hyperferritinemia could enhance immune responses and improve outcomes of diabetic patients with sepsis.

Supplementary Materials

The following supporting information can be downloaded at: https://www.mdpi.com/article/10.3390/diabetology5030026/s1, Figure S1: Correlation Analysis Between Ferritin Levels, Serum Iron, and Transferrin Saturation in Acute Sepsis Patients. a. The correlation between ferritin and serum iron. The correlation coefficient (R2) is 0.060 with a p-value of 0.682. b. The correlation between ferritin and transferrin saturation. The correlation coefficient (R2) is −0.014 with a p-value of 0.926. The yellow shaded area denotes the 95% confidence interval for the regression line.

Author Contributions

Conceptualization, M.-J.K. and E.-J.C.; methodology, M.-J.K.; software, M.-J.K.; validation, M.-J.K. and E.-J.C.; formal analysis, M.-J.K.; investigation, M.-J.K.; resources, M.-J.K. and E.-J.C.; data curation, M.-J.K.; writing—original draft preparation, M.-J.K.; writing—review and editing, E.-J.C.; visualization, M.-J.K. and E.-J.C.; supervision, I.-K.L. All authors have read and agreed to the published version of the manuscript.

Funding

This work was supported by the National Research Foundation of Korea (NRF) grant funded by the Korea government (MSIT) (No. 2022R1C1C101089811) and a grant of the Korea Health Technology R&D Project through the Korea Health Industry Development Institute (KHIDI), funded by the Ministry of Health & Welfare, Republic of Korea (grant number: HR22C1832).

Institutional Review Board Statement

This study was conducted in accordance with the Declaration of Helsinki. It was approved by the Institutional Review Board of Kyungpook National University Hospital (IRB no. KNUH 2020-09-020-001).

Informed Consent Statement

Not applicable.

Data Availability Statement

Data supporting reported results can be found in the main manuscript. No additional datasets were created or analyzed for this study.

Acknowledgments

The authors would like to thank patients at Kyungpook National University Hospital for their agreement to use their data for this study.

Conflicts of Interest

The authors have no conflicts of interest to disclose.

References

  1. Berbudi, A.; Rahmadika, N.; Tjahjadi, A.I.; Ruslami, R. Type 2 Diabetes and its Impact on the Immune System. Curr. Diabetes Rev. 2020, 16, 442–449. [Google Scholar] [CrossRef]
  2. Turina, M.; Fry, D.E.; Polk, H.C., Jr. Acute hyperglycemia and the innate immune system: Clinical, cellular, and molecular aspects. Crit. Care Med. 2005, 33, 1624–1633. [Google Scholar] [CrossRef]
  3. Xiu, F.; Stanojcic, M.; Diao, L.; Jeschke, M.G. Stress hyperglycemia, insulin treatment, and innate immune cells. Int. J. Endocrinol. 2014, 2014, 486403. [Google Scholar] [CrossRef] [PubMed]
  4. Jagannathan-Bogdan, M.; McDonnell, M.E.; Shin, H.; Rehman, Q.; Hasturk, H.; Apovian, C.M.; Nikolajczyk, B.S. Elevated proinflammatory cytokine production by a skewed T cell compartment requires monocytes and promotes inflammation in type 2 diabetes. J. Immunol. 2011, 186, 1162–1172. [Google Scholar] [CrossRef]
  5. Kernan, K.F.; Carcillo, J.A. Hyperferritinemia and inflammation. Int. Immunol. 2017, 29, 401–409. [Google Scholar] [CrossRef]
  6. Zarjou, A.; Black, L.M.; McCullough, K.R.; Hull, T.D.; Esman, S.K.; Boddu, R.; Varambally, S.; Chandrashekar, D.S.; Feng, W.; Arosio, P.; et al. Ferritin Light Chain Confers Protection Against Sepsis-Induced Inflammation and Organ Injury. Front. Immunol. 2019, 10, 131. [Google Scholar] [CrossRef]
  7. Singer, M.; Deutschman, C.S.; Seymour, C.W.; Shankar-Hari, M.; Annane, D.; Bauer, M.; Bellomo, R.; Bernard, G.R.; Chiche, J.D.; Coopersmith, C.M.; et al. The Third International Consensus Definitions for Sepsis and Septic Shock (Sepsis-3). JAMA 2016, 315, 801–810. [Google Scholar] [CrossRef]
  8. Wang, P.; Cui, Y.; Liu, Y.; Li, Z.; Bai, H.; Zhao, Y.; Chang, Y.Z. Mitochondrial ferritin alleviates apoptosis by enhancing mitochondrial bioenergetics and stimulating glucose metabolism in cerebral ischemia reperfusion. Redox Biol. 2022, 57, 102475. [Google Scholar] [CrossRef] [PubMed]
  9. Reddy, V.P.; Chinta, K.C.; Saini, V.; Glasgow, J.N.; Hull, T.D.; Traylor, A.; Rey-Stolle, F.; Soares, M.P.; Madansein, R.; Rahman, M.A.; et al. Ferritin H Deficiency in Myeloid Compartments Dysregulates Host Energy Metabolism and Increases Susceptibility to Mycobacterium tuberculosis Infection. Front. Immunol. 2018, 9, 860. [Google Scholar] [CrossRef]
  10. Paillon, N.; Ung, T.P.L.; Dogniaux, S.; Stringari, C.; Hivroz, C. Label-free single-cell live imaging reveals fast metabolic switch in T lymphocytes. Mol. Biol. Cell 2024, 35, ar11. [Google Scholar] [CrossRef]
  11. Nastasi, C.; Willerlev-Olsen, A.; Dalhoff, K.; Ford, S.L.; Gadsboll, A.O.; Buus, T.B.; Gluud, M.; Danielsen, M.; Litman, T.; Bonefeld, C.M.; et al. Inhibition of succinate dehydrogenase activity impairs human T cell activation and function. Sci. Rep. 2021, 11, 1458. [Google Scholar] [CrossRef] [PubMed]
  12. Kell, D.B.; Pretorius, E. Serum ferritin is an important inflammatory disease marker, as it is mainly a leakage product from damaged cells. Metallomics 2014, 6, 748–773. [Google Scholar] [CrossRef]
  13. Babitt, J.L.; Lin, H.Y. Molecular Mechanisms of Hepcidin Regulation: Implications for the Anemia of CKD. Am. J. Kidney Dis. 2010, 55, 726–741. [Google Scholar] [CrossRef]
  14. Zhang, D.-L.; Rouault, T.A. How does hepcidin hinder ferroportin activity? Blood 2018, 131, 840–842. [Google Scholar] [CrossRef]
  15. Afsar, R.E.; Kanbay, M.; Ibis, A.; Afsar, B. In-depth review: Is hepcidin a marker for the heart and the kidney? Mol. Cell. Biochem. 2021, 476, 3365–3381. [Google Scholar] [CrossRef]
  16. Haschka, D.; Hoffmann, A.; Weiss, G. Iron in immune cell function and host defense. Semin. Cell Dev. Biol. 2021, 115, 27–36. [Google Scholar] [CrossRef]
  17. Girelli, D.; Marchi, G.; Busti, F.; Vianello, A. Iron metabolism in infections: Focus on COVID-19. Semin. Hematol. 2021, 58, 182–187. [Google Scholar] [CrossRef]
  18. Li, Y.; Du, Y.; Zhou, Y.; Chen, Q.; Luo, Z.; Ren, Y.; Chen, X.; Chen, G. Iron and copper: Critical executioners of ferroptosis, cuproptosis and other forms of cell death. Cell Commun. Signal. 2023, 21, 327. [Google Scholar] [CrossRef] [PubMed]
  19. Moreira, A.C.; Teles, M.J.; Silva, T.; Bento, C.M.; Alves, I.S.; Pereira, L.; Guimarães, J.T.; Porto, G.; Oliveira, P.; Gomes, M.S. Iron Related Biomarkers Predict Disease Severity in a Cohort of Portuguese Adult Patients during COVID-19 Acute Infection. Viruses 2021, 13, 2482. [Google Scholar] [CrossRef] [PubMed]
  20. Zitt, E.; Sturm, G.; Kronenberg, F.; Neyer, U.; Knoll, F.; Lhotta, K.; Weiss, G. Iron Supplementation and Mortality in Incident Dialysis Patients: An Observational Study. PLoS ONE 2014, 9, e114144. [Google Scholar] [CrossRef]
  21. Zager, R.A.; Johnson, A.C.; Hanson, S.Y. Parenteral iron therapy exacerbates experimental sepsis Rapid Communication. Kidney Int. 2004, 65, 2108–2112. [Google Scholar] [CrossRef]
  22. Cheng, Y.; Yue, L.; Wang, Z.; Zhang, J.; Xiang, G. Hyperglycemia associated with lymphopenia and disease severity of COVID-19 in type 2 diabetes mellitus. J. Diabetes Complicat. 2021, 35, 107809. [Google Scholar] [CrossRef]
  23. Ash, S.; Yarkoni, S.; Askenasy, N. Lymphopenia is detrimental to therapeutic approaches to type 1 diabetes using regulatory T cells. Immunol. Res. 2014, 58, 101–105. [Google Scholar] [CrossRef] [PubMed]
  24. Muller, Y.D.; Golshayan, D.; Ehirchiou, D.; Wyss, J.C.; Giovannoni, L.; Meier, R.; Serre-Beinier, V.; Puga Yung, G.; Morel, P.; Buhler, L.H.; et al. Immunosuppressive effects of streptozotocin-induced diabetes result in absolute lymphopenia and a relative increase of T regulatory cells. Diabetes 2011, 60, 2331–2340. [Google Scholar] [CrossRef]
  25. Monneret, G.; Venet, F. A rapidly progressing lymphocyte exhaustion after severe sepsis. Crit. Care 2012, 16, 140. [Google Scholar] [CrossRef]
  26. Boomer, J.S.; Shuherk-Shaffer, J.; Hotchkiss, R.S.; Green, J.M. A prospective analysis of lymphocyte phenotype and function over the course of acute sepsis. Crit. Care 2012, 16, R112. [Google Scholar] [CrossRef] [PubMed]
  27. Brady, J.; Horie, S.; Laffey, J.G. Role of the adaptive immune response in sepsis. Intensive Care Med. Exp. 2020, 8, 20. [Google Scholar] [CrossRef] [PubMed]
  28. Zhang, X.; Zhang, Y.; Yuan, S.; Zhang, J. The potential immunological mechanisms of sepsis. Front. Immunol. 2024, 15, 1434688. [Google Scholar] [CrossRef]
  29. Kaye, T.B.; Guay, A.T. Increased serum ferritin levels in patients with diabetes mellitus. Mayo Clin. Proc. 1994, 69, 498–499. [Google Scholar] [CrossRef]
  30. Finfer, S.; Venkatesh, B.; Hotchkiss, R.S.; Sasson, S.C. Lymphopenia in sepsis-an acquired immunodeficiency? Immunol. Cell Biol. 2023, 101, 535–544. [Google Scholar] [CrossRef]
  31. Girardot, T.; Rimmele, T.; Venet, F.; Monneret, G. Apoptosis-induced lymphopenia in sepsis and other severe injuries. Apoptosis 2017, 22, 295–305. [Google Scholar] [CrossRef] [PubMed]
  32. Gerriets, V.A.; Kishton, R.J.; Nichols, A.G.; Macintyre, A.N.; Inoue, M.; Ilkayeva, O.; Winter, P.S.; Liu, X.; Priyadharshini, B.; Slawinska, M.E.; et al. Metabolic programming and PDHK1 control CD4+ T cell subsets and inflammation. J. Clin. Investig. 2015, 125, 194–207. [Google Scholar] [CrossRef] [PubMed]
Figure 1. High ferritin levels in diabetic patients are associated with lymphopenia and increased mortality rates. (a) Boxplot comparing ferritin levels (log scale) between diabetic (DM) and non-diabetic (Non-DM) patients. (b) Logistic regression curve showing the predicted probability of death based on ferritin level. Shaded area represents 95% confidence interval. (c) Scatter plot showing correlation between lymphocyte count (103/µL) and ferritin level. Blue line represents the linear regression fit with the shaded area indicating the 95% confidence interval. (d) Violin plot comparing ferritin levels between patients who survived and those who died within 28 days. (e) Bar graph showing mortality rates in patients with low and high lymphocyte counts. Low lymphocyte count was defined as less than 950/µL, and high lymphocyte count was defined as 950/µL or higher. Data are presented as mean ± SEM. *** p < 0.001; **** p < 0.0001.
Diabetology 05 00026 g001
Figure 2. Impact of ferritin on CD4+ T cell apoptosis, necrosis, and ferroptosis. CD4+ T cells were isolated, activated on CD3-coated plates, and cultured with or without 400 ng/mL ferritin for 48 h. (a) Annexin A5 and PI staining for apoptosis and necrosis in CD4+ T cells. Flow cytometry analysis was performed to measure Annexin A5 and PI staining. Dot plots show distribution of viable cells (Annexin A5−/PI−), early apoptotic cells (Annexin A5+/PI−), late apoptotic/necrotic cells (Annexin A5+/PI+), and necrotic cells (Annexin A5−/PI+). Bar graph summarizes the percentage of cells in each category. Viable cells showed no significant difference between control and ferritin-treated groups. Early apoptosis was slightly higher in the ferritin-treated group than in the control group, while necrosis was significantly higher in the control group than in the ferritin-treated group. (b) Ferroptosis analysis was conducted using BODIPY 581/591 staining. CD4+ T cells were analyzed for lipid peroxidation using BODIPY 581/591 staining. The histogram shows the distribution of BODIPY fluorescence in control and ferritin-treated cells. The bar graph indicates mean fluorescence intensity (MFI) of BODIPY, with ferritin-treated cells exhibiting significantly lower MFI, suggesting reduced ferroptosis. Data are presented as mean ± SEM. * p < 0.05; *** p < 0.001; ns: not significant.
Diabetology 05 00026 g002
Figure 3. Impact of ferritin on CD4+ T cell activation and proliferation. Isolated CD4+ T cells were treated with 400 ng/mL ferritin for 48 h. (a) Flow cytometry analysis showing percentages of Th1, Th17, and Th2 cells. Representative flow cytometry plots are displayed, and quantified data are shown as mean ± SEM (n = 3). (b) CFSE dilution assay indicating proliferation of CD4+ T cells. Representative histograms are shown for both control and ferritin-treated groups. (c) Measurement of reactive oxygen species (ROS) levels using DCFDA staining. Control (red), ferritin treatment (blue). Representative histograms are shown, with quantified mean fluorescence intensity (MFI) data presented as mean ± SEM (n = 3). *** p < 0.001 compared to control.
Diabetology 05 00026 g003
Figure 4. Effects of ferritin on metabolic functions in CD4+ T cells. CD4+ T cells were treated with 400 ng/mL ferritin for 48 h. These cells were then subjected to the following analyses: (a) gene expression analysis for glycolysis pathway: quantitative real-time PCR (qRT-PCR) was used to measure mRNA levels of glycolysis-related genes, including mHK2, mLDHa, mPKM2, and mEno1. Data are presented as relative mRNA expression normalized to control. (b) Gene expression analysis for OXPHOS pathway: qRT-PCR was utilized to assess expression levels of genes associated with oxidative phosphorylation, including mNdufv1, mPGC1a, and mCox6a2. Results are shown as relative mRNA levels compared to control. (c) Mitochondrial respiration measurement using seahorse analyzer: oxygen consumption rate (OCR) was determined using a Seahorse XF-96 Flux Analyzer. The experiment included various mitochondrial inhibitors: oligomycin (oligo), FCCP, and a combination of rotenone/antimycin A (Rot/AA). The OCR was measured at multiple time points. Data points represent basal respiration, maximum respiration, proton leak, ATP production, and spare respiratory capacity. * p < 0.05, ** p < 0.01, *** p < 0.001 compared to control.
Diabetology 05 00026 g004
Table 1. Baseline clinical characteristics of sepsis patient groups by diabetes mellitus (DM) status.
DM
(n = 69)
Non-DM
(n = 192)
p
Age (years)56.4 ± 12.357.9 ± 10.20.07
Sex, male, n (%)40 (58.00%)96 (53.49%)0.32
Death within 28 days, n (%)15 (21.7%)22 (11.5%)0.05
Lymphocyte counts (103/µL)1.2 ± 1.62.1 ± 3.60.007
Platelet counts (103/µL)180.5 ± 141.5244.8 ± 135.20.001
Ferritin (ng/mL)1945.1 ± 329.6907.3 ± 250.80.021
Iron (µg/dL)41.0 ± 26.556.6 ± 38.70.189
CRP (mg/L)14.8 ± 12.28.7 ± 10.0<0.001
Procalcitonin (ng/mL)23.9 ± 31.817.8 ± 29.90.203
AST (U/L)153.5 ± 467.1167.8 ± 947.40.874
ALT (U/L)78.4 ± 162.065.5 ± 233.30.624
Cr (mg/dL)1.9 ± 1.91.4 ± 1.50.058
eGFR (mL/min/1.73 m2)42.1 ± 31.955.4 ± 42.00.023
DM, diabetes mellitus; CRP, C-reactive protein; AST, aspartate aminotransferase; ALT, alanine aminotransferase; Cr, creatinine; eGFR, estimated glomerular filtration rate. Values are presented as mean ± standard deviation (SD). The t-test was used to compare the means of the two groups.
Disclaimer/Publisher’s Note: The statements, opinions and data contained in all publications are solely those of the individual author(s) and contributor(s) and not of MDPI and/or the editor(s). MDPI and/or the editor(s) disclaim responsibility for any injury to people or property resulting from any ideas, methods, instructions or products referred to in the content.

