Abstract
The study of traffic parameters in cities is the basis for making adequate decisions related to the organization and regulation of traffic. This publication presents a study of one of the main parameters of transport flows, namely, its intensity. The study covers one of the busiest streets in the city of Sofia, which is part of the radial connection in the radial circular street network of the city, for the evening peak period of the day. Data analysis presents the influence of the intensity of transport flows at the intersections, which are formed by the intersection with other streets, on the load of the studied street. The share of the load of each transport flow at the individual intersections on the total load of the studied section was recorded for the subsequent assessment of the existing traffic management. The results have been provided to the relevant directorates in the structure of Sofia Municipality for information and use.
1. Introduction
Road traffic in cities is the subject of continuous research and analysis of the processes taking place. This is necessitated by the fact that all activities related to the introduction of a new organization, the reorganization of traffic in cities, determining the method of regulation, and the overall management of these processes depend on the values of the studied indicators. This is the reason why such studies are carried out in all parts of the world, as evidenced by the results presented by the authors of the studies in Vilnius, Lithuania [1] and Dhaka, Bangladesh [2]. This shows the comprehensiveness of the understanding of the need for such data in each country. An important issue in these studies was raised by Sayed et al. [2], emphasizing the importance of providing data for real-time measurements, which leads to timely decisions related to optimizing road traffic. This is also necessitated by the fact that some parameters are strongly influenced by all kinds of external factors. Meteorological conditions are such a factor, and researchers are constantly looking for the most accurate possible relationships between them and traffic parameters, especially in connection with changes in the intensity of traffic flows [3]. Others have also paid attention to the fact that changing one of these parameters leads to changes in others, in which particular attention is paid to the influence of traffic intensity on the number of vehicles that can pass through a certain section of the street network in a certain time [4]. Choudhury and Basak [5] and Singh et al. [6] use the theory of queues to assess the impact of traffic intensity on the processes in it, which other authors also use to assess its influence on the process of work at points important for the economy and security of the state [7]. This shows the many possibilities for determining and assessing traffic parameters using different approaches, theories, and models.
The main aspect of carrying out research related to establishing the necessary information about traffic parameters is the way in which it is carried out and, in particular, the technical means for achieving the goals. Here too, the possibilities are many, as evidenced by their diversity in numerous publications on the subject. Myat et al. presented an alternative to loop detectors, cameras, and radars using microphones and air quality sensors [8]. The authors of [9] proposed a similar approach, supplementing the development with an improvement in the Doppler sensor for recording the speed of vehicles. Other authors have proposed the use of IR sensors to determine the intensity of transport flows [10]. This approach can be supplemented by taking into account the reduction in the cost of their use, which is the essence of the proposal in [8], using systems developed by the authors in [11] from other areas of our life, which can be successfully applied in these studies. The main technologies used are image acquisition and subsequent processing to achieve the research goals. Grozev and Beloev [12] proposed the use of unmanned aerial vehicles for what in recent years has been established as a preferred method for some studies of transport flows. In addition, the necessary software products for the use of such images have also been proposed, such as the one presented by Dmyanov [13]. Maduro et al. [14], in turn, propose the use of corrected images to determine the speed of vehicles and the intensity of transport flows. The improvement of image acquisition technologies and their subsequent processing can be achieved by applying the developed methods, such as those presented by the authors in [15,16]. In the process of studying road traffic, the establishment of the parameters of pedestrian flows should not be neglected. Here, the developed methods and models for their safe crossing [17] should be taken into account, which are directly dependent on their defined critical speed, depending on the visibility zone [18] and their influence on the occurrence of road accidents [19]. For such a connection with the set goals, some authors, such as Miletiev et al. [20], propose a system for comprehensive monitoring of such intelligent transport systems, which uses artificial intelligence, which has already become an integral part of our lives.
Comprehensive solutions using traffic data provide several benefits for people. These include reducing travel time and traffic congestion [21,22]. Others combine the overall improvements achieved based on traffic research with a particularly high goal of reducing pollution from cars in cities. In this regard, Roosbroeck et al. [23] showed the influence of traffic intensity on pollution. In turn, Dimitrov and Damyanov [24,25] presented studies related to the change in the temperature of the exhaust gases of a gasoline-powered car and the temperature of car tires under different operating modes. This, in turn, can affect the level of harmful components emitted in the exhaust gases and fine dust particles emitted by car tires. This is directly related to the definition of risk zones in terms of air pollution from transport in cities. Based on such studies and those related to determining traffic parameters, the European Commission found a reduction in the harmful impact of transport [26]. As noted in this report, transportation is not a major source of pollution. Other sectors of the economy also contribute significantly to overall pollution, which is also a major reason for the energy transition in the Republic of Bulgaria and a reduction in the use of coal for electricity generation, for which the authors of [27] propose appropriate approaches.
Despite the impact of high traffic intensity on the overall life of people and its impact on indicators related to travel times, traffic congestion, pollution from transport, and others, it remains a key indicator that shows economic activity in the relevant regions and large cities [28].
2. Materials and Methods
The study of traffic may include determining the parameters of one or more of its indicators, such as the intensity, speed, density, and composition of transport and pedestrian flows, throughput capacity of street intersections and road junctions, identification of transport delays, and analysis of traffic accidents.
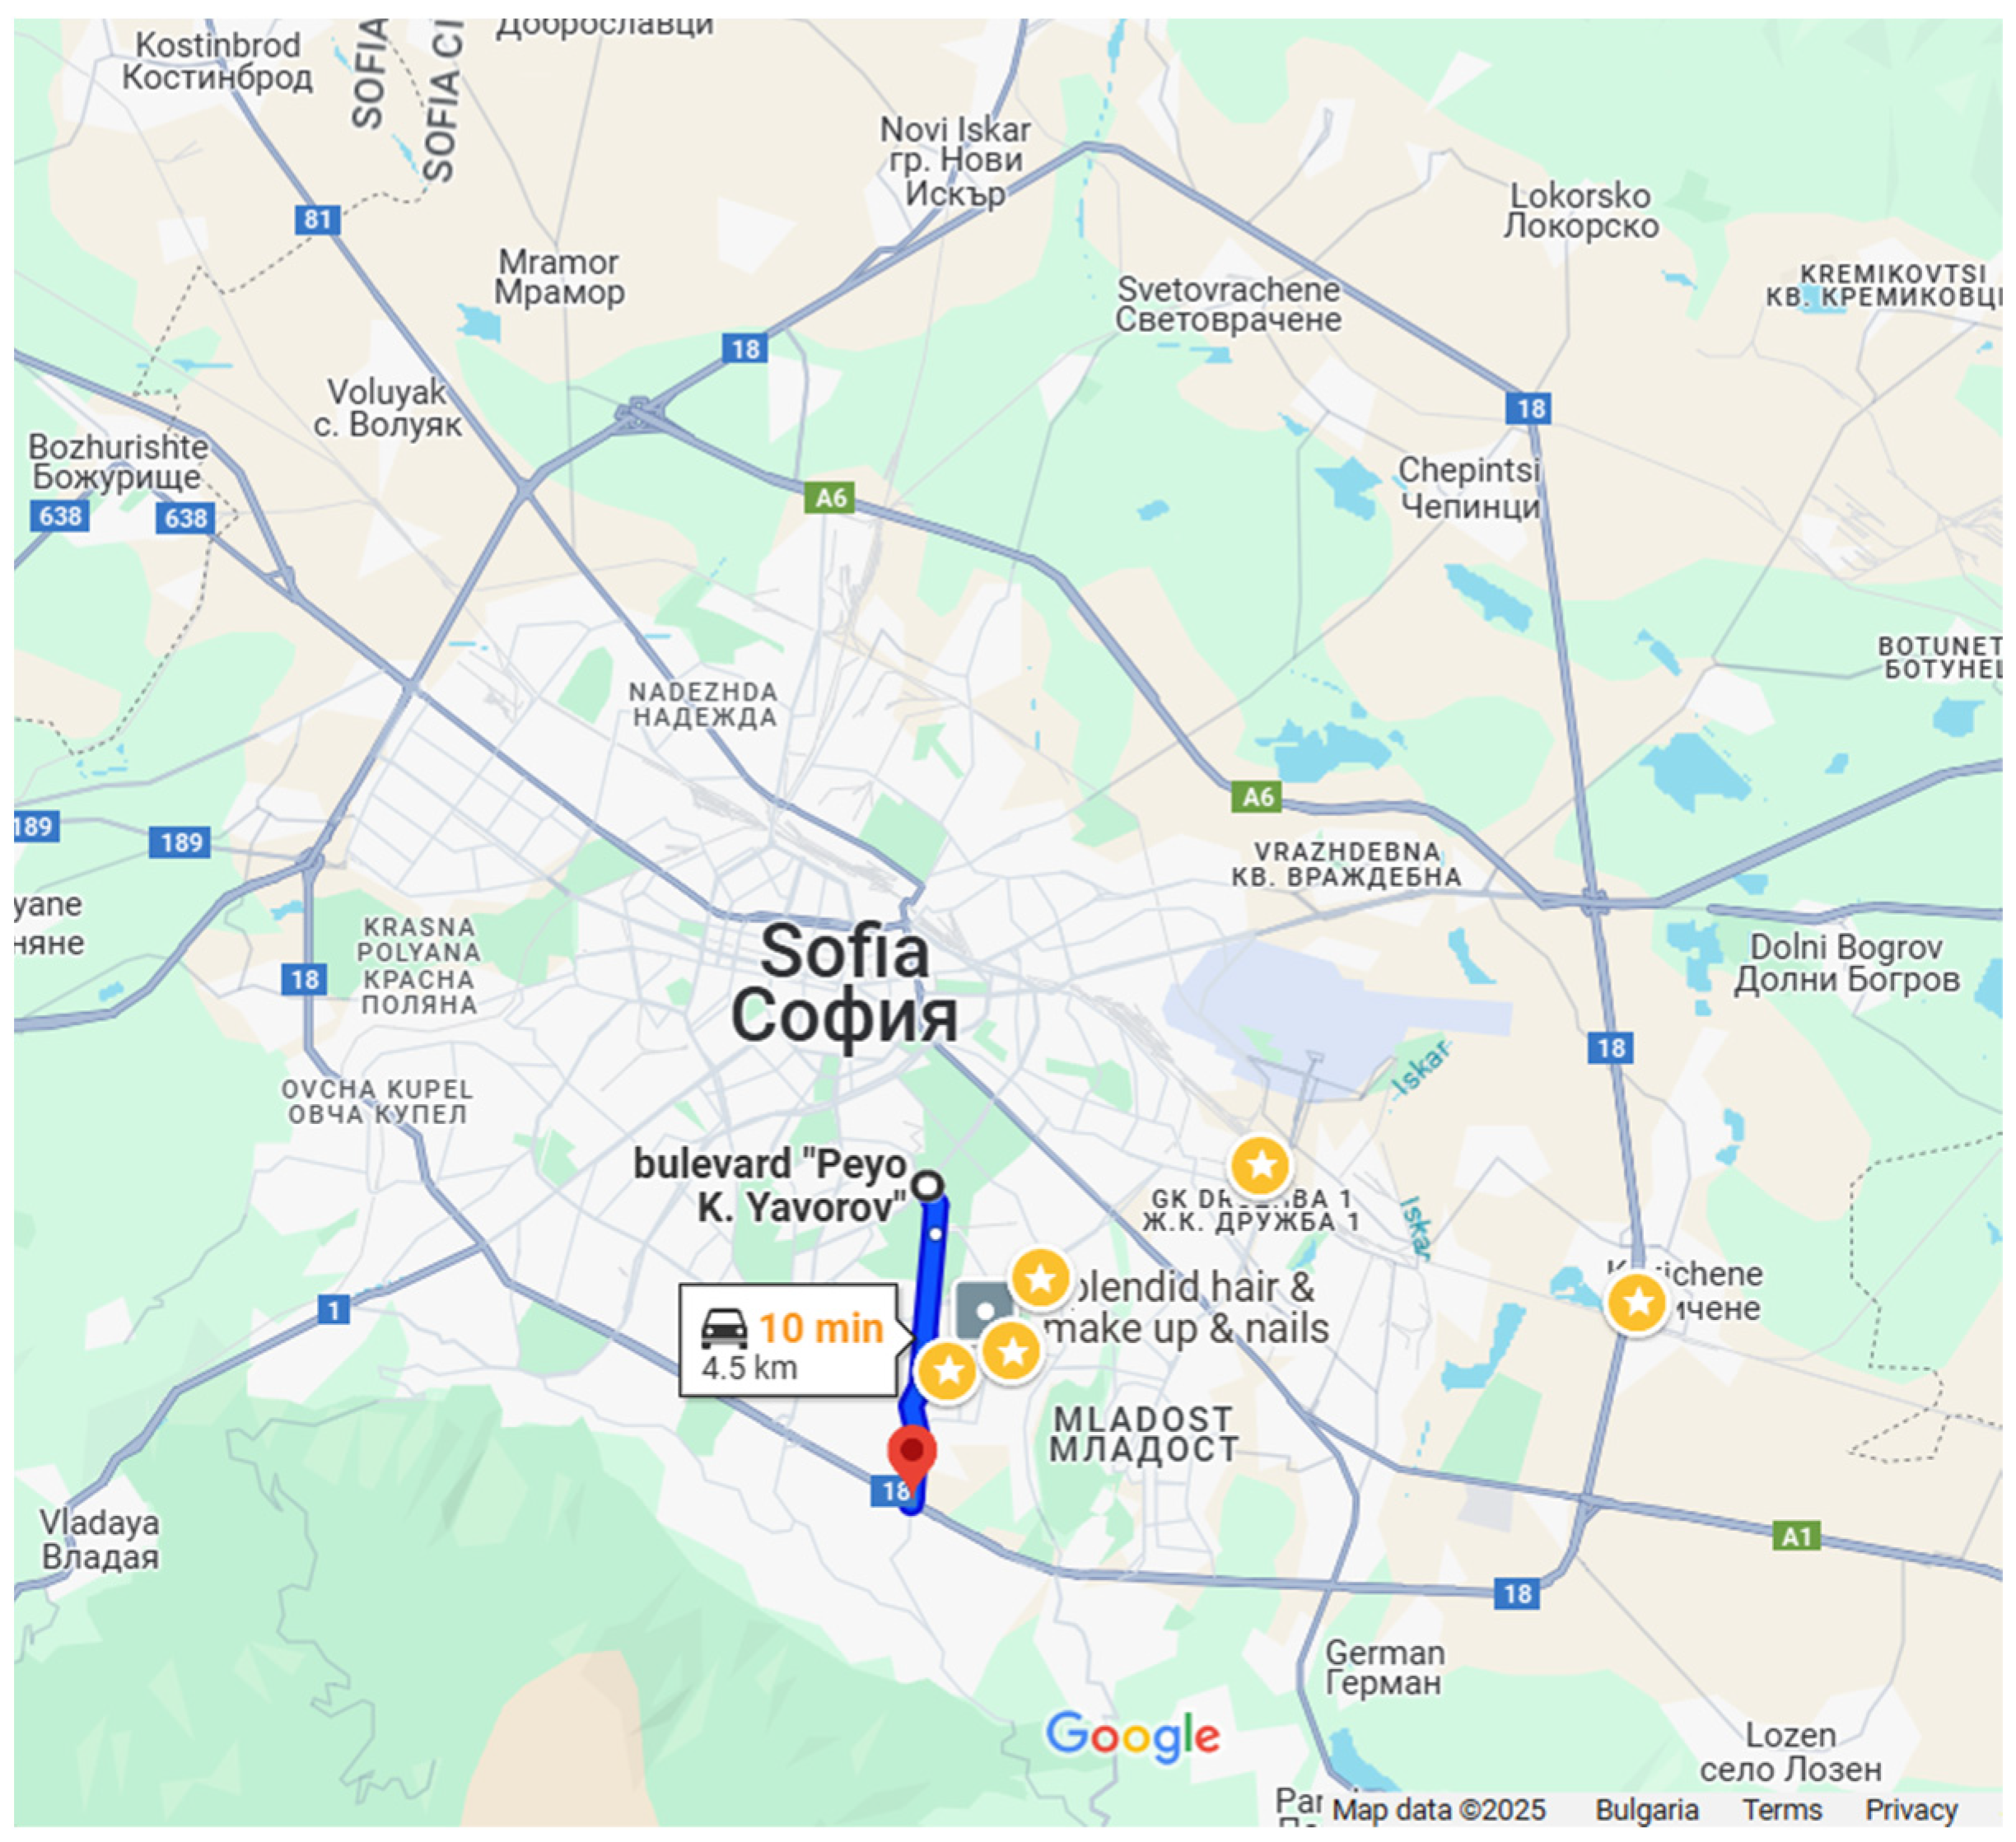
The present study is focused on establishing the values of the intensity of transport flows along one of the main streets in the city of Sofia. This is Simeonovsko Shose Blvd. It is part of a radial connection in the radial-circular street network of the city of Sofia, as a continuation of Stoyan Mihaylovski St. and connects the central part of the city with the outer ring of the Capital, formed by Okolovrasten Pat Str. (Figure 1).
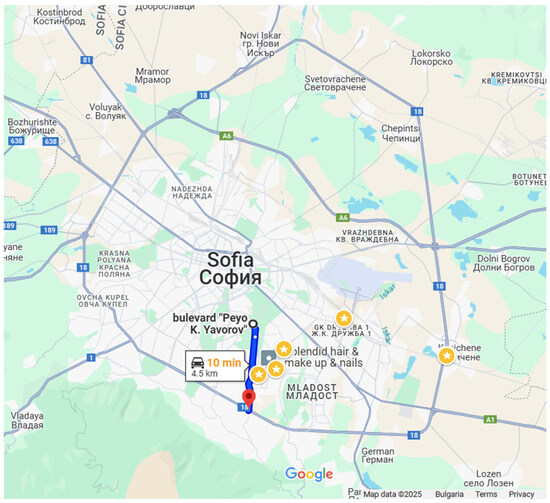
Figure 1.
Location of the surveyed part of the street network [29].
The studied section is 4.5 km long. It also includes part of Stoyan Mihaylovski Street at its intersection with Peyo K. Yavorov Blvd. The section intersects with other streets in the city’s street network at 23 different locations. The intersections formed by these intersections are mainly at one level, with the exception of two: the intersection with Okolovrasten Pat Street, where the intersection is organized at two levels with traffic light regulation on one level, and the intersection of Stoyan Mihaylovski Street with Peyo K. Yavorov Blvd., which is the beginning of the studied section. There are seven more intersections that are regulated by traffic lights. The rest have priority signs, with priority given to Simeonovsko Shose Blvd. as a higher-class street.
For the purposes of this study, the number of vehicles was counted from Peyo K. Yavorov Blvd. to Okolovrasten Pat St. between the intersections where traffic lights were used (Figure 2). This is assumed from the fact that the remaining intersections do not have a significant impact on the intensity of the studied section due to their low intensity on secondary streets, as proven by preliminary observations.
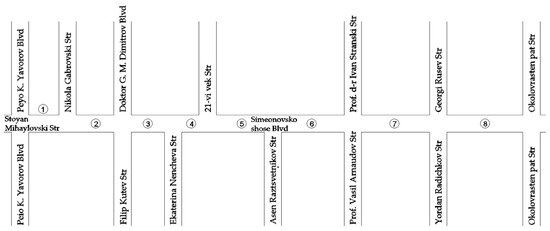
Figure 2.
Layout diagram of the surveyed areas.
The designated sections for reporting the intensity of traffic flow are as follows:
- -
- Part 1—between Peyo K. Yavorov Blvd. and Nikola Gabrovski St.;
- -
- Part 2—between Nikola Gabrovski St. and Filip Kutev St. (Doctor G. M. Dimitrov Blvd.);
- -
- Part 3—between Filip Kutev St. (Doctor G. M. Dimitrov Blvd.) and Ekaterina Nedelcheva St.;
- -
- Part 4—between Ekaterina Nedelcheva St. and 21st Century St.;
- -
- Part 5—between 21st Century St. and Asen Raztsvetnikov St.;
- -
- Part 6—between Asen Raztsvetnikov St. and Prof. Vasil Arnaudov St. (Prof. Dr. Ivan Stranski St.);
- -
- Part 7—between “Prof. Vasil Arnaudov (Prof. Dr. Ivan Stranski St.) and “Yordan Radichkov St.” (Georgi Rusev St.) and
- -
- Part 8—between”Yordan Radichkov St. (Georgi Rusev St.) and Okolovrasten Pat St.
Traffic intensity was measured during the evening peak period between 17:00 and 18:00 on weekdays in April 2024. Preliminary studies have shown that the evening peak period has higher values than the morning peak, but with a shorter duration. This is the reason for the choice of the period and duration of the measurement. This includes determining the number of vehicles passing through the designated part of the studied section in different directions of movement. The measurements were carried out directly by an observer trained to perform them and record the data in a specially made form for this purpose (Appendix A.1). The composition of the vehicles was recorded during the study. This is caused by the passage of public transport, which consists of different types of buses, along the studied section, and its use for the passage of trucks to the neighborhoods that it connects. Therefore, the results are presented in reduced units. The composition of the vehicles was recorded using the types of vehicles defined in the regulatory framework of the Republic of Bulgaria with the relevant equivalence coefficients, as shown in Table 1.

Table 1.
Coefficient of equalization 1 [30].
During the measurements, the passing vehicles were distributed in five-minute intervals to determine the unevenness of the intensity within the studied hour.
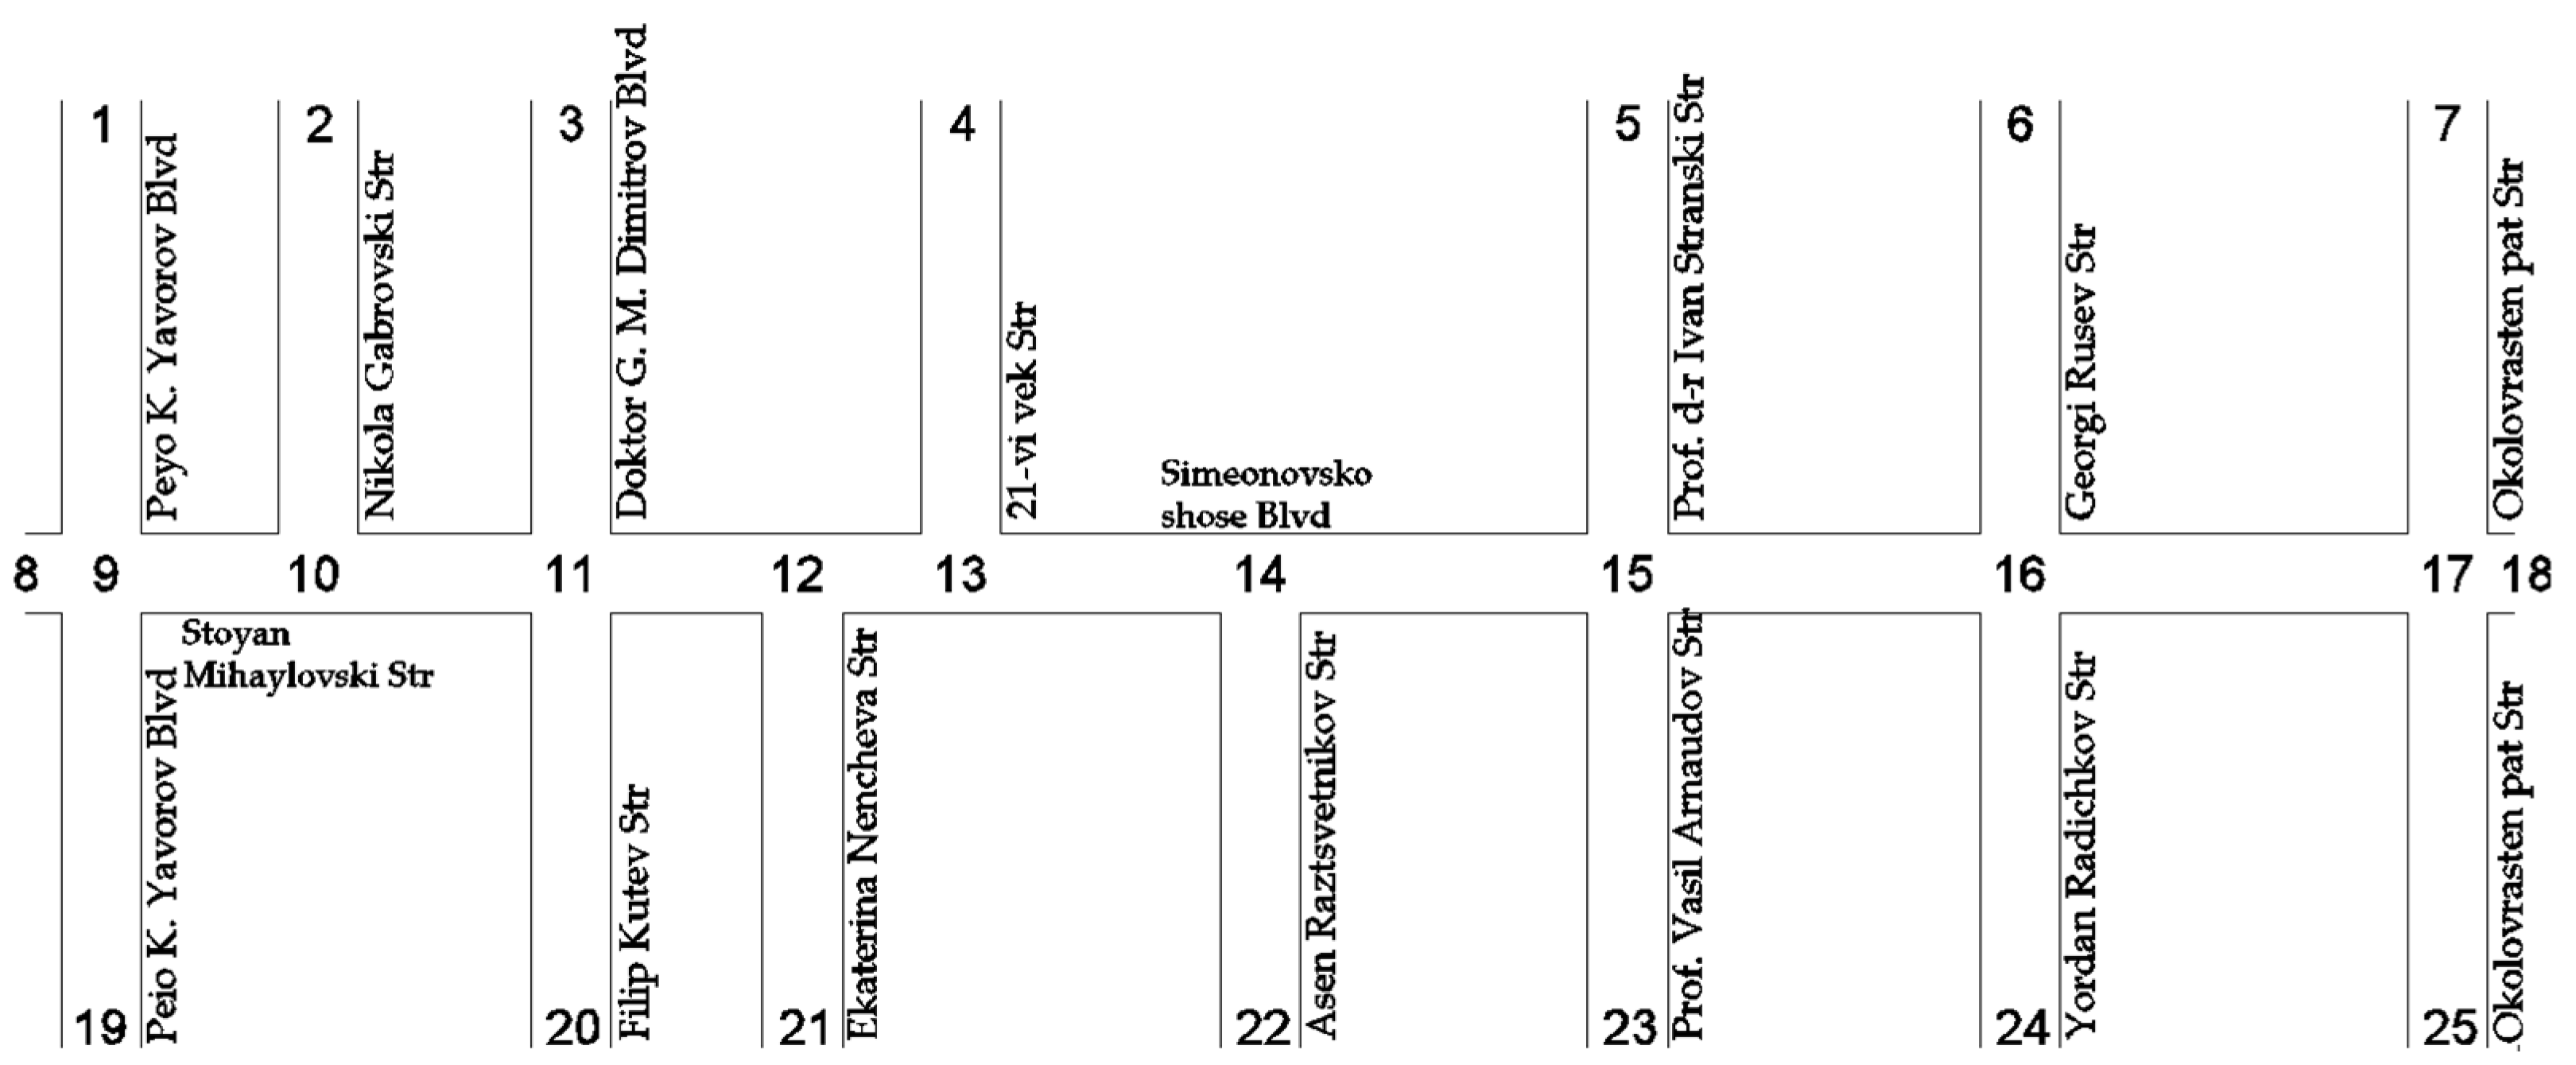
To determine the influence of the traffic load of individual traffic light-regulated intersections on the traffic intensity of individual parts of the studied section and to determine the intensity of the traffic flows that have the greatest impact on its load, traffic flow intensity values were determined for each intersection. A method with video recording of the intersection and profile counting for a period of 15 min during the evening peak period was used. For this purpose, the traffic flows of the traffic light-regulated intersections were designated by numbering consecutive intersections, as shown in Figure 3.

Figure 3.
Numbering of traffic flows at traffic-light-controlled intersections in the studied area.
3. Results
After the observations and data processing, the following results were obtained for the transport flow intensity in the parts of the studied section indicated in Figure 1 by direction, as shown in Table 2.
Table 2.
Results of the measurement to establish the intensity of transport flows in the individual parts of the studied section.
The values with detailed results, which also show the relationship between the composition of the transport flows and the results shown in Table 2, are presented in Appendix A.2.
The traffic loads at the individual intersections in the study area are presented in Table 3, Table 4 and Table 5. The results are averaged for one hour of the peak period. The detailed measurement data are presented in Appendix A.3.
Table 3.
Measurement results for determining the traffic load at intersections 9, 10, and 11.
Table 4.
Measurement results for determining the traffic load at intersections 12, 13, and 14.
Table 5.
Measurement results for determining the traffic load at intersections 15, 16, and 17.
4. Discussion
The load on each part of the studied section is uniform in both directions, as can be seen from the results shown in Table 2. The exception is the section between Yordan Radichkov Street (Georgi Rusev Street) and Okolovrasten Pat Street, for which a difference of over 25% is observed in favor of those traveling from Okolovrasten Pat Street. This is mainly due to the larger number of vehicles that arrive from Okolovrasten Pat Street but deviate at the first intersection (Intersection 16), which can be explained by the preferred route of returning home for the residents of the neighborhood. This is also seen from the small number of vehicles arriving in the neighborhood, from the flow 15-16-06.
The data analysis shows that the parts of the studied section with the highest intensity values are between Peyo K. Yavorov Blvd. and Nikola Gabrovski St. (Part 1) and between Prof. Vasil Arnaudov St. (Prof. Dr. Ivan Stranski St.) and Okolovrasten Pat St. (Part 7 and Part 8). They differ in the load from the other parts by over 35%, with the busiest part (Part 1) reaching differences of over 80%. This is also due to the preferred routes of residents and workers in the neighborhoods along whose extension the studied section passes. For the other parts, it is striking that the intensity of the transport flows is relatively the same, with values of around 1000 PCU/h. This leads us to assume that the transport load of the individual intersections that form the parts of the studied section does not affect their load or that the transport flows that leave and enter these parts are of relatively equal intensity.
The influence of traffic flow from individual intersections on the loading of the sections in the studied section is expressed as follows:
- -
- The loading of Section 1 in the direction of Okolovrasten Pat Street is formed mainly by flows 01-09-10, which determines about 50% of the intensity in this direction of the section. It is noticeable that in the other direction, about 40% of the loading is formed by the flow coming from Nikola Gabrovski Street 02-10-09. In addition, there is no significant outflow of cars from flow 11-10-02, which is the reason for the significant increase in the value of the intensity of the traffic flow in this section.
- -
- The loading of Section 2 in the direction of Okolovrasten Pat Street, the cars coming from Nikola Gabrovski Street (flow 02-10-11), are about 10% of the loading of this section. In the direction of Peyo K. Yavorov Blvd., the same trend is observed with the incoming vehicles from flows 03-11-10 and 20-11-10. Observations show that the outflow of vehicles at Intersection 10 from flow 09-10-02 is significant, which is the reason for the reduction in the load in this part compared with Part 1.
- -
- The loads of parts 3, 4, 5, and 6 are characterized by the same trend, whereby, in both directions, they are formed by incoming flows within 10-15% of the total load. The outgoing flows at these intersections were in the same range as the total load. This is also the reason for the relatively equal values of the intensity of transport flows in these parts.
- -
- The intensity of the transport flows at Intersection 15, similar to Intersection 10, has an extremely high impact on the load of the individual parts before and after it. It turns out that about 50% of the flow in section 7 towards Peyo K. Yavorov Blvd. flows into this intersection (flow 16-15-05). However, approximately 40% of the load in Section 7 towards Okolovrasten pat Str. is formed by the incoming vehicles from flow 05-15-16. These facts contribute to the reduction of the intensity in Section 6 towards Peyo K. Yavorov Blvd., compared to the load in Section 7, as well as the reason for the increase in the intensity of the transport flows in Section 7 towards Okolovrasten pat Str.
The analysis of the unevenness of the intensity of the transport flows in the individual parts shows that the difference for the divided periods of five minutes within the studied hour varies between 30% and 40%. An exception to this is the transport flow from Part 3 in the direction of Peyo K. Yavorov Street, where the difference is smaller, within about 20%.
5. Conclusions
The study of the transport load on the section between Peyo K. Yavorov Blvd. and Okolovrasten Pat Str. shows the results that need to be used to improve the organization and regulation of traffic through the considered radial connection of the street network of the city of Sofia.
The results provide grounds for revising the number and type of phases of traffic-light-regulated intersections, which should be in line with the main directions of traffic flows. In this case, it is necessary to pay attention to the organization of traffic, which should provide the necessary lanes for them, which may lead to the reconstruction of some intersections. This will certainly lead to a revision of the operating times for individual signals and the compilation of new time diagrams. In this regard, and given the reported unevenness of traffic flows within the studied hour, it is necessary to build adaptive signal regulation of all traffic light-regulated intersections, some of which are included in such a traffic management system in the city.
The measured data and subsequent analysis were provided to the Municipality of Sofia for review and as a basis for making adequate decisions to improve traffic on the surveyed section.
Author Contributions
All authors contributed equally to achieve the results presented in this publication. Conceptualization: D.S., G.M. and P.P.; methodology: D.S., G.M. and P.P.; investigation: D.S., G.M. and P.P.; formal analysis: D.S. and G.M.; writing—original draft preparation: D.S.; writing—review and editing: G.M. and P.P.; visualization: D.S. and G.M. All authors have read and agreed to the published version of the manuscript.
Funding
This research received no external funding.
Institutional Review Board Statement
Not applicable.
Informed Consent Statement
Not applicable.
Data Availability Statement
The data is contained within the article.
Acknowledgments
The authors thank the Research and Development Sector at the Technical University of Sofia for financial support.
Conflicts of Interest
The authors declare no conflicts of interest.
Appendix A
Appendix A.1
A form was developed for recording the results of the study.
Table A1.
Form for recording the results of the study.
Table A1.
Form for recording the results of the study.
| Types of Vehicles/Intervals, min | Passenger Car, Including Ambulance, Light Commercial Vehicle with Payload up to 800 kg, Minibus up to 12 Seats and Similar | Moped, Cyclist | Motorcycle | Truck with Payload up to 5 t, Minibus over 12 Seats | Truck with a Payload of over 5 t | Bus or Trolleybus | Tractor Unit with Trailer, Articulated Bus or Trolleybus | Intensity, Veh | Intensity, PCU |
|---|---|---|---|---|---|---|---|---|---|
| 0–5 | |||||||||
| 5–10 | |||||||||
| 10–15 | |||||||||
| 15–20 | |||||||||
| 20–25 | |||||||||
| 25–30 | |||||||||
| 30–35 | |||||||||
| 35–40 | |||||||||
| 40–45 | |||||||||
| 45–50 | |||||||||
| 50–55 | |||||||||
| 55–60 | |||||||||
| Total |
Appendix A.2
The results of the study on the intensity of transport flows in the individual parts of the studied section.
Table A2.
Traffic flow intensity from part 1 in the direction of Okolovrasten Pat Street.
Table A2.
Traffic flow intensity from part 1 in the direction of Okolovrasten Pat Street.
| Types of Vehicles/Intervals, min | Passenger Car, Including Ambulance, Light Commercial Vehicle with Payload up to 800 kg, Minibus up to 12 Seats and Similar | Moped, Cyclist | Motorcycle | Truck with Payload up to 5 t, Minibus over 12 Seats | Truck with a Payload of over 5 t | Bus or Trolleybus | Tractor Unit with Trailer, Articulated Bus or Trolleybus | Intensity, Veh | Intensity, PCU |
|---|---|---|---|---|---|---|---|---|---|
| 0–5 | 151 | 0 | 0 | 2 | 0 | 0 | 1 | 154 | 156.5 |
| 5–10 | 183 | 1 | 0 | 1 | 1 | 0 | 1 | 187 | 191.3 |
| 10–15 | 132 | 0 | 0 | 0 | 2 | 0 | 2 | 136 | 143 |
| 15–20 | 116 | 0 | 0 | 4 | 1 | 0 | 2 | 123 | 133.5 |
| 20–25 | 154 | 0 | 1 | 2 | 0 | 0 | 1 | 158 | 162 |
| 25–30 | 128 | 0 | 0 | 1 | 0 | 0 | 1 | 130 | 133.5 |
| 30–35 | 167 | 0 | 1 | 0 | 1 | 0 | 2 | 172 | 177 |
| 35–40 | 107 | 1 | 0 | 0 | 0 | 1 | 1 | 110 | 113.8 |
| 40–45 | 135 | 0 | 2 | 3 | 1 | 0 | 1 | 142 | 148 |
| 45–50 | 129 | 1 | 0 | 2 | 1 | 0 | 2 | 135 | 142.8 |
| 50–55 | 147 | 0 | 0 | 0 | 2 | 0 | 3 | 152 | 162.5 |
| 55–60 | 174 | 0 | 0 | 1 | 0 | 0 | 1 | 176 | 179.5 |
| Total | 1775 | 1843.4 |
Table A3.
Traffic flow intensity from Part 1 in the direction of Peyo K. Yavorov Blvd.
Table A3.
Traffic flow intensity from Part 1 in the direction of Peyo K. Yavorov Blvd.
| Types of Vehicles/Intervals, min | Passenger Car, Including Ambulance, Light Commercial Vehicle with Payload up to 800 kg, Minibus up to 12 Seats and Similar | Moped, Cyclist | Motorcycle | Truck with Payload up to 5 t, Minibus over 12 Seats | Truck with a Payload of over 5 t | Bus or Trolleybus | Tractor Unit with Trailer, Articulated Bus or Trolleybus | Intensity, Veh | Intensity, PCU |
|---|---|---|---|---|---|---|---|---|---|
| 0–5 | 121 | 0 | 0 | 1 | 2 | 0 | 2 | 126 | 135 |
| 5–10 | 175 | 0 | 0 | 2 | 3 | 0 | 0 | 180 | 186.5 |
| 10–15 | 140 | 0 | 0 | 0 | 0 | 0 | 3 | 143 | 150.5 |
| 15–20 | 117 | 0 | 1 | 2 | 1 | 0 | 1 | 121 | 125 |
| 20–25 | 123 | 0 | 0 | 0 | 0 | 0 | 2 | 125 | 130 |
| 25–30 | 105 | 1 | 0 | 3 | 0 | 0 | 2 | 111 | 118.3 |
| 30–35 | 136 | 0 | 0 | 1 | 1 | 0 | 1 | 139 | 144 |
| 35–40 | 114 | 0 | 1 | 0 | 0 | 0 | 1 | 116 | 118 |
| 40–45 | 107 | 0 | 0 | 2 | 1 | 0 | 2 | 112 | 120.5 |
| 45–50 | 154 | 1 | 0 | 4 | 2 | 0 | 1 | 163 | 170.8 |
| 50–55 | 148 | 0 | 1 | 6 | 0 | 0 | 0 | 155 | 160.5 |
| 55–60 | 127 | 0 | 1 | 3 | 1 | 0 | 2 | 134 | 143 |
| Total | 1625 | 1702.1 |
Table A4.
Traffic flow intensity from Part 2 in the direction of Okolovrasten Pat Street.
Table A4.
Traffic flow intensity from Part 2 in the direction of Okolovrasten Pat Street.
| Types of Vehicles/Intervals, min | Passenger Car, Including Ambulance, Light Commercial Vehicle with Payload up to 800 kg, Minibus up to 12 Seats and Similar | Moped, Cyclist | Motorcycle | Truck with Payload up to 5 t, Minibus over 12 Seats | Truck with a Payload of over 5 t | Bus or Trolleybus | Tractor Unit with Trailer, Articulated Bus or Trolleybus | Intensity, Veh | Intensity, PCU |
|---|---|---|---|---|---|---|---|---|---|
| 0–5 | 98 | 1 | 0 | 0 | 0 | 0 | 0 | 99 | 98.3 |
| 5–10 | 78 | 1 | 3 | 2 | 0 | 1 | 0 | 85 | 86.8 |
| 10–15 | 69 | 1 | 0 | 1 | 0 | 1 | 0 | 73 | 77.8 |
| 15–20 | 76 | 0 | 0 | 3 | 0 | 0 | 0 | 79 | 82 |
| 20–25 | 70 | 0 | 1 | 1 | 1 | 0 | 0 | 73 | 75 |
| 25–30 | 94 | 0 | 1 | 0 | 0 | 0 | 0 | 95 | 94.5 |
| 30–35 | 118 | 1 | 2 | 0 | 0 | 0 | 1 | 122 | 122.8 |
| 35–40 | 96 | 0 | 0 | 1 | 0 | 0 | 0 | 97 | 98 |
| 40–45 | 74 | 0 | 1 | 2 | 1 | 0 | 0 | 78 | 81 |
| 45–50 | 81 | 1 | 0 | 0 | 0 | 1 | 0 | 83 | 84.3 |
| 50–55 | 74 | 0 | 1 | 1 | 0 | 0 | 0 | 76 | 76.5 |
| 55–60 | 91 | 0 | 0 | 1 | 1 | 0 | 0 | 93 | 95.5 |
| Total | 1053 | 1072.5 |
Table A5.
Traffic flow intensity from Part 2 in the direction of Peyo K. Yavorov Blvd.
Table A5.
Traffic flow intensity from Part 2 in the direction of Peyo K. Yavorov Blvd.
| Types of Vehicles/Intervals, min | Passenger Car, Including Ambulance, Light Commercial Vehicle with Payload up to 800 kg, Minibus up to 12 Seats and Similar | Moped, Cyclist | Motorcycle | Truck with Payload up to 5 t, Minibus over 12 Seats | Truck with a Payload of over 5 t | Bus or Trolleybus | Tractor Unit with Trailer, Articulated Bus or Trolleybus | Intensity, Veh | Intensity, PCU |
|---|---|---|---|---|---|---|---|---|---|
| 0–5 | 78 | 0 | 1 | 2 | 0 | 0 | 0 | 81 | 82.5 |
| 5–10 | 60 | 1 | 1 | 1 | 1 | 0 | 0 | 64 | 65.3 |
| 10–15 | 81 | 0 | 0 | 2 | 1 | 0 | 0 | 84 | 87.5 |
| 15–20 | 63 | 0 | 0 | 0 | 2 | 1 | 0 | 66 | 71 |
| 20–25 | 64 | 0 | 2 | 1 | 0 | 0 | 0 | 67 | 67 |
| 25–30 | 65 | 0 | 1 | 1 | 0 | 0 | 0 | 67 | 67.5 |
| 30–35 | 89 | 1 | 1 | 0 | 0 | 0 | 0 | 91 | 89.8 |
| 35–40 | 86 | 2 | 0 | 0 | 0 | 0 | 0 | 88 | 86.6 |
| 40–45 | 75 | 1 | 0 | 2 | 0 | 0 | 0 | 78 | 79.3 |
| 45–50 | 64 | 0 | 2 | 1 | 1 | 0 | 0 | 68 | 71.5 |
| 50–55 | 70 | 1 | 0 | 0 | 0 | 0 | 0 | 71 | 70.3 |
| 55–60 | 83 | 1 | 1 | 0 | 0 | 1 | 0 | 86 | 86.8 |
| Total | 911 | 925.1 |
Table A6.
Traffic flow intensity from Part 3 in the direction of Okolovrasten Pat Street.
Table A6.
Traffic flow intensity from Part 3 in the direction of Okolovrasten Pat Street.
| Types of Vehicles/Intervals, min | Passenger Car, Including Ambulance, Light Commercial Vehicle with Payload up to 800 kg, Minibus up to 12 Seats and Similar | Moped, Cyclist | Motorcycle | Truck with Payload up to 5 t, Minibus over 12 Seats | Truck with a Payload of over 5 t | Bus or Trolleybus | Tractor Unit with Trailer, Articulated Bus or Trolleybus | Intensity, Veh | Intensity, PCU |
|---|---|---|---|---|---|---|---|---|---|
| 0–5 | 92 | 0 | 1 | 0 | 0 | 1 | 0 | 94 | 95.5 |
| 5–10 | 104 | 0 | 1 | 1 | 0 | 0 | 0 | 106 | 106.5 |
| 10–15 | 80 | 0 | 1 | 1 | 0 | 1 | 1 | 84 | 89 |
| 15–20 | 89 | 0 | 2 | 3 | 0 | 0 | 0 | 94 | 96 |
| 20–25 | 86 | 0 | 2 | 1 | 0 | 1 | 1 | 91 | 95.5 |
| 25–30 | 97 | 0 | 0 | 1 | 0 | 1 | 0 | 99 | 102 |
| 30–35 | 91 | 2 | 0 | 0 | 0 | 0 | 0 | 93 | 91.6 |
| 35–40 | 85 | 1 | 1 | 0 | 0 | 0 | 1 | 88 | 89.3 |
| 40–45 | 102 | 0 | 1 | 1 | 1 | 0 | 0 | 105 | 107 |
| 45–50 | 92 | 0 | 0 | 1 | 0 | 1 | 0 | 94 | 97 |
| 50–55 | 89 | 1 | 0 | 0 | 0 | 0 | 1 | 91 | 92.8 |
| 55–60 | 84 | 1 | 1 | 0 | 0 | 1 | 0 | 87 | 87.8 |
| Total | 1126 | 1150 |
Table A7.
Traffic flow intensity from Part 3 in the direction of Peyo K. Yavorov Blvd.
Table A7.
Traffic flow intensity from Part 3 in the direction of Peyo K. Yavorov Blvd.
| Types of Vehicles/Intervals, min | Passenger Car, Including Ambulance, Light Commercial Vehicle with Payload up to 800 kg, Minibus up to 12 Seats and Similar | Moped, Cyclist | Motorcycle | Truck with Payload up to 5 t, Minibus over 12 Seats | Truck with a Payload of over 5 t | Bus or Trolleybus | Tractor Unit with Trailer, Articulated Bus or Trolleybus | Intensity, Veh | Intensity, PCU |
|---|---|---|---|---|---|---|---|---|---|
| 0–5 | 82 | 0 | 3 | 0 | 0 | 0 | 0 | 85 | 83.5 |
| 5–10 | 74 | 0 | 1 | 2 | 1 | 0 | 0 | 78 | 81 |
| 10–15 | 101 | 0 | 1 | 2 | 1 | 0 | 0 | 105 | 108 |
| 15–20 | 76 | 2 | 1 | 4 | 0 | 0 | 0 | 83 | 85.1 |
| 20–25 | 69 | 2 | 1 | 4 | 1 | 1 | 1 | 79 | 87.1 |
| 25–30 | 75 | 0 | 2 | 0 | 1 | 1 | 0 | 79 | 81.5 |
| 30–35 | 70 | 0 | 1 | 1 | 1 | 0 | 2 | 75 | 82 |
| 35–40 | 81 | 1 | 1 | 0 | 0 | 0 | 0 | 83 | 81.8 |
| 40–45 | 77 | 1 | 0 | 1 | 1 | 1 | 0 | 80 | 82.3 |
| 45–50 | 72 | 0 | 1 | 0 | 0 | 0 | 1 | 74 | 76 |
| 50–55 | 83 | 0 | 1 | 2 | 0 | 1 | 0 | 87 | 90.5 |
| 55–60 | 88 | 2 | 0 | 1 | 0 | 0 | 1 | 92 | 94.1 |
| Total | 1000 | 1032.9 |
Table A8.
Traffic flow intensity from Part 4 in the direction of Okolovrasten Pat Street.
Table A8.
Traffic flow intensity from Part 4 in the direction of Okolovrasten Pat Street.
| Types of Vehicles/Intervals, min | Passenger Car, Including Ambulance, Light Commercial Vehicle with Payload up to 800 kg, Minibus up to 12 Seats and Similar | Moped, Cyclist | Motorcycle | Truck with Payload up to 5 t, Minibus over 12 Seats | Truck with a Payload of over 5 t | Bus or Trolleybus | Tractor Unit with Trailer, Articulated Bus or Trolleybus | Intensity, Veh | Intensity, PCU |
|---|---|---|---|---|---|---|---|---|---|
| 0–5 | 103 | 0 | 0 | 0 | 0 | 0 | 0 | 103 | 103 |
| 5–10 | 98 | 0 | 1 | 0 | 0 | 0 | 0 | 99 | 98.5 |
| 10–15 | 97 | 0 | 2 | 0 | 0 | 0 | 0 | 99 | 98 |
| 15–20 | 105 | 0 | 1 | 0 | 0 | 1 | 1 | 108 | 112 |
| 20–25 | 94 | 0 | 0 | 2 | 1 | 0 | 1 | 98 | 104 |
| 25–30 | 74 | 1 | 0 | 2 | 0 | 1 | 0 | 78 | 81.3 |
| 30–35 | 90 | 0 | 2 | 1 | 1 | 0 | 0 | 94 | 95.5 |
| 35–40 | 83 | 0 | 1 | 1 | 1 | 0 | 0 | 86 | 88 |
| 40–45 | 97 | 0 | 0 | 0 | 1 | 1 | 1 | 100 | 106 |
| 45–50 | 102 | 1 | 0 | 0 | 0 | 0 | 0 | 103 | 102.3 |
| 50–55 | 107 | 0 | 2 | 2 | 0 | 0 | 1 | 112 | 115.5 |
| 55–60 | 79 | 0 | 0 | 2 | 0 | 1 | 0 | 82 | 86 |
| Total | 1162 | 1190.1 |
Table A9.
Traffic flow intensity from Part 4 in the direction of Peyo K. Yavorov Blvd.
Table A9.
Traffic flow intensity from Part 4 in the direction of Peyo K. Yavorov Blvd.
| Types of Vehicles/Intervals, min | Passenger Car, Including Ambulance, Light Commercial Vehicle with Payload up to 800 kg, Minibus up to 12 Seats and Similar | Moped, Cyclist | Motorcycle | Truck with Payload up to 5 t, Minibus over 12 Seats | Truck with a Payload of over 5 t | Bus or Trolleybus | Tractor Unit with Trailer, Articulated Bus or Trolleybus | Intensity, Veh | Intensity, PCU |
|---|---|---|---|---|---|---|---|---|---|
| 0–5 | 97 | 0 | 1 | 3 | 1 | 2 | 0 | 104 | 112 |
| 5–10 | 96 | 1 | 1 | 1 | 0 | 0 | 1 | 100 | 102.3 |
| 10–15 | 85 | 0 | 1 | 5 | 0 | 1 | 0 | 92 | 98.5 |
| 15–20 | 84 | 0 | 3 | 3 | 0 | 1 | 1 | 92 | 98 |
| 20–25 | 111 | 0 | 2 | 1 | 0 | 0 | 0 | 114 | 114 |
| 25–30 | 82 | 1 | 1 | 2 | 0 | 0 | 0 | 86 | 86.8 |
| 30–35 | 75 | 1 | 4 | 0 | 0 | 1 | 0 | 81 | 80.3 |
| 35–40 | 83 | 0 | 1 | 1 | 1 | 0 | 1 | 87 | 91.5 |
| 40–45 | 84 | 0 | 0 | 0 | 0 | 0 | 0 | 84 | 84 |
| 45–50 | 77 | 0 | 1 | 0 | 0 | 1 | 0 | 79 | 80.5 |
| 50–55 | 91 | 1 | 0 | 3 | 1 | 0 | 1 | 97 | 103.3 |
| 55–60 | 87 | 0 | 1 | 2 | 0 | 1 | 0 | 91 | 94.5 |
| Total | 1107 | 1145.7 |
Table A10.
Traffic flow intensity from Part 5 in the direction of Okolovrasten Pat Street.
Table A10.
Traffic flow intensity from Part 5 in the direction of Okolovrasten Pat Street.
| Types of Vehicles/Intervals, min | Passenger Car, Including Ambulance, Light Commercial Vehicle with Payload up to 800 kg, Minibus up to 12 Seats and Similar | Moped, Cyclist | Motorcycle | Truck with Payload up to 5 t, Minibus over 12 Seats | Truck with a Payload of over 5 t | Bus or Trolleybus | Tractor Unit with Trailer, Articulated Bus or Trolleybus | Intensity, Veh | Intensity, PCU |
|---|---|---|---|---|---|---|---|---|---|
| 0–5 | 88 | 0 | 1 | 2 | 0 | 1 | 1 | 93 | 99 |
| 5–10 | 96 | 1 | 0 | 3 | 0 | 0 | 0 | 100 | 102.3 |
| 10–15 | 74 | 0 | 2 | 1 | 0 | 1 | 1 | 79 | 83.5 |
| 15–20 | 93 | 0 | 1 | 1 | 0 | 0 | 0 | 95 | 95.5 |
| 20–25 | 102 | 0 | 0 | 1 | 0 | 1 | 1 | 105 | 110.5 |
| 25–30 | 89 | 0 | 0 | 0 | 0 | 0 | 0 | 89 | 89 |
| 30–35 | 68 | 0 | 0 | 0 | 0 | 1 | 0 | 69 | 71 |
| 35–40 | 74 | 1 | 1 | 0 | 0 | 0 | 1 | 77 | 78.3 |
| 40–45 | 91 | 1 | 0 | 2 | 0 | 1 | 0 | 95 | 98.3 |
| 45–50 | 63 | 0 | 0 | 1 | 0 | 0 | 1 | 65 | 68.5 |
| 50–55 | 77 | 1 | 1 | 0 | 0 | 0 | 0 | 79 | 77.8 |
| 55–60 | 64 | 1 | 0 | 2 | 0 | 1 | 1 | 69 | 72.8 |
| Total | 1014 | 976.5 |
Table A11.
Traffic flow intensity from Part 5 in the direction of Peyo K. Yavorov Blvd.
Table A11.
Traffic flow intensity from Part 5 in the direction of Peyo K. Yavorov Blvd.
| Types of Vehicles/Intervals, min | Passenger Car, Including Ambulance, Light Commercial Vehicle with Payload up to 800 kg, Minibus up to 12 Seats and Similar | Moped, cyclist | Motorcycle | Truck with Payload up to 5 t, Minibus over 12 Seats | Truck with a Payload of over 5 t | Bus or Trolleybus | Tractor Unit with Trailer, Articulated Bus or Trolleybus | Intensity, Veh | Intensity, PCU |
|---|---|---|---|---|---|---|---|---|---|
| 0–5 | 91 | 0 | 0 | 1 | 1 | 1 | 0 | 94 | 98.5 |
| 5–10 | 107 | 1 | 2 | 0 | 1 | 0 | 1 | 112 | 114.3 |
| 10–15 | 68 | 1 | 1 | 2 | 1 | 0 | 0 | 73 | 75.3 |
| 15–20 | 86 | 0 | 0 | 0 | 0 | 0 | 2 | 88 | 93 |
| 20–25 | 92 | 0 | 2 | 2 | 0 | 1 | 0 | 97 | 100 |
| 25–30 | 70 | 0 | 1 | 1 | 1 | 0 | 1 | 74 | 78.5 |
| 30–35 | 81 | 0 | 0 | 1 | 0 | 1 | 1 | 84 | 89.5 |
| 35–40 | 75 | 1 | 1 | 0 | 0 | 0 | 0 | 75 | 75.8 |
| 40–45 | 69 | 0 | 1 | 1 | 1 | 0 | 1 | 73 | 77.5 |
| 45–50 | 82 | 1 | 0 | 1 | 0 | 1 | 1 | 86 | 90.8 |
| 50–55 | 90 | 0 | 1 | 0 | 0 | 0 | 0 | 91 | 90.5 |
| 55–60 | 66 | 2 | 0 | 1 | 0 | 1 | 0 | 70 | 71.6 |
| Total | 1017 | 1055.3 |
Table A12.
Traffic flow intensity from Part 6 in the direction of Okolovrasten Pat Street.
Table A12.
Traffic flow intensity from Part 6 in the direction of Okolovrasten Pat Street.
| Types of Vehicles/Intervals, min | Passenger Car, Including Ambulance, Light Commercial Vehicle with Payload up to 800 kg, Minibus up to 12 Seats and Similar | Moped, Cyclist | Motorcycle | Truck with Payload up to 5 t, Minibus over 12 Seats | Truck with a Payload of over 5 t | Bus or Trolleybus | Tractor Unit with Trailer, Articulated Bus or Trolleybus | Intensity, Veh | Intensity, PCU |
|---|---|---|---|---|---|---|---|---|---|
| 0–5 | 74 | 0 | 1 | 1 | 1 | 2 | 1 | 80 | 88.5 |
| 5–10 | 100 | 0 | 0 | 0 | 1 | 2 | 0 | 103 | 108.5 |
| 10–15 | 77 | 0 | 4 | 2 | 1 | 1 | 1 | 86 | 92 |
| 15–20 | 79 | 2 | 0 | 0 | 0 | 0 | 1 | 82 | 83.1 |
| 20–25 | 57 | 1 | 3 | 1 | 0 | 1 | 0 | 63 | 63.8 |
| 25–30 | 58 | 0 | 2 | 2 | 0 | 1 | 1 | 64 | 69.5 |
| 30–35 | 64 | 1 | 2 | 0 | 1 | 1 | 0 | 69 | 70.8 |
| 35–40 | 70 | 0 | 1 | 2 | 0 | 0 | 1 | 74 | 78 |
| 40–45 | 71 | 1 | 0 | 0 | 0 | 2 | 0 | 74 | 77.3 |
| 45–50 | 64 | 1 | 1 | 0 | 0 | 0 | 0 | 66 | 64.8 |
| 50–55 | 59 | 0 | 2 | 1 | 1 | 0 | 1 | 64 | 68 |
| 55–60 | 67 | 0 | 1 | 2 | 0 | 1 | 1 | 72 | 78 |
| Total | 897 | 942.3 |
Table A13.
Traffic flow intensity from Part 6 in the direction of Peyo K. Yavorov Blvd.
Table A13.
Traffic flow intensity from Part 6 in the direction of Peyo K. Yavorov Blvd.
| Types of Vehicles/Intervals, min | Passenger Car, Including Ambulance, Light Commercial Vehicle with Payload up to 800 kg, Minibus up to 12 Seats and Similar | Moped, Cyclist | Motorcycle | Truck with Payload up to 5 t, Minibus over 12 Seats | Truck with a Payload of over 5 t | Bus or Trolleybus | Tractor Unit with Trailer, Articulated Bus or Trolleybus | Intensity, Veh | Intensity, PCU |
|---|---|---|---|---|---|---|---|---|---|
| 0–5 | 69 | 0 | 0 | 4 | 0 | 1 | 0 | 74 | 80 |
| 5–10 | 78 | 0 | 3 | 2 | 0 | 1 | 0 | 84 | 86.5 |
| 10–15 | 83 | 1 | 2 | 2 | 1 | 0 | 0 | 89 | 90.8 |
| 15–20 | 61 | 0 | 1 | 2 | 0 | 2 | 0 | 66 | 71.5 |
| 20–25 | 82 | 1 | 3 | 1 | 1 | 1 | 0 | 89 | 91.3 |
| 25–30 | 92 | 0 | 2 | 2 | 1 | 1 | 0 | 98 | 102.5 |
| 30–35 | 78 | 1 | 1 | 1 | 1 | 1 | 1 | 84 | 89.8 |
| 35–40 | 90 | 0 | 1 | 3 | 0 | 0 | 1 | 95 | 100 |
| 40–45 | 84 | 3 | 0 | 0 | 1 | 1 | 0 | 89 | 90.4 |
| 45–50 | 88 | 0 | 3 | 2 | 0 | 1 | 0 | 94 | 96.5 |
| 50–55 | 82 | 0 | 0 | 0 | 1 | 0 | 1 | 84 | 88 |
| 55–60 | 94 | 1 | 0 | 2 | 0 | 1 | 1 | 99 | 104.8 |
| Total | 1045 | 1092.1 |
Table A14.
Traffic flow intensity from part 7 in the direction of Okolovrasten Pat Street.
Table A14.
Traffic flow intensity from part 7 in the direction of Okolovrasten Pat Street.
| Types of Vehicles/Intervals, min | Passenger Car, Including Ambulance, Light Commercial Vehicle with Payload up to 800 kg, Minibus up to 12 Seats and Similar | Moped, Cyclist | Motorcycle | Truck with Payload up to 5 t, Minibus over 12 Seats | Truck with a Payload of over 5 t | Bus or Trolleybus | Tractor Unit with Trailer, Articulated Bus or Trolleybus | Intensity, Veh | Intensity, PCU |
|---|---|---|---|---|---|---|---|---|---|
| 0–5 | 112 | 0 | 0 | 4 | 0 | 0 | 1 | 117 | 123.5 |
| 5–10 | 142 | 0 | 0 | 2 | 0 | 1 | 0 | 145 | 149 |
| 10–15 | 108 | 0 | 0 | 2 | 0 | 1 | 0 | 111 | 115 |
| 15–20 | 90 | 1 | 0 | 0 | 0 | 0 | 0 | 91 | 90.3 |
| 20–25 | 78 | 0 | 0 | 2 | 0 | 1 | 0 | 81 | 85 |
| 25–30 | 130 | 0 | 0 | 4 | 0 | 1 | 0 | 135 | 141 |
| 30–35 | 124 | 0 | 1 | 1 | 1 | 0 | 0 | 127 | 129 |
| 35–40 | 118 | 1 | 0 | 0 | 0 | 0 | 0 | 119 | 118.3 |
| 40–45 | 130 | 0 | 3 | 1 | 1 | 0 | 1 | 136 | 139.5 |
| 45–50 | 128 | 0 | 2 | 1 | 0 | 1 | 1 | 133 | 137.5 |
| 50–55 | 119 | 1 | 1 | 1 | 1 | 1 | 0 | 124 | 127.3 |
| 55–60 | 122 | 0 | 0 | 4 | 0 | 0 | 1 | 127 | 133.5 |
| Total | 1446 | 1488.9 |
Table A15.
Traffic flow intensity from Part 7 in the direction of Peyo K. Yavorov Blvd.
Table A15.
Traffic flow intensity from Part 7 in the direction of Peyo K. Yavorov Blvd.
| Types of Vehicles/Intervals, min | Passenger Car, Including Ambulance, Light Commercial Vehicle with Payload up to 800 kg, Minibus up to 12 Seats and Similar | Moped, Cyclist | Motorcycle | Truck with Payload up to 5 t, Minibus over 12 Seats | Truck with a Payload of over 5 t | Bus or Trolleybus | Tractor Unit with Trailer, Articulated Bus or Trolleybus | Intensity, Veh | Intensity, PCU |
|---|---|---|---|---|---|---|---|---|---|
| 0–5 | 141 | 0 | 0 | 2 | 1 | 0 | 0 | 144 | 147.5 |
| 5–10 | 118 | 0 | 0 | 0 | 0 | 1 | 0 | 119 | 121 |
| 10–15 | 103 | 0 | 0 | 0 | 0 | 0 | 0 | 103 | 103 |
| 15–20 | 132 | 0 | 0 | 2 | 1 | 2 | 1 | 138 | 148 |
| 20–25 | 119 | 0 | 1 | 1 | 0 | 3 | 0 | 124 | 130.5 |
| 25–30 | 110 | 1 | 2 | 1 | 1 | 1 | 0 | 116 | 118.8 |
| 30–35 | 131 | 0 | 0 | 4 | 1 | 0 | 1 | 137 | 145 |
| 35–40 | 102 | 0 | 2 | 1 | 0 | 0 | 1 | 106 | 108.5 |
| 40–45 | 97 | 1 | 1 | 1 | 2 | 0 | 0 | 102 | 104.8 |
| 45–50 | 128 | 0 | 2 | 1 | 0 | 2 | 0 | 133 | 137 |
| 50–55 | 117 | 0 | 1 | 2 | 1 | 0 | 1 | 122 | 127.5 |
| 55–60 | 136 | 0 | 0 | 2 | 0 | 1 | 0 | 139 | 143 |
| Total | 1483 | 1534.6 |
Table A16.
Traffic flow intensity from part 8 in the direction of Okolovrasten Pat Street.
Table A16.
Traffic flow intensity from part 8 in the direction of Okolovrasten Pat Street.
| Types of Vehicles/Intervals, min | Passenger Car, Including Ambulance, Light Commercial Vehicle with Payload up to 800 kg, Minibus up to 12 Seats and Similar | Moped, Cyclist | Motorcycle | Truck with Payload up to 5 t, Minibus over 12 Seats | Truck with a Payload of over 5 t | Bus or trolleybus | Tractor Unit with Trailer, Articulated Bus or Trolleybus | Intensity, Veh | Intensity, PCU |
|---|---|---|---|---|---|---|---|---|---|
| 0–5 | 127 | 0 | 1 | 4 | 0 | 0 | 0 | 132 | 135.5 |
| 5–10 | 125 | 0 | 0 | 1 | 0 | 0 | 0 | 126 | 127 |
| 10–15 | 101 | 0 | 2 | 2 | 0 | 1 | 1 | 107 | 112.5 |
| 15–20 | 97 | 0 | 1 | 1 | 0 | 1 | 0 | 100 | 102.5 |
| 20–25 | 87 | 1 | 0 | 4 | 1 | 1 | 0 | 94 | 100.8 |
| 25–30 | 87 | 1 | 0 | 1 | 1 | 0 | 0 | 90 | 91.8 |
| 30–35 | 117 | 0 | 1 | 3 | 1 | 1 | 1 | 124 | 132.5 |
| 35–40 | 121 | 0 | 0 | 0 | 0 | 0 | 0 | 121 | 121 |
| 40–45 | 95 | 0 | 1 | 3 | 1 | 0 | 0 | 100 | 104 |
| 45–50 | 103 | 0 | 0 | 1 | 0 | 0 | 0 | 104 | 105 |
| 50–55 | 114 | 1 | 1 | 2 | 0 | 1 | 0 | 119 | 121.8 |
| 55–60 | 86 | 0 | 2 | 0 | 1 | 0 | 0 | 89 | 89.5 |
| Total | 1306 | 1343.9 |
Table A17.
Traffic flow intensity from Part 8 in the direction of Peyo K. Yavorov Blvd.
Table A17.
Traffic flow intensity from Part 8 in the direction of Peyo K. Yavorov Blvd.
| Types of Vehicles/Intervals, min | Passenger Car, Including Ambulance, Light Commercial Vehicle with Payload up to 800 kg, Minibus up to 12 Seats and Similar | Moped, Cyclist | Motorcycle | Truck with Payload up to 5 t, Minibus over 12 Seats | Truck with a Payload of over 5 t | Bus or Trolleybus | Tractor Unit with Trailer, Articulated Bus or Trolleybus | Intensity, Veh | Intensity, PCU |
|---|---|---|---|---|---|---|---|---|---|
| 0–5 | 118 | 0 | 1 | 2 | 1 | 0 | 0 | 122 | 125 |
| 5–10 | 148 | 0 | 0 | 1 | 1 | 1 | 0 | 151 | 155.5 |
| 10–15 | 161 | 0 | 0 | 2 | 0 | 1 | 0 | 164 | 168 |
| 15–20 | 165 | 0 | 0 | 2 | 0 | 1 | 0 | 168 | 172 |
| 20–25 | 137 | 0 | 2 | 2 | 0 | 0 | 0 | 141 | 142 |
| 25–30 | 154 | 0 | 0 | 2 | 2 | 1 | 0 | 159 | 166 |
| 30–35 | 111 | 0 | 1 | 1 | 0 | 1 | 0 | 114 | 116.5 |
| 35–40 | 132 | 1 | 1 | 3 | 0 | 0 | 0 | 137 | 138.8 |
| 40–45 | 114 | 0 | 0 | 1 | 0 | 0 | 0 | 115 | 116 |
| 45–50 | 127 | 0 | 1 | 1 | 1 | 1 | 0 | 131 | 135 |
| 50–55 | 136 | 0 | 0 | 1 | 0 | 0 | 0 | 137 | 138 |
| 55–60 | 142 | 0 | 0 | 3 | 1 | 1 | 0 | 147 | 153.5 |
| Total | 1686 | 1726.3 |
Appendix A.3
Results of the study on the traffic load of the traffic light-controlled intersections in the study area.
Table A18.
Traffic flow intensity at intersection 9.
Table A18.
Traffic flow intensity at intersection 9.
| Types of Vehicles/Traffic Flow Number | Passenger Car, Including Ambulance, Light Commercial Vehicle with Payload up to 800 kg, Minibus up to 12 Seats and Similar | Moped, Cyclist | Motorcycle | Truck with Payload up to 5 t, Minibus over 12 Seats | Truck with a Payload of over 5 t | Bus or Trolleybus | Tractor Unit with Trailer, Articulated Bus or Trolleybus | Intensity, Veh/h | Intensity, PCU/h |
|---|---|---|---|---|---|---|---|---|---|
| 08-09-10 | 516 | 0 | 0 | 0 | 0 | 0 | 12 | 528 | 558 |
| 08-09-19 | 48 | 0 | 0 | 0 | 0 | 0 | 0 | 48 | 48 |
| 08-09-01 | 336 | 0 | 0 | 0 | 0 | 0 | 0 | 336 | 336 |
| 10-09-08 | 660 | 0 | 0 | 24 | 0 | 0 | 12 | 696 | 750 |
| 10-09-01 | 936 | 0 | 0 | 48 | 0 | 0 | 12 | 996 | 1074 |
| 10-09-19 | 108 | 0 | 0 | 0 | 0 | 0 | 0 | 108 | 108 |
| 01-09-19 | 12 | 0 | 0 | 0 | 0 | 0 | 0 | 12 | 12 |
| 01-09-08 | 660 | 0 | 0 | 0 | 0 | 0 | 0 | 660 | 660 |
| 01-09-10 | 768 | 0 | 0 | 0 | 0 | 0 | 0 | 768 | 768 |
| 19-09-01 | 0 | 0 | 0 | 0 | 0 | 0 | 0 | 0 | 0 |
| 19-09-10 | 336 | 0 | 0 | 0 | 0 | 0 | 0 | 336 | 336 |
| 19-09-08 | 0 | 0 | 0 | 0 | 0 | 0 | 0 | 0 | 0 |
| Total | 4488 | 4650 |
Table A19.
Traffic flow intensity at intersection 10.
Table A19.
Traffic flow intensity at intersection 10.
| Types of Vehicles/Traffic Flow Number | Passenger Car, Including Ambulance, Light Commercial Vehicle with Payload up to 800 kg, Minibus up to 12 Seats and Similar | Moped, Cyclist | Motorcycle | Truck with Payload up to 5 t, Minibus over 12 Seats | Truck with a Payload of over 5 t | Bus or Trolleybus | Tractor Unit with Trailer, Articulated Bus or Trolleybus | Intensity, Veh/h | Intensity, PCU/h |
|---|---|---|---|---|---|---|---|---|---|
| 09-10-11 | 900 | 0 | 48 | 12 | 0 | 0 | 0 | 960 | 948 |
| 11-10-09 | 696 | 0 | 0 | 24 | 0 | 0 | 0 | 720 | 744 |
| 11-10-02 | 132 | 0 | 0 | 0 | 0 | 0 | 0 | 132 | 132 |
| 09-10-02 | 384 | 12 | 0 | 0 | 0 | 0 | 36 | 432 | 513.6 |
| 02-10-11 | 108 | 0 | 0 | 12 | 0 | 0 | 0 | 120 | 132 |
| 02-10-09 | 540 | 0 | 12 | 0 | 0 | 0 | 12 | 564 | 588 |
| Total | 2928 | 3057.6 |
Table A20.
Traffic flow intensity at intersection 11.
Table A20.
Traffic flow intensity at intersection 11.
| Types of Vehicles/Traffic Flow Number | Passenger Car, Including Ambulance, Light Commercial Vehicle with Payload up to 800 kg, Minibus up to 12 Seats and Similar | Moped, Cyclist | Motorcycle | Truck with Payload up to 5 t, Minibus over 12 Seats | Truck with a Payload of over 5 t | Bus or Trolleybus | Tractor Unit with Trailer, Articulated Bus or Trolleybus | Intensity, Veh/h | Intensity, PCU/h |
|---|---|---|---|---|---|---|---|---|---|
| 10-11-12 | 636 | 0 | 12 | 12 | 0 | 0 | 0 | 660 | 666 |
| 10-11-20 | 48 | 0 | 0 | 0 | 0 | 0 | 0 | 48 | 48 |
| 10-11-03 | 168 | 0 | 0 | 0 | 0 | 0 | 0 | 168 | 168 |
| 12-11-10 | 840 | 0 | 0 | 36 | 12 | 0 | 0 | 888 | 942 |
| 12-11-03 | 288 | 12 | 0 | 0 | 0 | 12 | 0 | 312 | 327.6 |
| 12-11-20 | 180 | 0 | 0 | 0 | 0 | 0 | 0 | 180 | 180 |
| 20-11-03 | 312 | 0 | 12 | 12 | 0 | 0 | 0 | 336 | 342 |
| 20-11-12 | 84 | 0 | 0 | 0 | 0 | 0 | 0 | 84 | 84 |
| 20-11-10 | 60 | 0 | 0 | 0 | 0 | 0 | 0 | 60 | 60 |
| 03-11-20 | 384 | 0 | 0 | 24 | 0 | 0 | 0 | 408 | 432 |
| 03-11-10 | 60 | 0 | 0 | 0 | 0 | 0 | 0 | 60 | 60 |
| 03-11-12 | 336 | 0 | 0 | 24 | 12 | 0 | 12 | 384 | 456 |
| Total | 3588 | 3765.6 |
Table A21.
Traffic flow intensity at intersection 12.
Table A21.
Traffic flow intensity at intersection 12.
| Types of Vehicles/Traffic Flow Number | Passenger Car, Including Ambulance, Light Commercial Vehicle with Payload up to 800 kg, Minibus up to 12 Seats and Similar | Moped, Cyclist | Motorcycle | Truck with Payload up to 5 t, Minibus over 12 Seats | Truck with a Payload of over 5 t | Bus or Trolleybus | Tractor Unit with Trailer, Articulated Bus or Trolleybus | Intensity, Veh/h | Intensity, PCU/h |
|---|---|---|---|---|---|---|---|---|---|
| 11-12-13 | 1236 | 24 | 24 | 12 | 0 | 12 | 12 | 1320 | 1357.2 |
| 11-12-21 | 0 | 0 | 0 | 0 | 0 | 0 | 0 | 0 | 0 |
| 13-12-11 | 1056 | 0 | 48 | 0 | 0 | 12 | 12 | 1128 | 1158 |
| 13-12-21 | 168 | 0 | 12 | 0 | 0 | 0 | 0 | 180 | 174 |
| 21-12-13 | 180 | 0 | 0 | 12 | 0 | 0 | 0 | 192 | 204 |
| 21-12-11 | 12 | 0 | 0 | 0 | 0 | 0 | 0 | 12 | 12 |
| Total | 2832 | 2905.2 |
Table A22.
Traffic flow intensity at intersection 13.
Table A22.
Traffic flow intensity at intersection 13.
| Types of Vehicles/Traffic Flow Number | Passenger car, Including Ambulance, Light Commercial Vehicle with Payload up to 800 kg, Minibus up to 12 Seats and Similar | Moped, Cyclist | Motorcycle | Truck with Payload up to 5 t, Minibus over 12 Seats | Truck with a Payload of over 5 t | Bus or Trolleybus | Tractor Unit with Trailer, Articulated Bus or Trolleybus | Intensity, Veh/h | Intensity, PCU/h |
|---|---|---|---|---|---|---|---|---|---|
| 12-13-14 | 996 | 12 | 0 | 12 | 0 | 0 | 0 | 1020 | 1023.6 |
| 12-13-04 | 228 | 0 | 0 | 0 | 0 | 0 | 0 | 228 | 228 |
| 14-13-12 | 996 | 0 | 48 | 24 | 0 | 0 | 12 | 1080 | 1110 |
| 14-13-04 | 12 | 0 | 0 | 0 | 0 | 0 | 0 | 12 | 12 |
| 04-13-12 | 108 | 0 | 0 | 0 | 0 | 0 | 0 | 108 | 108 |
| 04-13-14 | 96 | 0 | 12 | 0 | 0 | 0 | 0 | 108 | 102 |
| Total | 2556 | 2583.6 |
Table A23.
Traffic flow intensity at intersection 14.
Table A23.
Traffic flow intensity at intersection 14.
| Types of Vehicles/Traffic Flow Number | Passenger Car, Including Ambulance, Light Commercial Vehicle with Payload up to 800 kg, Minibus up to 12 Seats and Similar | Moped, Cyclist | Motorcycle | Truck with Payload up to 5 t, Minibus over 12 Seats | Truck with a Payload of over 5 t | Bus or Trolleybus | Tractor Unit with Trailer, Articulated Bus or Trolleybus | Intensity, Veh/h | Intensity, PCU/h |
|---|---|---|---|---|---|---|---|---|---|
| 13-14-15 | 1080 | 0 | 0 | 12 | 12 | 12 | 12 | 1128 | 1212 |
| 13-14-22 | 264 | 0 | 0 | 0 | 0 | 0 | 0 | 264 | 264 |
| 15-14-13 | 816 | 0 | 24 | 12 | 0 | 0 | 0 | 852 | 852 |
| 15-14-22 | 216 | 0 | 0 | 0 | 0 | 12 | 12 | 240 | 294 |
| 22-14-15 | 156 | 0 | 0 | 0 | 0 | 0 | 0 | 156 | 156 |
| 22-14-13 | 180 | 0 | 0 | 0 | 0 | 0 | 0 | 180 | 180 |
| Total | 2820 | 2958 |
Table A24.
Traffic flow intensity at intersection 15.
Table A24.
Traffic flow intensity at intersection 15.
| Types of Vehicles/Traffic Flow Number | Passenger Car, Including Ambulance, Light Commercial Vehicle with Payload up to 800 kg, Minibus up to 12 Seats and Similar | Moped, Cyclist | Motorcycle | Truck with Payload up to 5 t, Minibus over 12 Seats | Truck with a Payload of over 5 t | Bus or Trolleybus | Tractor Unit with Trailer, Articulated Bus or Trolleybus | Intensity, Veh/h | Intensity, PCU/h |
|---|---|---|---|---|---|---|---|---|---|
| 14-15-16 | 792 | 0 | 12 | 24 | 0 | 12 | 0 | 840 | 882 |
| 14-15-23 | 240 | 0 | 0 | 0 | 0 | 0 | 0 | 240 | 240 |
| 14-15-05 | 60 | 0 | 0 | 0 | 0 | 0 | 0 | 60 | 60 |
| 16-15-14 | 924 | 0 | 0 | 0 | 0 | 0 | 0 | 924 | 924 |
| 16-15-05 | 528 | 0 | 12 | 24 | 0 | 0 | 0 | 564 | 582 |
| 16-15-23 | 60 | 0 | 0 | 0 | 0 | 0 | 0 | 60 | 60 |
| 23-15-05 | 24 | 12 | 0 | 0 | 0 | 0 | 0 | 36 | 27.6 |
| 23-15-16 | 36 | 0 | 0 | 0 | 0 | 0 | 0 | 36 | 36 |
| 23-15-14 | 36 | 0 | 0 | 0 | 0 | 0 | 0 | 36 | 36 |
| 05-15-23 | 24 | 0 | 0 | 0 | 0 | 0 | 0 | 24 | 24 |
| 05-15-14 | 168 | 0 | 0 | 0 | 0 | 0 | 0 | 168 | 168 |
| 05-15-16 | 384 | 0 | 0 | 12 | 0 | 0 | 0 | 396 | 408 |
| Total | 3384 | 3447.6 |
Table A25.
Traffic flow intensity at intersection 16.
Table A25.
Traffic flow intensity at intersection 16.
| Types of Vehicles/Traffic Flow Number | Passenger Car, Including Ambulance, Light Commercial Vehicle with Payload up to 800 kg, Minibus up to 12 Seats and Similar | Moped, Cyclist | Motorcycle | Truck with Payload up to 5 t, Minibus over 12 Seats | Truck with a Payload of over 5 t | Bus or Trolleybus | Tractor Unit with Trailer, Articulated Bus or Trolleybus | Intensity, Veh/h | Intensity, PCU/h |
|---|---|---|---|---|---|---|---|---|---|
| 15-16-17 | 1116 | 12 | 0 | 12 | 0 | 12 | 0 | 1152 | 1179.6 |
| 15-16-06 | 72 | 0 | 0 | 0 | 0 | 0 | 0 | 72 | 72 |
| 15-16-24 | 0 | 0 | 0 | 0 | 0 | 0 | 0 | 0 | 0 |
| 17-16-15 | 1284 | 0 | 24 | 48 | 12 | 0 | 0 | 1368 | 1422 |
| 17-16-06 | 324 | 0 | 0 | 0 | 0 | 0 | 0 | 324 | 324 |
| 17-16-24 | 0 | 0 | 0 | 0 | 0 | 0 | 0 | 0 | 0 |
| 06-16-15 | 48 | 0 | 0 | 0 | 0 | 12 | 0 | 60 | 84 |
| 06-16-17 | 156 | 0 | 0 | 12 | 0 | 0 | 0 | 168 | 180 |
| 06-16-24 | 0 | 0 | 0 | 0 | 0 | 0 | 0 | 0 | 0 |
| 24-16-06 | 0 | 0 | 0 | 0 | 0 | 0 | 0 | 0 | 0 |
| 24-16-17 | 0 | 0 | 0 | 0 | 0 | 0 | 0 | 0 | 0 |
| 24-16-15 | 0 | 0 | 0 | 0 | 0 | 0 | 0 | 0 | 0 |
| Total | 3144 | 3261.6 |
Table A26.
Traffic flow intensity at intersection 17.
Table A26.
Traffic flow intensity at intersection 17.
| Types of Vehicles/Traffic Flow Number | Passenger Car, Including Ambulance, Light Commercial Vehicle with Payload up to 800 kg, Minibus up to 12 Seats and Similar | Moped, Cyclist | Motorcycle | Truck with Payload up to 5 t, Minibus over 12 Seats | Truck with a Payload of over 5 t | Bus or Trolleybus | Tractor Unit with Trailer, Articulated Bus or Trolleybus | Intensity, Veh/h | Intensity, PCU |
|---|---|---|---|---|---|---|---|---|---|
| 16-17-18 | 456 | 0 | 0 | 0 | 0 | 12 | 0 | 468 | 492 |
| 16-17-25 | 720 | 0 | 24 | 0 | 0 | 0 | 0 | 744 | 732 |
| 16-17-07 | 312 | 0 | 0 | 0 | 0 | 0 | 0 | 312 | 312 |
| 18-17-16 | 168 | 0 | 0 | 0 | 0 | 0 | 0 | 168 | 168 |
| 18-17-07 | 144 | 0 | 0 | 12 | 0 | 0 | 0 | 156 | 168 |
| 18-17-25 | 108 | 0 | 0 | 24 | 0 | 0 | 0 | 132 | 156 |
| 07-17-25 | 0 | 0 | 0 | 0 | 0 | 0 | 0 | 0 | 0 |
| 07-17-16 | 780 | 0 | 0 | 12 | 0 | 0 | 0 | 792 | 804 |
| 07-17-18 | 276 | 0 | 0 | 0 | 0 | 0 | 0 | 276 | 276 |
| 25-17-07 | 0 | 0 | 0 | 0 | 0 | 0 | 0 | 0 | 0 |
| 25-17-18 | 96 | 0 | 0 | 0 | 0 | 0 | 0 | 96 | 96 |
| 25-17-16 | 552 | 0 | 0 | 36 | 0 | 0 | 0 | 588 | 624 |
| Total | 3732 | 3828 |
References
- Žiliūte, L.; Laurinavičius, A.; Vaitkus, A. Investigation into traffic flows on high intensity streets of Vilnius city. Transport 2010, 25, 244–251. [Google Scholar] [CrossRef]
- Sayed, M.; Rahman, M.; Zaber, M.; Ali, A. Understanding Dhaka city traffic intensity and traffic expansion using gravity model. In Proceedings of the 2017 20th International Conference of Computer and Information Technology (ICCIT), Dhaka, Bangladesh, 22–24 December 2017; pp. 1–6. [Google Scholar] [CrossRef]
- Cools, M.; Moons, E.; Wets, G. Assessing the Impact of Weather on Traffic Intensity. Weather Clim. Soc. 2010, 2, 60–68. [Google Scholar] [CrossRef]
- Afanasyev, A.; Panfilov, D. Estimation of Intersections Traffic Capacity Taking into Account Changed Traffic Intensity. Transp. Res. Procedia 2017, 20, 2–7. [Google Scholar] [CrossRef]
- Choudhury, A.; Basak, A. Statistical inference on traffic intensity in an M/M/1 queueing system. Int. J. Manag. Sci. Eng. Manag. 2018, 13, 274–279. [Google Scholar] [CrossRef]
- Singh, S.; Acharya, S.; Cruz, F.; Quinino, R. Estimation of traffic intensity from queue length data in a deterministic single server queueing system. J. Comput. Appl. Math. 2021, 398, 113693. [Google Scholar] [CrossRef]
- Pencheva, V.; Asenov, A.; Grozev, D.; Angelova, R.; Georgiev, I. Analysis of the traffic intensity of cargo vehicles in the border points. Transp. Probl. 2018, 13, 23–36. [Google Scholar] [CrossRef]
- Myat, A.; Minerva, R.; Taparugssanagorn, A.; Rajapaksha, P.; Crespi, N. Traffic Intensity Detection Using General-Purpose Sensing. IEEE Sens. Lett. 2023, 7, 6007504. [Google Scholar] [CrossRef]
- Czyżewski, A.; Kotus, J.; Szwoch, G. Estimating Traffic Intensity Employing Passive Acoustic Radar and Enhanced Microwave Doppler Radar Sensor. Remote Sens. 2020, 12, 110. [Google Scholar] [CrossRef]
- Parekh, S.; Dhami, N.; Patel, S.; Undavia, J. Traffic Signal Automation Through IoT by Sensing and Detecting Traffic Intensity Through IR Sensors. In Information and Communication Technology for Intelligent Systems; Satapathy, S., Joshi, A., Eds.; Smart Innovation, Systems and Technologies; Springer: Singapore, 2019; Volume 106. [Google Scholar] [CrossRef]
- Dimitrov, K.; Shterev, V.; Valkovski, T. Low-cost system for recognizing people through infrared arrays in smart home systems. In Proceedings of the 29th International Scientific Conference Electronics, ET 2020-Proceedings, Sozopol, Bulgaria, 16–18 September 2020. [Google Scholar] [CrossRef]
- Grozev, D.; Beloev, I. Methodology for Using Unmanned Aircraft Devices for Photographing and Subsequent Analysis of Road Junctions. AIP Conf. Proc. 2024, 3129, 070003. [Google Scholar] [CrossRef]
- Damyanov, I. Implementation of advanced software solutions and systems for transport traffic research and control. IOP Conf. Ser. Mater. Sci. Eng. 2020, 878, 012044. [Google Scholar] [CrossRef]
- Maduro, C.; Batista, K.; Peixoto, P.; Batista, J. Estimation of vehicle velocity and traffic intensity using rectified images. In Proceedings of the 15th IEEE International Conference on Image Processing, San Diego, CA, USA, 12–15 October 2008; pp. 777–780. [Google Scholar] [CrossRef]
- Pepedzhiev, D.; Hristov, V. Software for image analysis and inspection of optical lens. In Proceedings of the 27th International Conference on Information Technology, IT 2023, Zabljak, Montenegro, 15–18 February 2023. [Google Scholar] [CrossRef]
- Kostov, B.; Hristov, V. Improved algorithm for increasing efficiency in capturing and orienting an object with a 6-axle robot and a 2D camera for visual inspection. AIP Conf. Proc. 2022, 2449, 020005. [Google Scholar] [CrossRef]
- Evstatiev, B.; Balbuzanov, T.; Beloev, I.; Pencheva, V. Intelligent system for improved safety of pedestrian traffic lights. Transp. Probl. 2019, 14, 35–43. [Google Scholar] [CrossRef]
- Uzunov, H.; Dechkova, S.; Uzunov, V. Critical speed in pedestrians’ relative motion regarding limited visibility zone from driver seat. Proc. Eng. Sci. 2023, 5, 781–792. [Google Scholar] [CrossRef]
- Savova-Mratsenkova, M.; Palagachev, G. Graph-analytic approach to determine the position of the initial impact in the event of pedestrian accidents. IOP Conf. Ser. Mater. Sci. Eng. 2020, 878, 012042. [Google Scholar] [CrossRef]
- Miletiev, R.; Yordanov, R.; Damyanov, I. AQI monitoring system for intelligent transport systems. In Proceedings of the International Spring Seminar on Electronics Technology, Timisoara, Romania, 10–14 May 2023. [Google Scholar] [CrossRef]
- Kachroo, P.; Sastry, S. Travel Time Dynamics for Intelligent Transportation Systems: Theory and Applications. IEEE Trans. Intell. Transp. Syst. 2016, 17, 385–394. [Google Scholar] [CrossRef]
- Cheng, Z.; Pang, M.-S.; Pavlou, P. Mitigating Traffic Congestion: The Role of Intelligent Transportation Systems. 2020. Available online: https://pubsonline.informs.org/doi/abs/10.1287/isre.2019.0894 (accessed on 7 April 2025).
- Roosbroeck, S.; Hoek, G.; Meliefste, K.; Janssen, N.; Brunekreef, B. Validity of residential traffic intensity as an estimate of long-term personal exposure to traffic-related air pollution among adults. Environ. Sci. Technol. 2008, 42, 1337–1344. [Google Scholar] [CrossRef] [PubMed]
- DImitrov, K.; Damyanov, I. Thermographic analysis of tires during chassis dynamometer test. In Proceedings of the 27th National Conference with International Participation: The Ways to Connect the Future, TELECOM 2019–Proceedings, Sofia, Bulgaria, 30–31 October 2019; pp. 27–30. [Google Scholar] [CrossRef]
- Dimitrov, K.; Damyanov, I. Thermographic analysis of gasoline engine exhaust manifold for smart city garage. In Proceedings of the International Conference on Creative Business for Smart and Sustainable Growth, CreBUS 2019, Sandanski, Bulgaria, 18–21 March 2019. [Google Scholar] [CrossRef]
- European Court of Auditors. Special Report 02/2025: “Urban Pollution in the EU—Cities Have Cleaner Air but Are Still too Noisy; Publications Office of the European Union: Luxembourg, 2025. [Google Scholar]
- Todorov, G.; Kralov, I.; Koprev, I.; Vasilev, H.; Naydenova, I. Coal Share Reduction Options for Power Generation during the Energy Transition: A Bulgarian Perspective. Energies 2024, 17, 929. [Google Scholar] [CrossRef]
- van Ruth, F. Traffic Intensity as Indicator of Regional Economic Activity; CBS|Discussion Paper 2014|21, 60083201421 X-10; Statistics Netherlands: The Hague, The Netherlands; Heerlen, The Netherlands, 2014. [Google Scholar]
- Google Maps. Available online: https://www.google.com/maps/@42.71628,23.2548978,11.5z?hl=en&entry=ttu&g_ep=EgoyMDI1MDUwNy4wIKXMDSoASAFQAw%3D%3D (accessed on 10 May 2025).
- Lex.bg—Laws, Regulations, Constitution, Codes, State Newspaper, Enforcement Regulations. Available online: https://lex.bg/en/laws/ldoc/2137180231 (accessed on 4 July 2025).

Disclaimer/Publisher’s Note: The statements, opinions and data contained in all publications are solely those of the individual author(s) and contributor(s) and not of MDPI and/or the editor(s). MDPI and/or the editor(s) disclaim responsibility for any injury to people or property resulting from any ideas, methods, instructions or products referred to in the content. |
© 2025 by the authors. Licensee MDPI, Basel, Switzerland. This article is an open access article distributed under the terms and conditions of the Creative Commons Attribution (CC BY) license (https://creativecommons.org/licenses/by/4.0/).