Abstract
A piezoresistive electrical bagging material with minimal cost and profile, such as linqstat or velostat, is a good choice for pressure-sensing systems in robotic arm grippers. This paper’s main objective is to examine the performance of a unique velostat-based pressure sensor system for supplying real-time grasping pressure profiles during the lifting of calibrated weights. Copper conductive tape was used to build the sensor, and it was positioned on top of and beneath a velostat sheet to serve as an electrode. The accuracy, repeatability, and hysteresis responses of the pressure sensor system were examined through a variety of experiments, as well as through testing with calibrated weights ranging from 100 gm to 2000 gm in steps. The sensor’s hysteresis and nonlinear characteristics were discovered through the experimental results of loading cycle measurements. Velostat proved to be a realistic option as a sensitive material for sensors with a single electrode pair, depending on the sensor’s sensitivity, hysteresis, reaction time, loading conditions, and deformation. The area where the velostat sensor might be implemented was verified by experimental results.
Keywords:
pressure sensor; Arduino board; velostat; calibrated weights; hysteresis; grippers; wearable sensors 1. Introduction
In research using the haptic approach and robotics applications utilizing wearable technology, force distribution sensors and contact pressure sensors are frequently used. As a result, it is crucial to thoroughly research the design and characterization of these sensors in order to produce accurate results. Three distinct physical phenomena occurring in various materials—the piezoresistive effect, the piezoelectric effect, and variable capacitance—provide the three most popular approaches to designing electronic sensors for measuring force and pressure [1,2,3]. In numerous sorts of sensing applications, the three phenomena have been thoroughly researched. However, among these three categories of physical phenomenon, piezoresistive materials enable better metrical pressure distribution monitoring in biomedical applications given their affordability and deterministic behavior [4].
The electrical resistance of piezoresistive materials varies in response to deformation caused by an applied force [5,6] and has an inversely proportional relationship [7]. When no force is applied, the material’s electrical resistance is somewhere between megaohms and kiloohms or less [8]. In this, a paper piezoresistive sensor was tested in response to load, hysteresis, and temporal drift tests.
2. Materials and Methods
2.1. Sensor Fabrication
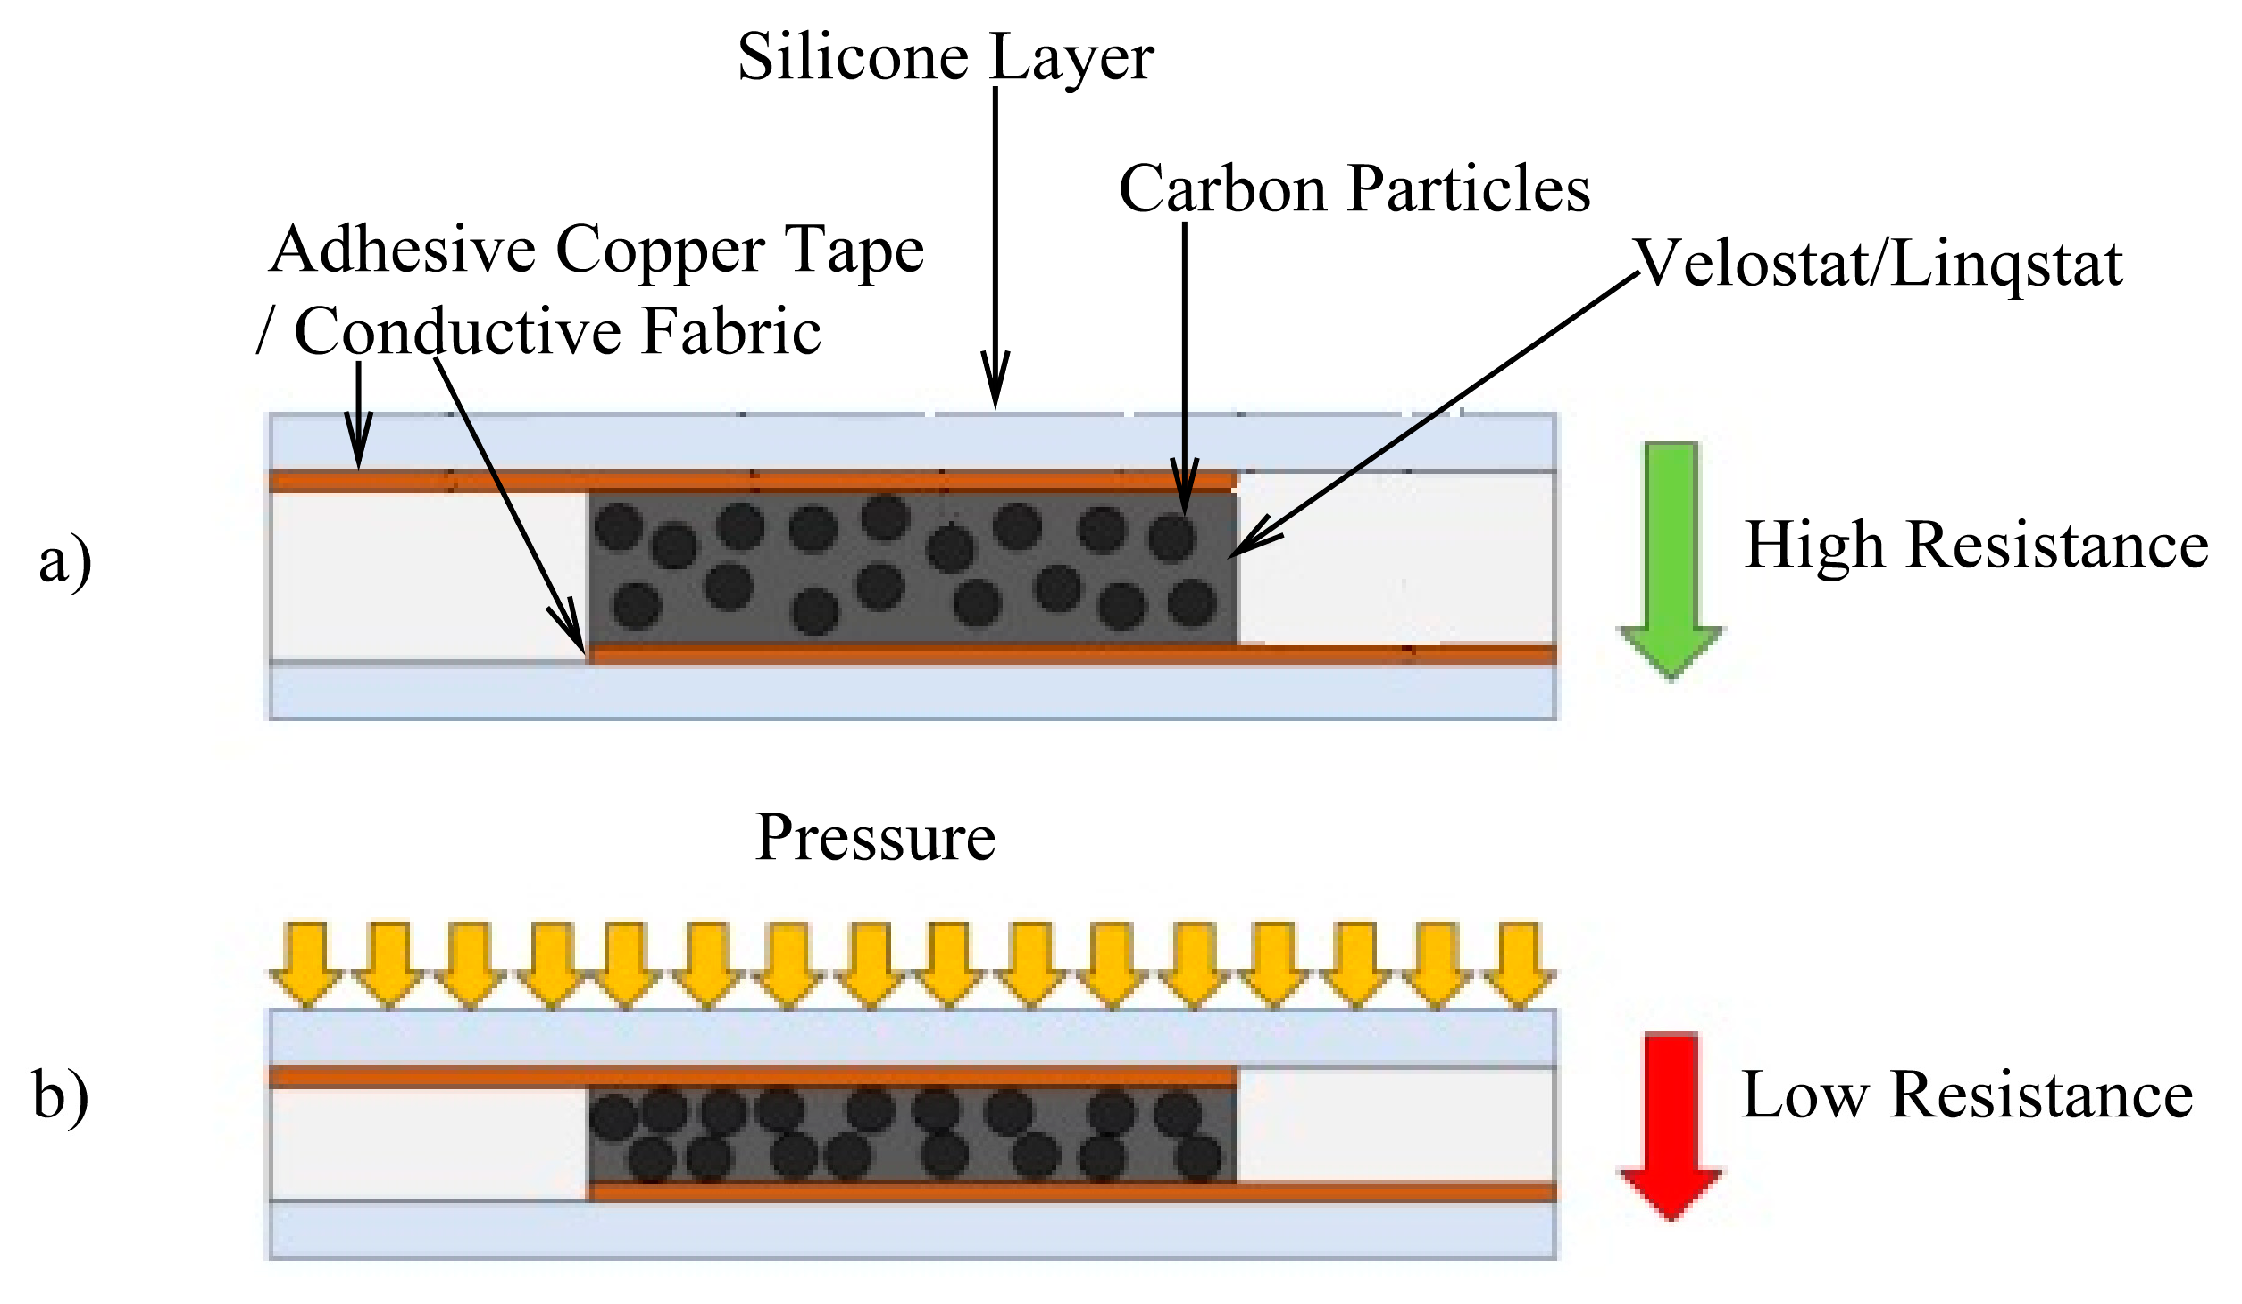
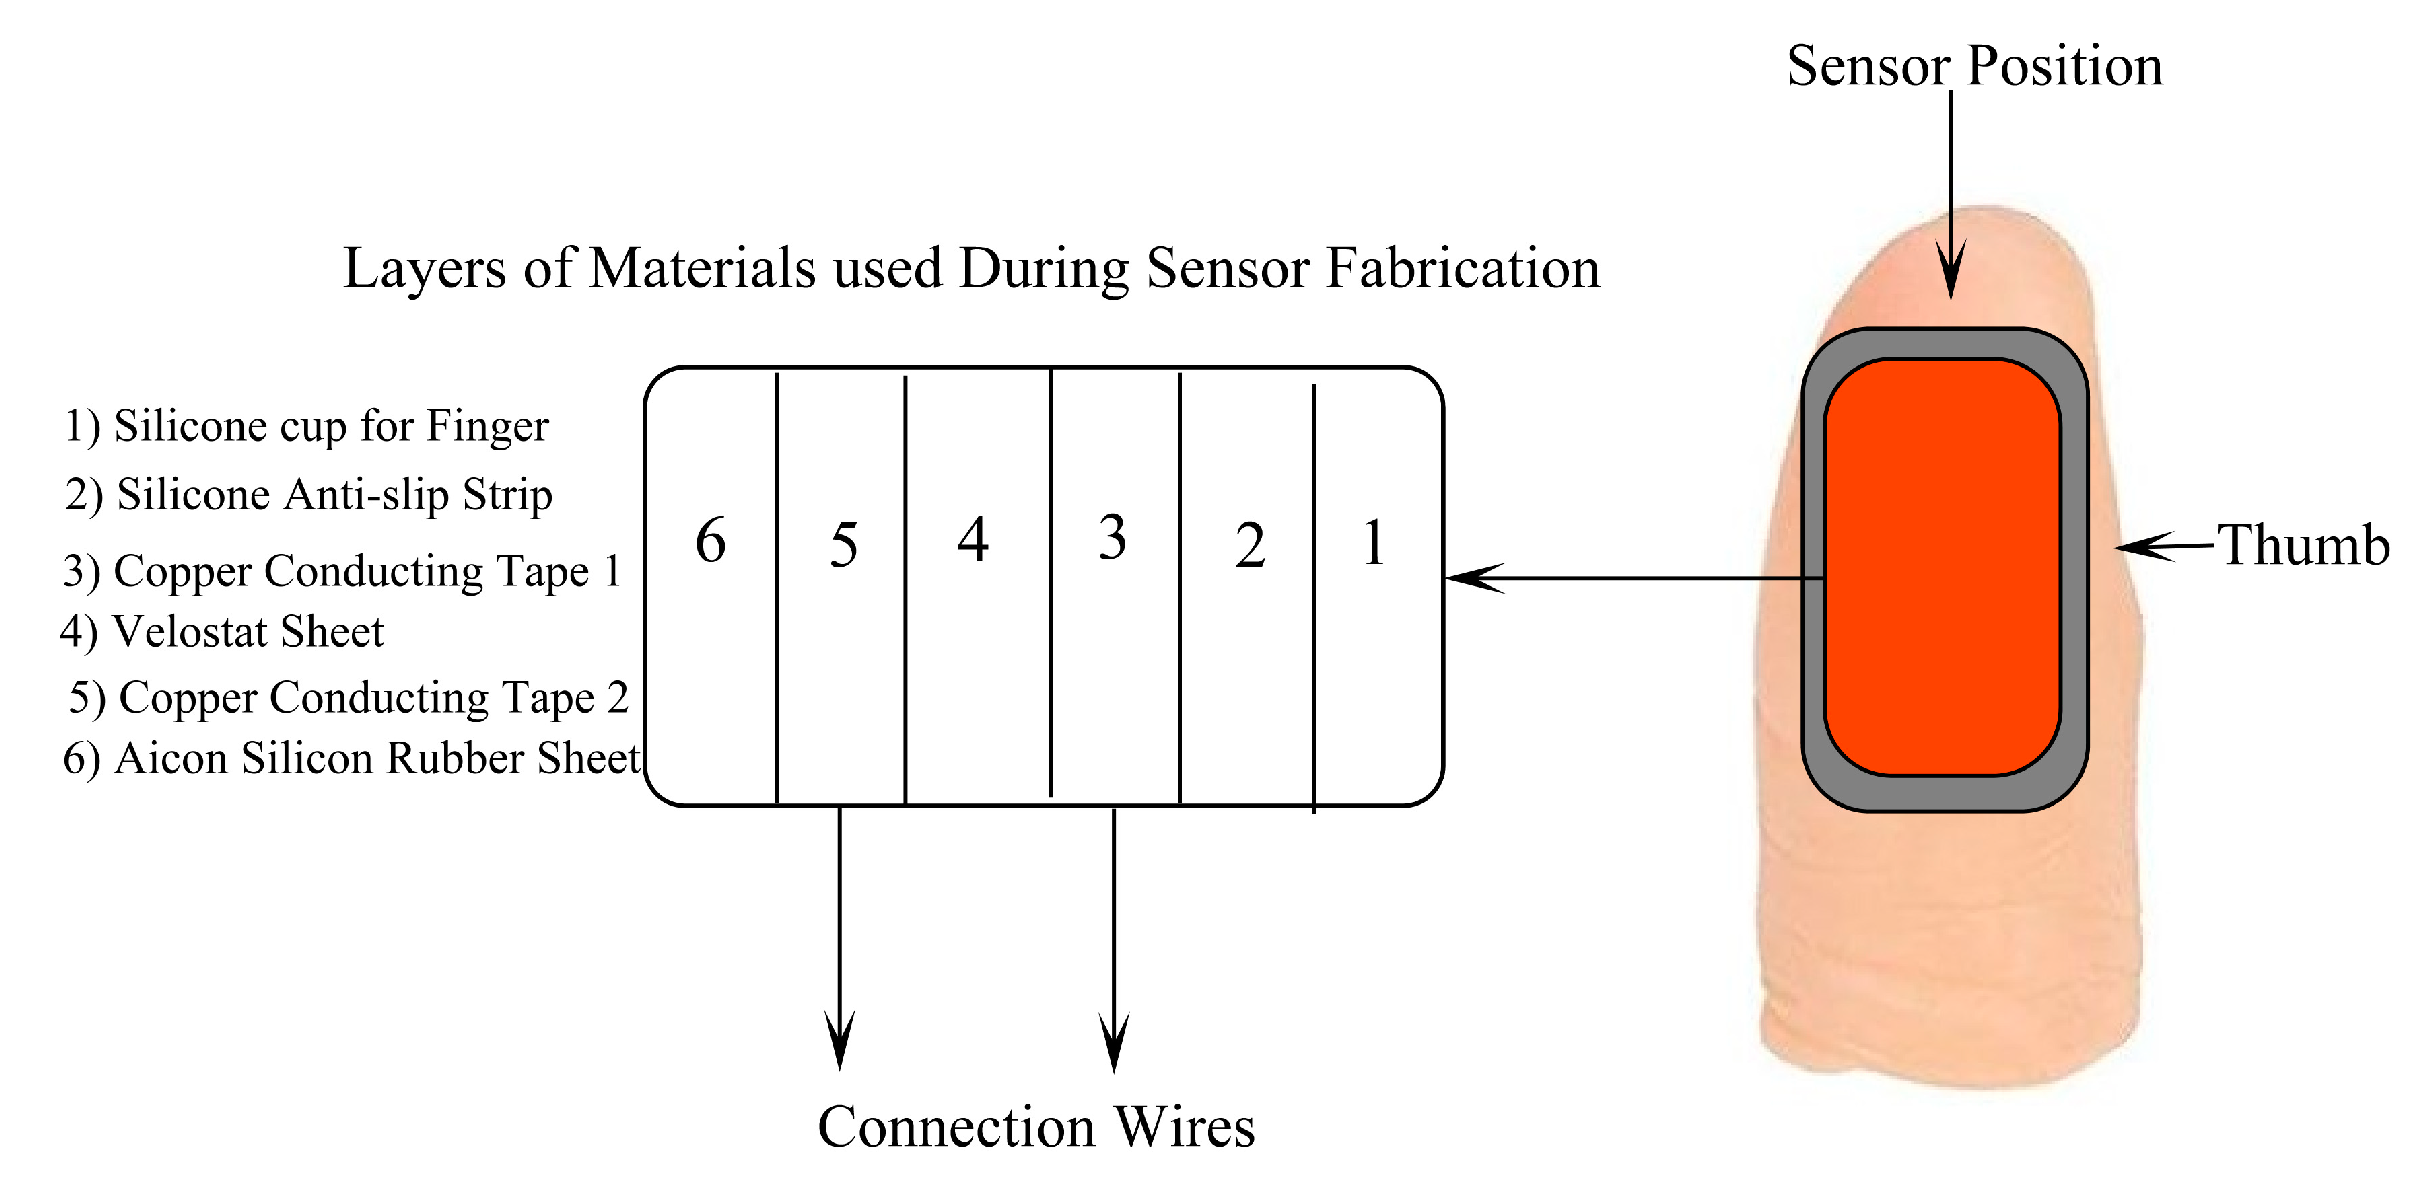
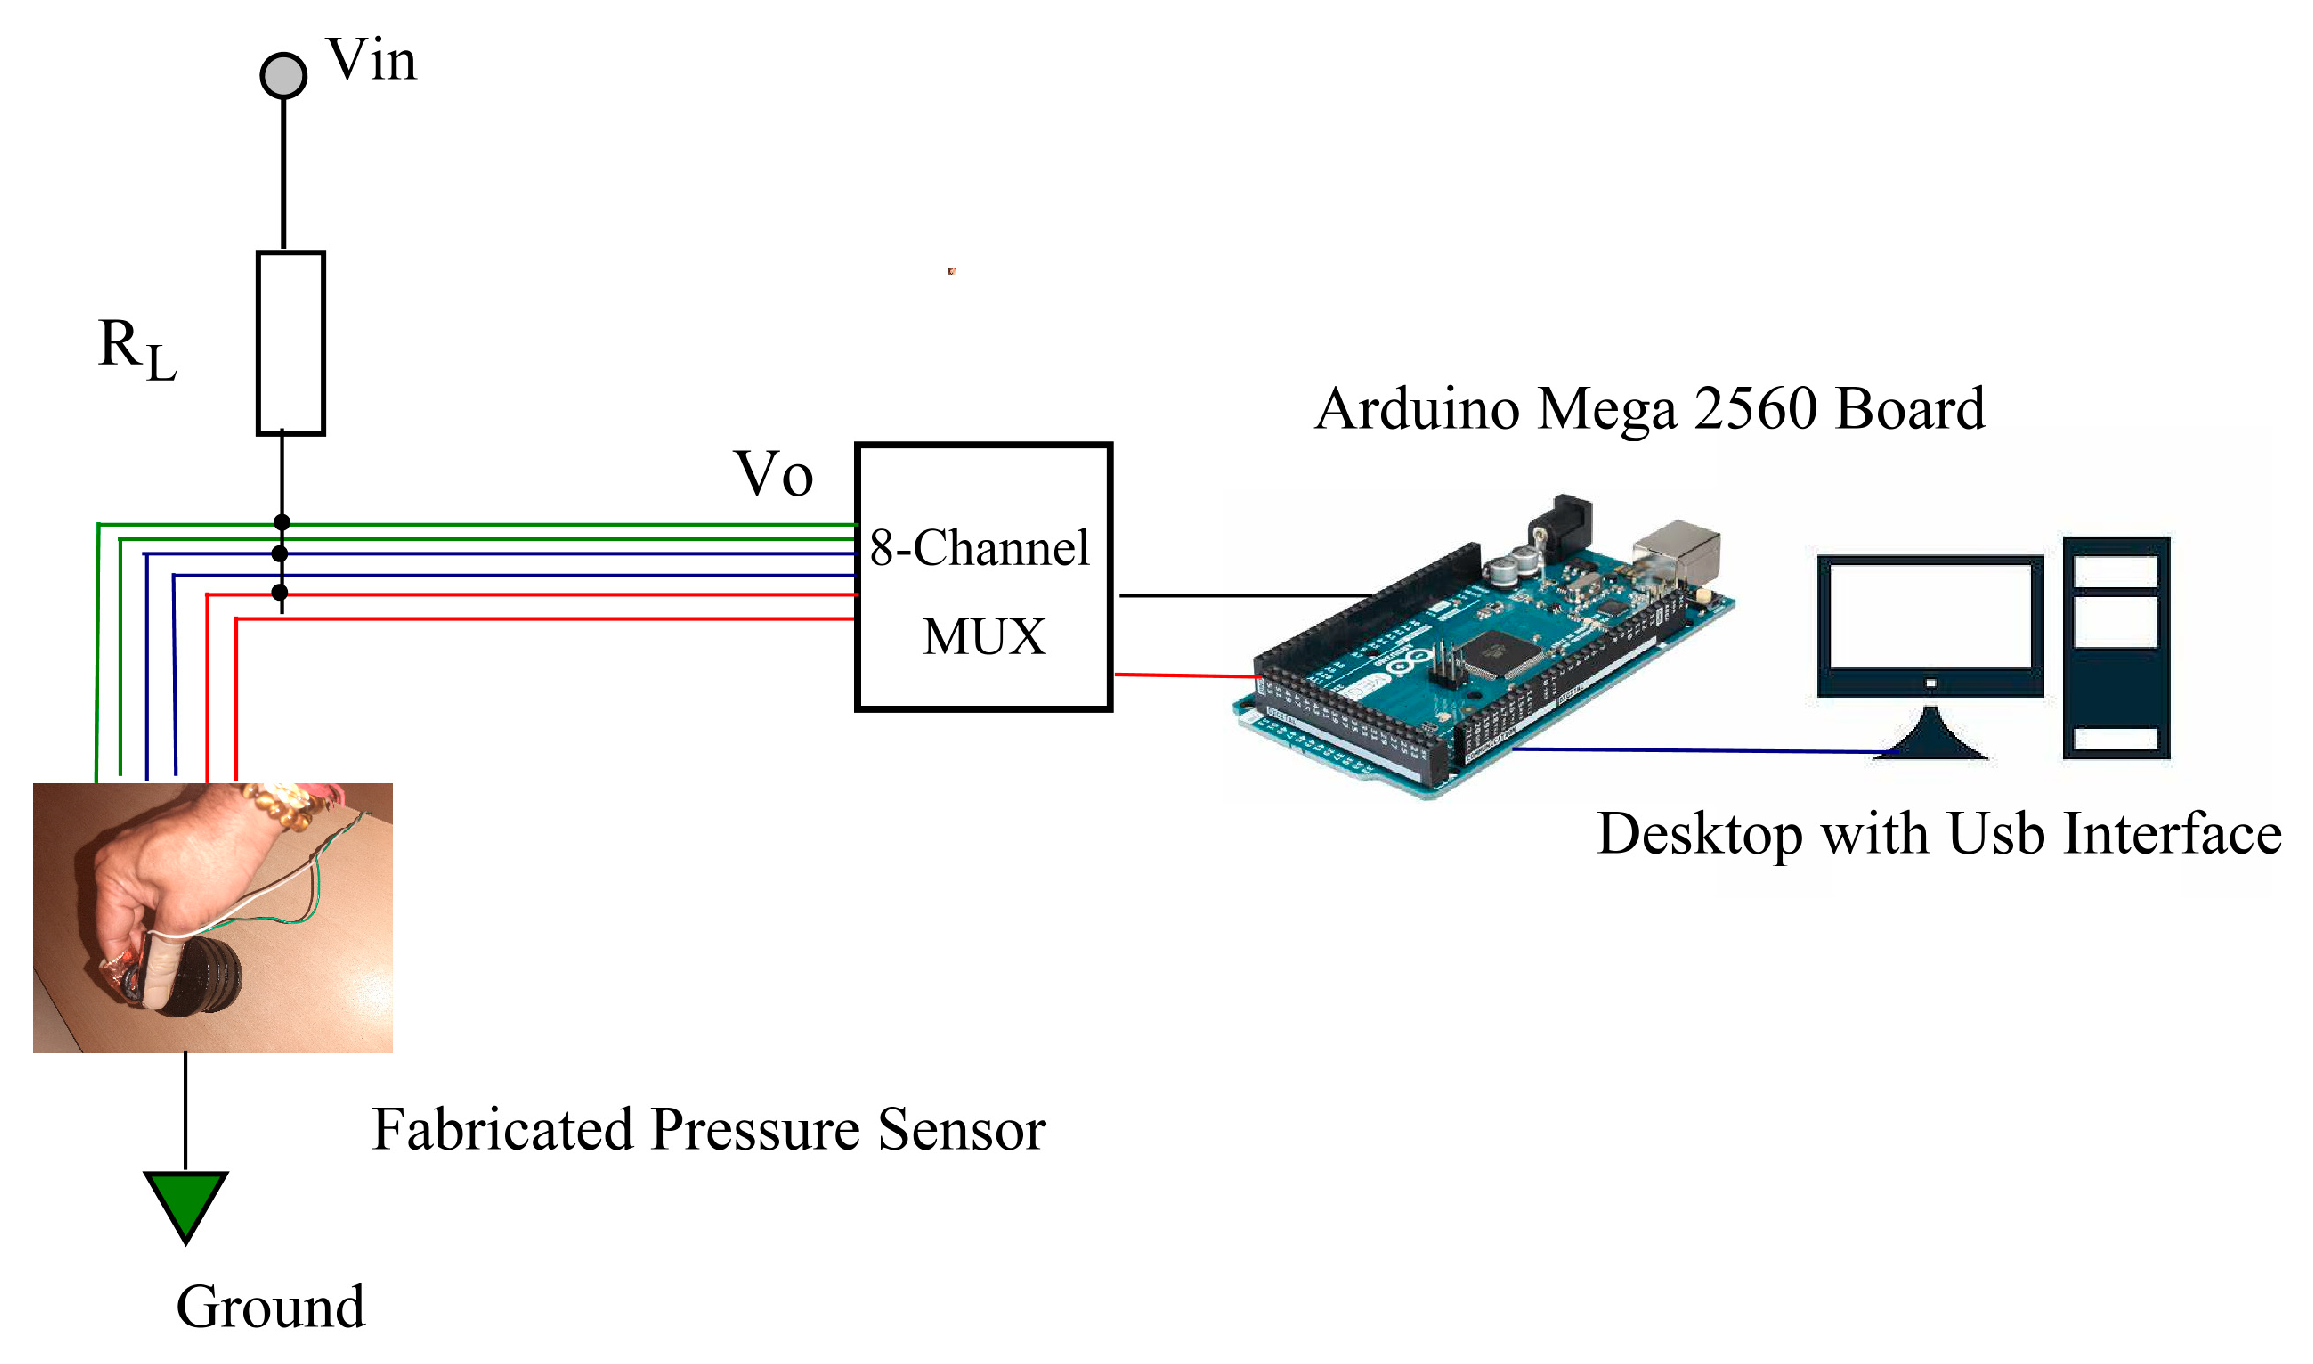
The materials needed for sensor fabrication are a velostat sheet, adhesive copper tape, silver conductive fabric, a silicone foam layer, etc. The velostat sheet is sandwiched in between two pieces of copper conductive tape, and then, silver conductive fabric is also placed, covering the copper conductive tape as shown in Figure 1 and Figure 2. Experimental setup for the entire system is shown in Figure 3. Over the conductive tape, a layer of silicone foam is placed so that applied pressure or force is uniformly distributed over the entire surface area of the sensor strip [9,10] The piezoresistive velostat core of the sensor has a length of 5 mm, and a thickness of 0.06 mm. The main goal of the sensor design is to reduce the size and cost of this customized sensor. Velostat is the core material of the sensor; it has a length of 105 mm, a breadth of 65 mm, and a thickness of 0.06 mm. Given the micro-Brownian motion of the carbon filler particles in the polymer, the material’s resistance decreases as force is applied to it [11,12]. Electron microscopy diagram of velostat paper is shown in Figure 4 showing the molecular structure of carbon material used.

Figure 1.
Sensor construction, (a) unloaded, (b) loaded [13].

Figure 2.
Layers of materials used in sensor fabrication [13].
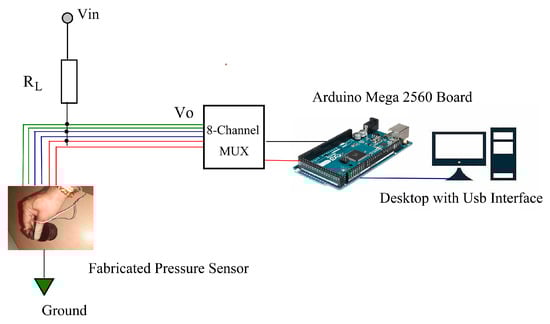
Figure 3.
Experimental setup [13].
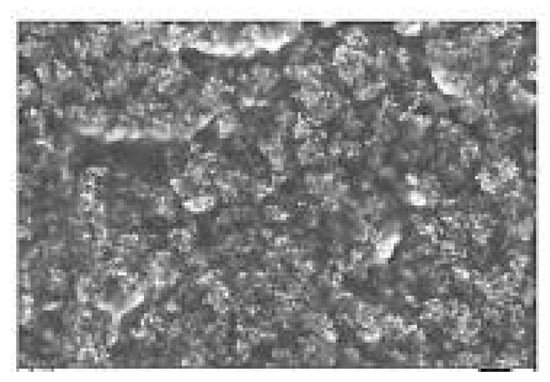
Figure 4.
Electron microscopic image of velostat [14].
2.2. Design Parameters of Conditioning Circuit
Equation (1) accurately shows the resistance–force relation for velostat [15].
R: resistance of piezoresistive material;
K: surface roughness factor/coefficient;
ρ: resistivity of the contacting surfaces;
F: force applied normal to the contact surfaces.
The effect of the change in force is inversely proportional to the resistance of the sensor; moreover, k has a direct impact on the force applied while holding an object. If the value of the surface is rougher, the resistance will be greater, and the force required to lift an object will be lesser. As shown in Figure 3, a voltage divider circuit was used to transform the resistance of the sensors into a voltage signal by connecting them in series with a fixed resistor, R (10 KΩ). Applying Ohm’s law, as illustrated in Equation (2), yields the voltage read at the sensor–resistor junction.
RL: voltage divider circuit’s resistance;
Vin: sensor’s input voltage;
Vo: voltage divider’s output voltage.
By taking into account Equations (1) and (2), the voltage force relationship is established. A linear response might be obtained by connecting the sensor resistor between a voltage source and the current input of a voltage converter (a virtual ground), obtaining a voltage output proportional to the piezoresistive sensor’s resistance [15].
2.3. Experimental Design Parameters [8,9,10]
The experiments focused on sensor response characteristics for distinct load levels, continuous cyclical loads, drift characteristics, and variation due to loading rate changes.
2.3.1. Hysteresis
The greatest output variation between loading and unloading a single load was referred to as hysteresis.
where VLoad and VUnload are the sensor voltages corresponding to the greatest difference between the loading and unloading responses, and VMax and VMin are the sensor voltages at maximum and minimum loads, respectively [16]. Loading test with calibrated weights is shown in Figure 5.
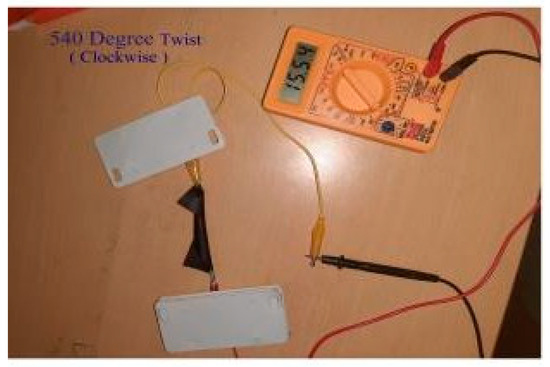
Figure 5.
Loading test with calibrated weights [17].
2.3.2. Drift
Drift is described as a shift in sensor output over time for a specific load, typically an increase in value. With weights kept for five minutes, the sensor was loaded from 200 gm to 2000 gm in steps, and the variations in resistance and pressure values were noted.
2.3.3. Repeatability
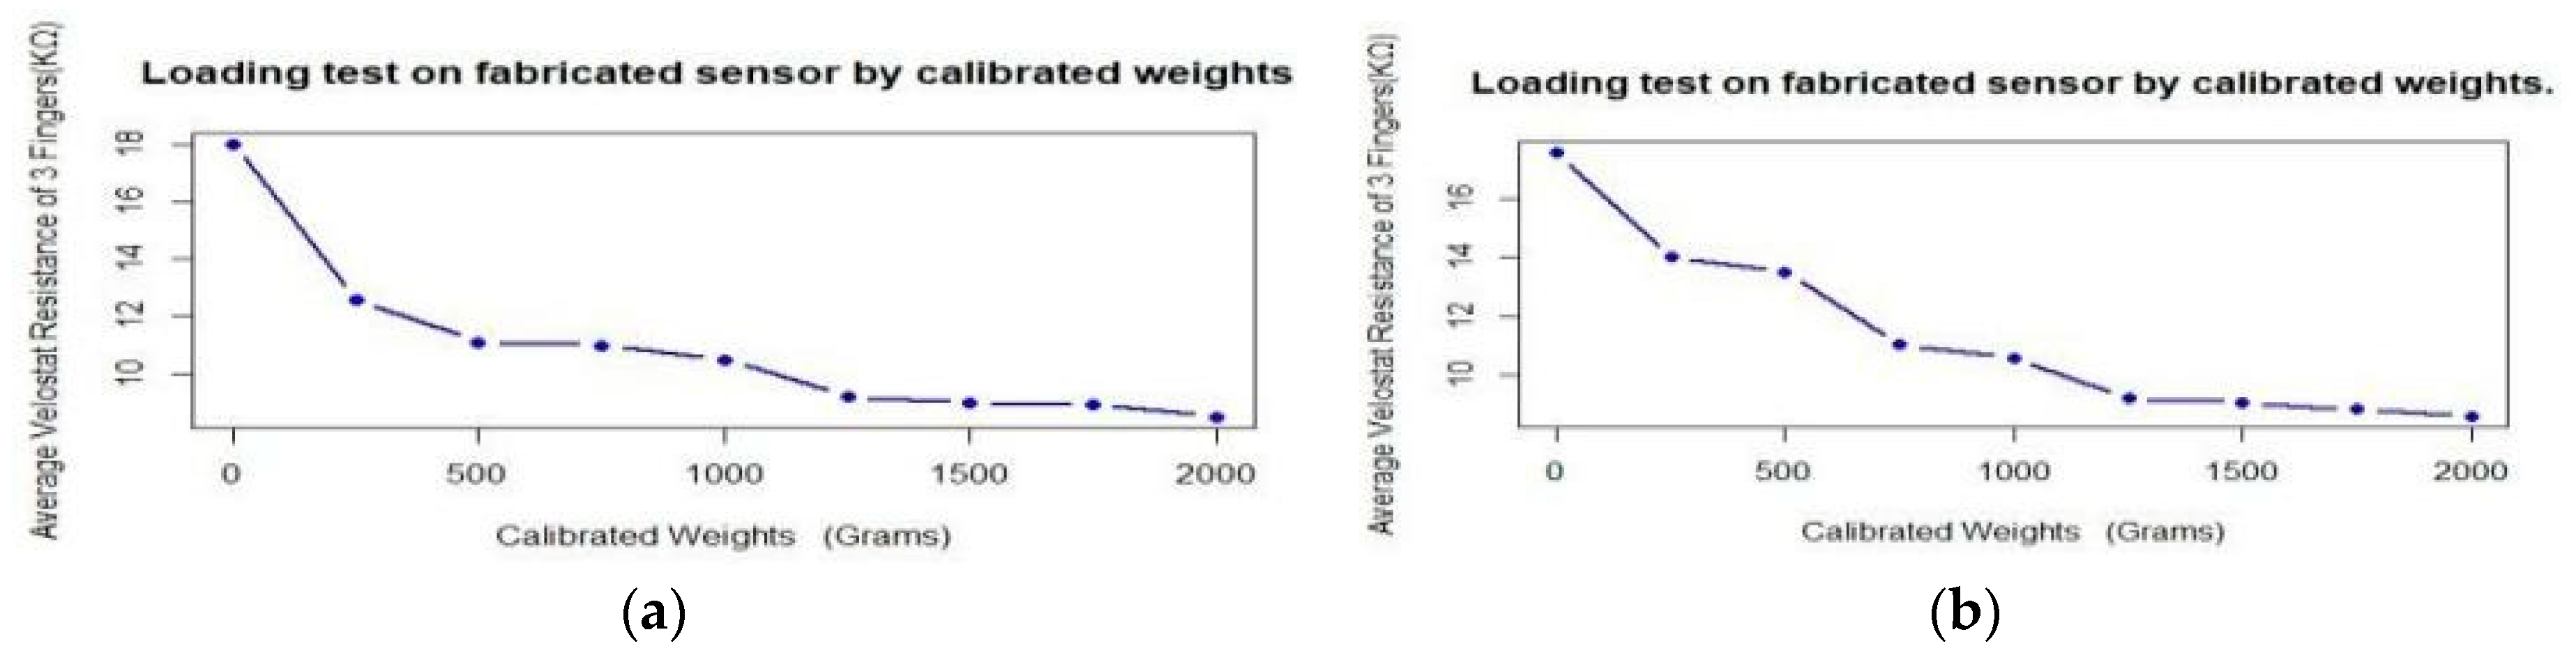
The variation in output produced when a sensor is loaded to the same pressure is known as repeatability. Each sensor was loaded with a calibrated weight ranging from 100 gm to 2000 gm.
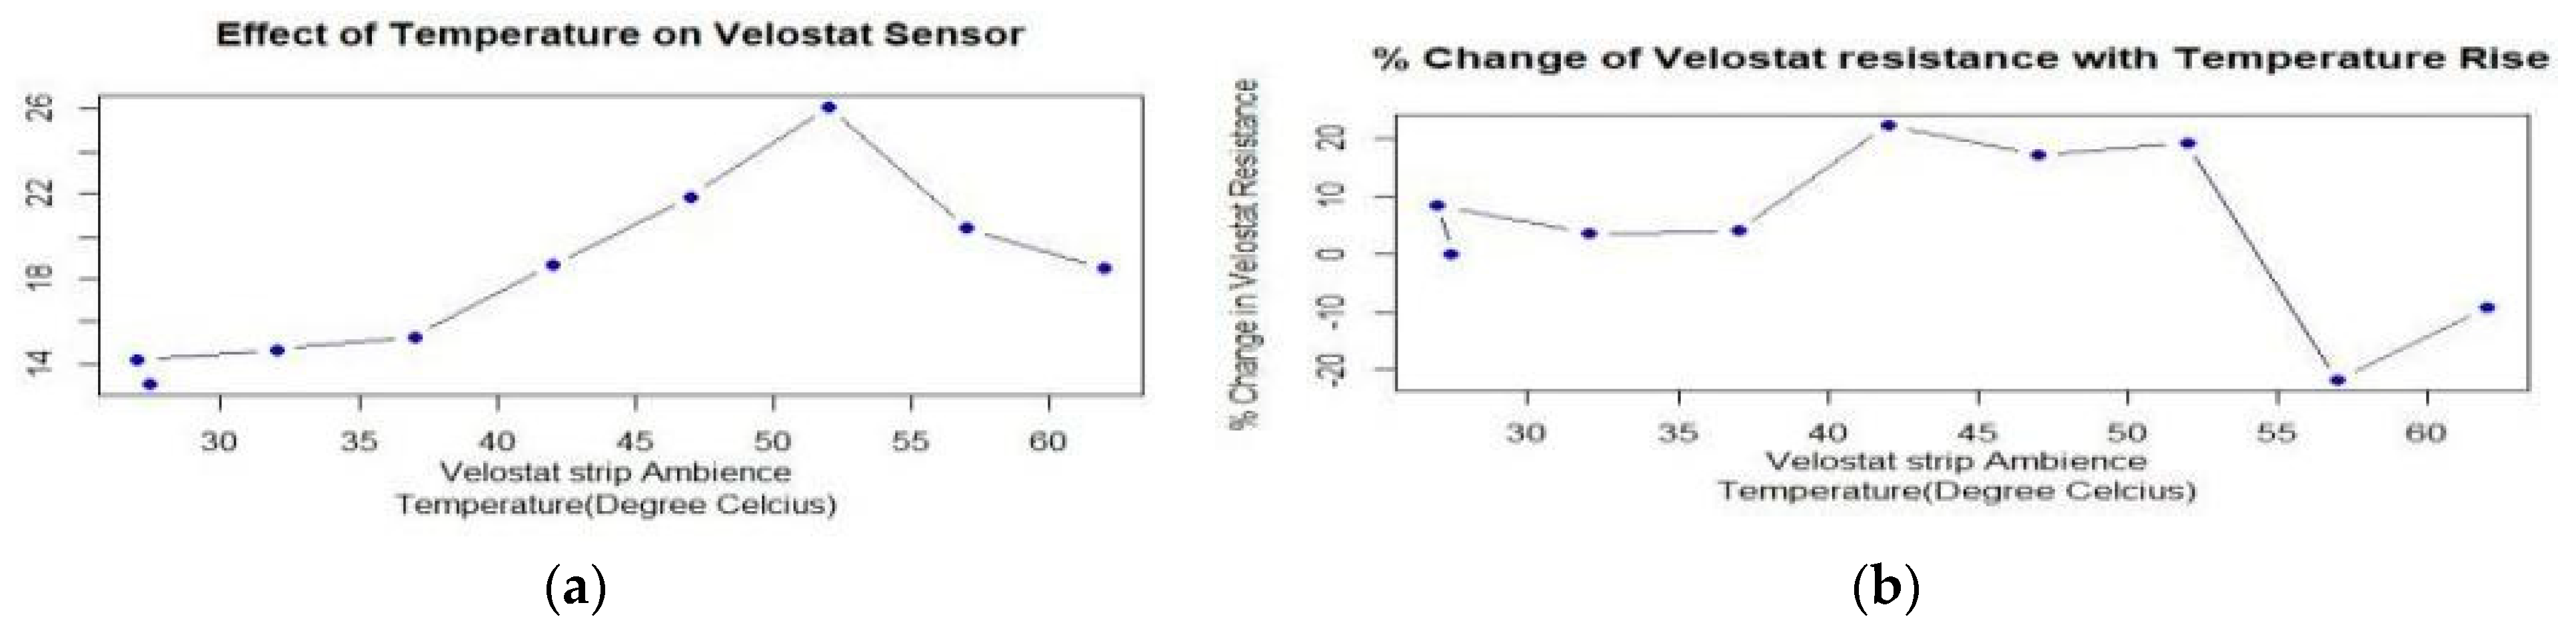
2.3.4. Effect of Temperature
The sensors were heated using a hot plate or hair dryer from room temperature up to 60 °C in steps of 5 degrees. At these temperatures, the sensor response was recorded for roughly 30 min with no loads and loads ranging from 200 gm to 2000 gm [11,12]. The temperature test is shown in Figure 6.
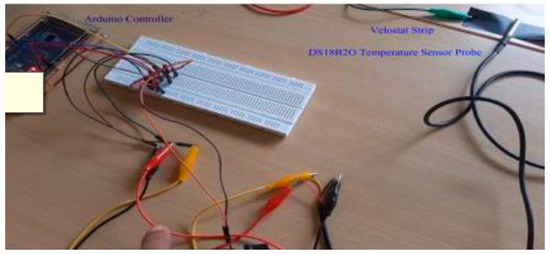
Figure 6.
Temperature test [17].
2.4. Experimental Methods
2.4.1. Pre-Commissioning Test
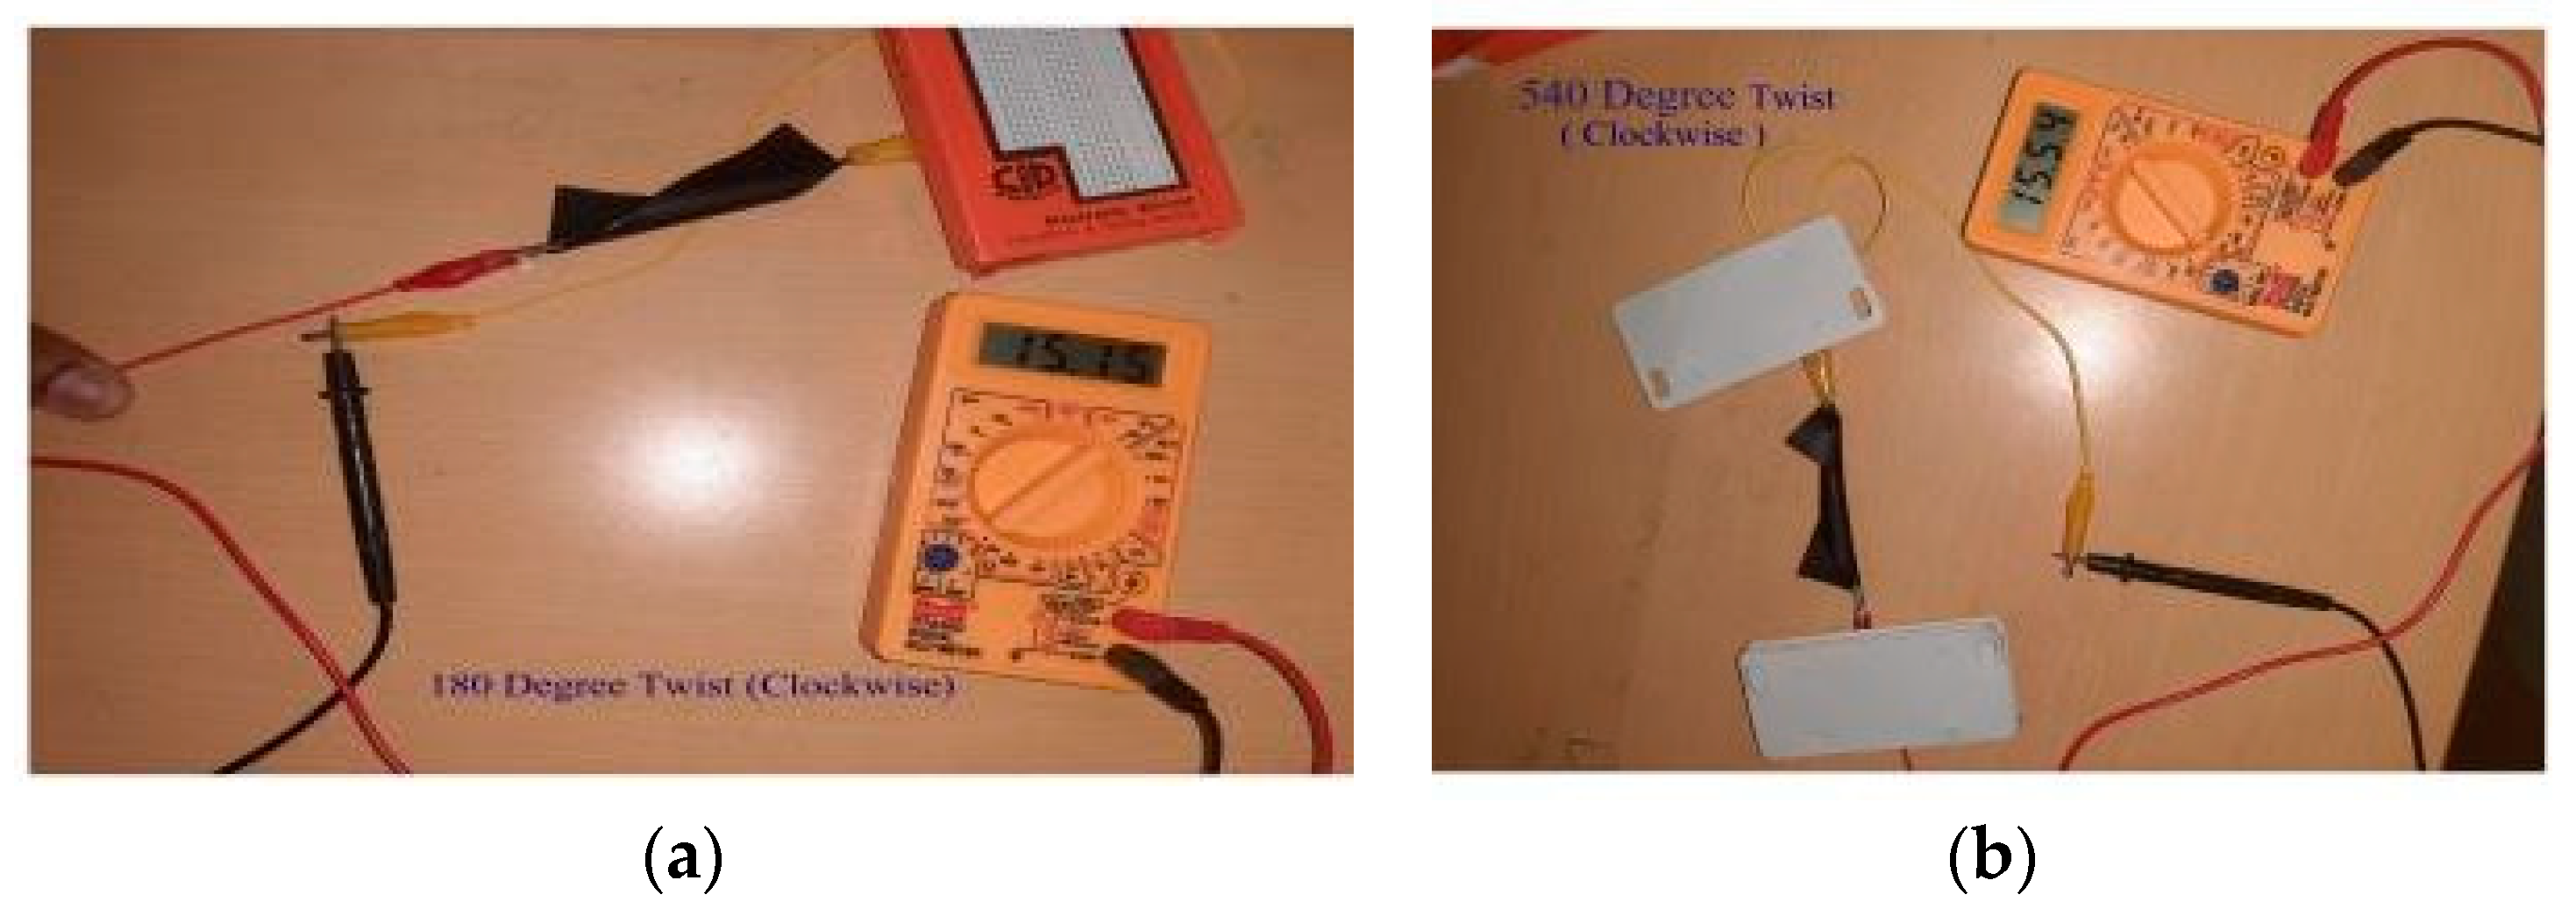
The fabricated sensor has to undergo various pre-commissioning tests, which include the twisting effect, bending effect, and stretching effect as in Figure 7.
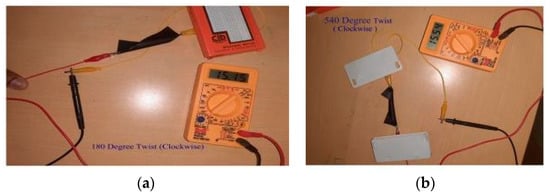
Figure 7.
(a) The 180° twisting of a velostat strip (Clockwise); (b) 540° twisting of a velostat strip (clockwise) [17].
2.4.2. Pre- and Post-Commissioning Tests
The results are shown in Table 1, Table 2, Table 3, Table 4, Table 5, Table 6, Table 7 and Table 8 and their related curves are shown in Figure 8, Figure 9, Figure 10, Figure 11 and Figure 12.

Table 1.
Variation in velostat resistance (clockwise).
Table 2.
Variation in velostat resistance (anti-clockwise).
Table 3.
Bending test on velostat strip.
Table 4.
Stretching test on velostat strip.
Table 5.
Loading test on the sensor (ascending weights) [18].
Table 6.
Loading test on the sensor (descending weights).
Table 7.
Effect of temperature on velostat material.
Table 8.
Hysteresis and drift tests on the sensor with calibrated weights.
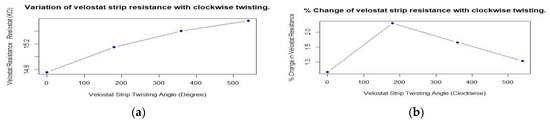
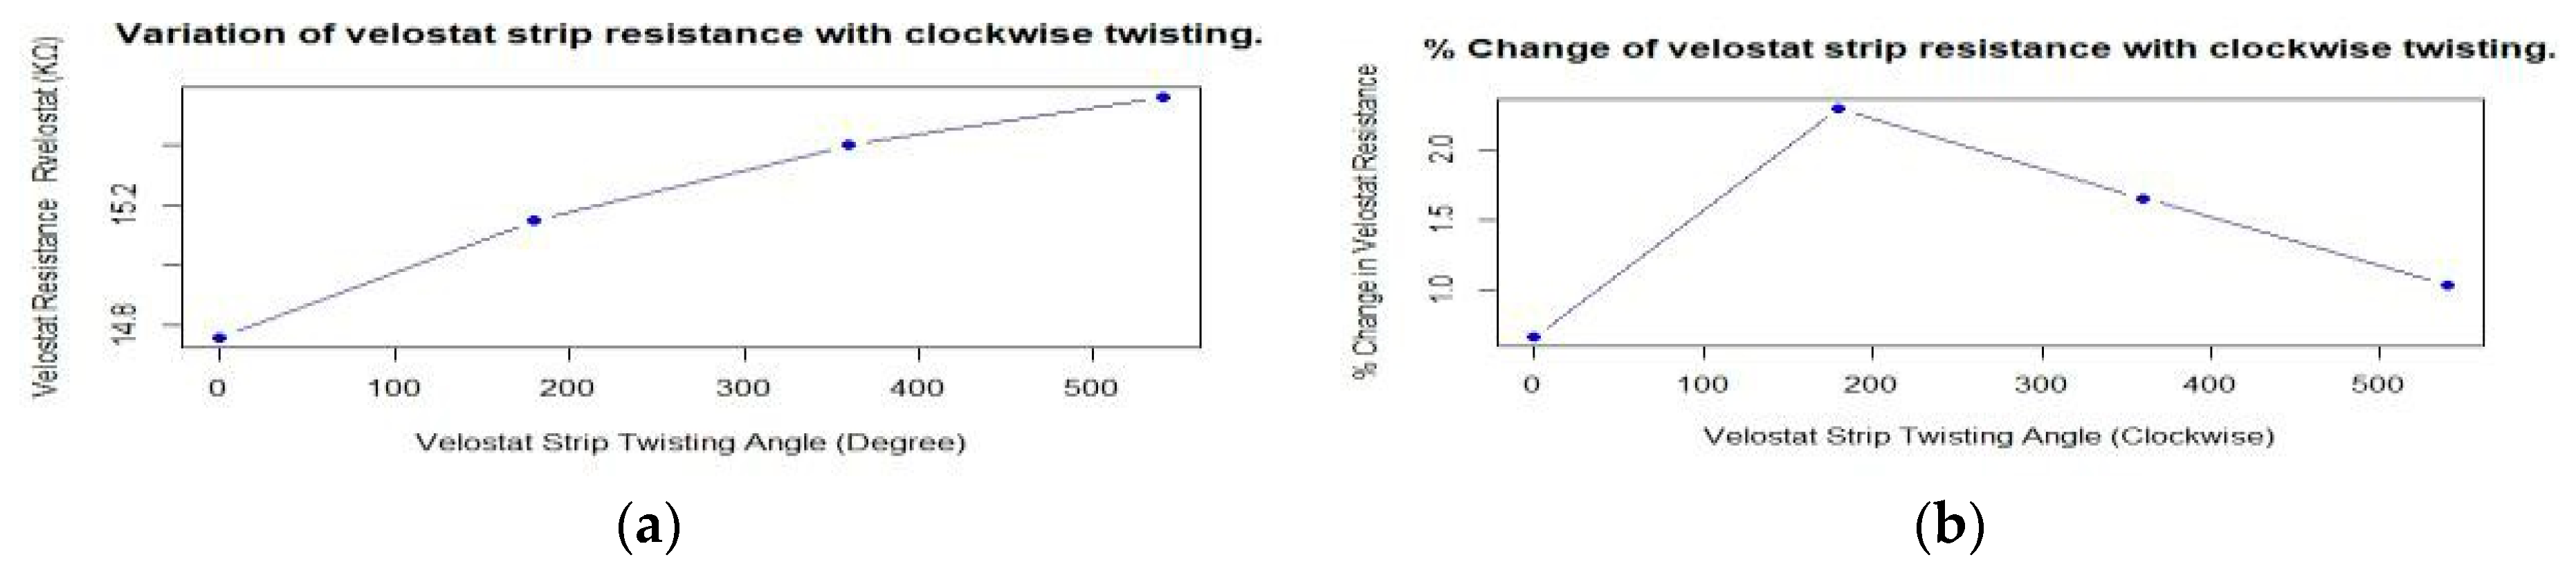
Figure 8.
(a) Variation in velostat resistance with clockwise twisting; (b) % change in velostat resistance with clockwise twisting.
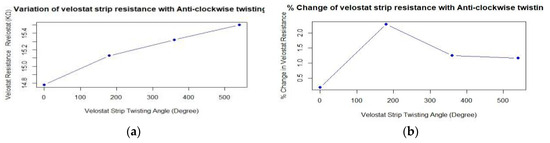
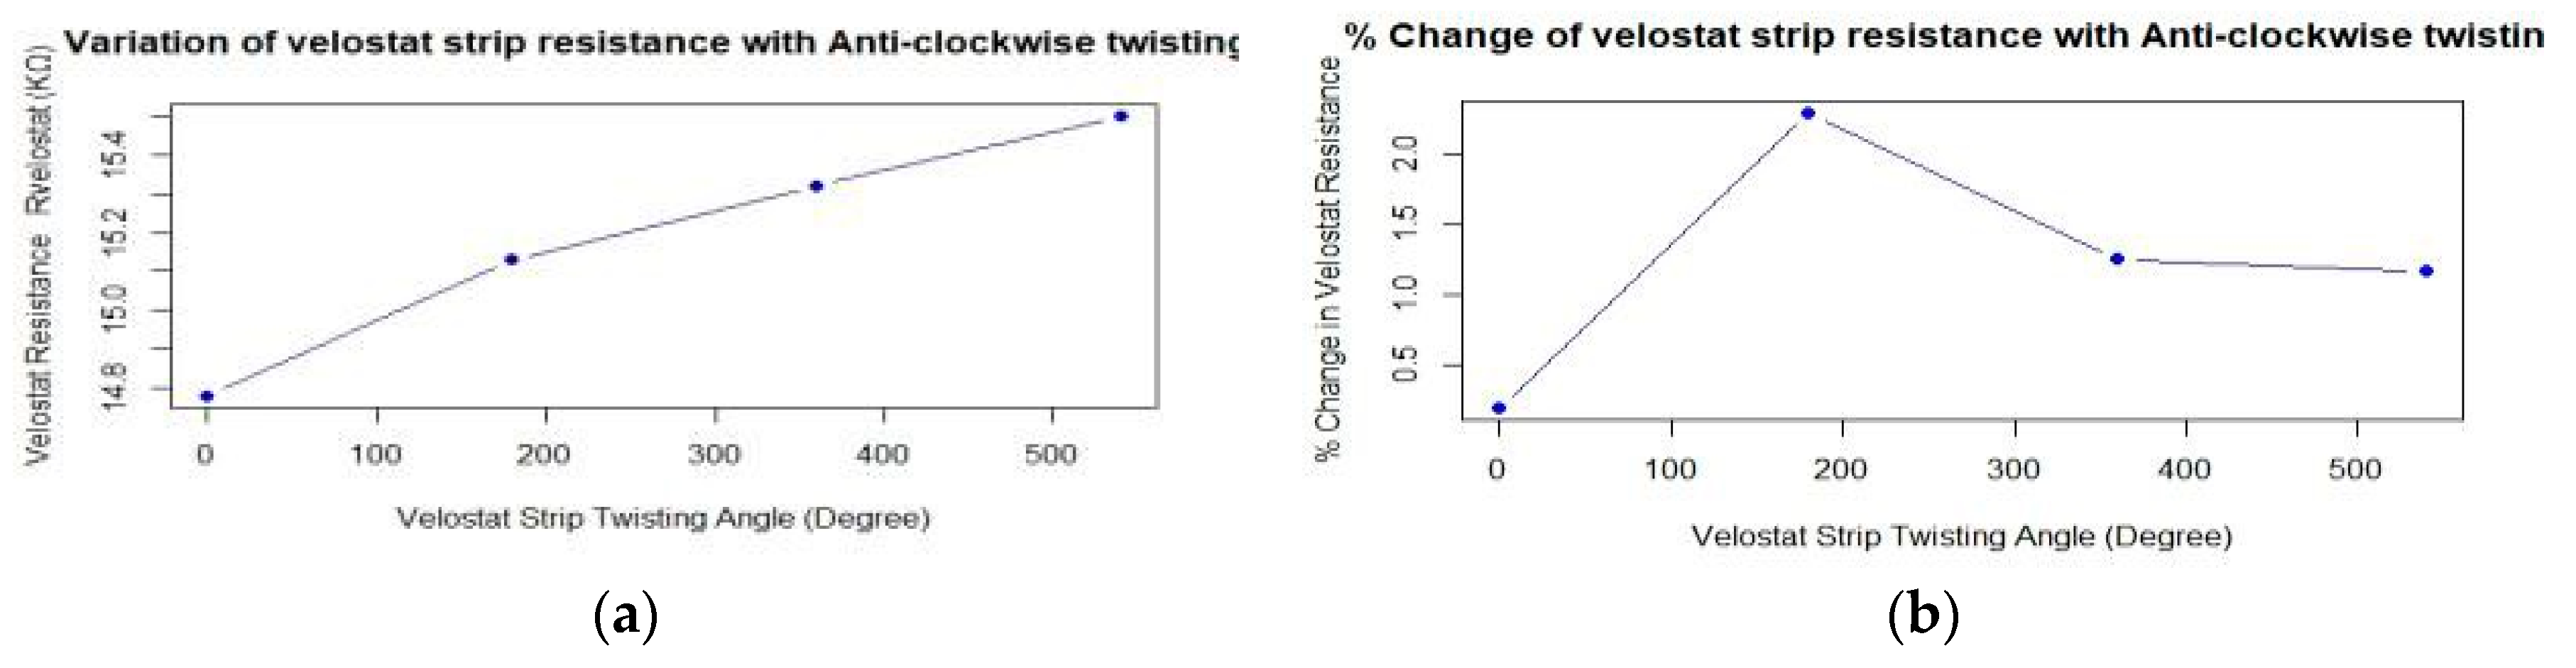
Figure 9.
(a) Variation in velostat resistance; (b) % change in resistance with anti-clockwise twisting.
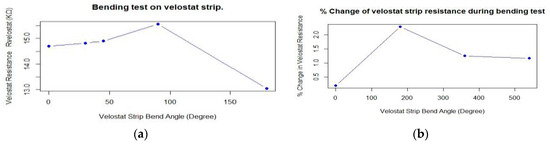
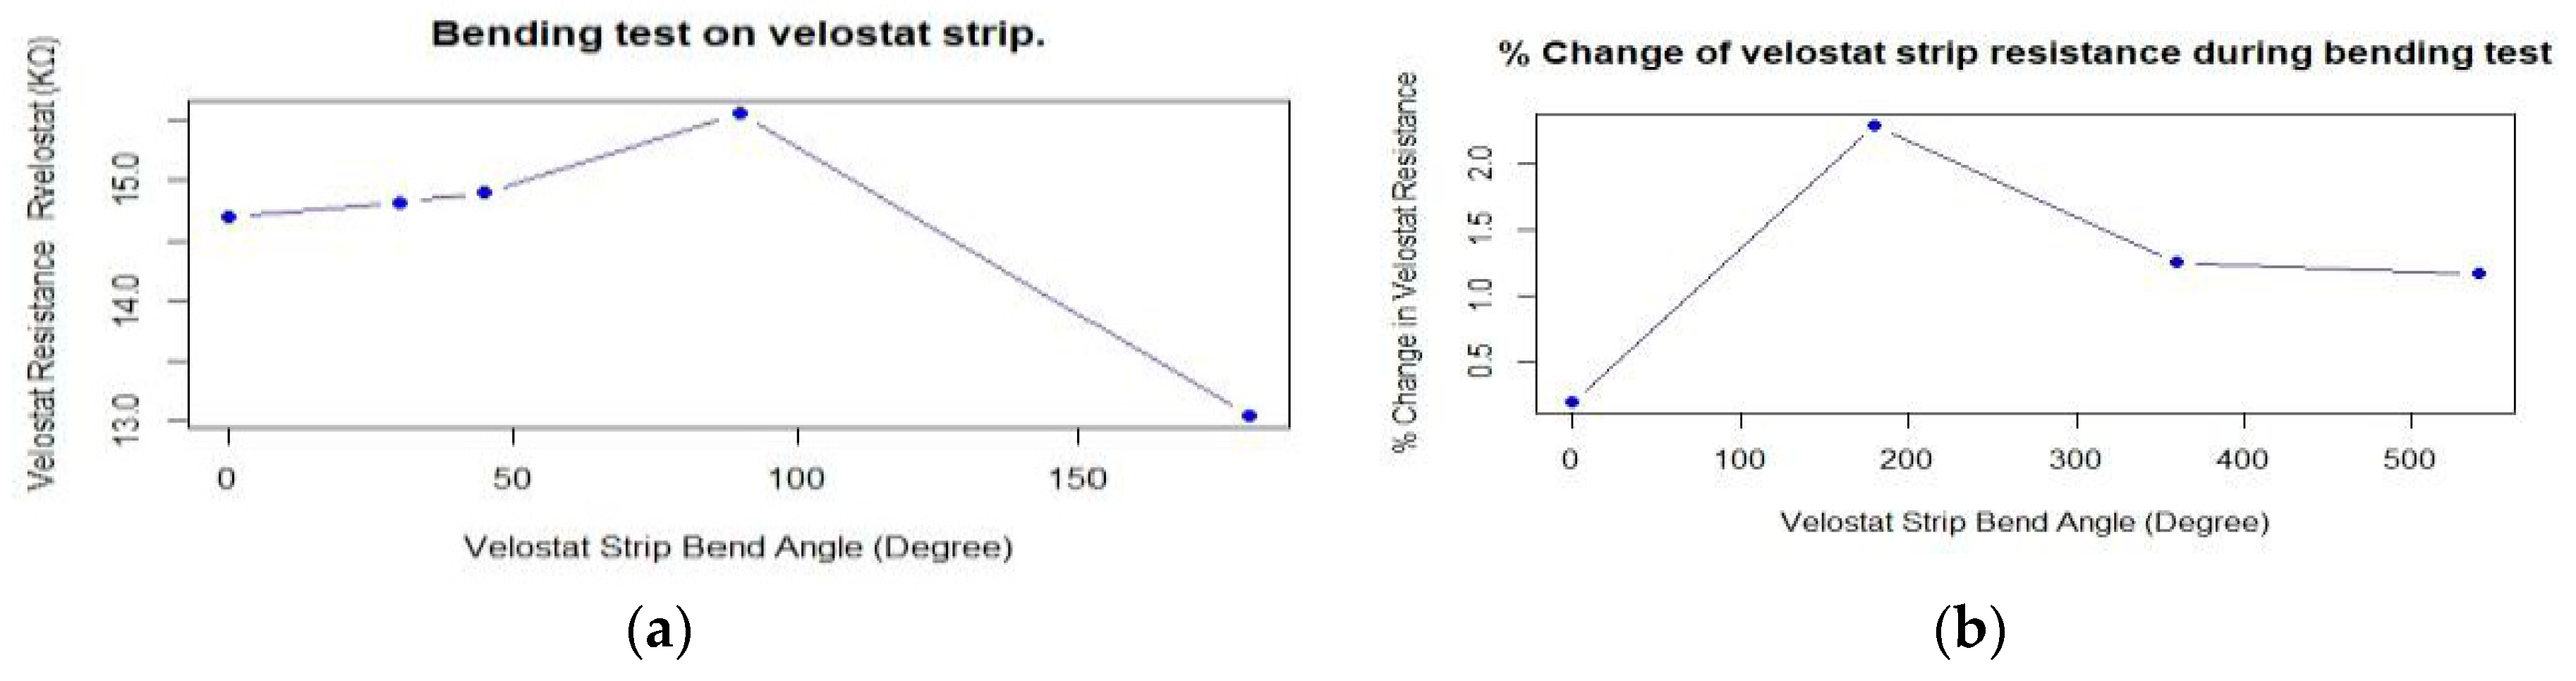
Figure 10.
(a) Resistance variation in bending test; (b) % change in resistance in bending test.
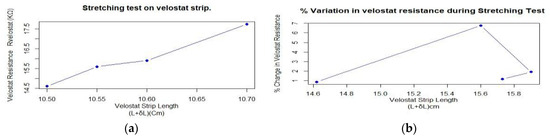
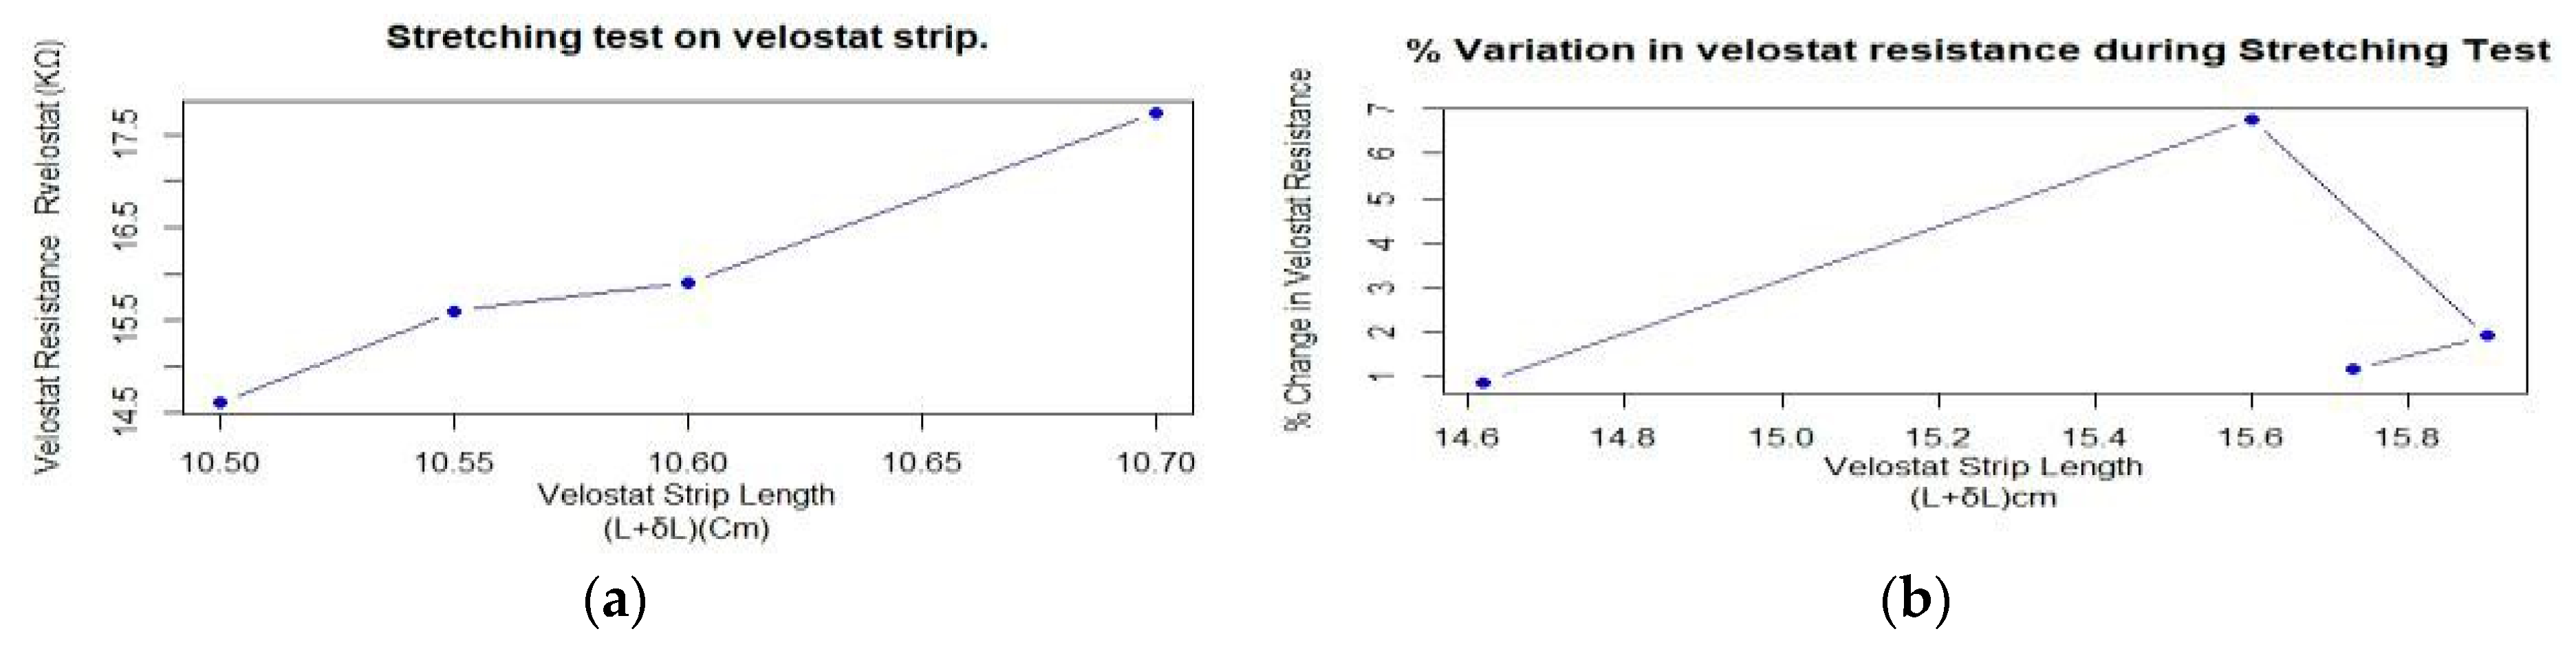
Figure 11.
(a) Variation in velostat resistance with stretching test; (b) % change in velostat resistance during stretching test.
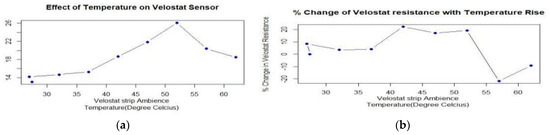
Figure 12.
(a) Effect of temperature on velostat sensor; (b)%change in resistance with temperature.
Calculations
For a calibrated weight of 1000 grams:
Drift in voltage = 1.10 – 1.02 = 0.08 V
Drift in fabricated sensor resistance = 39420.29 − 35245.29 = 4154.80 Ω
For calibrated weight of 250 grams, drift in voltage = 0.91 − 0.44 = 0.47 V
Drift in fabricated sensor resistance = 102417 − 44414.89 = 58002.11 Ω
3. Results and Discussion
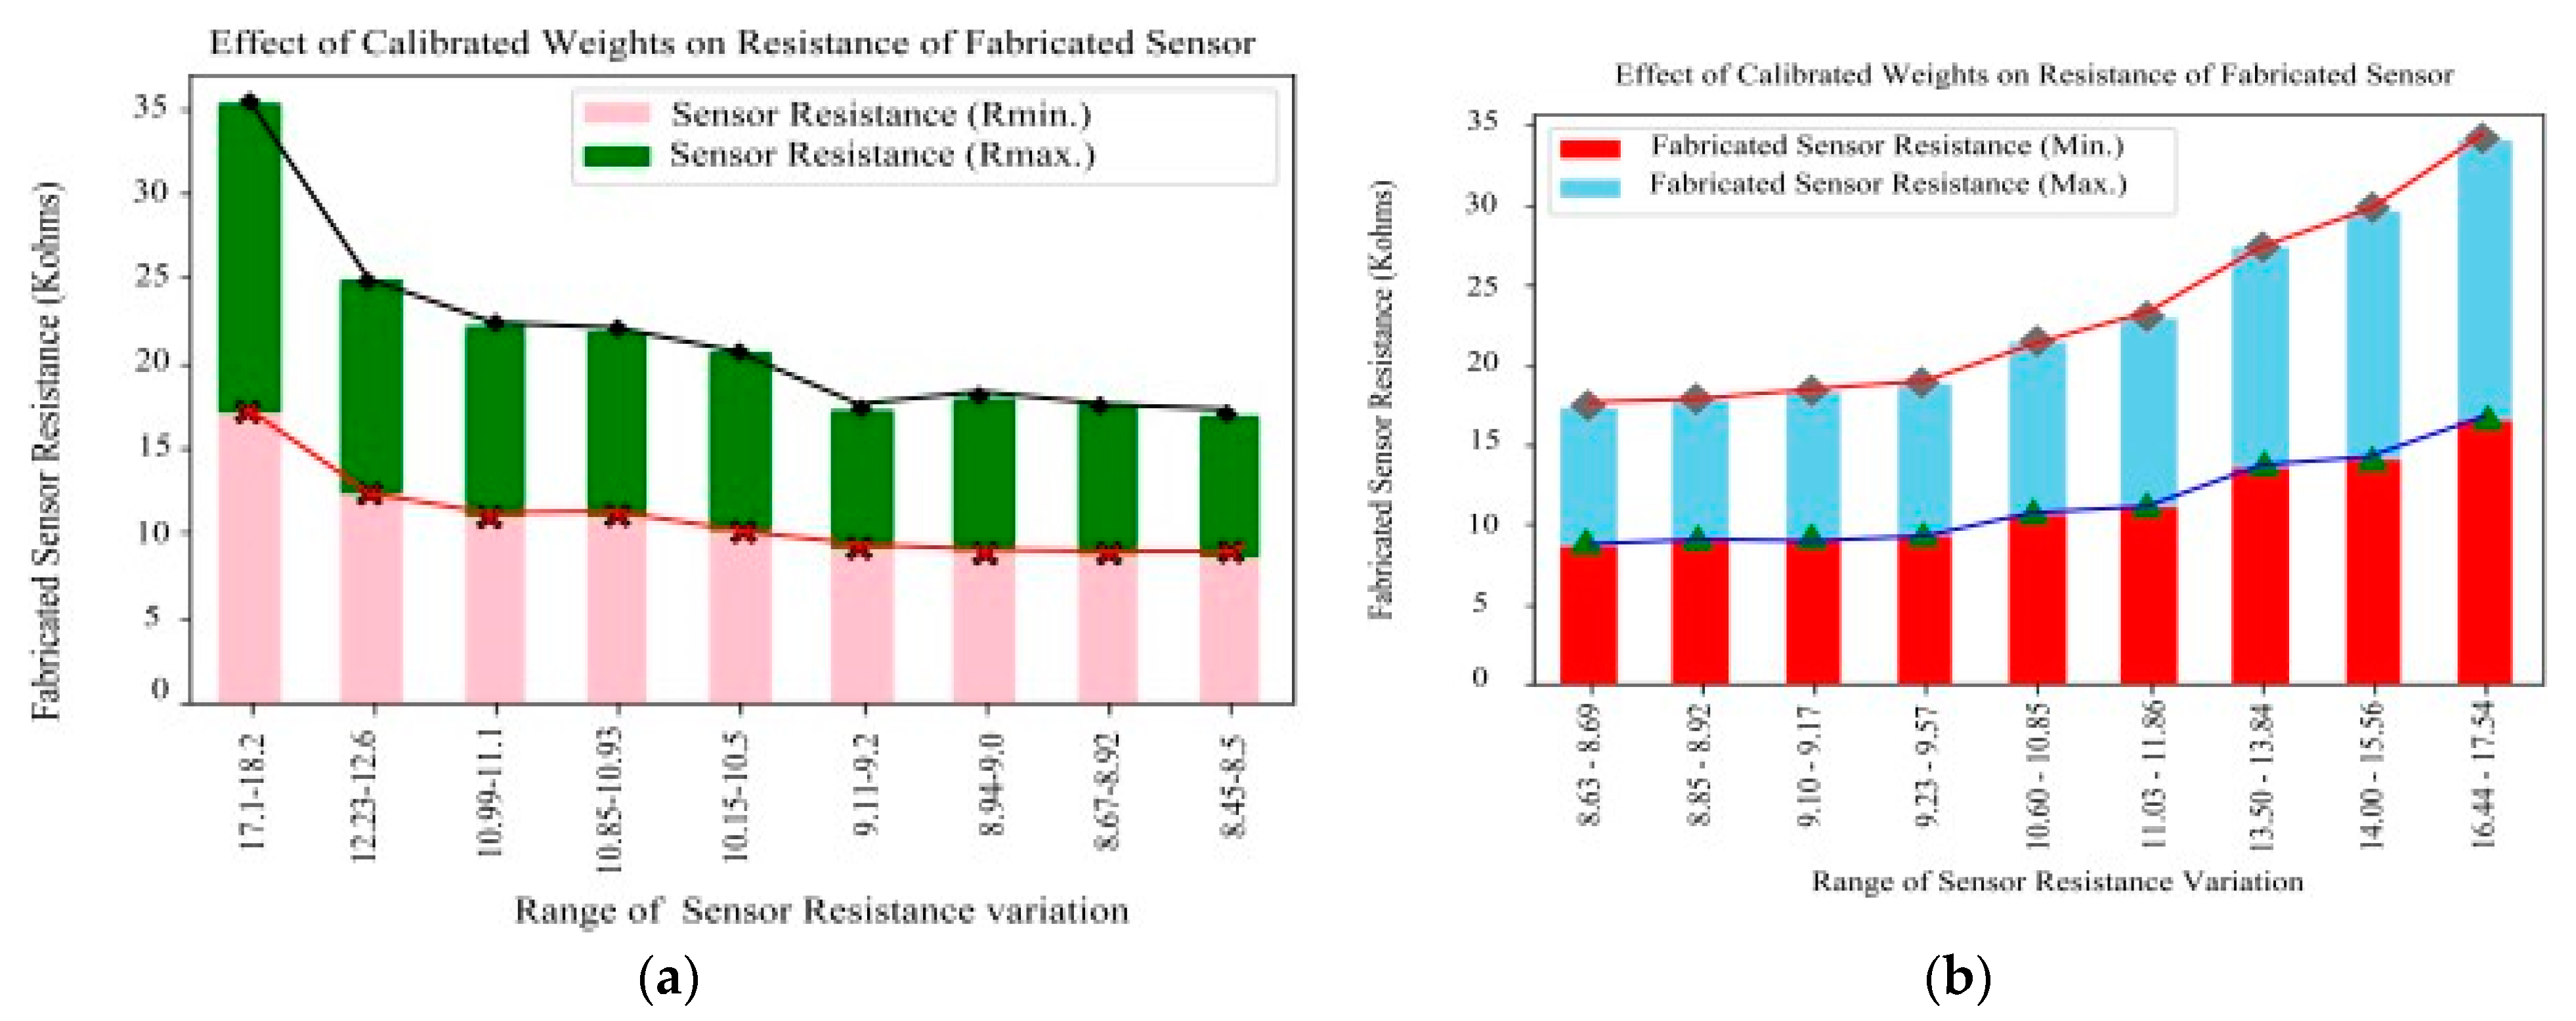
In the fabricated sensor, hysteresis errors were observed in a range of 21.121% to –42.253% for ascending and descending weights, as shown in Figure 13a,b, Figure 14a,b and Figure 15 and observations shown in Table 8.
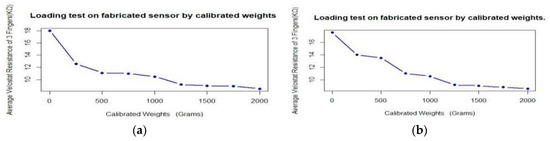
Figure 13.
(a) Effect of descending weight on Sensor Resistance (b) effect of ascending weight on sensor Resistance.

Figure 14.
(a) Sensor resistance range (descending weights); (b) Sensor resistance range (ascending weights.)
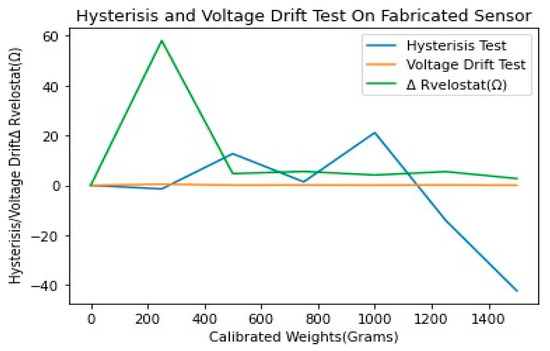
Figure 15.
Performance curve of the sensor [19,20].
The sensor sensitivity changes swiftly when exceeding a load of 1000 gm, as variations in resistance are significant; therefore, a range of readings are taken and then found optimal values shown in Figure 15a,b.
The voltage drift is also quantized in the sensor, ranging from 0.06 V to 0.47 V, as shown in Table 8. The effectiveness of the sensor is greatly affected when temperature increases above 60 °C, as shown in Table 7. After 55 °C, the resistance of the sensor drops significantly, as shown in Figure 12a The significance of this sensor fabrication is that it provides sensing solutions spanning consumer, industrial, and biomedical applications, as many different engineering principles and physics phenomena are employed to sense pressure.
The advantage of using velostat as a pressure-sensing element is that it is low cost, low power consumption, and has simple electronic circuitry. The limitations include its high sensitivity to pressure variations since output from the sensor is temperature-dependent, and problems with coating material and adhesives at temperatures beyond the sensor’s permissible values. Hysteresis can also affect performance matrices like accuracy, stability, precision, etc.
4. Conclusions
It is evident from the above observations and performance curves that the proposed specialized pressure sensor works satisfactorily during pick-and-place operation with calibrated weights and can safely be deployed with robotic arm grippers to grasp objects.
Author Contributions
The following are the contributions of the main author and coauthor of this manuscript. Conceptualization, M.D.S.; methodology, M.D.S.; software, M.D.S.; validation, J.B.; formal analysis, M.D.S.; investigation, M.D.S.; resources, M.D.S.; data curation, M.D.S.; writing—original draft preparation, M.D.S.; writing—review end editing, M.D.S. All authors have read and agreed to the published version of the manuscript.
Funding
This research received no external funding.
Institutional Review Board Statement
Not applicable.
Informed Consent Statement
Not applicable.
Data Availability Statement
The data that support the findings of this research are available at https://github.com/marutdevsharma/performance-evaluation-of-especialized-Pressure-Sensor- (accessed on 14 June 2023) or at DOI.
Acknowledgments
This research would not have been possible without the exceptional support of Juwesh Binong. He also looked over my transcriptions and numerous questions about the sensor system design and its implementations.
Conflicts of Interest
The authors declare no conflicts of interest.
References
- Tao, L.Q.; Zhang, K.N.; Tian, H.; Liu, Y.; Wang, D.Y.; Chen, Y.Q.; Yang, Y.; Ren, T.L. Graphene-paper pressure sensor for detecting human motions. ACS Nano 2017, 11, 8790–8795. [Google Scholar] [CrossRef] [PubMed]
- Ruth SR, A.; Feig, V.R.; Tran, H.; Bao, Z. Micro engineering pressure sensor active layers for improved performance. Adv. Funct. Mater. 2020, 30, 2003491. [Google Scholar] [CrossRef]
- Li, J.; Bao, R.; Tao, J.; Peng, Y.; Pan, C. Recent progress in flexible pressure sensor arrays: From design to applications. J. Mater. Chem. C 2018, 6, 11878–11892. [Google Scholar] [CrossRef]
- Li, R.; Zhou, Q.; Bi, Y.; Cao, S.; Xia, X.; Yang, A.; Xiao, X. Research progress of flexible capacitive pressure sensor for sensitivity enhancement approaches. Sens. Actuators A Phys. 2021, 321, 112425. [Google Scholar] [CrossRef]
- Luo, Z.P.; Berglund, L.J.; An, K.N. Validation of F-Scan pressure sensor system: A technical note. J. Rehabil. Res. Dev. 1998, 35, 186–191. [Google Scholar] [PubMed]
- Patra, J.C.; Kot, A.C.; Panda, G. An intelligent pressure sensor using neural networks. IEEE Trans. Instrum. Meas. 2000, 49, 829–834. [Google Scholar] [CrossRef]
- Shirinov, A.V.; Schomburg, W.K. Pressure sensor from a PVDF film. Sens. Actuators A Phys. 2008, 142, 48–55. [Google Scholar] [CrossRef]
- Hopkins, M.; Vaidyanathan, R.; Mcgregor, A.H. Examination of the performance characteristics of velostat as an in-socket pressure sensor. IEEE Sensors J. 2020, 20, 6992–7000. [Google Scholar] [CrossRef]
- Zang, Y.; Zhang, F.; Di, C.A.; Zhu, D. Advances of flexible pressure sensors toward artificial intelligence and health care applications. Mater. Horiz. 2015, 2, 140–156. [Google Scholar] [CrossRef]
- Ashruf, C.M.A. Thin flexible pressure sensors. Sensor Rev. 2002, 22, 322–327. [Google Scholar] [CrossRef]
- Vehec, I.; Livovsky, L. Flexible resistive sensor based on velostat. In Proceedings of the 2020 43rd International Spring Seminar on Electronics Technology (ISSE), Demanovska Valley, Slovakia, 14–15 May 2020; pp. 1–6. [Google Scholar]
- Giovanelli, D.; Farella, E. Force sensing resistor and evaluation of technology for wearable body pressure sensing. J. Sens. 2016, 2016, 9391850. [Google Scholar] [CrossRef]
- Fatema, A.; Poondla, S.; Mishra, R.B.; Hussain, A.M. A low-cost pressure sensor matrix for activity monitoring in stroke patients using artificial intelligence. IEEE Sensors J. 2021, 21, 9546–9552. [Google Scholar] [CrossRef]
- Yuan, L.; Qu, H.; Li, J. Velostat Sensor Array for Object Recognition. IEEE Sens. J. 2022, 22, 1692–1704. [Google Scholar] [CrossRef]
- Sergio, M.; Manaresi, N.; Tartagni, M.; Guerrieri, R.; Canegallo, R. A textile based capacitive pressure sensor. Sensors 2002, 2, 1625–1630. [Google Scholar]
- Gála, M.; Barabáš, J.; Kopásková, M. User presence monitoring based on Velostat pressure sensors and Arduino platform. In Proceedings of the 2020 IEEE 21st International Conference on Computational Problems of Electrical Engineering (CPEE), Online Conference, Poland, 16–19 September 2020; pp. 1–3. [Google Scholar]
- Salibindla, S.; Ripoche, B.; Lai, D.T.; Maas, S. Characterization of a new flexible pressure sensor for body sensor networks. In Proceedings of the 2013 IEEE Eighth International Conference on Intelligent Sensors, Sensor Networks and Information Processing, Melbourne, VIC, Australia, 2–5 April 2013; pp. 27–31. [Google Scholar]
- Chen, D.; Cai, Y.; Huang, M.C. Customizable pressure sensor array: Design and evaluation. IEEE Sensors J. 2018, 18, 6337–6344. [Google Scholar] [CrossRef]
- Li, Y.; Samad, Y.A.; Liao, K. From cotton to wearable pressure sensor. J. Mater. Chem. A 2015, 3, 2181–2187. [Google Scholar] [CrossRef]
- Meyer, J.; Lukowicz, P.; Troster, G. Textile pressure sensor for muscle activity and motion detection. In Proceedings of the 2006 10th IEEE International Symposium on Wearable Computers, Montreux, Switzerland, 11–14 October 2006; pp. 69–72. [Google Scholar]


Disclaimer/Publisher’s Note: The statements, opinions and data contained in all publications are solely those of the individual author(s) and contributor(s) and not of MDPI and/or the editor(s). MDPI and/or the editor(s) disclaim responsibility for any injury to people or property resulting from any ideas, methods, instructions or products referred to in the content. |
© 2023 by the authors. Licensee MDPI, Basel, Switzerland. This article is an open access article distributed under the terms and conditions of the Creative Commons Attribution (CC BY) license (https://creativecommons.org/licenses/by/4.0/).