Proceeding Paper

Detecting Trend Turning Points in PS-InSAR Time Series: Slow-Moving Landslides in Province of Frosinone, Italy †

by
Ebrahim Ghaderpour
1,2,*,
Benedetta Antonielli
1,2,
Francesca Bozzano
1,2,
Gabriele Scarascia Mugnozza
1,2 and
Paolo Mazzanti
1,2
1
Department of Earth Sciences & CERI Research Centre, Sapienza University of Rome; P.le Aldo Moro, 5, 00185 Rome, Italy
2
NHAZCA s.r.l., Via Vittorio Bachelet, 12, 00185 Rome, Italy
*
Author to whom correspondence should be addressed.
Presented at the 10th International Conference on Time Series and Forecasting, Gran Canaria, Spain, 15–17 July 2024.
Eng. Proc. 2024, 68(1), 12; https://doi.org/10.3390/engproc2024068012
Published: 3 July 2024
(This article belongs to the Proceedings of The 10th International Conference on Time Series and Forecasting)

Abstract

:
Detecting slow-moving landslides is a crucial task for mitigating potential risk to human lives and infrastructures. In this research, Persistent Scatterer Interferometric Synthetic Aperture Radar (PS-InSAR) time series, provided by the European Ground Motion Service (EGMS), for the province of Frosinone in Italy are employed, and Sequential Turning Point Detection (STPD) is applied to them to estimate the dates when the displacement rates change. The estimated dates are classified based on the land cover/use of the province. Moreover, local precipitation time series are employed to investigate how precipitation rate changes might have triggered the landslides.

1. Introduction

Slow-moving landslides, though rarely claiming lives, can eventually cause damage to infrastructures due to continuous movement and reactivation phases. Areas influenced by slope instability, including buildings and roads, are significantly affected by such slow-moving displacements, resulting in socioeconomic consequences [1,2,3]. Thus, the detection and monitoring of slow-moving landslides is crucial. There are many approaches for landslide monitoring, e.g., geotechnical and geophysical approaches, and monitoring using unmanned aerial vehicles, aircraft, satellite remote sensing (active and passive) imagery, and infrared thermal cameras [4,5,6,7].
Persistent Scatterer Interferometric Synthetic Aperture Radar (PS-InSAR) is a robust technique that utilizes SAR interferograms for the same ground area to determine stable points, reflecting radar signals consistently for a long period. These points are typically located on buildings, roads, bedrocks, cliffs, etc. [8]. Although this technique suffers from a lack of point density in non-urban areas due to temporal de-correlation, it is very effective for ground deformation monitoring, especially in urban areas [9]. The European Ground Motion Service (EGMS) has recently provided PS-InSAR time series from Sentinel-1 satellites for ground deformation monitoring across Europe with millimeter precision, and for the study of the impact of climate change. The SAR satellites travel half of their trajectory from the south pole to the north pole, referred to as ascending orbit (ASC), and the other half from the north pole to the south pole, referred to as descending orbit (DESC), to acquire imagery over the same area. The ASC and DESC provide deformation along the satellites’ Line of Sight (LOS), so their displacement time series for the same area may significantly differ. Therefore, combining PS-InSAR time series of ASC and DESC is a more effective method of ground deformation monitoring [10].
Ghaderpour et al. [11] proposed a method, namely, the Sequential Turning Point Detection (STPD) to rapidly detect changes in the displacement rates of InSAR time series [11]. They applied STPD to PS-InSAR time series from Sentinel-1 for the province of Frosinone in Italy. The STPD uses a windowing approach where a potential TP is estimated within each window sequentially using Ordinary Least-Squares (OLS) [12]. All of the statistically significant TPs are then re-evaluated according to their Signal-to-Noise Ratio (SNR) and Normalized Difference Residual Index (NDRI) to find an optimal connected linear trend with multiple pieces that best fit the entire InSAR time series [11]. Ghaderpour et al. [13] analyzed precipitation time series for the 20 administrative regions of Italy and highlighted the possible effects of precipitation rate change on triggering landslides. In the current study, more details on how the precipitation change rate can trigger or reactivate slow-moving landslides are presented. The main contributions of this research are as follows:
(1)
The application of STPD to PS-InSAR time series of ascending and descending orbits, pre-processed and provided by EGMS, for landslide-prone areas in the province of Frosinone, Italy.
(2)
The classification of the TPs according to the land cover/use for the landslide-prone areas in the entire province and four towns in the province with their surroundings, namely, Cassino, Sora, Frosinone, and Ausonia.
(3)
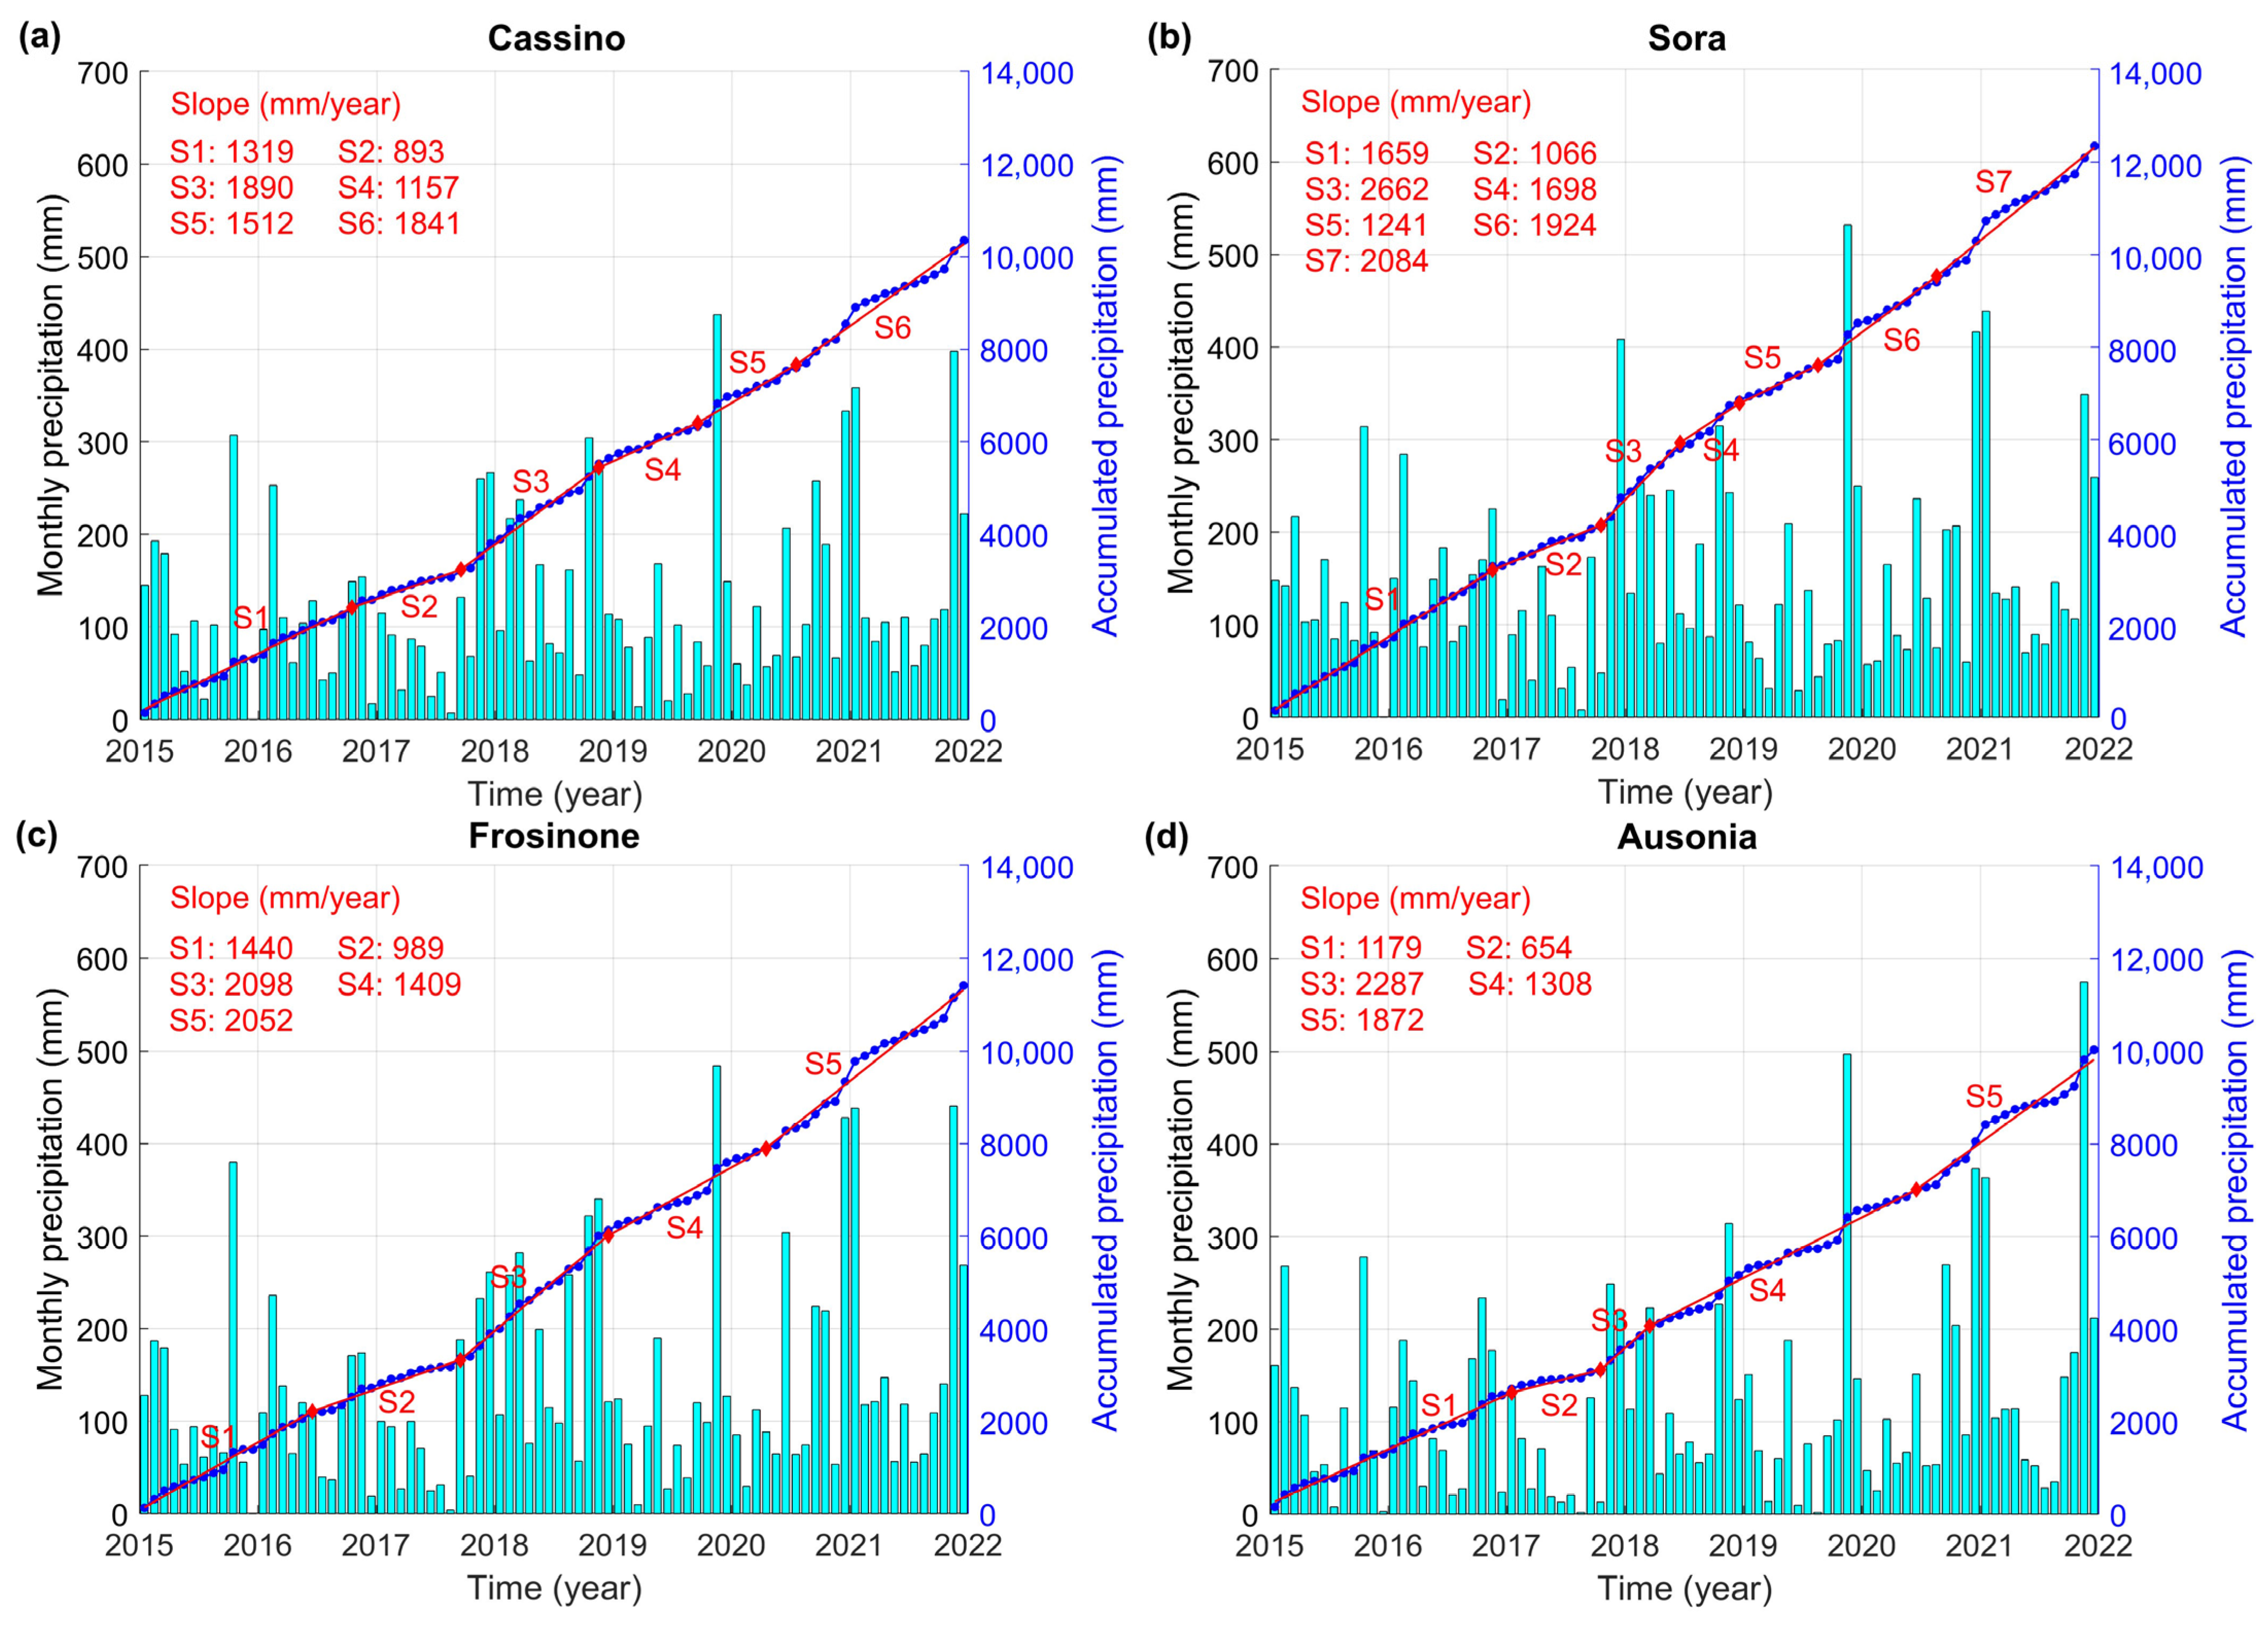
The application of STPD to the local accumulated precipitation time series for the four towns and a discussion of the potential impacts of their rate change on the detected TPs in the PS-InSAR time series based on their land cover types.
Note that the PS-InSAR time series utilized in this research, provided by EGMS, are spatially much denser than the PS-InSAR time series from Sentinel-1 utilized in [11].

2. Materials and Methods

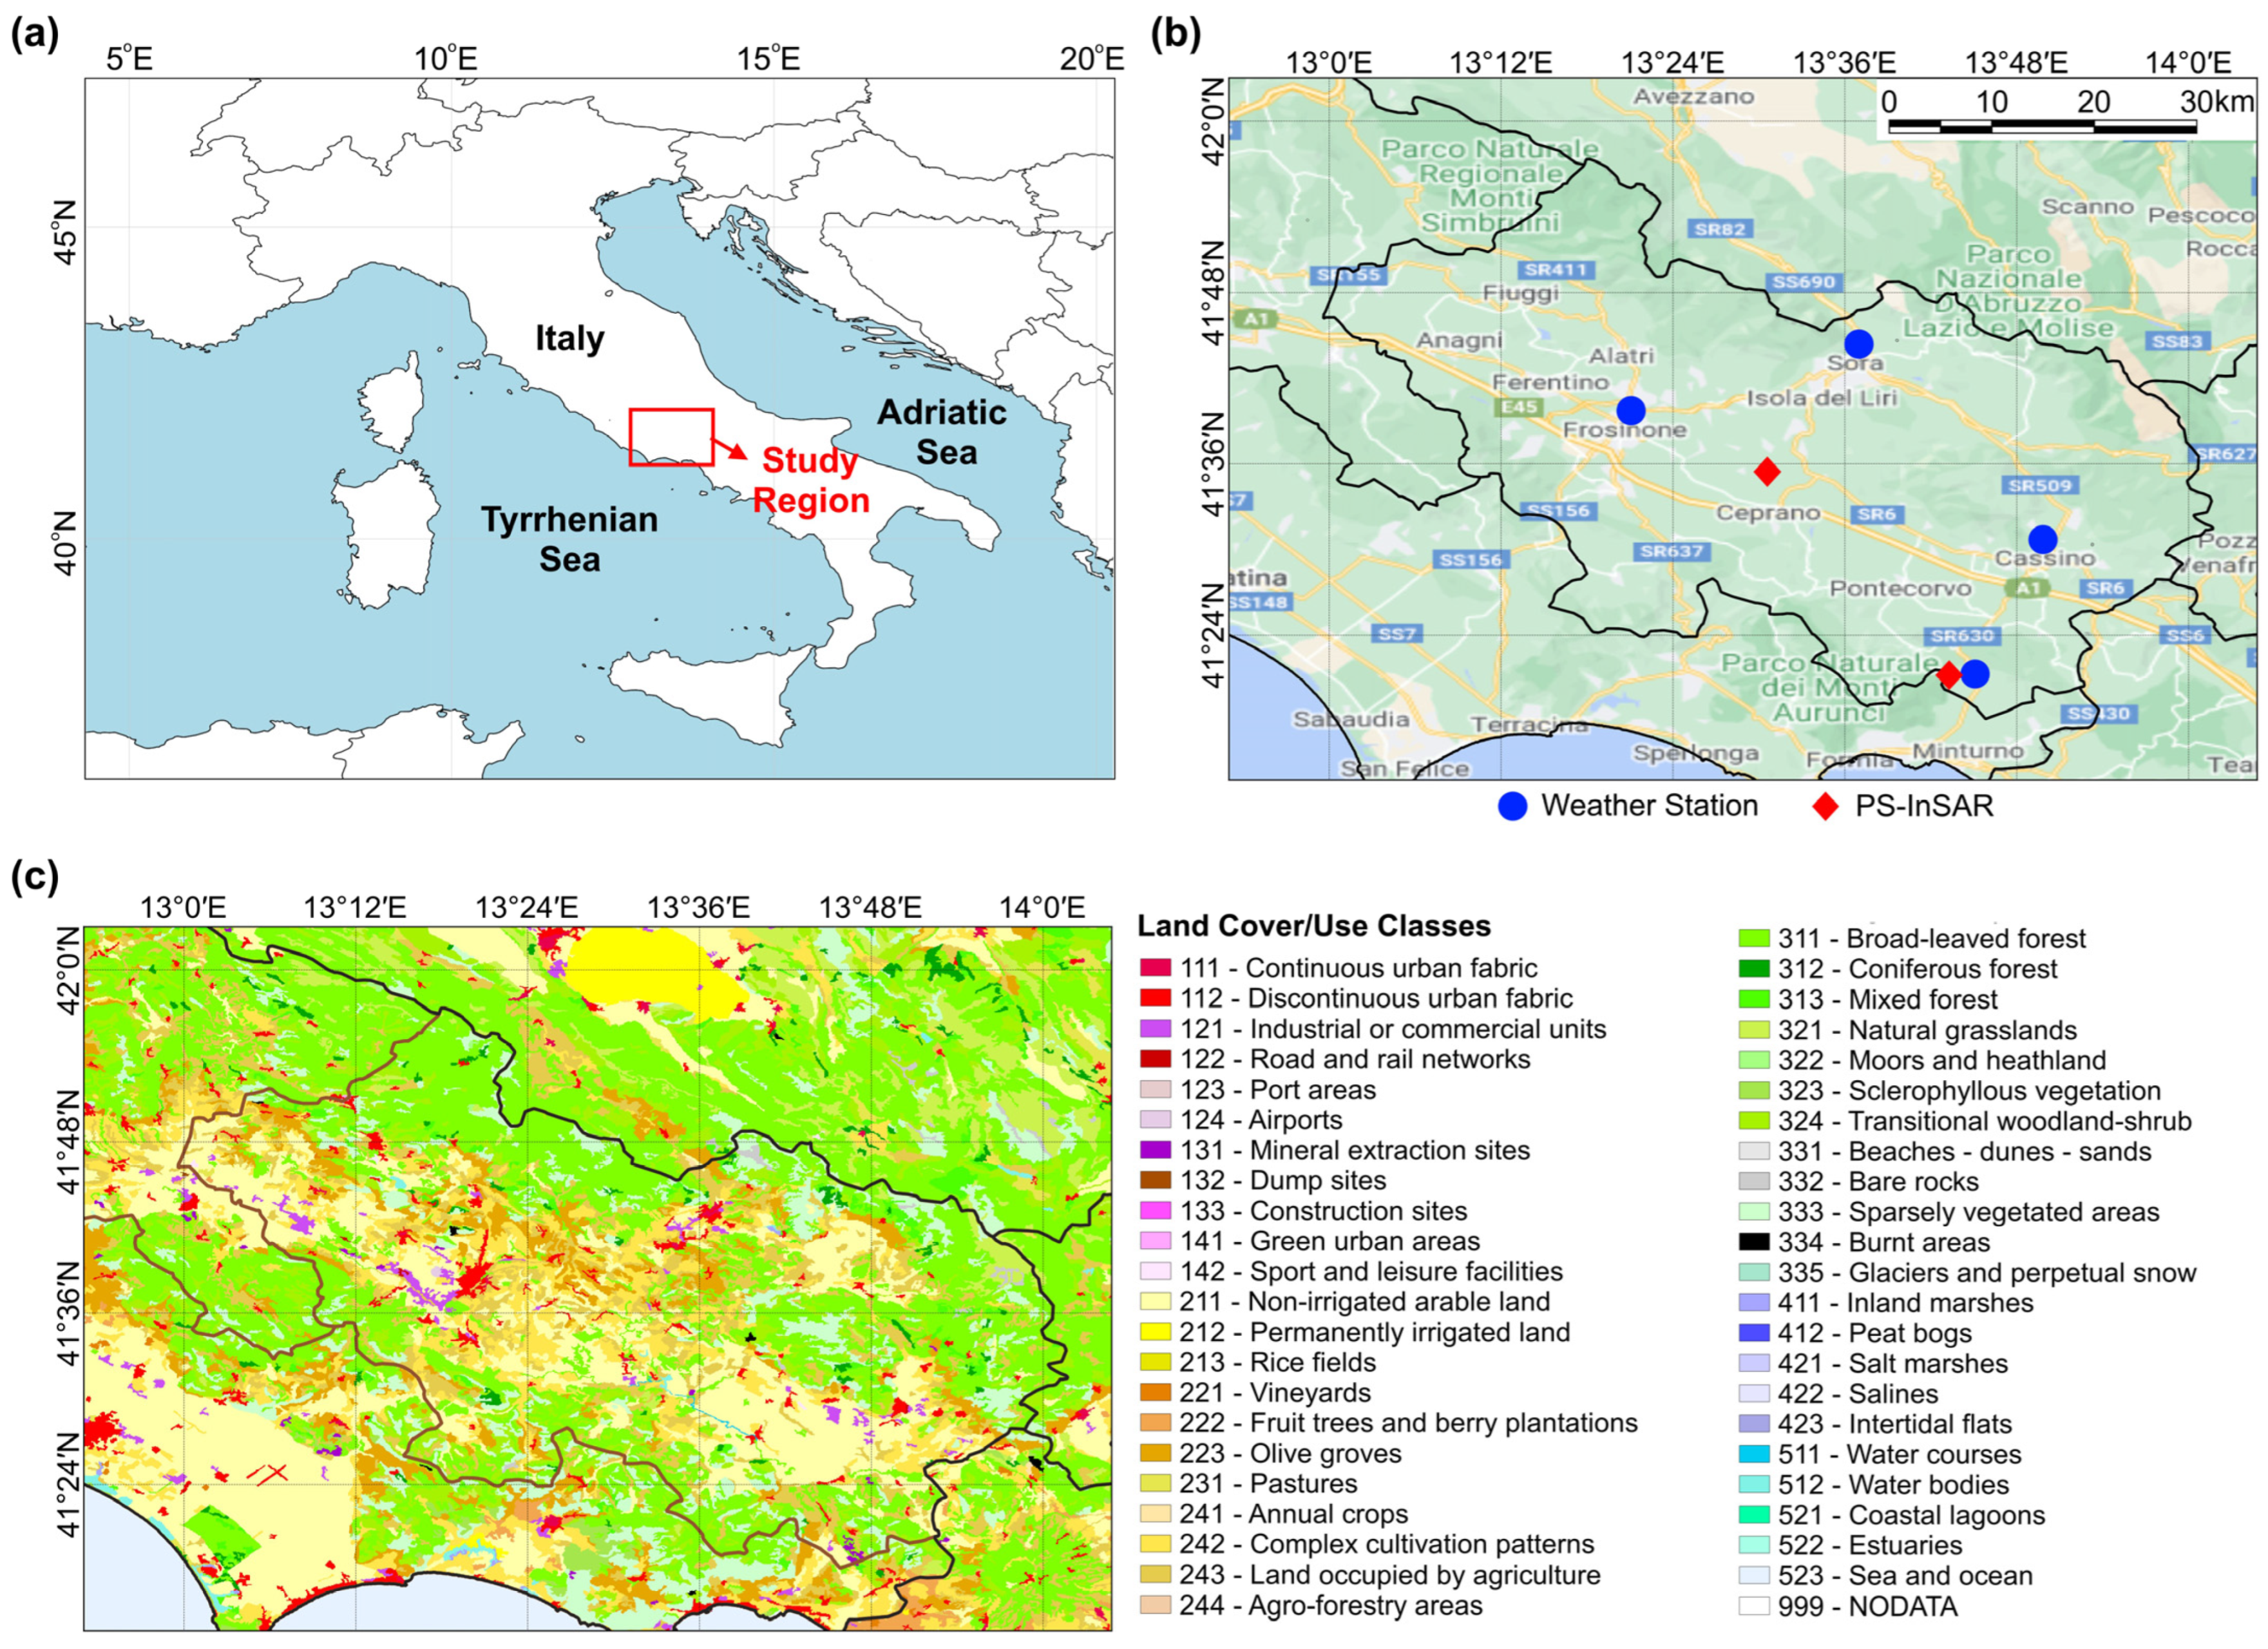
2.1. Study Region and Datasets

The province of Frosinone is in the Lazio region in Italy with an area of approximately 3247 km2 and population of nearly 500,000 people [11]. The province is bounded by the Ausoni-Aurunci, Lepini, Ernici, and Mainarde mountains from the south, southwest, north, and northeast, respectively, which are parts of the Central Apennines [14]. In this research, the same 1345 landslide-prone polygons are considered as those described in detail in [11]. In addition, the landslide-prone polygons of four towns of this province with their neighborhoods are selected for more detailed analyses. These towns are Cassino, Sora, Frosinone, and Ausonia, with approximate populations of 36,000, 26,000, 47,000, and 2500, respectively. Figure 1 shows the study region and land cover/use of the region. Table 1 summarizes the datasets employed in this research.

2.2. Sequential Turning Point Detection (STPD) Revisited

The STPD approach is briefly described here, and the reader is referred to [11] for more details. Assume that S 1 = y 1 , , y τ and S 2 = y τ , , y n are two segments of a time series. For each τ , 1 < τ < n ; first, Ψ 1 = k = 1 τ y k m 1 t k b 1 2 is minimized to estimate the intercept b 1 and slope m 1 using OLS, and then Ψ 2 = k = τ n y k m 2 ( t k t τ ) m ^ 1 t τ + b ^ 1 2 is minimized to estimate the slope m 2 for the second connected linear piece using OLS. The potential TP is a τ minimizing the L2 norm of residuals (namely, τ forward ). The STPD carries out this process on the flipped time series and then flips it to find the potential TP (namely, τ backward ) . The time series likely has a potential TP if τ forward τ backward 3 , where, in this case, the one whose corresponding L2 norm of residuals is minimum will be selected as the TP. The selected TP is then evaluated using SNR and NDRI, where the recommended thresholds are SNR > 1 and | NDRI |   < 0.3 . Note that NDRI is defined as the difference between the norms of the residual segments before and after the TP divided by their summation, and the suggested thresold for NDRI is shown to be effective for distinguishing jumps from TPs through an extensive simulation [11]. When an InSAR time series has a significant jump, e.g., due to fast-moving landslides or earthquakes, the absolute value of the NDRI tends to be high.
The entire sequential process above is followed for each segment within a translating window to find a maximum of one statistically significant TP for that segment. Then, all of the potential TPs will be re-evaluated using L2 norm minimization, SNR, and NDRI [11]. Time series with an absolute value of NDRI greater than 0.3 likely have jumps instead of TPs, and so they are omitted from further processes in this research. Users can select a maximum number of TPs for their time series by selecting an appropriate window size and a translating step. A 5-year-long window that translates annually is recommended for processing monthly resampled PS-InSAR time series [11].

3. Results

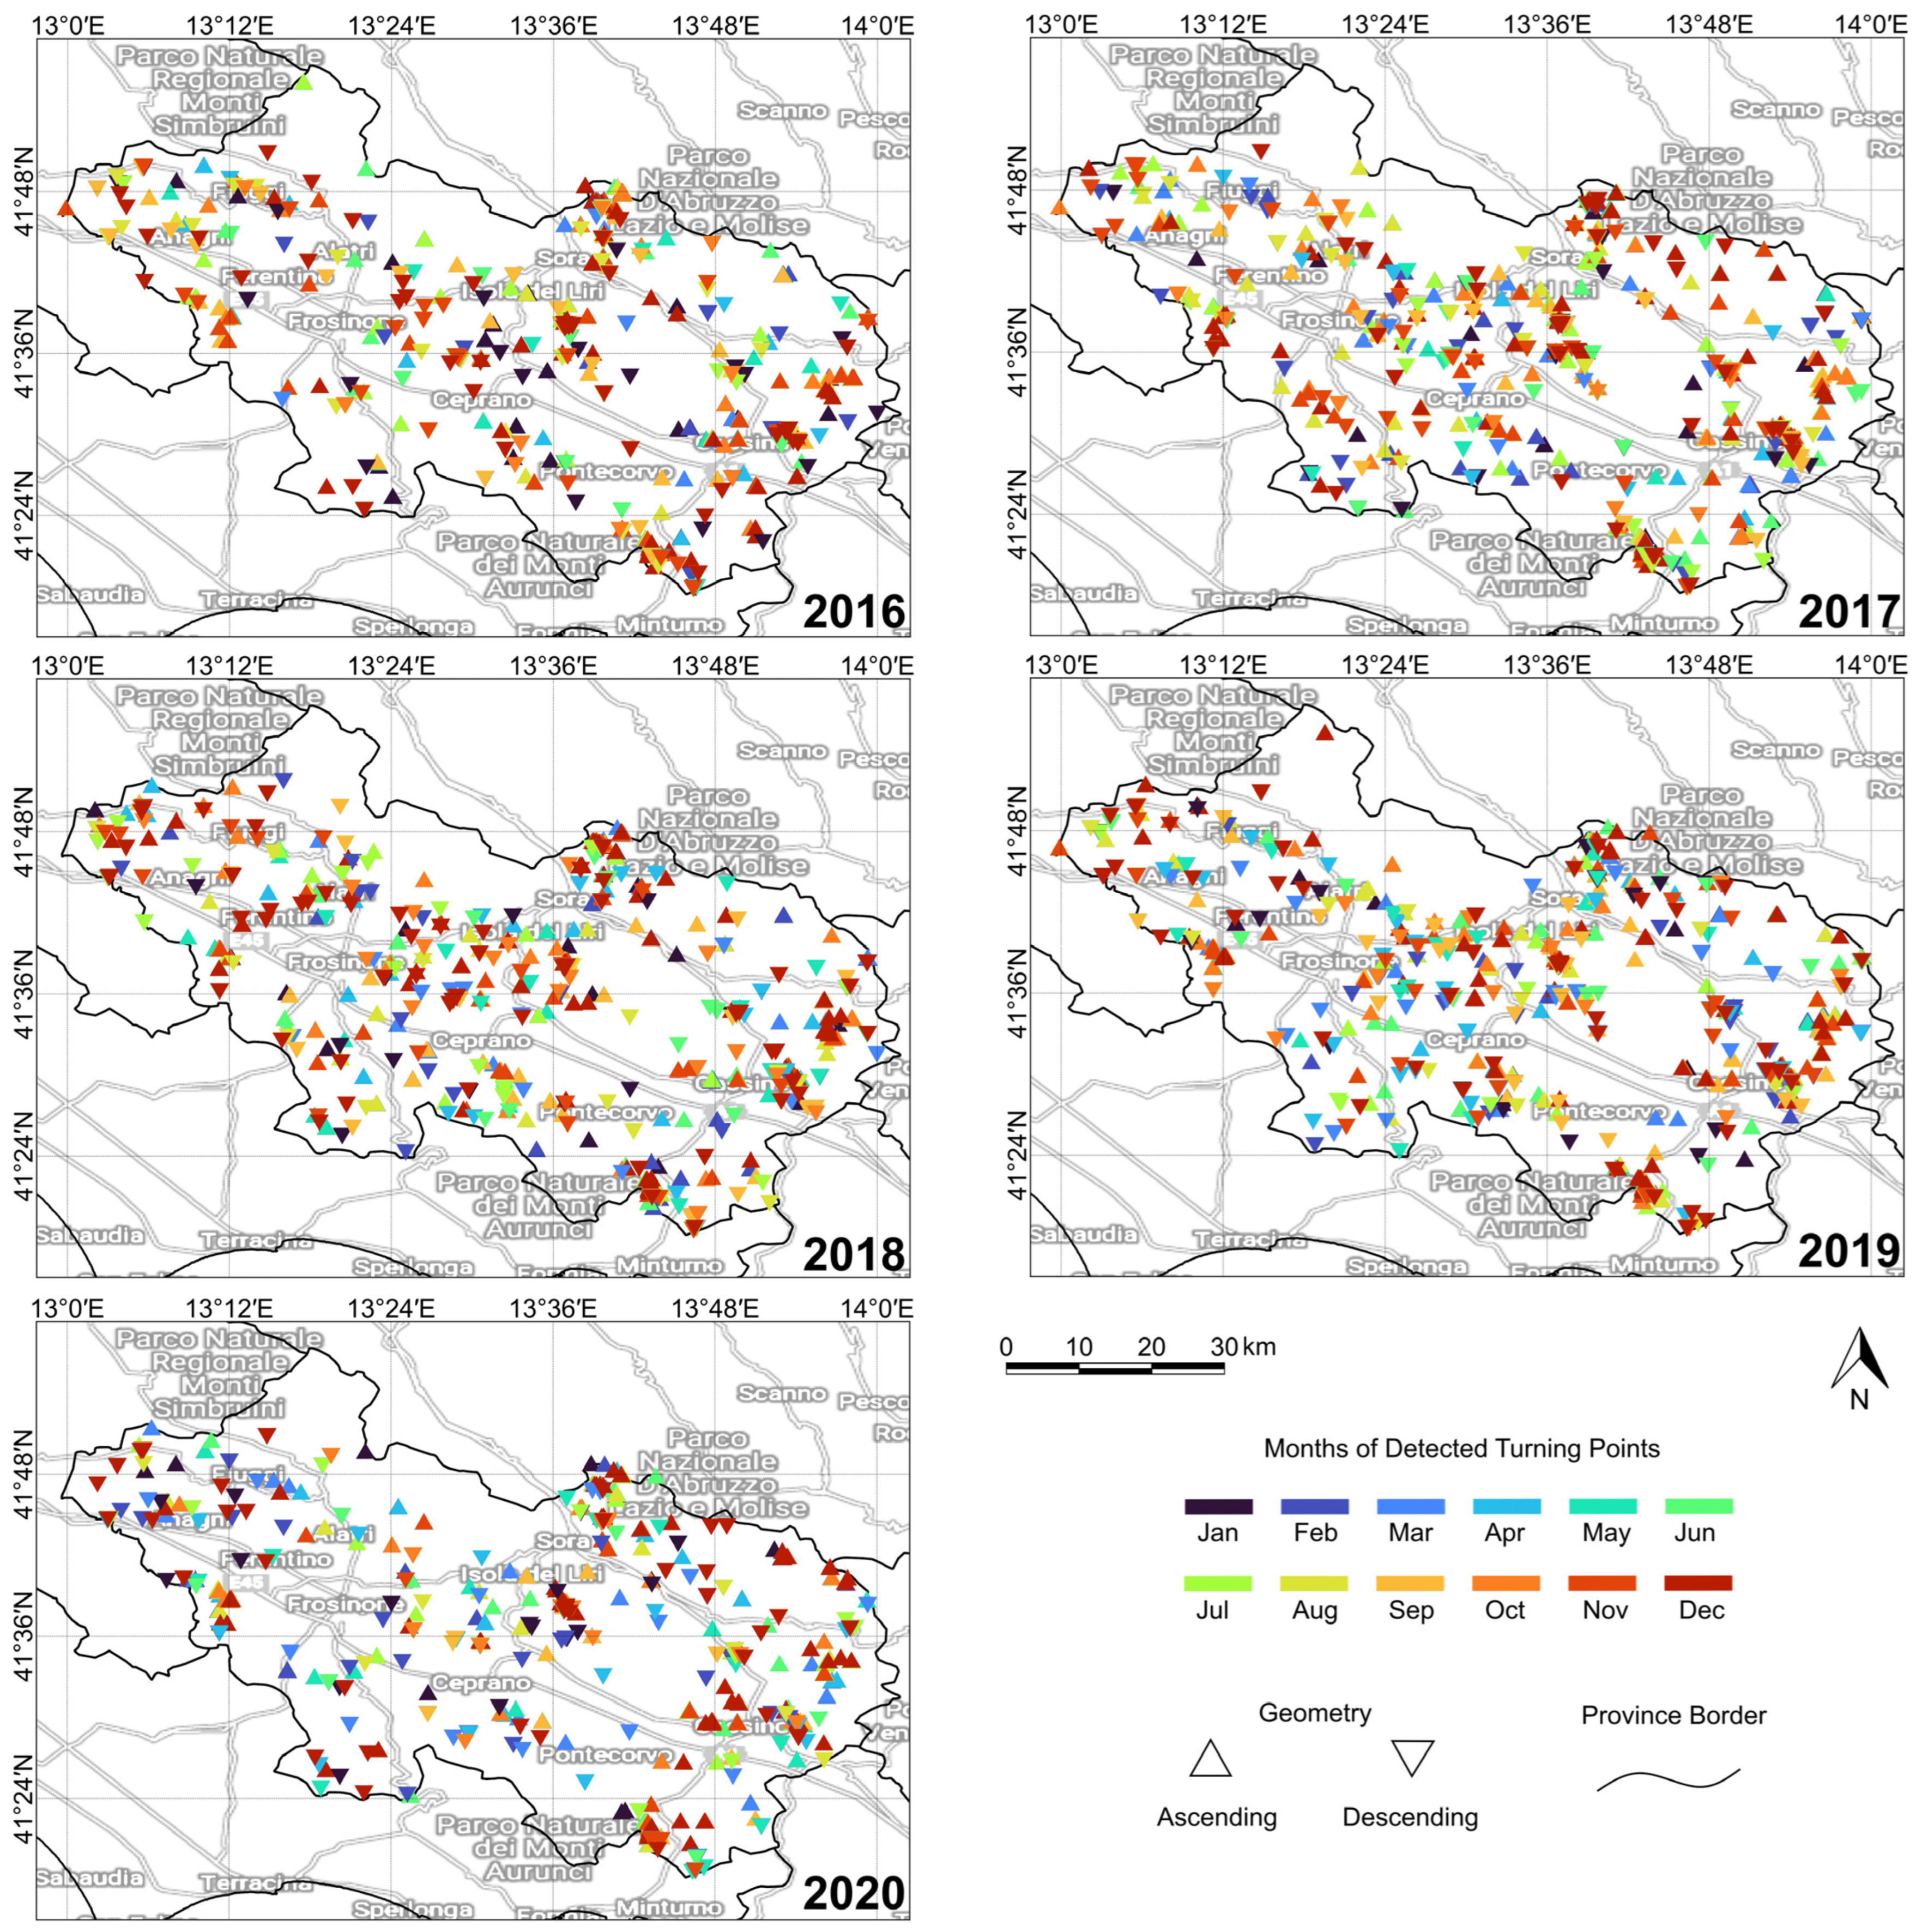
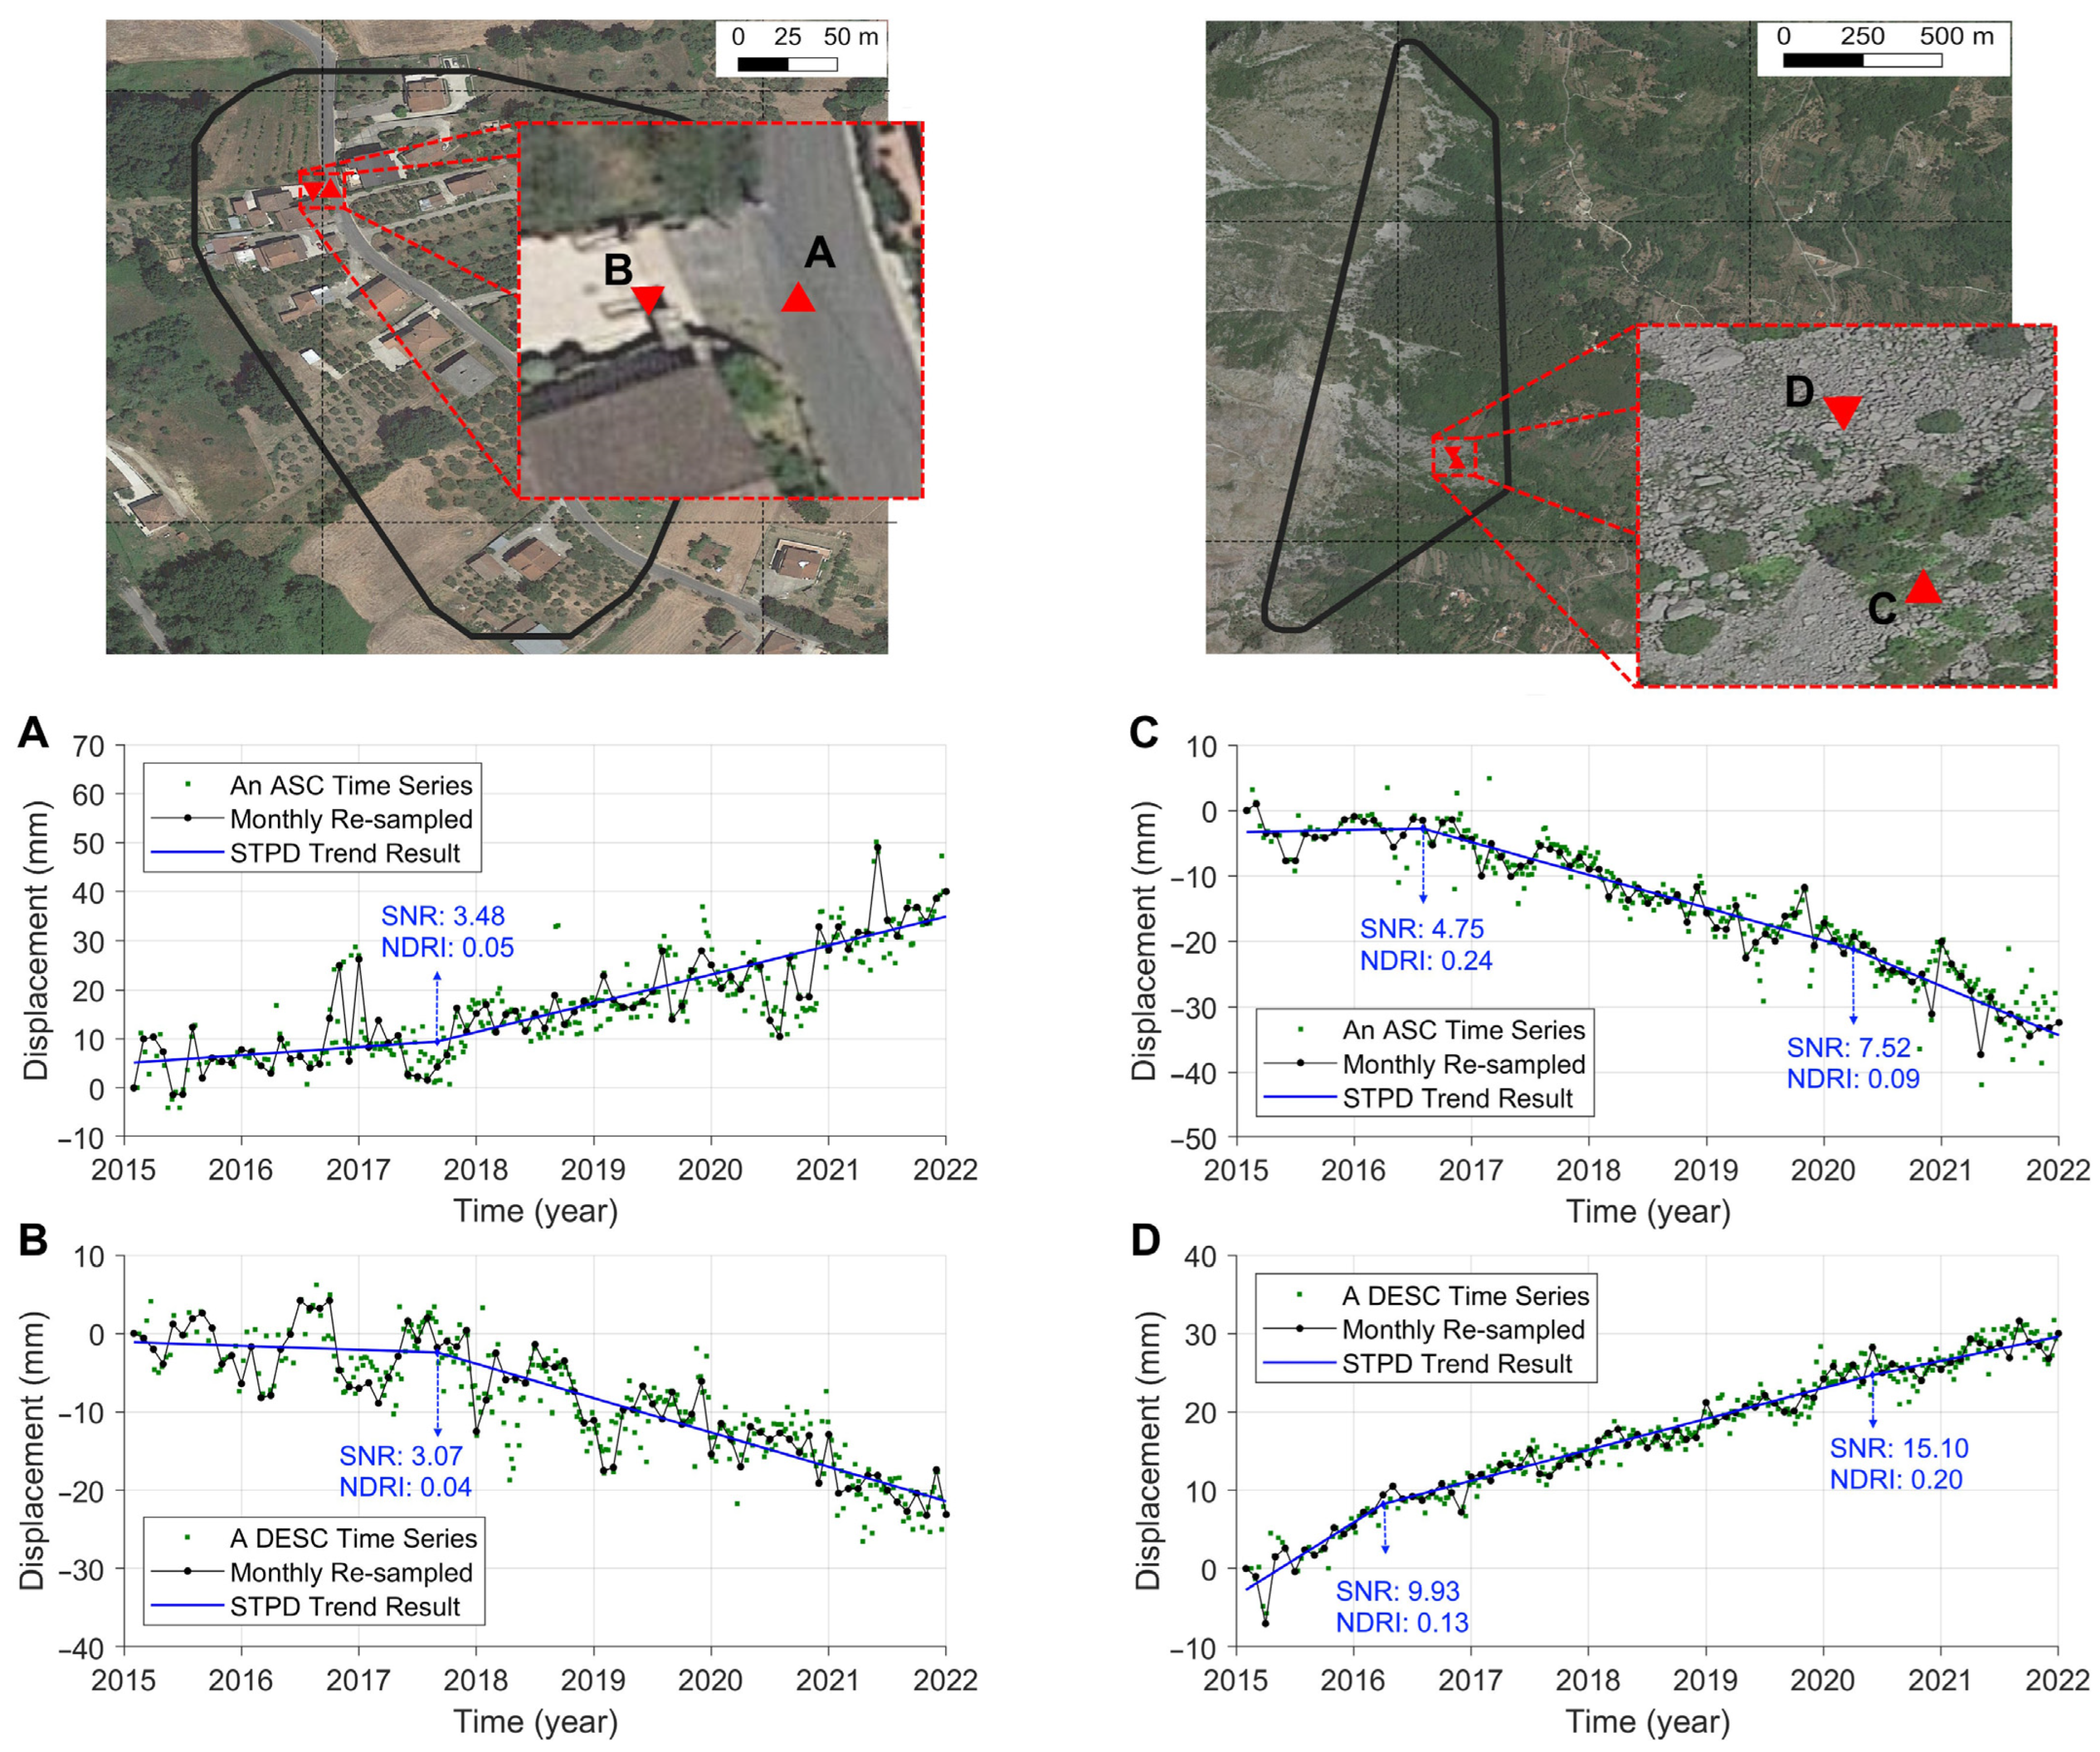
3.1. Spatiotemporal Maps of STPD Results

In this research, it is assumed that slow-moving landslides moved in the same down-slope direction during 2015–2021, i.e., the sign of LOS cannot change from positive to negative or vice versa [15]. Therefore, after performing STPD, only non-increasing and non-decreasing PS-InSAR time series are considered for ground deformation mappings. Table 2 lists the total number of time series within the landslide-prone polygons and the remaining time series after applying the thresholds. Using the same polygons described in [11], this study employs 20,290 ascending and 9605 descending PS-InSAR time series provided by EGMS, while in the authors’ previous work, 4656 ascending and 4020 descending PS-InSAR time series were employed (see Table 3 in [11]). Note that many of the new PS are located in different areas that have different land covers and characteristics with respect to [11].
Figure 2 illustrates the spatial maps of the estimated TPs in calendar months after applying all of the thresholds, i.e., only for non-increasing or non-decreasing time series with SNR > 1 and | NDRI |   < 0.3 . Years 2015 and 2021 are not considered, as their observations were the margins in STPD due to high sensitivity to seasonal and annual noise [11]. To understand better how STPD has estimated the linear trend with multiple connected pieces, two polygons are selected and a pair of ASC and DESC PS-InSAR time series (within 50 m apart) for each polygon is chosen (see the red diamonds in Figure 1b). These time series, along with their STPD results, are illustrated in Figure 3.

3.2. Classification of Turning Points and Precipitation Results

All of the TPs whose geographic locations are shown in Figure 2 and within 20 km from the blue circles displayed in Figure 1b are classified according to the CORINE land cover/use map illustrated in Figure 1c. The classified bar charts are depicted in Figure 4, showing that most of the TPs are in agricultural land areas for Cassino and Frosinone, in olive groves and bare rock areas for Sora, and in sparsely vegetated lands for Ausonia.
The accumulated precipitation time series for the four towns are analyzed by STPD using 3-year-long windows and their trend results are displayed in red in Figure 5. From comparing the values of S2 with S3 in panels (a)–(d) of Figure 5, the precipitation rate significantly increased toward the second half of 2017.

4. Discussion

This paper has presented the STPD results of PS-InSAR time series, provided by EGMS, within the same landslide-prone polygons as those in [11]. It can be seen from Figure 4 that all four towns, including their surroundings, and the entire AOI had a relatively higher number of TPs in August–September 2017, especially for Cassino and Frosinone. On the other hand, Figure 5 shows a much higher precipitation rate since the second half of 2017, indicating the potential role of extreme precipitation rate change in triggering landslides. These results also agree with those in [11,16], which demonstrate that extreme precipitation events followed by dry spells have a prominent role in triggering slow-moving landslides. Slow-moving landslides in soft bedrock areas usually occur on mild hillslopes where the land is exposed to water infiltration. As can be seen in Figure 4b, many of the TPs for areas covered by bare rocks were during winter, e.g., see bars in December 2017 when the region experienced heavy precipitation of more than 400 mm in that month. As Figure 4d shows, most of the TPs around Ausonia are sparsely vegetated. The top-right panel of Figure 3 shows an example of a sparsely vegetated area. The relatively higher precipitation observed during September–November 2016 could potentially be the cause of the TP in panel C in Figure 3, and the precipitation rate change from S4 to S5, shown in Figure 5d, likely affected the displacement rate in the area. However, note that this particular case, as shown in Figure 3C,D, may not represent the typical slow-moving landslide and it is, rather, a slope movement, which requires further investigation.

5. Conclusions

In this paper, the PS-InSAR time series of Sentinel-1 for both ascending and descending orbits within the landslide-prone polygons in the province of Frosinone, provided by EGMS, were analyzed by STPD. The spatial maps of TPs for the years 2016–2020 were produced, showing the calendar months when the displacement rate changed. The TPs were also classified according to CORINE land cover/use, and the numbers of TPs for the towns of Cassino, Sora, Frosinone, and Ausonia and their neighborhoods were correlated with the TPs detected for the local accumulated precipitation time series. The results showed a significant number of TPs in the second half of 2017 and the summer of 2018, likely due to relatively higher precipitation events followed by dry spells, which agreed with previous results found by the authors. The findings of this research can be useful for mitigating socioeconomic damage through repairing/renovating the affected areas, slope stabilization work, and other mitigation attempts in the face of climate change.

Author Contributions

Conceptualization, E.G., B.A., F.B., G.S.M. and P.M.; software, E.G., formal analysis, E.G.; writing—original draft preparation, E.G.; writing—review and editing, B.A., F.B., G.S.M. and P.M. All authors have read and agreed to the published version of the manuscript.

Funding

This study was carried out within the Spoke VS2 Ground Instabilities of the RETURN Extended Partnership and received funding from the European Union Next-Generation EU (National Recovery and Resilience Plan—NRRP, Mission 4, Component 2, Investment 1.3—D.D. 1243 2/8/2022, PE0000005).

Data Availability Statement

The STPD software implemented in this research is available online at https://github.com/Ghaderpour/LSWAVE-SignalProcessing. (accessed on 1 June 2024).

Acknowledgments

The authors acknowledge the scientists and personnel of the European Ground Motion Service (EGMS) for providing the PS-InSAR time series and 3Bmeteo s.r.l. for providing precipitation time series utilized in this research. The authors also thank the CERI research center at Sapienza University of Rome and European Union Next-GenerationEU for their support.

Conflicts of Interest

The authors declare no conflicts of interest.

References

  1. Bordoni, M.; Vivaldi, V.; Bonì, R.; Spanò, S.; Tararbra, M.; Lanteri, L.; Parnigoni, M.; Grossi, A.; Figini, S.; Meisina, C. A methodology for the analysis of continuous time-series of automatic inclinometers for slow-moving landslides monitoring in Piemonte region, northern Italy. Nat. Hazards 2023, 115, 1115–1142. [Google Scholar] [CrossRef]
  2. Lacroix, P.; Handwerger, A.; Bièvre, G. Life and death of slow-moving landslides. Nat. Rev. Earth Environ. 2020, 1, 404–419. [Google Scholar] [CrossRef]
  3. Nappo, N.; Peduto, D.; Mavrouli, O.; van Westen, C.J.; Gullà, G. Slow-moving landslides interacting with the road network: Analysis of damage using ancillary data, in situ surveys and multi-source monitoring data. Eng. Geol. 2019, 260, 105244. [Google Scholar] [CrossRef]
  4. Fiolleau, S.; Uhlemann, S.; Wielandt, S.; Dafflon, B. Understanding slow-moving landslide triggering processes using low-cost passive seismic and inclinometer monitoring. J. Appl. Geophys. 2023, 215, 105090. [Google Scholar] [CrossRef]
  5. Parenti, C.; Rossi, P.; Mancini, F.; Scorpio, V.; Grassi, F.; Ciccarese, G.; Lugli, F.; Soldati, M. Multitemporal Analysis of Slow-Moving Landslides and Channel Dynamics through Integrated Remote Sensing and In Situ Techniques. Remote Sens. 2023, 15, 3563. [Google Scholar] [CrossRef]
  6. Whiteley, J.S.; Chambers, J.E.; Uhlemann, S.; Wilkinson, P.B.; Kendall, J.M. Geophysical monitoring of moisture-induced landslides: A review. Rev. Geophys. 2019, 57, 106–145. [Google Scholar] [CrossRef]
  7. Cosentino, A.; Marmoni, G.M.; Fiorucci, M.; Mazzanti, P.; Scarascia Mugnozza, G.; Esposito, C. Optical and Thermal Image Processing for Monitoring Rainfall Triggered Shallow Landslides: Insights from Analogue Laboratory Experiments. Remote Sens. 2023, 15, 5577. [Google Scholar] [CrossRef]
  8. Crosetto, M.; Monserrat, O.; Cuevas-González, M.; Devanthéry, N.; Crippa, B. Persistent scatterer interferometry: A review. ISPRS J. Photogramm. Remote Sens. 2016, 115, 78–89. [Google Scholar] [CrossRef]
  9. Ghaderpour, E.; Masciulli, C.; Zocchi, M.; Marini, R.; Mastrantoni, G.; Reame, F.; Pantozzi, G.; Belcecchi, N.; Scarascia Mugnozza, G.; Mazzanti, P. Least-Squares Wavelet Analysis of Rainfalls and Landslide Displacement Time Series Derived by PS-InSAR. In Theory and Applications of Time Series Analysis; Valenzuela, O., Rojas, F., Herrera, L.J., Pomares, H., Rojas, I., Eds.; ITISE 2022; Contributions to Statistics; Springer: Cham, Switzerland, 2022. [Google Scholar] [CrossRef]
  10. Balbi, E.; Terrone, M.; Faccini, F.; Scafidi, D.; Barani, S.; Tosi, S.; Crispini, L.; Cianfarra, P.; Poggi, F.; Ferretti, G. Persistent Scatterer Interferometry and Statistical Analysis of Time-Series for Landslide Monitoring: Application to Santo Stefano d’Aveto (Liguria, NW Italy). Remote Sens. 2021, 13, 3348. [Google Scholar] [CrossRef]
  11. Ghaderpour, E.; Antonielli, B.; Bozzano, F.; Scarascia Mugnozza, G.; Mazzanti, P. A Fast and Robust Method for Detecting Trend Turning Points in InSAR Displacement Time Series. Comput. Geosci. 2024, 185, 105546. [Google Scholar] [CrossRef]
  12. Ghaderpour, E.; Pagiatakis, S.D.; Hassan, Q.K. A Survey on Change Detection and Time Series Analysis with Applications. Appl. Sci. 2021, 11, 6141. [Google Scholar] [CrossRef]
  13. Ghaderpour, E.; Dadkhah, H.; Dabiri, H.; Bozzano, F.; Scarascia Mugnozza, G.; Mazzanti, P. Precipitation Time Series Analysis and Forecasting for Italian Regions. Eng. Proc. 2023, 39, 23. [Google Scholar] [CrossRef]
  14. Massimo, A.; Dell’Isola, M.; Frattolillo, A.; Ficco, G. Development of a Geographical Information System (GIS) for the Integration of Solar Energy in the Energy Planning of a Wide Area. Sustainability 2014, 6, 5730–5744. [Google Scholar] [CrossRef]
  15. Urgilez Vinueza, A.; Handwerger, A.; Bakker, M.; Bogaard, T. A new method to detect changes in displacement rates of slow-moving landslides using InSAR time series. Landslides 2022, 19, 2233–2247. [Google Scholar] [CrossRef]
  16. Tichavský, R.; Ballesteros-Cánovas, J.A.; Šilhán, K.; Tolasz, R.; Stoffel, M. Dry spells and extreme precipitation are the main trigger of landslides in Central Europe. Sci. Rep. 2019, 9, 14560. [Google Scholar] [CrossRef] [PubMed]
Figure 1. The study region. (a) A map of Italy showing the study region in red, (b) a Google map of province of Frosinone, and (c) the CORINE land cover/use map of the study region (100 m).
Engproc 68 00012 g001
Figure 2. Spatiotemporal maps of STPD results for both ascending and descending PS-InSAR time series of EGMS.
Engproc 68 00012 g002
Figure 3. The STPD trend results of two pairs of PS-InSAR time series whose TPs in calendar month (see blue arrows) are shown in Figure 2.
Engproc 68 00012 g003
Figure 4. The bar charts of TPs whose locations are within 20 km of the towns of Cassino (a), Sora (b), Frosinone (c), and Ausonia (d), classified based on the CORINE land use/cover map. Panel (e) shows the bar chart of TPs for all polygons susceptible to landslides.
Engproc 68 00012 g004
Figure 5. Monthly precipitation bar charts and their accumulated precipitation time series with STPD linear trend results for Cassino (a), Sora (b), Frosinone (c), and Ausonia (d).
Engproc 68 00012 g005
Table 1. The description of datasets used in this research.
DatasetSpatial ResolutionDateDescription Source
PS-InSAR20 m in azimuth by 5 m in ground-range 2015–2021
(6-day)
Ascending and descending PS-InSAR time series for period 02/2015–12/2021https://egms.land.copernicus.eu/ (EGMS) (accessed on 1 May 2024)
Land cover/use100 m2018CORINE (Coordination of Information on the Environment) has 44 classeshttps://land.copernicus.eu/paneuropean/corine-land-cover (accessed on 1 May 2024)
Precipitation4 weather stations2015–2021 (monthly)Time Series for Cassino, Sora, Frosinone, and Ausoniahttps://www.3bmeteo.com (accessed on 1 May 2024)
Table 2. Description of ascending and descending PS-InSAR time series. The THDs are the thresholds SNR > 1 and NDRI < 0.3 .
GeometryNumber of
Landslide-Prone
Polygons
Number of
PS
Number of
PS with TPs
Number of
TS with TPs
after THDs
Number of
Non-Decreasing
or Non-Increasing PS
with TPs after THDs
Ascending64120,29016,707 (82%)12,386 (61%)3560 (18%)
Descending70496057775 (81%)5836 (61%)2045 (21%)
Disclaimer/Publisher’s Note: The statements, opinions and data contained in all publications are solely those of the individual author(s) and contributor(s) and not of MDPI and/or the editor(s). MDPI and/or the editor(s) disclaim responsibility for any injury to people or property resulting from any ideas, methods, instructions or products referred to in the content.

