Abstract
This study developed more realistic stochastic models of pipe failures that incorporate leak types and dimensions based on different pipe materials. The distributions of pipe failure types and properties were identified by analysing photographic records of failed pipes in Auckland, New Zealand. A stochastic model generated leaks in a typical DMA consisting of different pipe materials to different Infrastructure Leakage Index (ILI) levels. After analysing 100 networks for each scenario, the study observed that different pipe materials had distinct leakage exponent distributions. This study provides a tool for better understanding leakage behaviour in different pipe materials and evaluating methods for better water loss management.
1. Introduction
Access to potable water is essential for both human and economic well-being. However, this critical resource is under threat due to the global ageing of water infrastructure, increasing the problem of pipe failures.
Reducing both leakage and disruption caused by failure necessitates a strategic approach, with District Metered Areas (DMAs) recommended to facilitate effective monitoring and informed maintenance decisions. The Infrastructure Leakage Index (ILI) is an internationally accepted benchmark that gives the current annual leakage in a DMA as a ratio of its unavoidable annual real losses from leakage and can be used to monitor the relative performance of different DMAs over time.
Leakage modelling tools, such as the orifice equation and the FAVADs (Fixed and Variable Area Discharges) or modified orifice equation, are critical for understanding the behaviour of individual leaks in water networks [1]. The FAVAD equation implies that leakage areas have a linear relationship with pressure, and subsequent experimental and modelling investigations have validated this assumption. In 2014, the stochastic model investigated individual leaks throughout a typical DMA, employing the FAVAD equation to predict leakage rates [2]. However, their findings do not reflect the full variety of pipe materials and leak patterns encountered in practise. Beygi and Van Zyl [3] analysed the types and diameters of leaks in different pipe materials using photographic records of failed pipes in Auckland, New Zealand. They then proposed a stochastic model for these physical characteristics.
The aim of this study was to expand Schwaller and van Zyl’s work by integrating the material-specific stochastic leak properties into the model. The study generated 100 stochastic network models for each scenario to investigate different pipe materials and ILIs.
2. Methodology
The study stochastically generated leaks in a typical DMA, adjusting the leakage parameters for different pipe materials and generating background leaks and failures for a range of ILI levels.
The study assumed that leakage flow rates were in the background (unreported) and therefore small compared to the network capacity, allowing head losses through leaks to be ignored and allowing static pressures to be used. The overall leakage rate was calculated by adding the individual leak flow rates for each ILI level.
3. Results
The resulting distributions of the N1 leakage exponent and the number of leaks to reach different ILI levels in a typical DMA consisting of different pipe materials are shown in Figure 1.
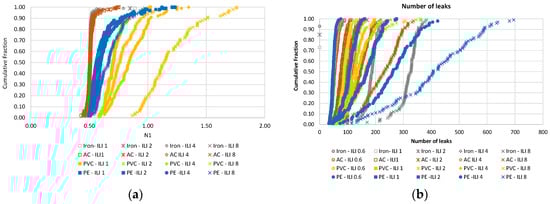
Figure 1.
Cumulative distribution of (a) leakage exponents and (b) number of leaks in a typical DMA: variation across different pipe materials and ILIs.
The results show that iron and Asbestos Cement (AC) pipes have the most stable leakage exponent distributions, with most exponents close to 0.5. In contrast, polyvinyl chloride (PVC) pipes exhibit high leakage exponent variability and polyethene (PE) pipes show variable leakage exponent distributions between PVC and iron/AC pipes.
Figure 1b reveals that, across ILI levels 1 and 2, iron pipes have the highest number of leaks, while PE pipes exhibit a greater frequency of leaks at higher ILI levels. This result shows that the presumed durability of iron could be weakened by ongoing degradation of the system.
The study also explored the efficacy of the FAVAD equation in outlining the pressure leakage response in water distribution systems. The relationship between leakage numbers and N1 is explored in [4] and it is established that N1 is equal to one when the leakage number is one. In the mentioned study, a dimensionless leakage number was defined to represent the flow ratio through the expanded leak area to the initial leak area. The concept can also be applied to a network to obtain the system leakage number (LN).
Furthermore, this paper conducted a sensitivity analysis on a developed model, establishing the relationship of the leakage number (LN) by defining low- and high-value scenarios for all parameters concerning the physical characteristics of various failures. Through this analysis, the study aimed to better understand the dynamics and implications of different failure scenarios on the system’s leakage behaviour. Figure 2 shows a significant relationship between the LNs and N1s across the sensitivity analysis of different parameters in PVC pipe.

Figure 2.
Sensitivity analysis of the relationship between the system leakage number LNs and N1s in PVC pipe.
4. Conclusions
The findings of this study provide insight into leakage dynamics, including leak types and dimensions across various pipe materials and enhances the potential for developing effective leakage management strategies at a DMA.
Author Contributions
Conceptualization, S.B.; methodology, software, validation, formal analysis, investigation, resources, data curation, writing—original draft preparation, J.E.v.Z. and B.H.; writing—review and editing, visualization, supervision, project administration, S.B.; funding acquisition. All authors have read and agreed to the published version of the manuscript.
Funding
This research was funded by the Faculty of Engineering at the University of Auckland.
Institutional Review Board Statement
Not applicable.
Informed Consent Statement
Not applicable.
Data Availability Statement
Collected failure data that support the findings of this study are available from the corresponding author upon reasonable request.
Acknowledgments
Special thanks to Watercare Services Limited for providing the essential database of pipe failures in Auckland, as this was a vital resource for our study.
Conflicts of Interest
The authors declare no conflicts of interest.
References
- May, J. Pressure dependent leakage. World Water Environ. Eng. 1994, 17, 10. [Google Scholar]
- Schwaller, J.; van Zyl, J.E. Implications of the known pressure-response of individual leaks for whole distribution systems. Procedia Eng. 2014, 70, 1513–1517. [Google Scholar]
- Beygi, S.; van Zyl, J.E. Pilot study on the characteristics of different failure types in water distribution system pipes. J. Pipeline Syst. Eng. Pract. 2024, 15, 04024027. [Google Scholar]
- Schwaller, J.; van Zyl, J.E.; Kabasha, A.M. Characterising the pressure-leakage response of pipe networks using the FAVAD equation. Water Sci. Technol. Water Supply 2015, 15, 1373–1382. [Google Scholar]
Disclaimer/Publisher’s Note: The statements, opinions and data contained in all publications are solely those of the individual author(s) and contributor(s) and not of MDPI and/or the editor(s). MDPI and/or the editor(s) disclaim responsibility for any injury to people or property resulting from any ideas, methods, instructions or products referred to in the content. |
© 2024 by the authors. Licensee MDPI, Basel, Switzerland. This article is an open access article distributed under the terms and conditions of the Creative Commons Attribution (CC BY) license (https://creativecommons.org/licenses/by/4.0/).