Abstract
This work explores the various relationships between several parameters in an incident hub of a small real WDN. To facilitate analysis, incident data were previously categorised depending on the nature of the cause of the incident. The data are analysed through spatial analysis, based on the transmission of information from the surrounding areas, and are also incorporated to add certain uncertainty to the information. The results of this characterisation are presented and analysed in this contribution. The results are promising in providing water distribution networks with key parameters that promote prediction and classification processes from the lessons learned.
1. Introduction
Water distribution networks (WDNs) need to be prepared both to face different challenges and to avoid disruptions or reduce their potential negative impacts. Water utilities are currently focusing on increasing their systems’ preparedness, as this is seen as a powerful tool that can help them deal with challenges [1]. The preparedness of a system has normally been considered in the context of emergencies. However, preventable disruptive events (e.g., water burst/leakage) can cause situations that can increase possible negative effects on the network [2]. This work focuses on increasing the system’s ability to learn (i.e., learning capacity [3]) based on the experience acquired by previous anomalous events (i.e., disruptive events) that have occurred in the system. Disruptive events that have occurred (lessons learned) in the network provide the system information not only on how to face events with similar characteristics but also on how to face new potential challenges [4].
This work explores the various relationships between several parameters in an incident hub (specifically a water loss event) in a small real WDN. The incident hub consists of two and half years of the collection of both the categorical (expert opinion in relation to the causes of event) and numerical (management times, e.g., awareness time, isolation, and repair time; and flow and pressure sensor data) evidence that allows a proper registration and easy access to information. To facilitate analysis, incident data were previously categorised depending on the nature of the cause of the incident. This paper explores the potential causal relationships of incidents with the parameters and characteristics of the system (measurable or estimable data) through the use of intelligent data analysis with the objective of extracting features that allow the characterisation of the disruptive events. In this sense, the main objective of this paper is to provide water distribution networks with a methodology to extract key parameters that promote prediction and classification processes from the lessons learned. This results in an increase in system resilience derived from the increase obtained in the network’s preparedness to deal with such potential events [5], promoting the sustainability of the system in terms of both the preservation of resources and the mitigation of impacts due to incidents that occur in the system.
2. Materials and Methods
The incident data collected in the incident hub correspond to an evaluation period of two and half years (July 2021 to Jan 2024) of a small network located in Spain. The information was captured through continuous interviews. In total, during the evaluation period, a total of 135 incidents were reported, with 110 associated with incidents of water leaks. Apart from the numerical data provided (e.g., sensors), categorical information was also captured based on the operator’s experience, such as the potential causes of the incident. In the categorization of the incidents, 11 categories are used herein, as in [6]: (IC1) settlement; (IC2) asset fissure/crack; (IC3) tree roots; (IC4) pressure inference; (IC5) age/corrosion; (IC6) pipe/junction defects; (IC7) exposed components; (IC8) maintenance activity; (IC9) weather conditions/component frozen; (IC10) additional consumption; and (IC11) others.
Data from incidents associated with leaks were entered into an EPANET model to capture the spatial location provided by the operator. The model was used to obtain the pressures of the network nodes. These pressures from the model were clustered into ranges based on the histograms of the pressures expected to be delivered at the leak sites (expert opinion). This is because both the simulated pressures and the expected pressures at the leak points showed a marked similarity, obtaining their peaks at pressures between 50 and 70 water column meters, respectively. The pressure distribution was counted per node, and in this way both the cluster (namely as pressure-based cluster data) in which a particular node spends the most time and the percentage of time spent in that cluster are associated (namely as percentage of time spent). The number of times that the same component was affected by a leak event in the evaluation period will be called, in this paper, as the frequency of occurrence.
Sparse data from the pressure-based cluster, percentage of time spent, and frequency of occurrence were used to obtain homogeneous spatial maps. These maps were migrated using the process proposed by [6] and their results were analysed.
3. Analysis and Results
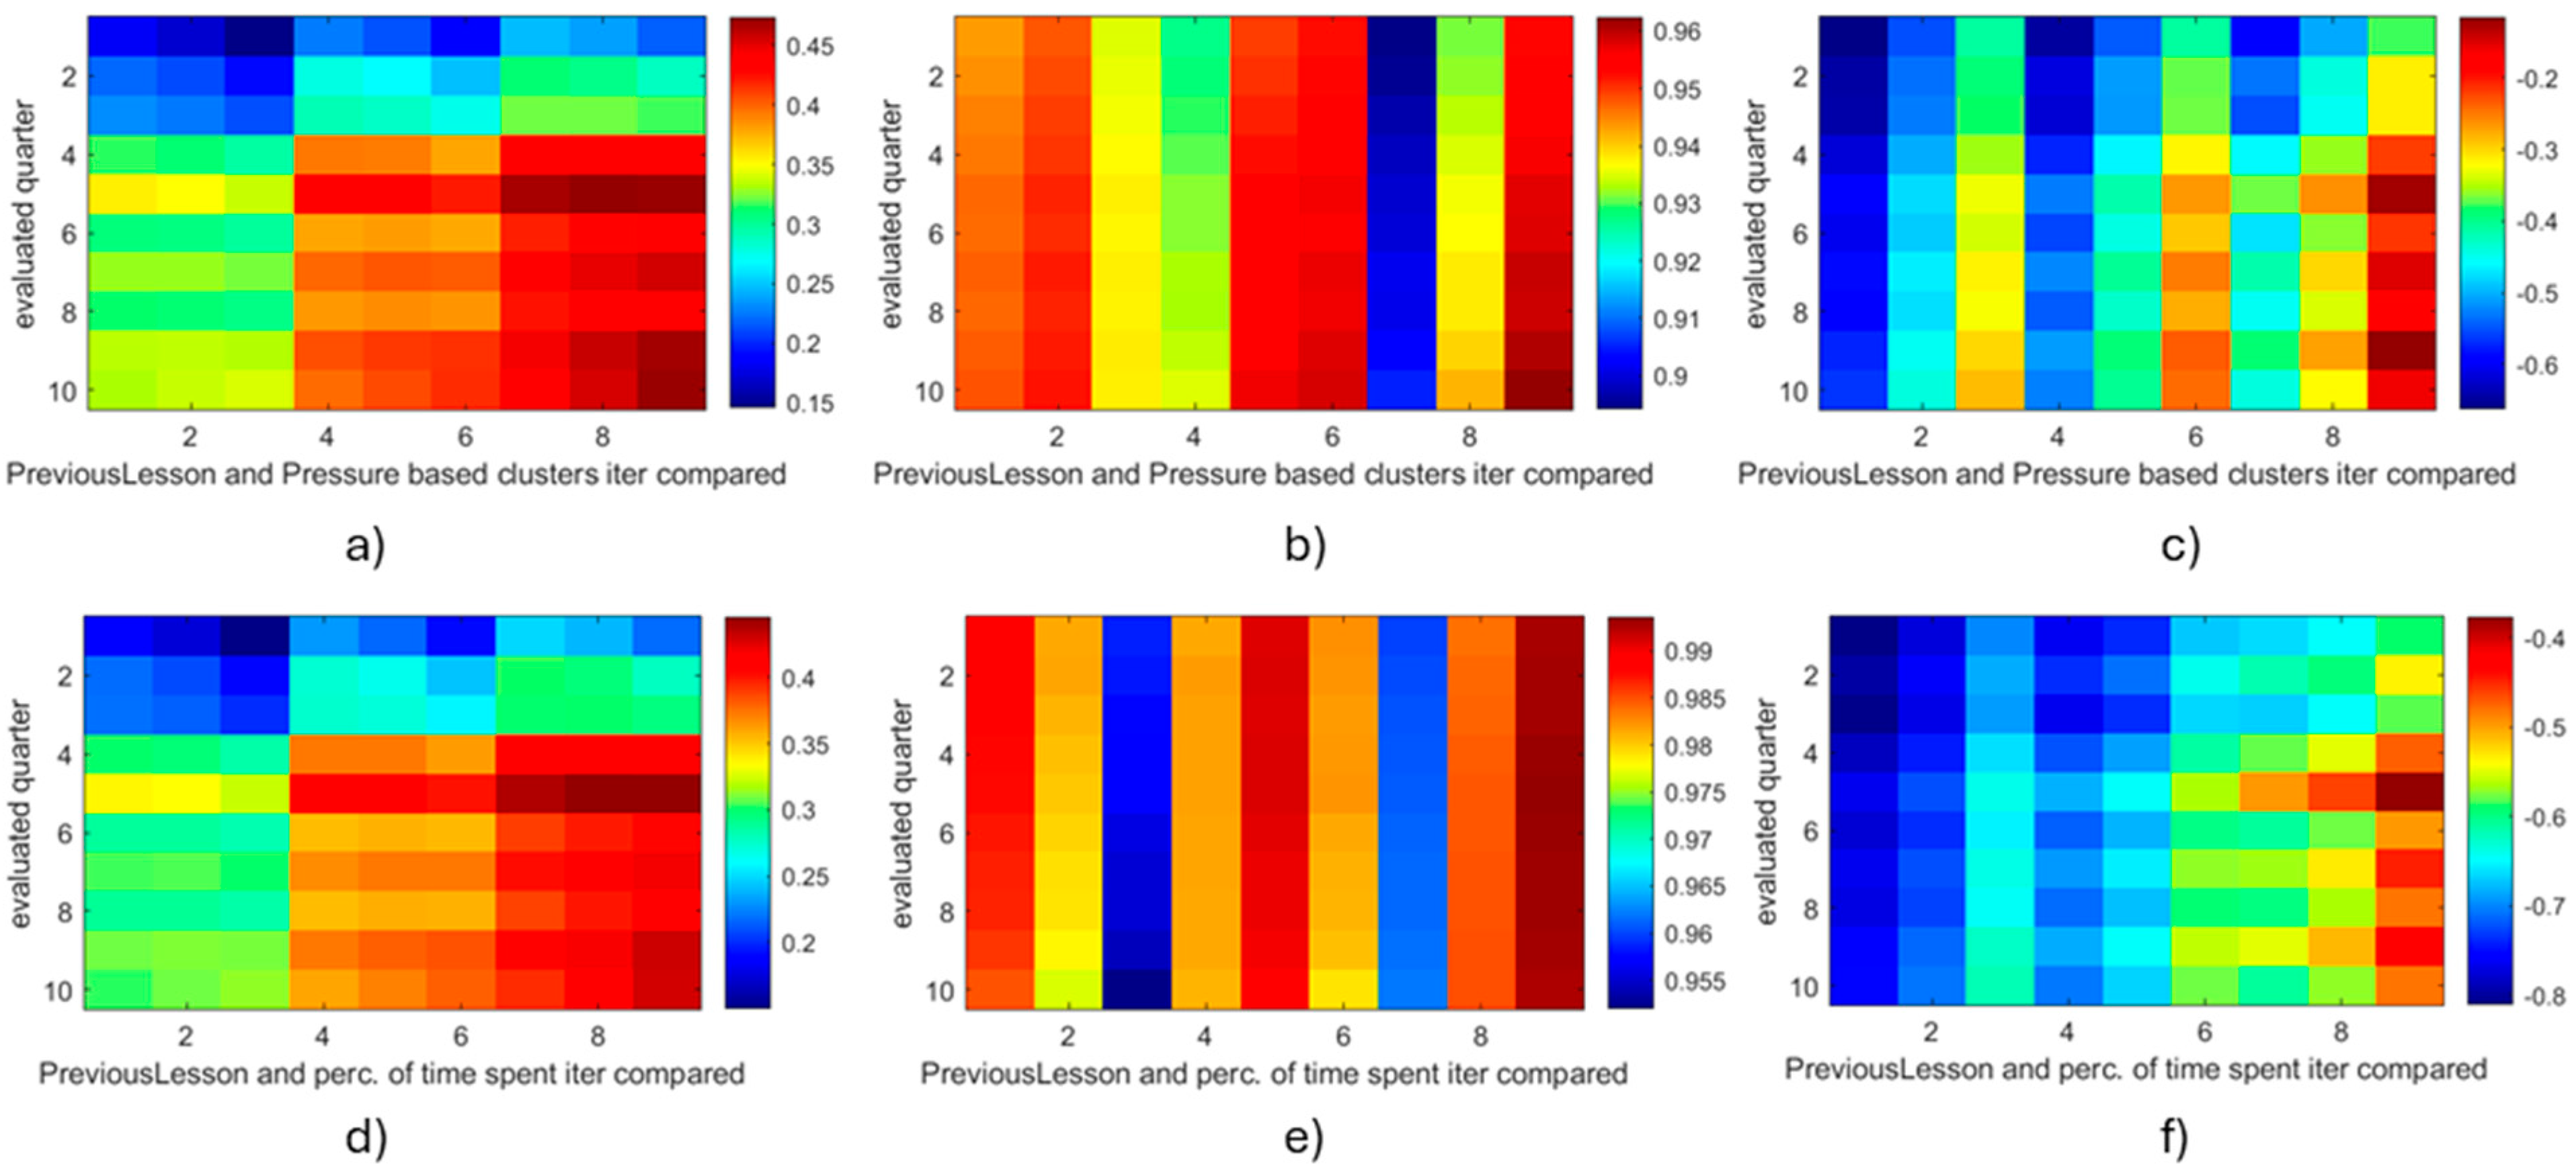
Figure 1 presents the results of the migration under the three approaches to-max, to-min, and to-both. A total of 10 quarters of the period obtained were evaluated and are represented in chronological order in the matrices of Figure 1 (in the rows). The columns of the obtained matrices correspond to the comparison of the pairwise (previous lessons and potential cause) according to the number of iterations conducted in the migration process; column: (1) (iter. 50, iter. 50), (2) (iter. 50, iter. 142), (3) (iter. 50, iter. 308), (4) (iter. 142, iter. 50), (5) (iter. 142, iter. 142), (6) (iter. 142, iter. 308), (7) (iter. 308, iter. 50), (8) (iter. 308, iter. 142), and (9) (iter. 308, iter. 308).

Figure 1.
Correlation coefficients for previous lessons and measurable/estimable parameters per quarter. Previous lessons and pressure-based clusters (a–c), and percentage of time spent in a specific cluster (d–f). (a,d) to-max, (b,e) to-min, and (c,f) to-both analysis.
In Figure 1, per the corresponding matrices, it can be seen that both the pressure and the time spent in a specific pressure range contribute to the leaks recorded per evaluated period. The matrices obtained with the to-max approach (Figure 1a,d) show the specific contribution for each period of the evaluated cause. The matrices obtained with the to-min approach (Figure 1b,e) show the specific contribution for each period in the surrounding area of the evaluated cause. The matrices obtained with the to-both approach (Figure 1c,f) show the combination of both evaluated factors. In all of them, it can be observed that the variation in the frequency of occurrence of leaks is completely registered in the different matrices from which the correlation coefficients are obtained. An example from previous lessons of cumulative leak occurrence frequency in specific pipes is presented in Figure 2.
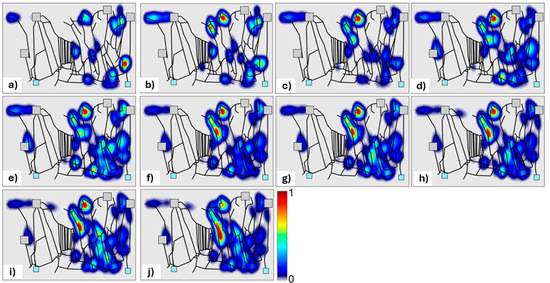
Figure 2.
Frequencies of water leak occurrences in each specific pipe per 10 quarters of time explored. to-max analysis, 50 iterations. (a–j) Quarters from quarters 1–10, respectively.
Figure 2 shows the result of the migration process for 50 iterations. The figure corresponds to the normalization of the migrated matrix by incorporating the data from the current quarter into the data accumulated from the 1st quarter. In Figure 2, you can see the tendency for leaks to concentrate as the quarters pass, which can serve as a basis for training a prediction system. This figure explains what a desirable output would be after potentially combining the different factors and exploring their potential contributions to the leak event.
4. Conclusions
This paper has presented a methodology for knowledge extraction based on the comparison of known events with measurable/estimable parameters of the system. With the aim to introduce a certain level of uncertainty in the data, the migration method proposed by [6] has been used with three approaches (to-max, to-min, and to-both). The comparisons of the matrices generated (after migration) showed that the matrices capture the contribution of the evaluated parameters with the observed events. The results obtained are promising in order to generate, based on these matrices, a prediction model or suggestion of areas of the network that require special attention in order to prevent leak events. Additionally, it should be mentioned that the proposal presented can be fed with attributes of a different nature (both numerical and categorical) and can be constantly updated.
Author Contributions
All the authors have equally contributed to this article. All authors have read and agreed to the published version of the manuscript.
Funding
This research received no external funding.
Institutional Review Board Statement
Not applicable.
Informed Consent Statement
Not applicable.
Data Availability Statement
Data are contained within the article.
Acknowledgments
This work has been developed under the support of the University College Dublin Ad Astra Start Up grant to the first and fourth authors.
Conflicts of Interest
The authors declare no conflicts of interest and no any commercial conflict of interest from Aqlara Ciclo Integral del Agua S.A. and VITENS N.V.
References
- Karamouz, M.; Yousefi, A.; Zahmatkesh, Z.; Mahmoodzadeh, D.; Pirooz, M.D. Simulation of chlorine injection in water distribution networks in response to contaminations. Int. J. Environ. Res. 2022, 16, 1–17. [Google Scholar] [CrossRef]
- Koop, S.H.A.; van Leeuwen, C.J. The challenges of water, waste and climate change in cities. Environ. Dev. Sustain. 2017, 19, 385–418. [Google Scholar] [CrossRef]
- Lawson, E.; Bunney, S.; Cotterill, S.; Farmani, R.; Melville-Shreeve, P.; Butler, D. COVID-19 and the UK water sector: Exploring organizational responses through a resilience framework. Water Environ. J. 2022, 36, 161–171. [Google Scholar] [CrossRef] [PubMed]
- Savić, D. Digital Water Developments and Lessons Learned from Automation in the Car and Aircraft Industries. Engineering 2022, 9, 35–41. [Google Scholar] [CrossRef]
- Ayala-Cabrera, D.; Piller, O.; Deuerlein, J.; Herrera, M. Key performance indicators to enhance water distribution network resilience in three-stages. Water Util. J. 2018, 19, 79–90. [Google Scholar]
- Ayala-Cabrera, D.; Francés-Chust, J.; Hoseini-Ghafari, S.; Stanton, G.; Izquierdo, J. Water distribution network disruptive events. Generation and exploration of an incident Hub to increase the network preparedness. In Proceedings of the 2nd WDSA/CCWI, Valencia, Spain, 18 July 2022. [Google Scholar]

Disclaimer/Publisher’s Note: The statements, opinions and data contained in all publications are solely those of the individual author(s) and contributor(s) and not of MDPI and/or the editor(s). MDPI and/or the editor(s) disclaim responsibility for any injury to people or property resulting from any ideas, methods, instructions or products referred to in the content. |
© 2024 by the authors. Licensee MDPI, Basel, Switzerland. This article is an open access article distributed under the terms and conditions of the Creative Commons Attribution (CC BY) license (https://creativecommons.org/licenses/by/4.0/).