Proceeding Paper

Forecasting Electric Vehicle Adaption Using System Dynamics: A Case Study of Regina, Saskatchewan †

1
Industrial Systems Engineering, University of Regina, Regina, SK S4S 0A2, Canada
2
Engineering Management, Arkansas State University, Jonesboro, AR 72467, USA
*
Author to whom correspondence should be addressed.
Presented at the 1st International Conference on Industrial, Manufacturing, and Process Engineering (ICIMP-2024), Regina, Canada, 27–29 June 2024.
Eng. Proc. 2024, 76(1), 27; https://doi.org/10.3390/engproc2024076027
Published: 18 October 2024

Abstract

:
The Zero Emission Vehicle (ZEV) mandate by Canada’s federal government is a significant initiative towards achieving net zero emissions by 2050. In this context, to quantify the evolution scale of ZEVs alongside charging pile, a system dynamics (SD)-based policy simulation has been adopted for the city of Regina, Saskatchewan. The vector autoregressive model (VAR) equation is used as an input equation in the SD model for predicting ZEV sales. For model validity, calibration of the data with an available historical dataset alongside a sensitivity analysis has been performed. The SD model with two consecutive scenarios has been simulated until 2036, and “policy 2” has been found to be adequate.

1. Introduction

Canada’s aspiring target to reduce 310 megaton (Mt) CO2 eq. (40–45% of 2005 emission levels) of national greenhouse gas emissions by 2030 requires extensive control measures for both the building energy sector and transportation sector. The transportation sector of Canada is solely responsible for 22% of the total greenhouse gas (GHG) emissions, where around 51% of it is from light-duty vehicles, including passenger cars, SUVs, light trucks, etc. [1]. The emissions for Saskatchewan during 2022 have decreased to −4.6 Mt or 5.8% from the 2005 level due to emission reduction measures in the oil and gas industry. The country has set an ambitious legislation under the name of “Regulations Amending the Passenger Automobile and Light Truck Greenhouse Gas Emission Regulations” to enact a 20% share of (battery electric vehicles) BEVs among all vehicles sales by 2026, which will gradually be 100% by 2030 for light-duty vehicles [2].
Canada has a regulation in place to familiarize ZEVs, which is identical to those of California and other US states [1], as it is giving full credit to plug-in-hybrids (PHEVs), depending on the electric-only range of these cars. The United States Environmental protection agency (USEPA) has proposed new legislations based on the integrated-circular effect to offer incentives through the Inflation Reduction Act, which will eventually transit the US market, with 60% of new vehicles being ZEVs by 2030 [3]. However, for Canada and especially for Regina, Saskatchewan, additional spatial factors such as the extreme cold and battery range drops for BEVs must be considered prior to implementation of these legislations. As a starting initiative towards green transition, the City of Regina has bought 20 zero emission buses, with an investment of CAD 20.6 million, which will be on the roads by 2025, and has newly established 50 public charging stations for light fleet vehicles across the city and highway periphery, with a CAD 1.5 million budget [4,5].
Despite the high efficiency of BEVs, it has remained more of a luxury across the city of Regina due to the harsh winter conditions in the province. During 2023, Saskatchewan registered a total 47,438 vehicles, where only 602 were battery electric vehicles (BEVs), 2738 were hybrid electric and 470 were PHEVs, representing a mere 8% of the total vehicle sales [6]. A study by Verma et al. (2015) [7] has assessed Canada’s renewable energy technologies to charge electric vehicles in thirteen provinces where they have assessed the techno-economic feasibility of renewable energy system (off grid wind turbine, hydroelectric powerplants) and found that it is more cost competitive to retrofit the hydroelectric power source with EV charging Additionally, A study by Domarchi and Cherchi (2023) [8] has evaluated different genres of methods used in EV forecasting and found that SD is more favourable for complex systems due to its detailed nature of numerically considering exogenous interactions. Apart from that, being fundamentally multi-agent, the EV system depends more on attributes on the supply side (driving range, costs and price), including significant attributes such as fuelling infrastructure, maintenance, and charging efficiency. Coffman et al. (2016) [9] identified the key drivers of EV purchasing decisions, which range from EV range capacity to social norms and policy implications. These factors have been incorporated into the built SD model for this study. Research conducted on the short-term data-driven EV charging demand forecasting using a multivariate RNN-based deep learning framework has used datasets from Toronto and California to generate scenarios for load forecasting with respect to both residential and commercial demands [10,11]. They have numerically found that multivariate DeepAR algorithm keep the precision more consistent in case of multi-step daily predictions, which in this case is the daily electricity demand forecasting of the study area electric grids [12]. A pioneering study by Afandizadeh et al. (2023) [13] has used automated hybrid machine learning approach named long short-term memory (LSTM) and Convolutional LSTM to predict the insurge of electric vehicle in USA’s automotive market. System dynamics approach has been applied by Xiang et al., (2017) [14] for articulating the evaluation pattern of Electric Vehicle (EV) and to validate the model sensitivity analysis of key factors, such as fuel price, subsidy policy, etc. has been considered. Application of system dynamics for simulating scenarios was first observed through a study on market penetration of EV alongside CO2 emission reduction potential and fuel usage in key OECD countries alongside China and India [15]. One recent study that concentrated on system dynamics-based transportation policy adoption in India has conducted a detailed analysis of the fundamentally challenging aspects such as the carbon tax effect, new technology adaption scenarios, etc. [16]. Keith et al. (2020) [17] conducted a detailed study on diffusion modelling for alternate fuel vehicle (AFV) forecasting while considering four scenario simulations to ultimately assess the GHG emission reduction potential for each type of AFV, including BEVs.
This paper will assess the closely knitted factors affecting the ZEV attractiveness and thus simulate the best possible policy measures required to meet the Electric Vehicle Availability Standard’s target of 100 percent ZEV adoption for the city of Regina, Saskatchewan, by 2035. It will use the integrated quantitative approach of system dynamics (SD) model-based scenario simulations including policy generations, where the stochastic processes of the vector autoregressive (VAR) model and linear regression-based time-series forecasting have been developed for specific input parameters. STELLA 1.9.4 (student license version) and Python 3.11.9 (student license version) have been used for developing and simulating the scenarios including a scenario change after policy implications.

2. Materials and Methodology

2.1. Study Area and Data Source

From Statistics Canada, the city of Regina has an area of 178.81 sq. km with a population density of 1266 per square km [18]. As per quarterly data from Statistics Canada (2024b) [19], only 1072 zero emission vehicles have been registered during the whole of four quarters in 2023, of which 602 were battery electric vehicles (BEVs). The number of privately owned electric vehicles in Regina is approximately only 380, where the total stock of registered light vehicles is around 2,04,011 [6,20]. These datasets are used in the built system dynamics model as baseline data for the simulation process. The model is being simulated until 2035 to obtain a perspective on the overall futuristic scenario. The population and related dataset have been extracted from [18]. The birth and mortality rate are 11 percent and 9.6 percent, respectively, whereas an average migration rate of 5.6 percent has been observed. The regional GDP dataset from 2017 to 2023 has been acquired from Statistics Canada (2023b) [21], specifically GDP data for the metropolitan area. A dataset on the “Electric Vehicle Availability Standard” by the Government of Canada, to be implemented during the policy simulation, has been extracted from the “Government of Canada” website, named Environment and Climate Change Canada [22] (2023b). Electricity demand, charging stations and charging with related costs specific to the region have been extracted from the literature, government sources [23,24,25] and non-govt corporations such as ArcGIS [26], ESRI, etc.

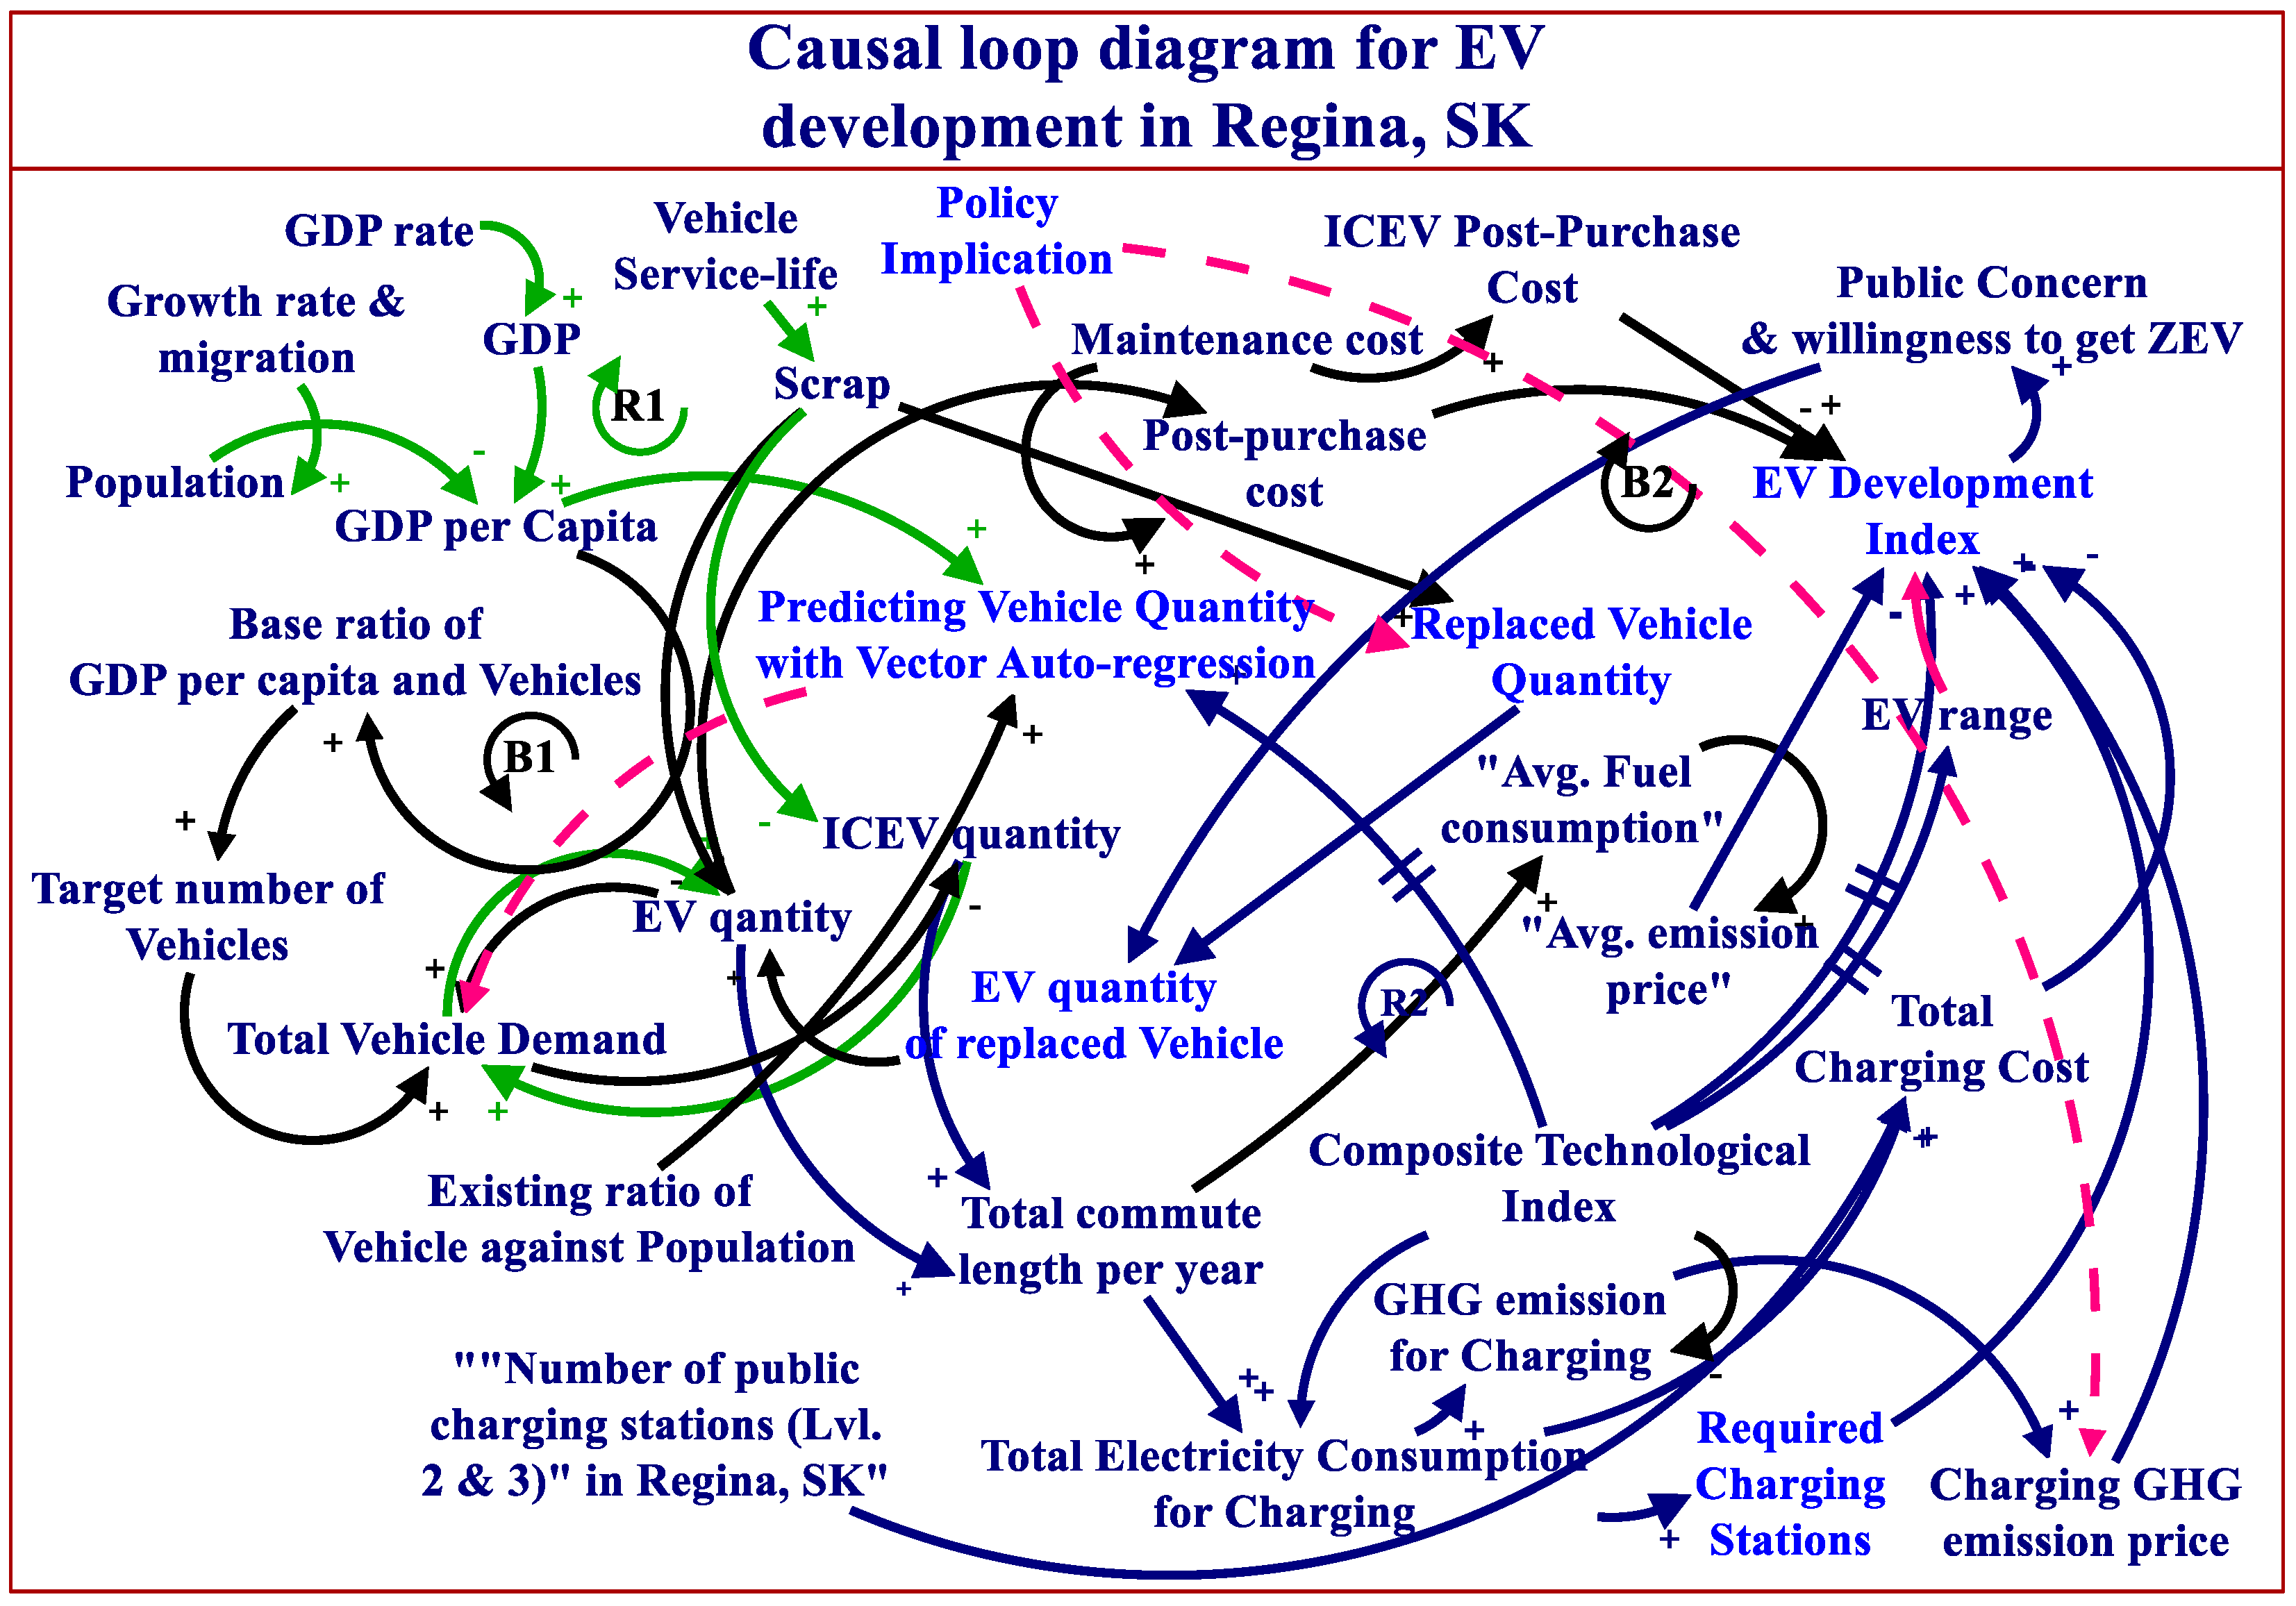
2.2. Dynamically Hypothesized Causal Loop Diagram

The abstract articulation of existing system behaviours is one of the many fundamental processes in developing a system dynamics model. Identifying the factors alongside establishing quantitative representation of their relationships are the most crucial parts of the EV availability model [27]. The causal loop diagram (CLD) consists of variables and arrows with polarities, mostly in circular patterns or loops. The loops are mainly reaction loops (R) and balancing loops (B) [28]. The EV-scale simulation for this study has been developed with two sub-sectors, namely EV demand (Green arrows and R1 reaction loop) and the development sector (Navy blue arrows and R2 reaction loop), alongside B1 and B2 balancing loops (Black arrows) that are interconnected with EV charging facilities, price and the attractiveness sector. The CLD for electric vehicle development in Regina is shown in the following Figure 1. The EV development index is positively related to the assigned factors, except negative factors such as post-purchase as well as charging prices and GHG emission price. A positive, higher index value represents a high percentage of availability and affordability when purchasing BEVs. Hydrogen is more suitable for freight transport while for personal vehicles, EV can be viable option [29].

2.3. Stock-Flow Diagram

The built stock-flow diagram is a detailed representation of the CLD discussed with detailed values and flow patterns. The built SD model for this study has 94 (94) variables, a root model with 2 sectors consisting of 6 stocks, 12 flows, 76 converters, 34 constants, 54 equations and 7 graphical functions. A stock flow diagram for forecasting EV integration in the city of Regina is shown in Figure 2. For this study, the finite difference equation using Euler’s method algorithm has been performed for the set of equations in each sector. Some exceptional converters used in this SD model are mainly exponential graphical interpolation functions due to the non-linear relationship of input dataset and non-integrated functions having been used to operate the system smoothly. An alteration of the instantaneous signal amplitude passing through the integration procedure is the main feature of those functions [30,31,32]. The simulation will be performed from 2024 until 2036, where the 2022 and 2023 datasets will be considered the baseline datasets. Apart from the equations, the deep learning method for generating forecasting equations such as the VAR equation and the linear regression-based prediction method has been used to determine baseline input dataset for the total number of light-duty vehicles and the amount of technological development over the years, respectively, with an ideal delta time (DT) value of 0.25. Examples of the equations used for this model are shown in the following section, in Equations (1),and Equation (2) These equation are used as input code for the converters in the stock flow diagram.
E V_M a r k e t_d e f i c i t = I F ( ( T o t a l_V e h i c l e_D e m a n d E V_q u a n t i t y_o f_r e p l a c e d_v e h i c l e s ) > E V_q u a n t i t y_o f_r e p l a c e d_v e h i c l e s ) T H E N ( T o t a l_V e h i c l e_D e m a n d E V_q u a n t i t y_o f_r e p l a c e d_v e h i c l e s ) E L S E ( T o t a l_V e h i c l e_D e m a n d )
G D P g r o w t h = G R A P H T I M E 1.000 ,   2.20 ,   2.000 ,   2.36988095238 ,   3.000 ,   2.23639880952 ,     4.000 ,   2.30005527211 ,   5.000 ,   2.55857426304 ,   6.000 ,   2.69690192744 ,   7.000 ,   3.13720663265 ,   8.000 ,   3.23887896825 ,   9.000 ,   3.09853174603 ,   ( 10.000 ,   3.10 )

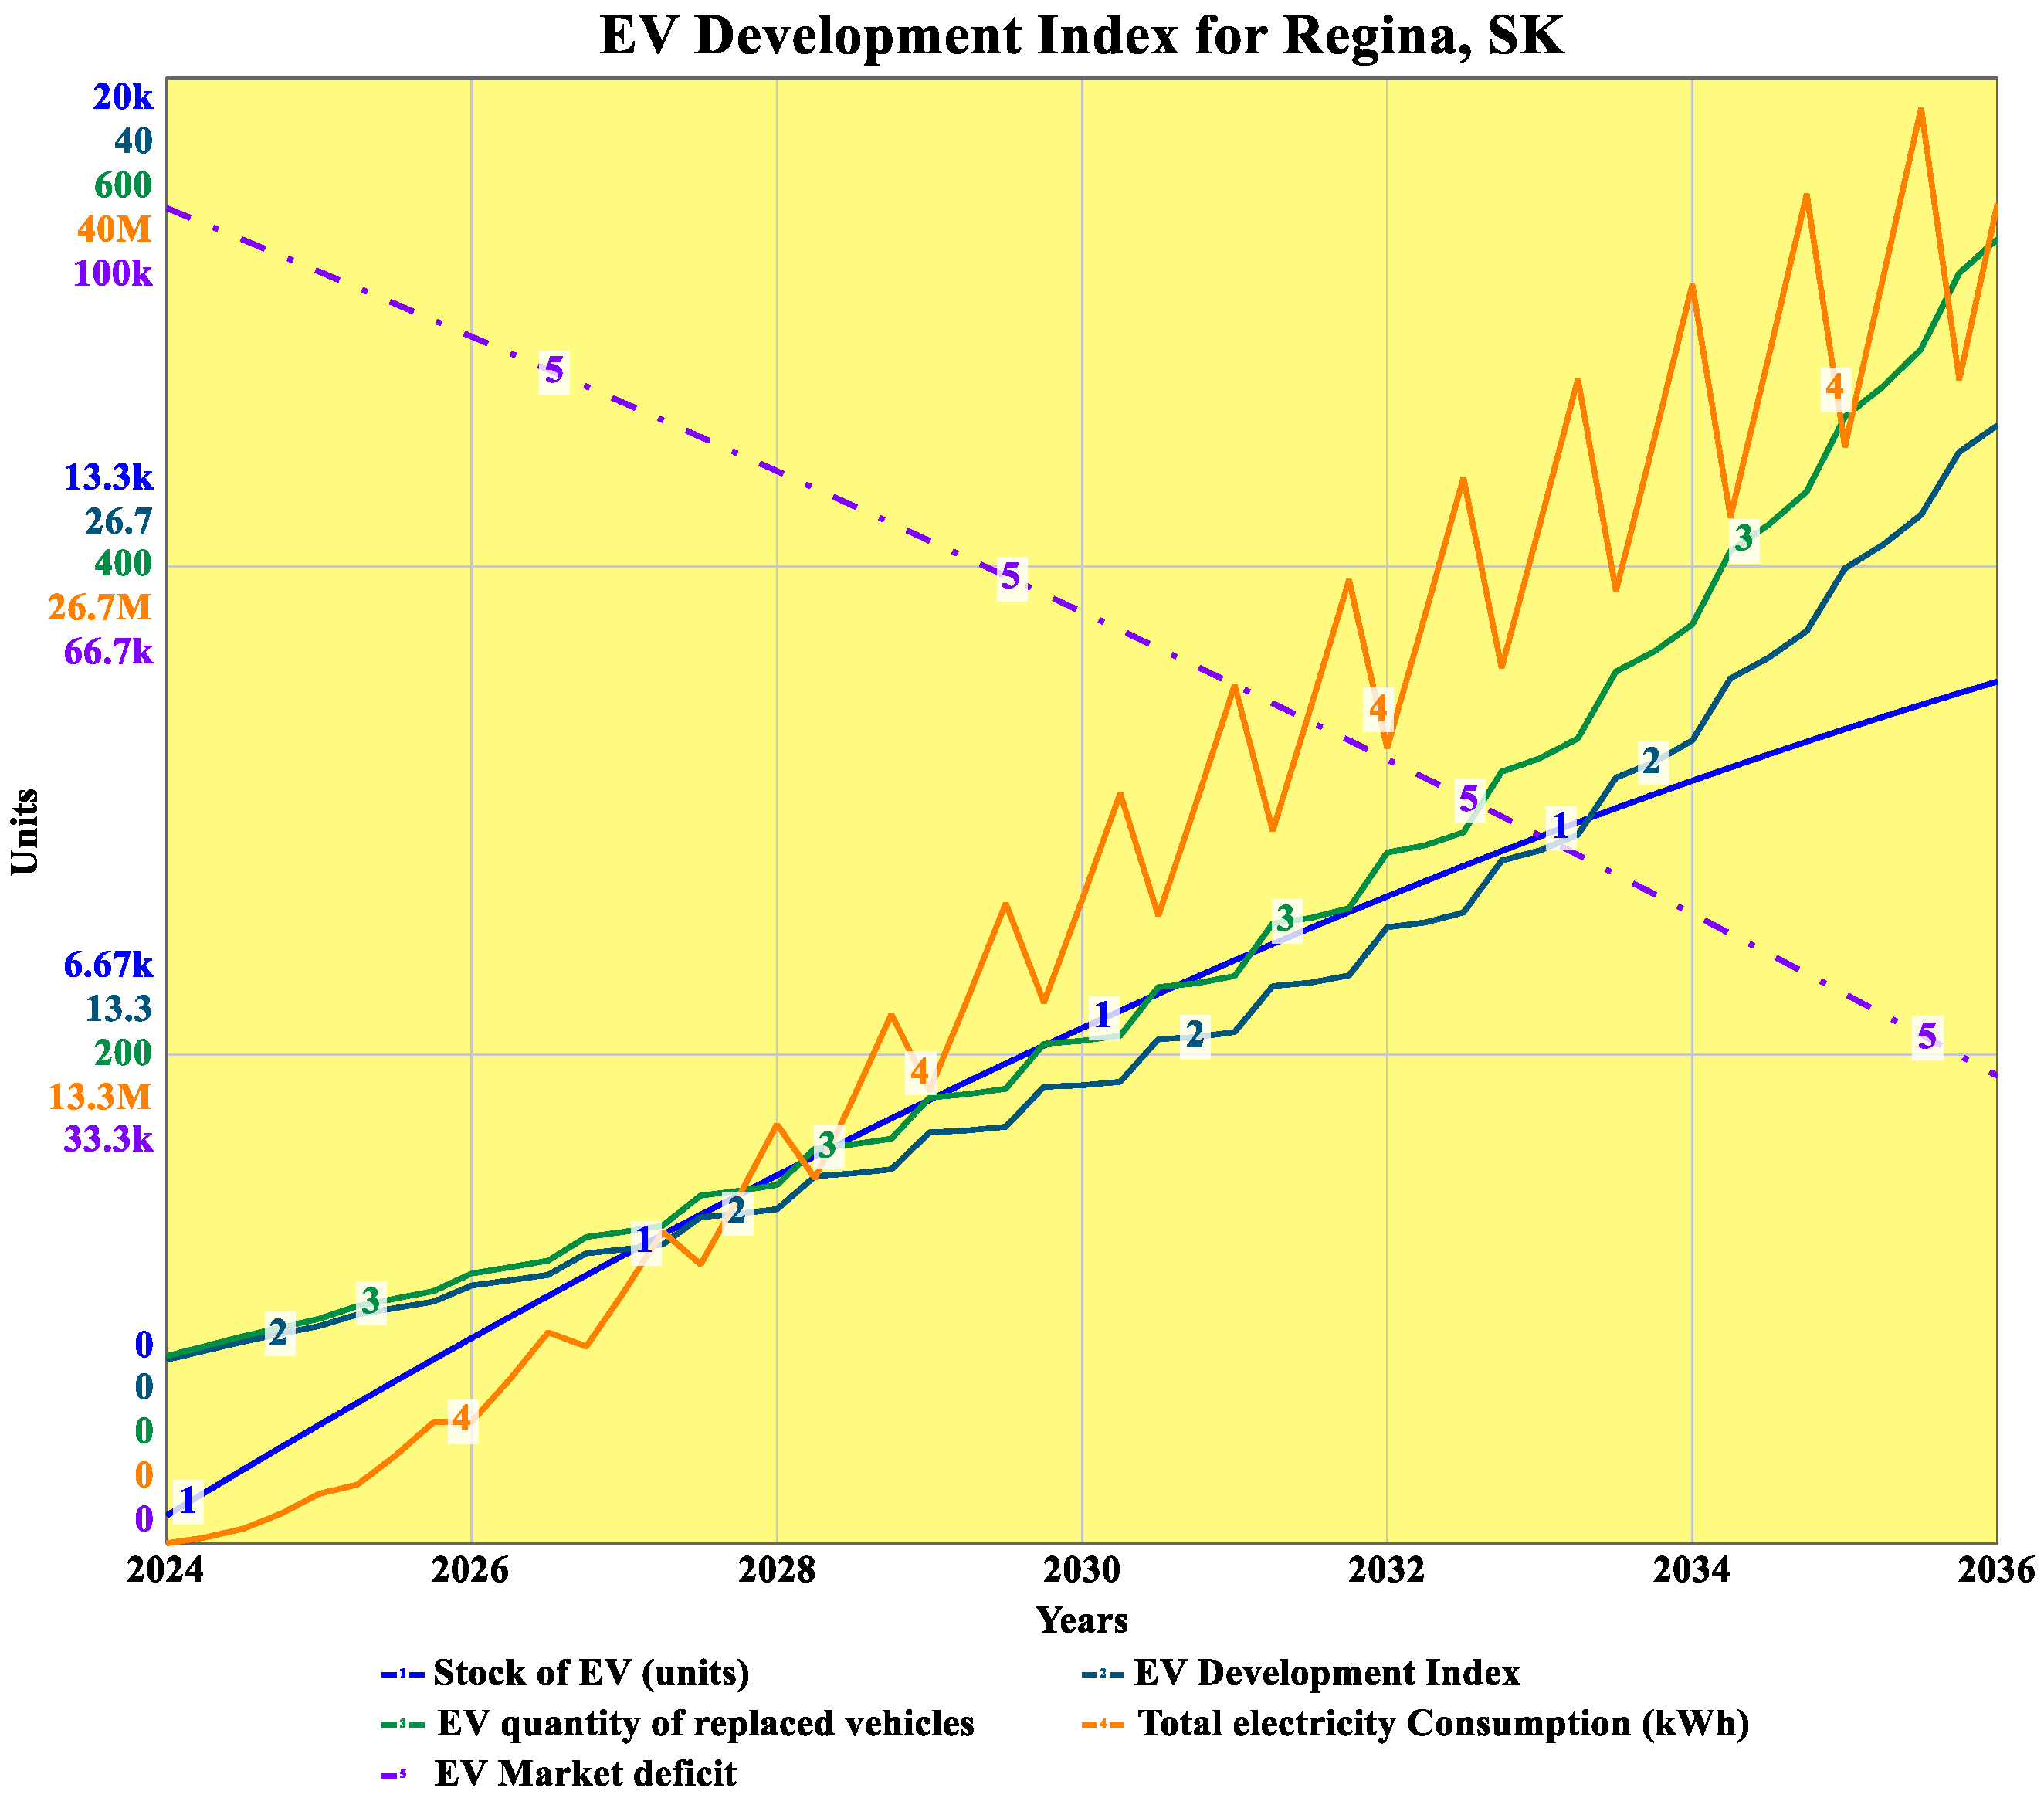
3. Baseline Simulation Results and Discussion

The simulation was conducted from 2024 to 2036 using a time step value of 0.25. The baseline simulation results generated are discussed through multi-scale comparative graphs of numerous parameters as well as the associated dataset tables representing quantitative values of the graphs discussed in each section. Euler’s integration method is followed when simulating the SD model sectors for EV development in Regina, SK. A few baseline results are illustrated in Figure 3 to give a perspective on the existing scenario. The stock of EVs for the base year was 380, which logarithmically increased to 11.1 thousand by 2035. This increase will likely be due to the mandate for achieving the zero emission vehicle target by 2030. If we closely consider the per capita GDP of Regina, which will increase to 83 thousand by 2035, from 62.2 thousand in 2024, it is most likely that the EV availability will increase. The EV development index is a representation of the availability of EVs in terms of technological advancement, charging and battery swapping stations’ infrastructure development, charging time, range viability, etc., that ultimately affects the public concern. The public concern value has been assumed in this case after analysing car owner’s general perceptions. The index value will increase to 29.1 by 2035 from a base value of 5.01, indicating an exponential increase with pulse type pattern. It is due to the charging behaviour and range drop of BEVs during extreme winter conditions as well as due to yearly consumption pattern of electricity for charging purposes. As per the simulation results, during the base year, only 77 of the 1550 replaced vehicle are EVs, which is a mere 5% of the total replaced vehicle, whereas the government is aiming to impose mandates for increasing the market share to 20% by 2026 and 60% by 2030. The baseline simulation results show a mere increase in BEVs to 510, which is 29.1% of the total market share, during 2035. To achieve “Canada’s Zero Emission Vehicle Target”, this share must be 100%, and this is where an analysis for policy measures has been conducted. The total electricity consumption for charging purposes has increased exponentially from 1.26 thousand MWh in 2024 to 28.6 thousand MWh. The zigzag pattern is due to the change in charging demand during winter and summer in Regina. During winter, the range of EV drops due to heat and power loss, thus requiring extended charging for the existing technology. The increase is exponential for the charging demand of EV. If we look at the market, the existing ratio of vehicles against the population and GDP in regina is 1.35, with a light vehicle quantity of approximate 204,011, which increases to 222,000 by 2035. But, the existing per vehicle ratio should be as much as 290 thousand by 2035. The market deficit for the stock of EVs in the present scenario is around 91.1 thousand, which gradually decreases to 37.5 thousand by 2035 due to partial implementation of “Canada’s Electric Vehicle Availability Standard” initially. These scenarios represent the lack of strategic structure and an absent feature of province-specific design parameters to achieve the targets specified in “Canada’s Electric Vehicle Availability Standard” announced on 20 December 2023.

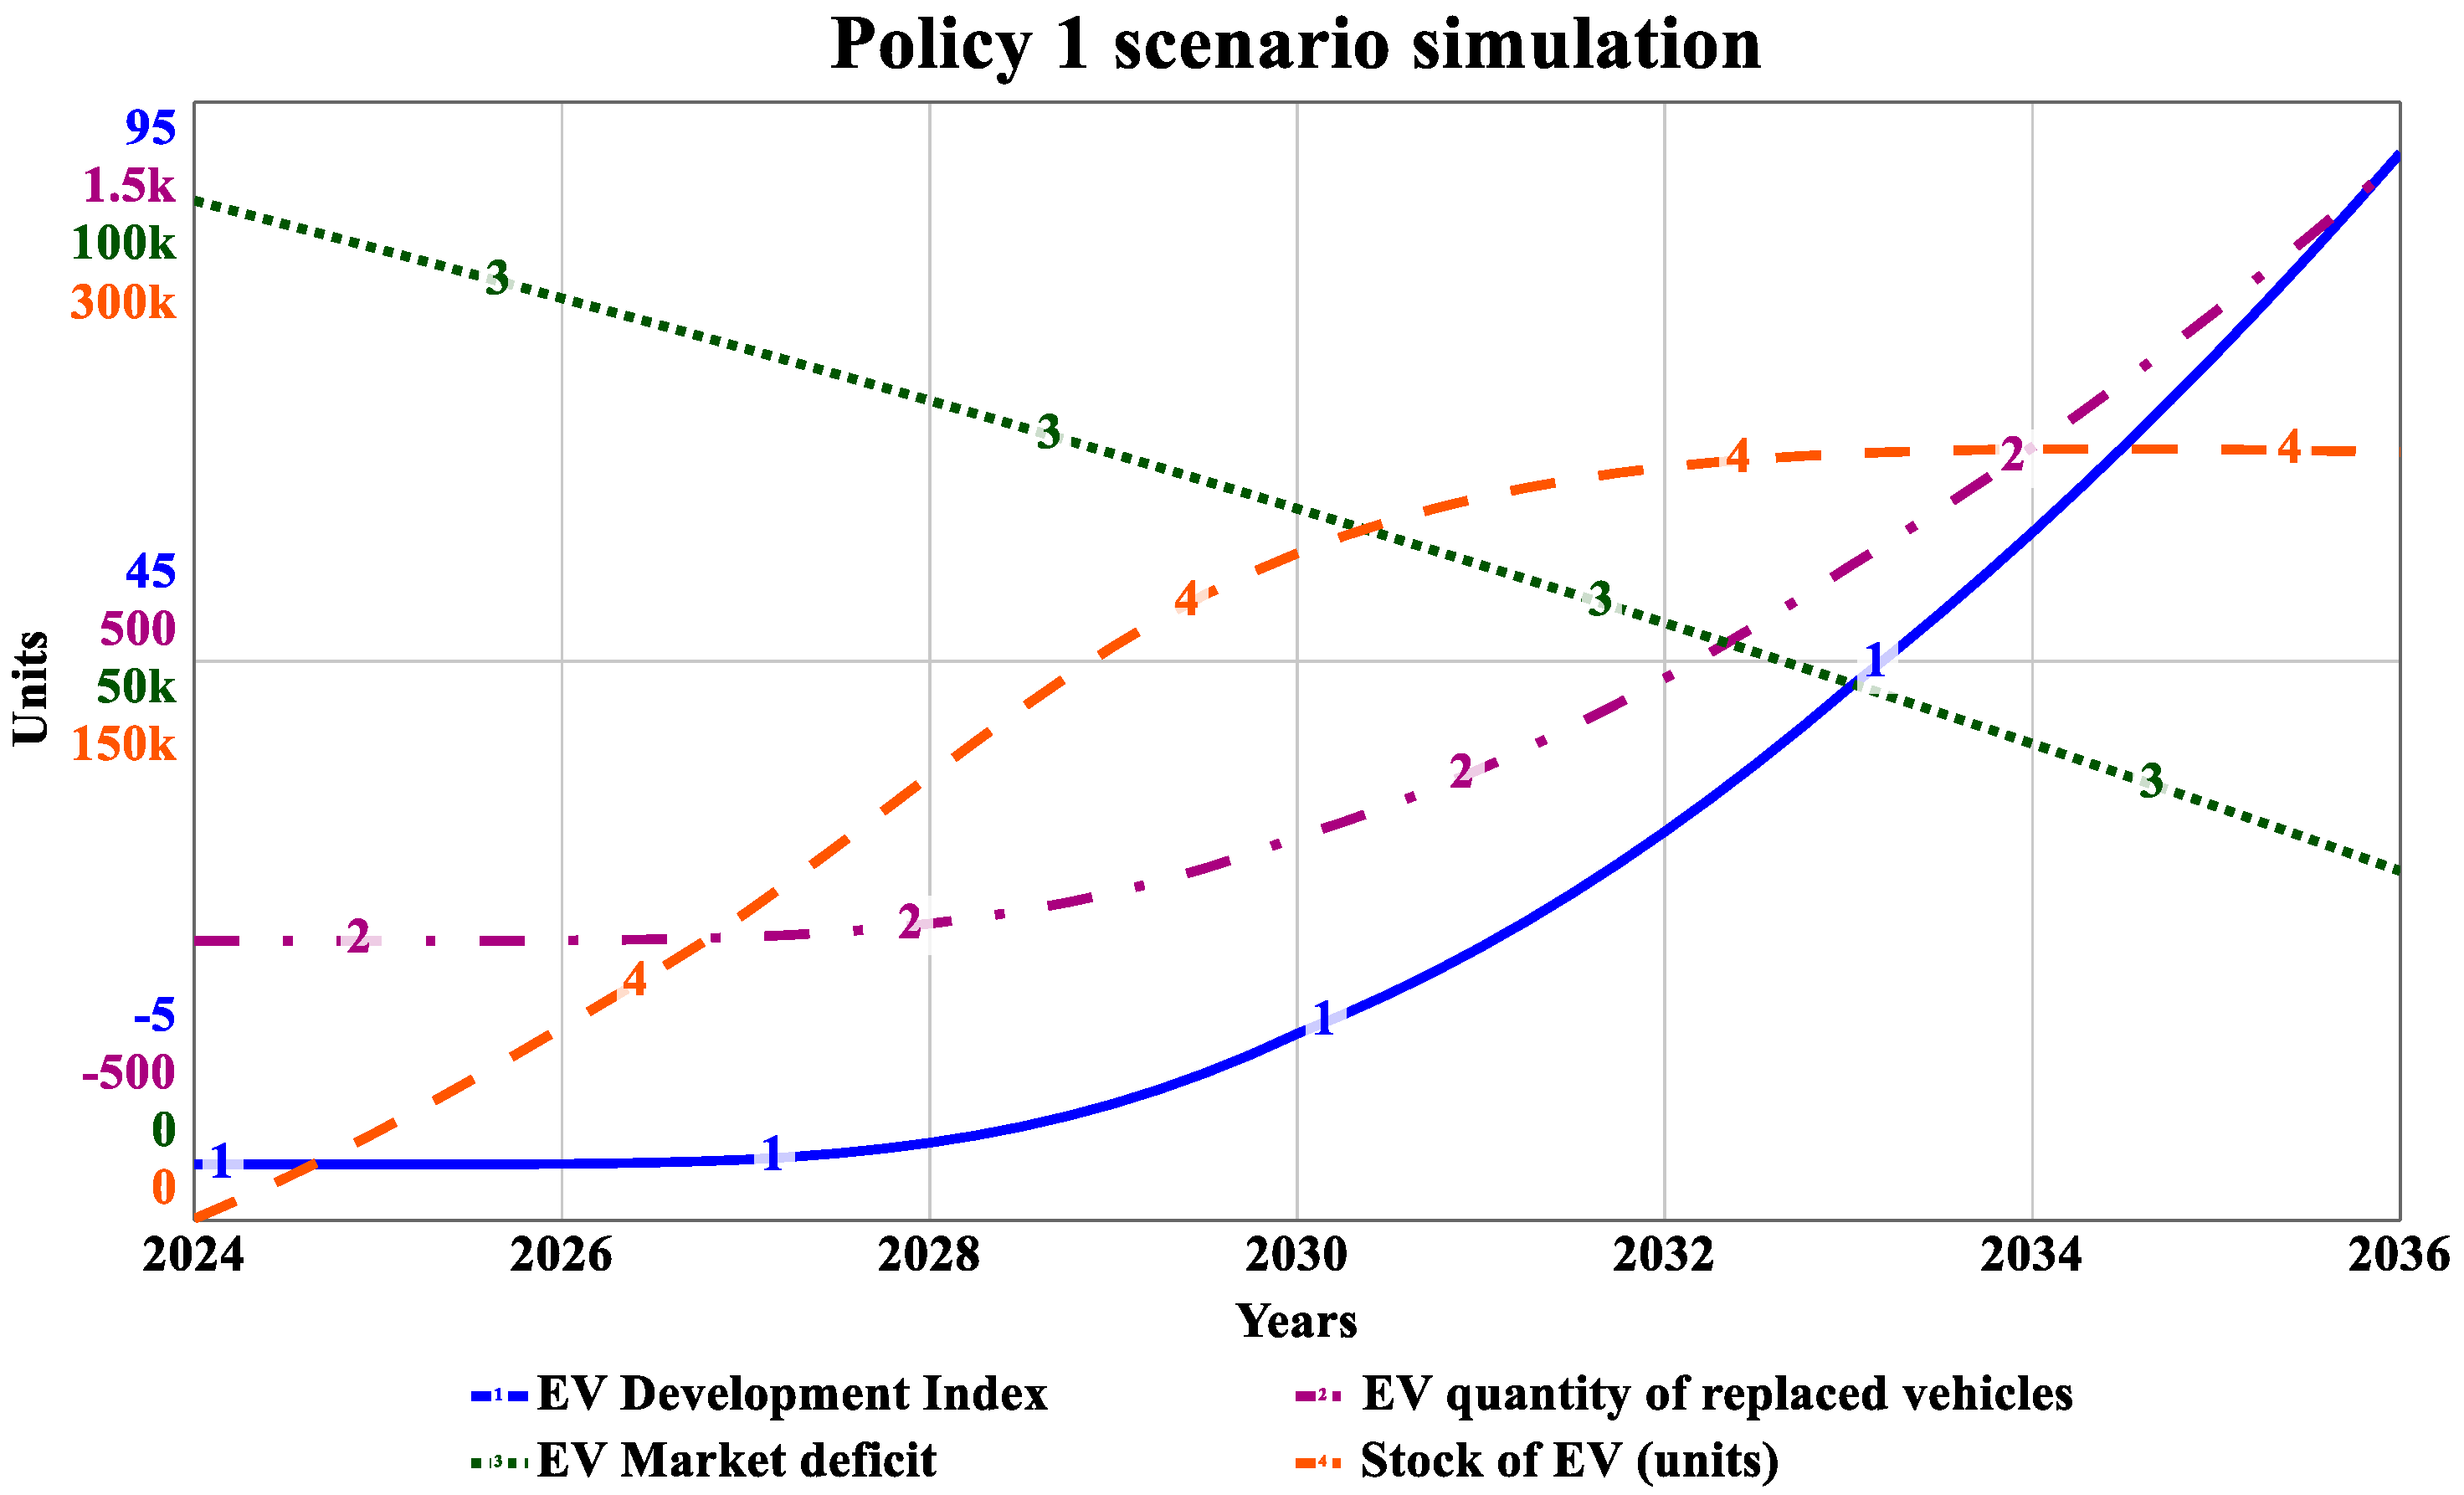
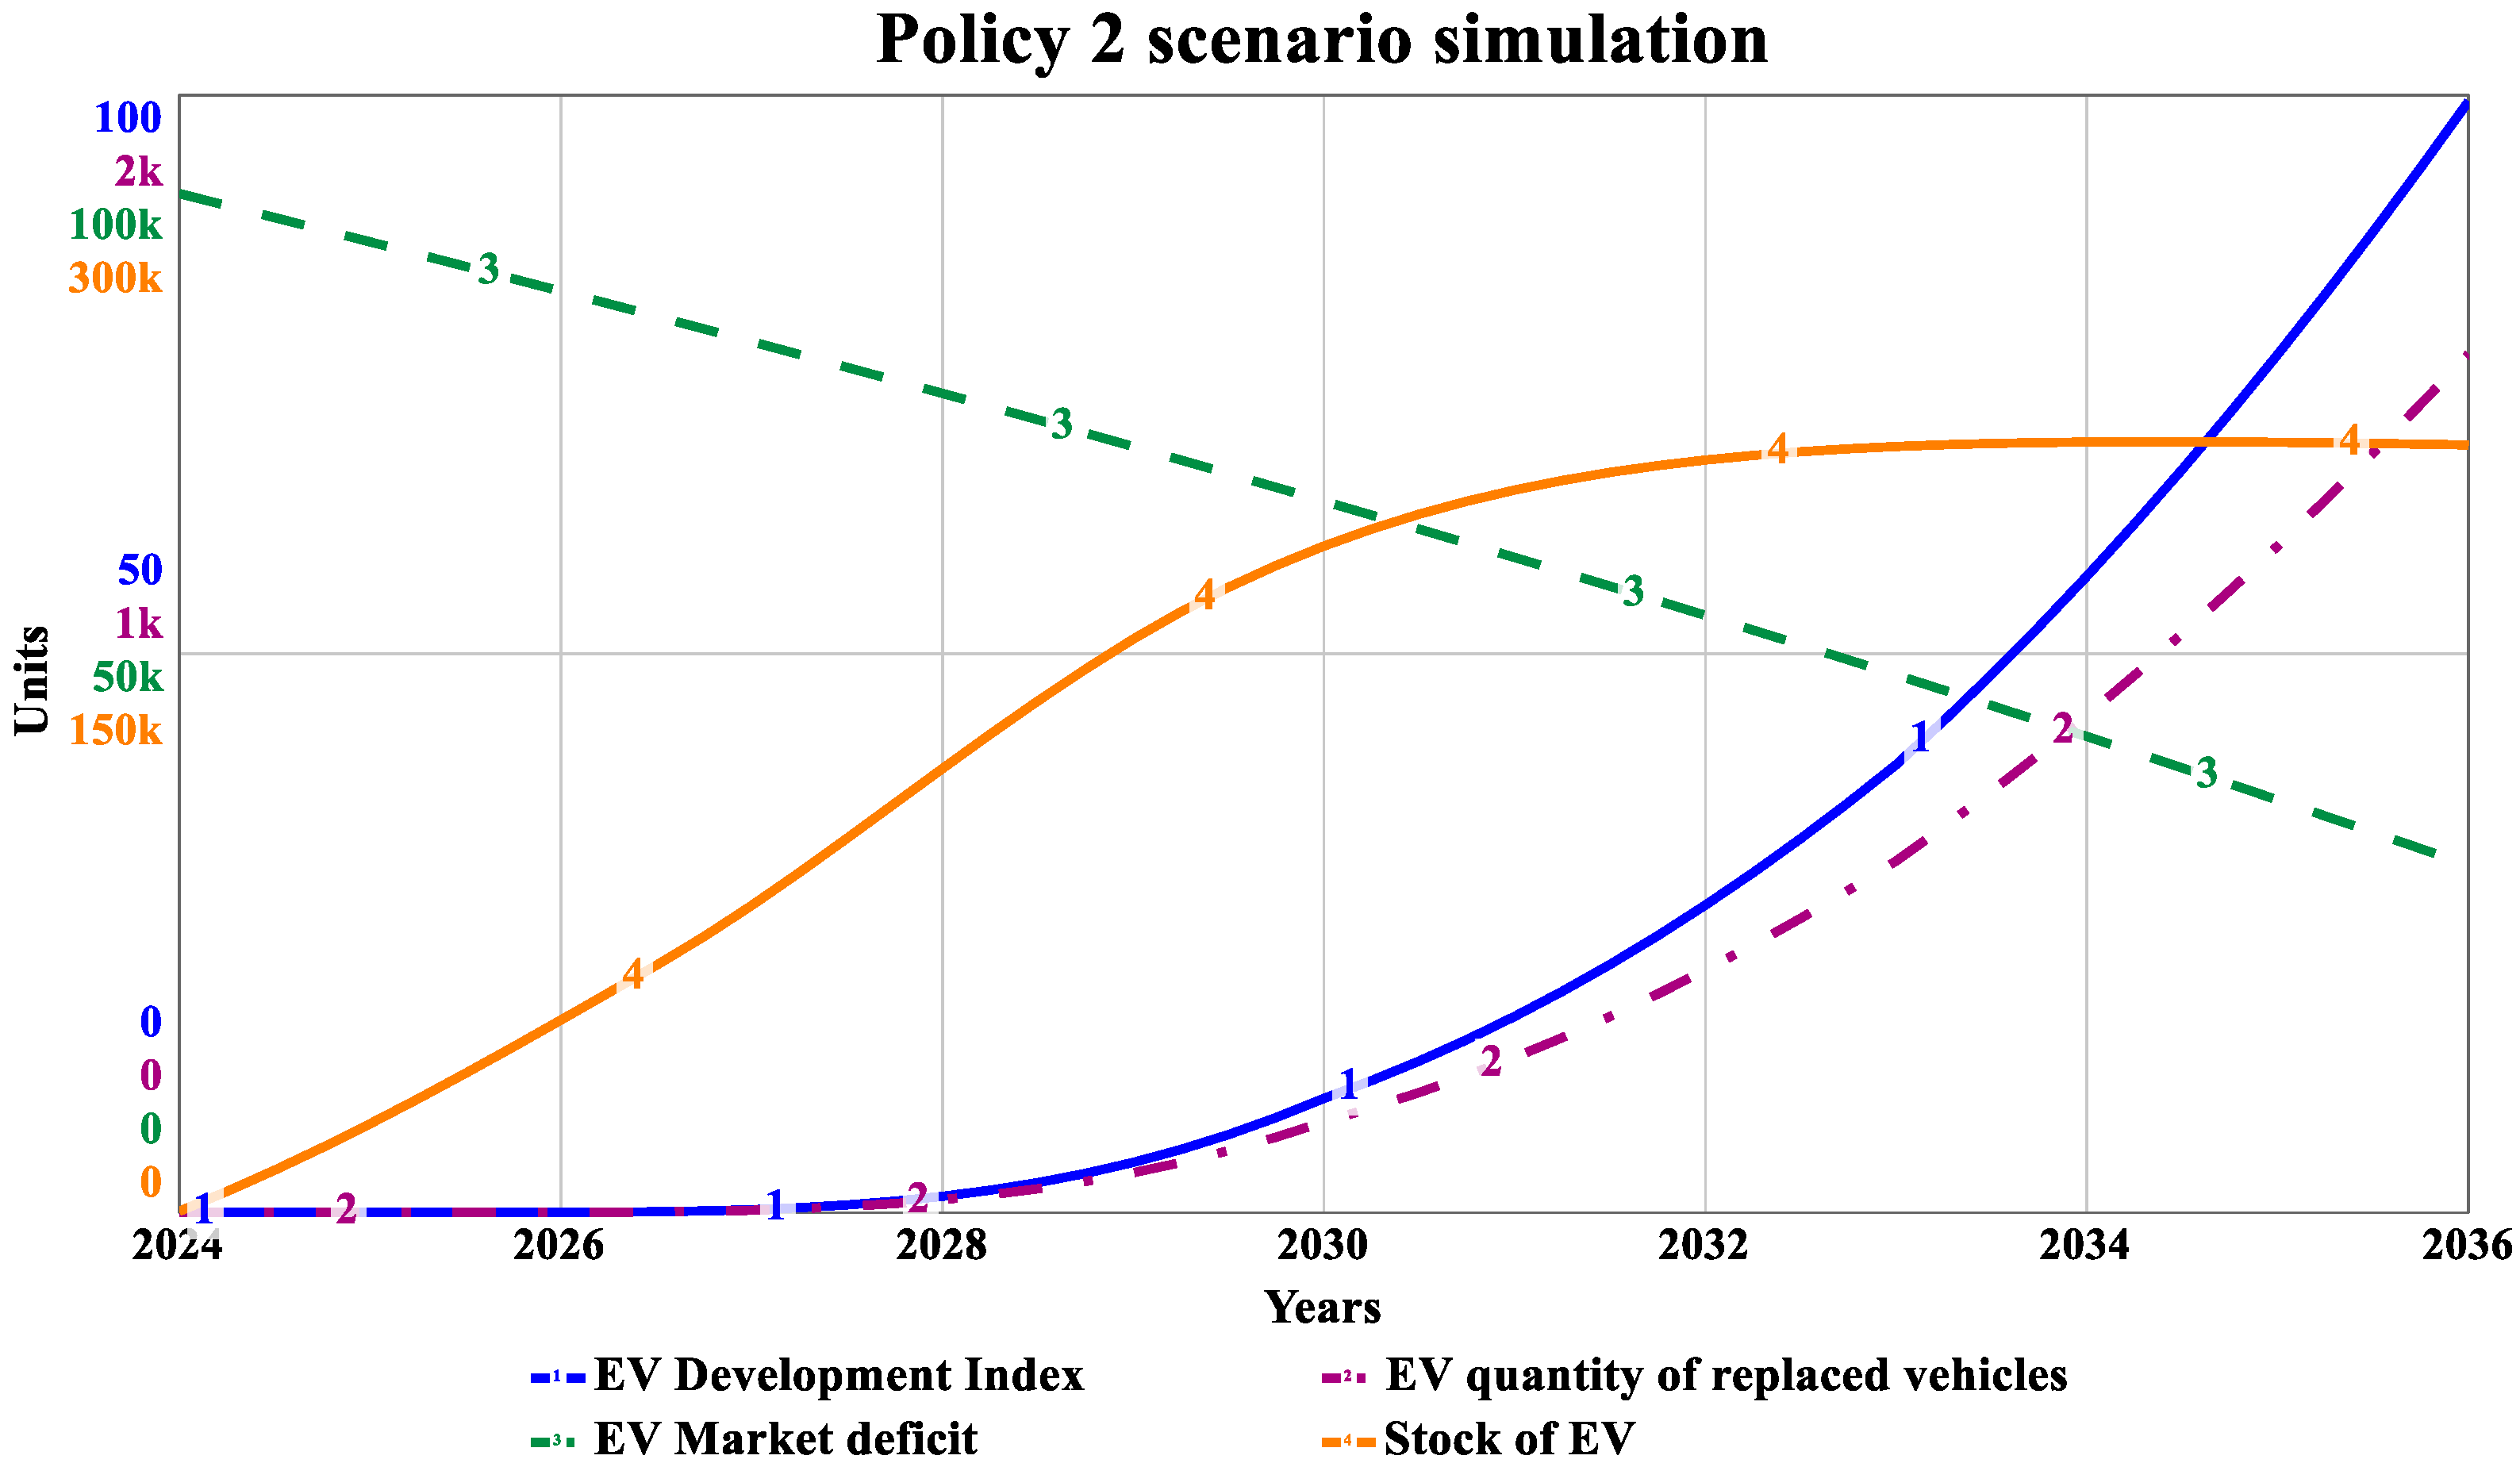
4. Model Validation and Policy Simulation

The purpose of model validation is to compile or validate the model structures and associated input dataset of the system dynamics model for boundary adequacy in extreme conditions [33]. Experimenting with the system in function is mostly impractical and even if it is con- 29 ducted, a failure may result in extreme costing of both financial and physical resources 30 [34]. Thus, simulation can be a useful tool to check the viability of different policy initiatives. In this study, to achieve the targets described by Canada’s recent mandate for “Electric Vehicle Availability Standard”, parameters such as incentives to EV owners, yearly tax rebate, technological advancement in the form of reduced charging time, extended battery life, BEV charging and battery swapping stations availability, expansion of wireless charging roads across the national highway network [35], charging price and GHG emission reduction has been considered. Apart from that, before policy simulation, model validation has been performed. Model calibration with population data showed min deformation. Sensitivity analysis has also been conducted to check boundary adequacy. Due to the unavailability of abundant existing dataset for the city of Regina, it is not yet possible to calibrate some dataset such as charging stations shortage for existing policy, electricity demand projections, etc. However, interestingly the population projection data from SD model indicate a city population of 2,90,959 whereas the city of Regina report indicate that the population for 2030 will be somewhere between 300,037 and 304,926 people. By 2035, the SD model projected a population of 3,02,545 people living in the city of regina. Regional GDP has also been calibrated with GDP data published by the city authority of Regina [36].
For policy 1, the EV road tax has been waived and a govt. tax rebate of $CAD 5000 has been introduced alongside a more laminar increase in the technological index while reducing the avg. charging time to 2 h. Though for a long term, the model results are inclusive, the results show the least resiliency for the fourth quarter of 2024 and all of 2025. As a result from 2028, the EV development index exponentially comes close to the maximum value of 90.4 by 2036, indicating drastically elevated public concern and a tendency to purchase EVs. However, for 2024, the value showed a negative development index due to the sudden increase in EV in spite of the availability of charging and maintenance structures. Secondly, the quantity of EVs of the total replaced vehicles due to vehicle expiry conditions has been a mere 5.4% for the base year, which increased to 1397 units out of the total replaced vehicles of 1545 units by 2036. But, the results are less resilient and are sensitive to parameters such as technological developments. The EV market deficit indicates the shortage of EV purchases against the total vehicle demand of Regina, as per the base year’s GDP to vehicle increment ratio. It decreases linearly from 91 thousand units to 31.2 thousand units over the simulation period. Finally, the EV stock rises linearly until 2027; after that, it increases logarithmically to 206,101 units from a base vehicle quantity of 380, due to the mandatory policy implications for achieving ZEV targets. This is because of the gradual replacement of ICEVs due to the imposed restrictions. In spite of the encouraging results, the first years’ negative initially lower values showed the impression of less resiliency for these policy initiatives. The resulting graph for policy 1 is shown in Figure 4.
For the policy 2 simulation, resulting graph shown in Figure 5, an average $CAD 7500 government incentive in the form of a tax rebate has been introduced; the technological index is considered to perform at its highest efficiency while reducing the charging time to less than an hour. Apart from that, for both policies, the sudden drop and rise in energy and charging demand due to seasonal variations have been normalized. Additionally, a reducing trend over the years for the base price of EVs has been considered in this study due to the improvisation of recent technological advancements. The simulation results for the EV development index show very slow progress until 2027 but, after that, start to increase exponentially to a final value of 99.4 from a 2030 index value of 17.6. One of the main reasons for this exponential jump is the unavailability of new and used ICEVs due to federal restrictions. The total EV quantity of replaced vehicles is very low during the initial four years, but from 2027, it will start to exponentially rise due to policy implications. The replaced quantity will reach a maximum of 1536 units out of total replaced 1545 units by 2036, which was only 162 units out of a total of 1587 replaced vehicles before 2030.
The market deficit for the quantity of EV gradually decreased to 30 thousand units by 2036. This scenario is more resilient and achievable with extensive efforts in innovation and resource mining, such as the inclusion of projects such “Saskatchewan Critical Minerals Innovation Incentive (SCMII)” to discover and utilize resources such as lithium to upgrade the current depreciation process time of EV batteries and charging stations. It is to be noted that Saskatchewan has been found to be the most suitable location for lithium mining, and projects like Oil and Gas Processing Investment Incentive (OGPII) and Saskatchewan Petroleum Innovation Incentive (SPII) are sure to increase the innovation of the sector and thus play major roles for the ZEV initiatives of not only the city of Regina but also the province [37]. Finally, the stock of EVs grew slight exponentially until 2028 and then increased rather logarithmically to 206,883 units by the end of the simulation period due to the policy imposed for market penetration of EVs while phasing out the traditional internal-combustion engine vehicles, specifically the light vehicles and small passenger trucks. Even though there are certain challenges to achieving the proposed policy measures within the timeframe set by the government, cumulative initiatives in retrofitting carbon capture, storage and utilization technology with the existing coal and gas-powered electricity generation plants [38] can surely bring resiliency to the entire system through uninterrupted power generation due to the massive increase of BEV fleets.

5. Conclusions

The EV evaluation model for Regina concentrates on EV development, vehicle demand and evaluation modules using system dynamics. Rather than precision, this simulation of policy measures gives us a perspective on the gaps in the system and remedial measures. On a regional scale, data availability is the utmost hurdle to overcome for a more comprehensive SD model structure for the city of Regina. The model in this study is mostly built upon available baseline datasets for the past decade. However, specifically for regina, there is a sheer scarcity of dataset traffic volume to public perceptions regarding BEVs. Moreover, this built model is the first of its kind to utilize vector autoregression (VAR) factors in the SD model input equation module. VAR is a statistical model that is used for understanding the dynamicity of inter-relationships for time-series forecasting among specified factors or variables. On larger operations of machine learning, it acts as a statistical component for two or more interactions of time-series dataset for the algorithm [39]. The model has its limitations regarding the consideration of renewable electric grids, EV technological breakthroughs, deflection and resilience of the model in disastrous conditions, and the mandatory home charging connections for each EV owner due to the extreme uprise of the EV fleet in the near future. The model presents a more transparent scenario of the EV availability, and market penetration in the EV industry has to make the ZEV 2035 target a reality. Finally, it can be said that, though the induction of EV has its own challenges towards the environment, it can be more of a contributing attribute of the larger ZEV system concentrated on AFV. Finally, the policy 2 simulation gives a mode-precise and -resilient representation of the analysed parameters in this study for EV evaluation in Regina and thus can be taken as the baseline policy to further improve the system’s structure across the province.

Author Contributions

Conceptualization, S.M.R., N.U.I.H. and G.K.; methodology, S.M.R.; software, S.M.R.; validation, S.M.R.; formal analysis, S.M.R.; investigation, S.M.R.; resources, S.M.R.; data curation, S.M.R.; writing—original draft preparation, S.M.R.; writing—review and editing, G.K.; visualization, N.U.I.H.; supervision, G.K.; project administration, not applicable; funding acquisition, not applicable. All authors have read and agreed to the published version of the manuscript.

Funding

This research received no external funding.

Institutional Review Board Statement

Not applicable.

Informed Consent Statement

Not applicable.

Data Availability Statement

Data are available as required.

Conflicts of Interest

The authors declare no conflicts of interest.

References

  1. Environment and Climate Change Canada. Canadian environmental sustainability indicators: Greenhouse gas emissions. 2024. Available online: https://www.canada.ca/en/environment-climate-change/services/environmental-indicators/greenhouse-gas-emissions.html (accessed on 7 June 2024).
  2. Macdonald-Laurier Institute. A Bumpy Road Ahead: A critical assessment of Canada’s Electric Vehicle Availability Standard. 2024. Available online: https://macdonaldlaurier.ca/a-bumpy-road-ahead-a-critical-assessment-of-canadas-electric-vehicle-availability-standard-jerome-gessaroli/ (accessed on 7 June 2024).
  3. Environment and Climate Change Canada. 2023 Progress Report on the 2030 Emissions Reduction Plan; Environment and Climate Change Canada: Burlington, ON, Canada, 2023.
  4. Anderson, N. City of Regina’s 2023-24 General and Utility Fund Operating Budget and 2023–2027 Capital Budget. 2022. Available online: https://www.regina.ca/export/sites/Regina.ca/city-government/budget-finance/.galleries/pdfs/2023-24-Budget-Book-Proposed.pdf (accessed on 16 June 2024).
  5. City of Regina. Energy & Sustainability Framework Energy & Emissions Reduction Action Plan; City of Regina: Regina, SK, Canada, 2022. [Google Scholar]
  6. Statistics Canada. New Motor Vehicle Registrations, Quarterly; Statistics Canada: Regina, SK, Canada, 2024.
  7. Verma, A.; Raj, R.; Kumar, M.; Ghandehariun, S.; Kumar, A. Assessment of renewable energy technologies for charging electric vehicles in Canada. Energy 2015, 86, 548–559. [Google Scholar] [CrossRef]
  8. Domarchi, C.; Cherchi, E. Electric vehicle forecasts: A review of models and methods including diffusion and substitution effects. Transp. Rev. 2023, 43, 1118–1143. [Google Scholar] [CrossRef]
  9. Coffman, M.; Bernstein, P.; Wee, S. Electric vehicles revisited: A review of factors that affect adoption. Transp. Rev. 2016, 37, 79–93. [Google Scholar] [CrossRef]
  10. Kumar, R.R.; Alok, K. Adoption of electric vehicle: A literature review and prospects for sustainability. J. Clean. Prod. 2020, 253, 119911. [Google Scholar] [CrossRef]
  11. Vahidmohammadi, A. A Comparative Study of Short-Term Electric Vehicle Load Forecasting Using Data-Driven Multivariate Probabilistic DeepAR Approach; The University of Regina: Regina, SK, Canada, 2021. [Google Scholar]
  12. Adedeji, B.P.; Kabir, G. A feedforward deep neural network for predicting the state-of-charge of lithium-ion battery in electric vehicles. Decis. Anal. J. 2023, 8, 100255. [Google Scholar] [CrossRef]
  13. Afandizadeh, S.; Sharifi, D.; Kalantari, N.; Mirzahossein, H. Using machine learning methods to predict electric vehicles penetration in the automotive market. Sci. Rep. 2023, 13, 8345. [Google Scholar] [CrossRef] [PubMed]
  14. Xiang, Y.; Zhou, H.; Yang, W.; Liu, J.; Niu, Y.; Guo, J. Scale Evolution of Electric Vehicles: A System Dynamics Approach. IEEE Access 2017, 5, 8859–8868. [Google Scholar] [CrossRef]
  15. Vilchez, J.J.G.; Jochem, P.; Fichtner, W. EV Market Development Pathways – An Application of System Dynamics for Policy Simulation. In Proceedings of the EVS27 International Battery, Hybrid and Fuel Cell Electric Vehicle Symposium; Barcelona, Spain, 17–20 November 2013, pp. 1030–1038.
  16. Saraf, N.; Shastri, Y. System dynamics-based assessment of novel transport options adoption in India. Clean Technol. Environ. Policy 2022, 25, 799–823. [Google Scholar] [CrossRef] [PubMed]
  17. Keith, D.R.; Struben, J.J.; Naumov, S. The Diffusion of Alternative Fuel Vehicles: A Generalised Model and Future Research Agenda. J. Simul. 2020, 14, 260–277. [Google Scholar] [CrossRef]
  18. Statistics Canada. Census Profile, 2021 Census of Population. Ottawa, November 2023. Available online: https://www12.statcan.gc.ca/census-recensement/2021/dp-pd/prof/index.cfm?Lang=E (accessed on 10 June 2024).
  19. Statistics Canada. New Zero-Emission Vehicle Registrations, Quarterly; Statistics Canada: Ottowa, ON, Canada, 2024. [CrossRef]
  20. Statistics Canada. New Motor Vehicle Registrations, Annual Sum. Saskatchewan, March 2024. Available online: https://www150.statcan.gc.ca/t1/tbl1/en/tv.action?pid=2010002402&pickMembers%5B0%5D=1.9&pickMembers%5B1%5D=3.1&cubeTimeFrame.startYear=2022&cubeTimeFrame.endYear=2022&referencePeriods=20220101%2C20220101 (accessed on 10 June 2024).
  21. Statistics Canada. Gross Domestic Product (GDP) at Basic Prices, by Census Metropolitan Area (CMA) (× 1,000,000); Statistics Canada: Ottowa, ON, Canada, 2023. [CrossRef]
  22. Environment and Climate Change Canada. Canada’s Electric Vehicle Availability Standard (Regulated Targets for Zero-Emission Vehicles). 2023. Available online: https://www.canada.ca/en/environment-climate-change/news/2023/12/canadas-electric-vehicle-availability-standard-regulated-targets-for-zero-emission-vehicles.html (accessed on 10 June 2024).
  23. SaskPower. Electrical Vehicle Resources-Charging. 2024. Available online: https://www.saskpower.com/power-savings-and-programs/electric-vehicles/electric-vehicle-resources/charging (accessed on 10 June 2024).
  24. Government of Canada; Natural Resources Canada; Strategic Policy and Innovation Sector. Administrative Boundaries in Canada—Administrative Features. Available online: https://open.canada.ca/data/en/dataset/306e5004-534b-4110-9feb-58e3a5c3fd97 (accessed on 10 June 2024).
  25. City of Regina. City of Regina-City Limits. Available online: https://opengis.regina.ca/arcgis/rest/services/OpenData/CityLimits/MapServer (accessed on 10 June 2024).
  26. ArcGIS. Saskatchewan EV Charging Station Potential Sites. 2022. Available online: https://www.arcgis.com/home/item.html?id=fcdd73644ecc46ea8e01e4629d10e20f (accessed on 10 June 2024).
  27. Abdullah, H.M.; Gastli, A.; Ben-Brahim, L.; Mohammed, S.O. Planning and Optimizing Electric-Vehicle Charging Infrastructure Through System Dynamics. IEEE Access 2022, 10, 17495–17514. [Google Scholar] [CrossRef]
  28. Forrester, J.W. Economic theory for the new millennium (2003). Syst. Dyn. Rev. 2013, 29, 26–41. [Google Scholar] [CrossRef]
  29. Hopkins, E.; Potoglou, D.; Orford, S.; Cipcigan, L. Can the equitable roll out of electric vehicle charging infrastructure be achieved? Renew. Sustain. Energy Rev. 2023, 182, 113398. [Google Scholar] [CrossRef]
  30. Rafew, S.; Rafizul, I.M. Application of system dynamics for municipal solid waste to electric energy generation potential of Khulna city in Bangladesh. Energy Rep. 2023, 9, 4085–4110. [Google Scholar] [CrossRef]
  31. Rafizul, I.M.; Kraft, E.; Haupt, T.; Rafew, S.M. Forecasting municipal solid plastic waste generation and management policy using system dynamics: A case study of Khulna City in Bangladesh. Environ. Monit. Assess. 2024, 196, 544. [Google Scholar] [CrossRef] [PubMed]
  32. Rafew, S.; Rafizul, I.M. Application of system dynamics model for municipal solid waste management in Khulna city of Bangladesh. Waste Manag. 2021, 129, 1–19. [Google Scholar] [CrossRef] [PubMed]
  33. Smith, E.D.; Szidarovszky, F.; Karnavas, W.J.; Bahill, A.T. Sensitivity Analysis, a Powerful System Validation Technique. Open Cybern. Syst. J. 2007, 2, 39–56. [Google Scholar] [CrossRef]
  34. Bala, B.K.; Arshad, F.M.; Noh, K.M. System Dynamics: Modelling and Simulation; Springer Nature: Dordrecht, The Netherlands, 2017. [Google Scholar] [CrossRef]
  35. Du, J.; Pei, M.; Jia, B.; Wu, P. Optimal Deployment of Dynamic Wireless Charging Lanes for Electric Vehicles considering the Battery Charging Rate. J. Adv. Transp. 2022, 2022, 6428887. [Google Scholar] [CrossRef]
  36. City of Regina. Catalyst Committee Report. 2023. Available online: https://beheard.regina.ca/33186/widgets/135724/documents/99497 (accessed on 14 June 2024).
  37. Government of Saskatchewan. Strengthening Saskatchewan’s Lithium Industry. Available online: https://www.saskatchewan.ca/government/news-and-media/2022/november/07/strengthening-saskatchewans-lithium-industry (accessed on 14 June 2024).
  38. Kabir, A.; Khan, S.A.; Kabir, G. Carbon Capture, Utilization, and Storage Risks from Supply Chain Perspective: A Review of the Literature and Conceptual Framework Development. C J. Carbon Res. 2024, 10, 15. [Google Scholar] [CrossRef]
  39. Brahimi, N.; Zhang, H.; Dai, L.; Zhang, J. Modelling on Car-Sharing Serial Prediction Based on Machine Learning and Deep Learning. Complexity 2022, 2022, 8843000. [Google Scholar] [CrossRef]
Figure 1. Causal loop diagram for battery electric vehicle development in Regina, Sk.
Engproc 76 00027 g001
Figure 2. Stock-flow model for EV development and availability.
Engproc 76 00027 g002
Figure 3. Baseline simulation of key parameters for EV development in Regina, SK.
Engproc 76 00027 g003
Figure 4. Simulated results for policy 1 from 2024 until 2036.
Engproc 76 00027 g004
Figure 5. Simulated results for the policy 2 scenario.
Engproc 76 00027 g005
Disclaimer/Publisher’s Note: The statements, opinions and data contained in all publications are solely those of the individual author(s) and contributor(s) and not of MDPI and/or the editor(s). MDPI and/or the editor(s) disclaim responsibility for any injury to people or property resulting from any ideas, methods, instructions or products referred to in the content.

