Abstract
The identification of defects in apple leaf specimens is crucial for mitigating crop loss and maintaining harvest quality. This study investigates the applicability of an intensity detection simulation-integrated optical cross-sectional modeling method for detecting defective apple leaf specimens. The technique utilizes a customized 840 nm optical coherence tomography (OCT). The method involved using a peak-intensity detection technique to analyze OCT signal intensity variations in multi-layered leaf structures. Results demonstrate the potential of the method to identify morphological differences between leaf specimens from healthy and infected trees and, specifically, healthy leaf specimens from infected trees. Implementing this method enables cost saving through timely interventions to reduce the impact of leaf defects on crop production.
1. Introduction
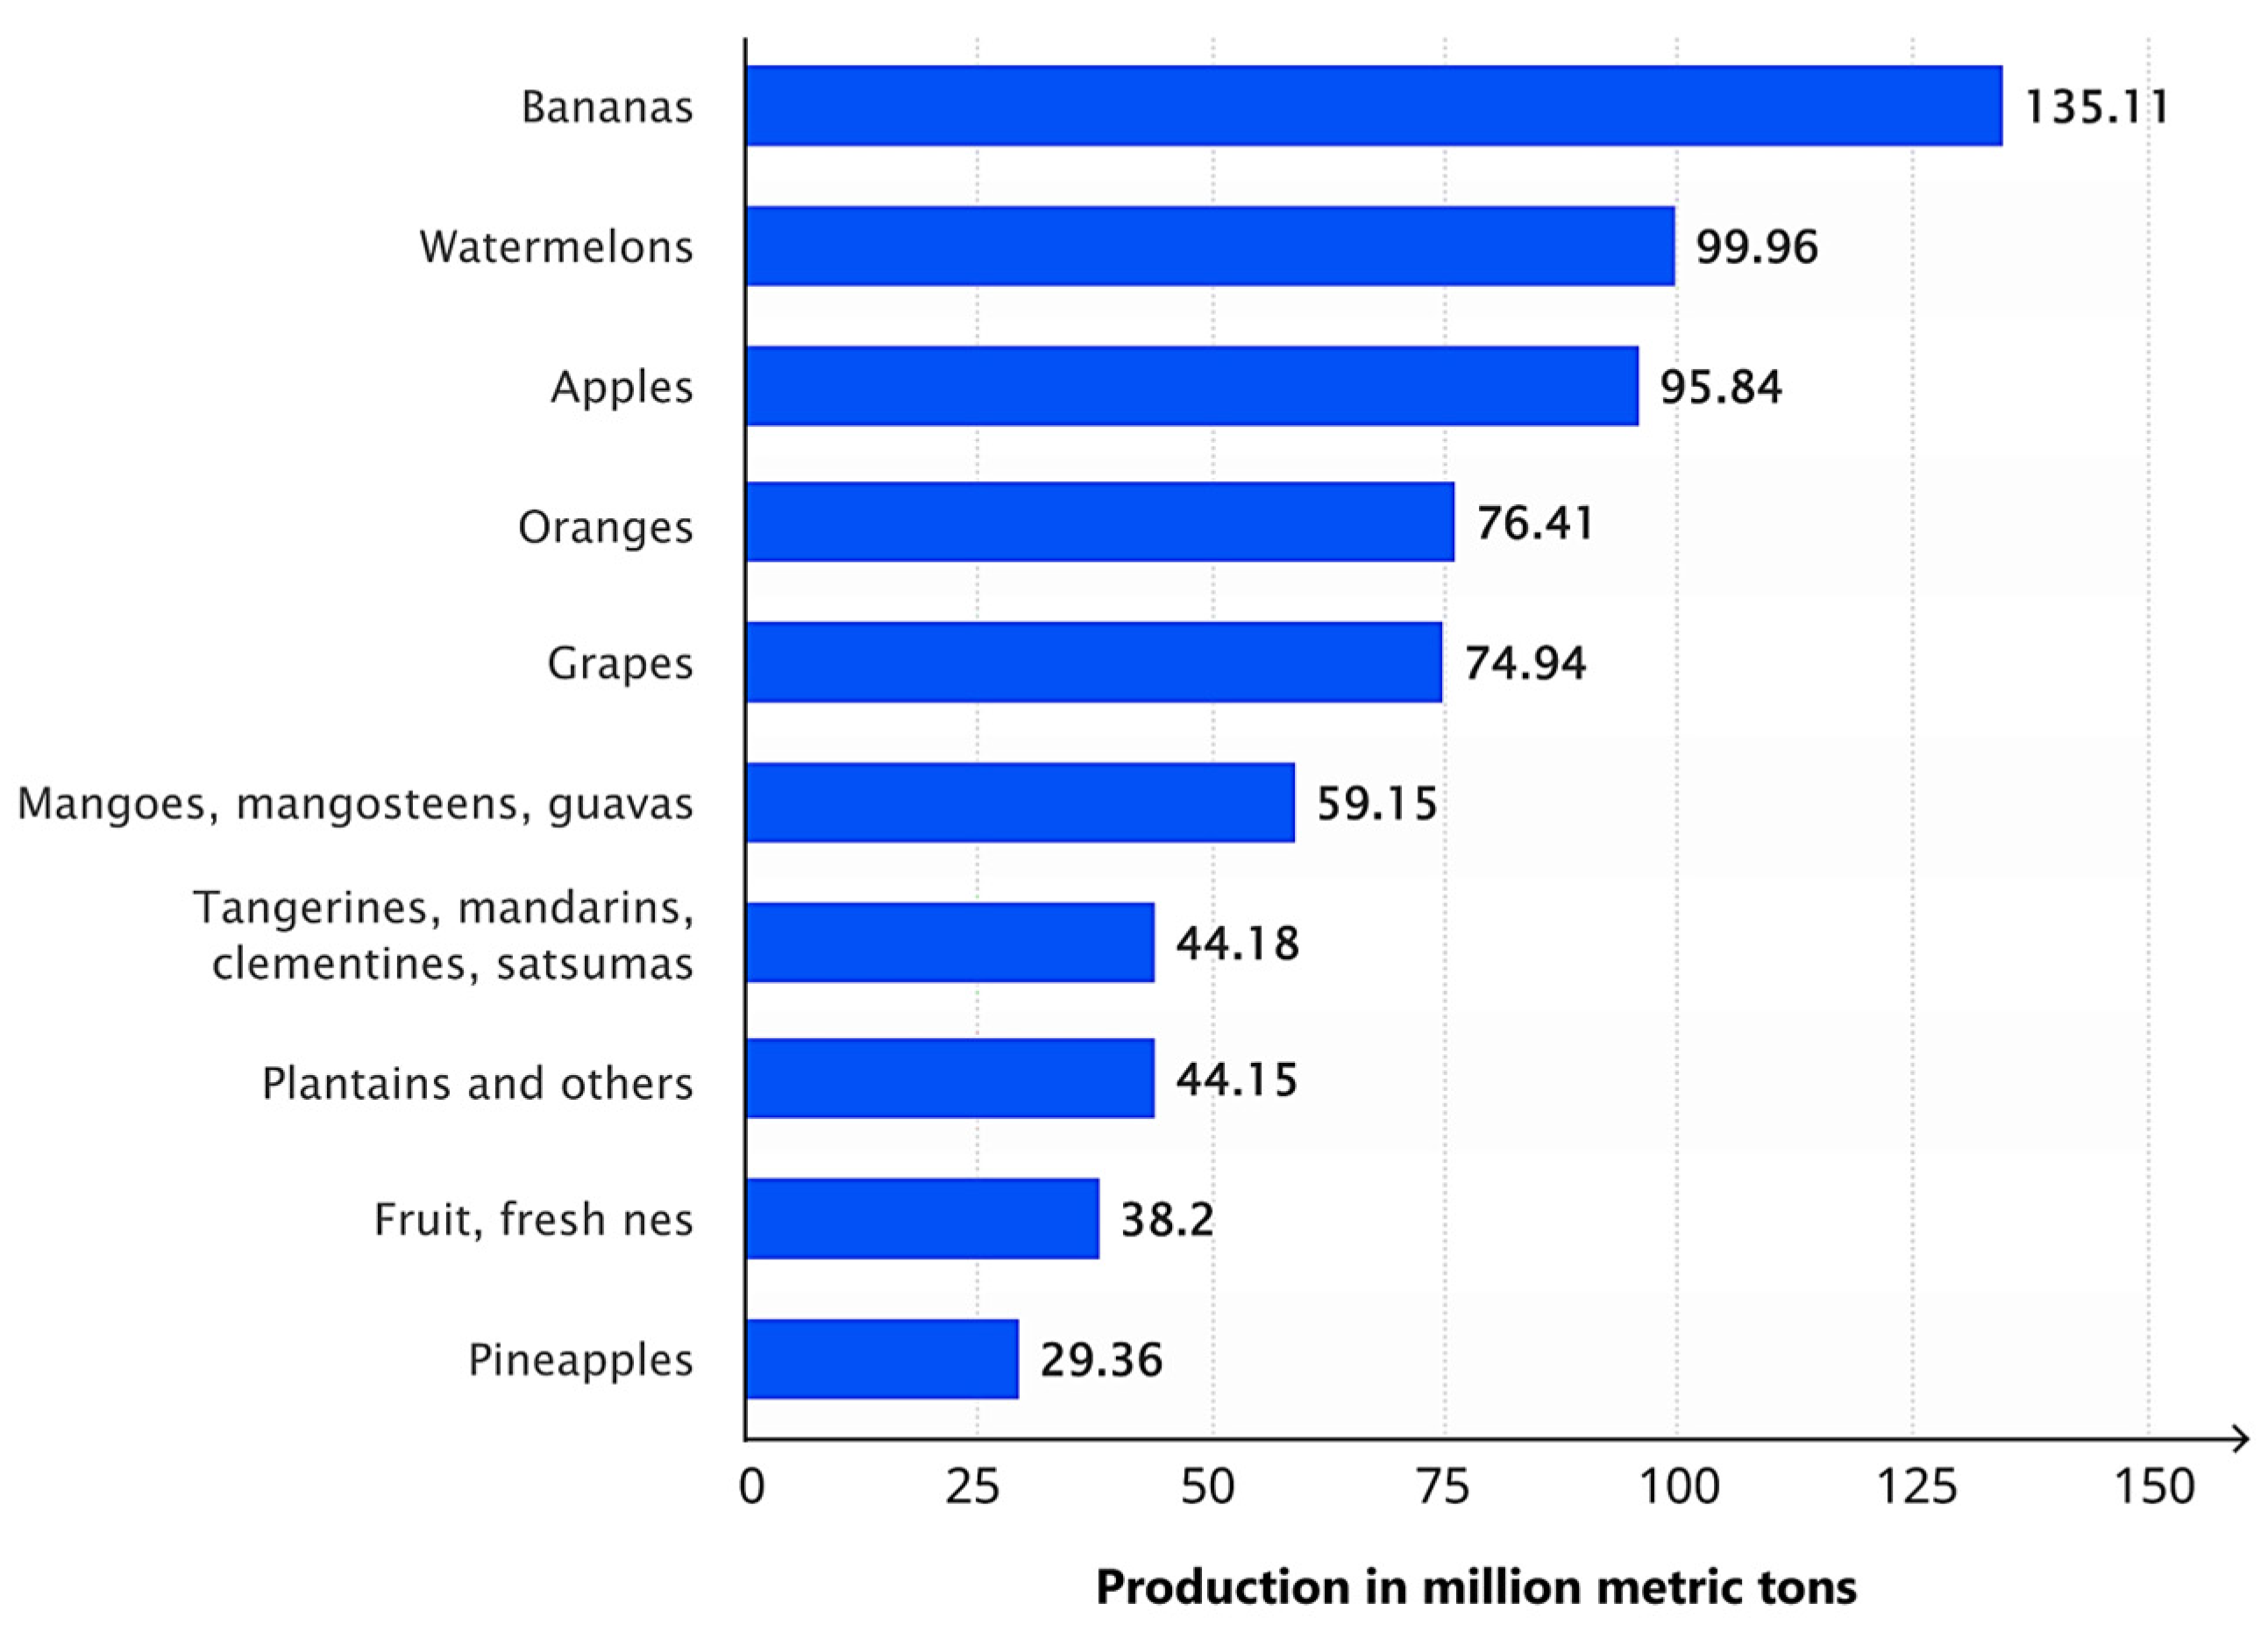
The apple (Malus domestica) is a globally significant fruit crop, widely cultivated for its high nutritional value and diverse uses, including but not limited to fresh consumption, processed products, and nutritional supplements. Its broad range of uses and health benefits make apple production economically significant in the global agricultural sector. Maintaining the health of apple trees is essential for sustaining both crop quality and yield, as apples are one of the leading contributors to global fruit production. Currently, the apple ranks as the third most produced fruit worldwide, as shown in Figure 1 [1].
The defectiveness of apple leaf specimens can cause significant crop loss and a reduction in harvest in susceptible cultivars [2]. Most of these leaf defects frequently occur due to various apple diseases [3]. The leaf defects cause discoloration and leaf loss, resulting in the early dropping of fruits. Therefore, these leaf defects should be identified at an early stage and controlled to maintain apple yield. With the increasing demand for fruit quality assurance and growing interest in fruit security, non-destructive, accurate, cost effective, and reliable inspection methods have gained strong demand and attention in agriculture. Effectively controlling leaf defects requires prompt detection methods that can identify symptoms in their early stages.

Figure 1.
Global fruit production in 2022, showing the top 10 varieties in million metric tons (MMT) (Adapted from [4]).
Figure 1.
Global fruit production in 2022, showing the top 10 varieties in million metric tons (MMT) (Adapted from [4]).
Initial identification of plant diseases is mainly based on direct manual visual observation. However, it is often subjective and inaccurate, leading to improper management. Current Early Detection Technologies (EDTs), such as Polymerase Chain Reaction (PCR) and real-time PCR, are effective for identifying pathogens through DNA amplification [5]. Despite that, they require prior knowledge of pathogen sequences and are influenced by factors such as DNA extraction quality and reagent conditions. Although DNA sequencing is important for pathogen detection, it is limited by cost, time, technical requirements, and infrastructure. Spectroscopy methods, such as hyperspectral imaging and Near-Infrared Spectroscopy (NIR), can detect disease-specific signatures but are hindered by their complexity and cost.
Other methods include immunological techniques such as Immunofluorescence Assay (IFA) and Enzyme-Linked Immunosorbent Assay (ELISA), which detect pathogen-specific antibodies or antigens, although they have limitations in sensitivity and accuracy. Lateral Flow Immunoassay (LFIA) offers fast, field-friendly testing but lower precision, while microscopy allows detailed examination but is time-consuming and equipment-intensive. Advanced techniques such as Flow Cytometry (FCM) and Fluorescence In Situ Hybridization (FISH) provide high sensitivity and multi-parameter analysis. However, they face challenges such as autofluorescence, photobleaching, and high costs [6]. Sensor-based technologies, including remote sensing, monitor environmental and physiological conditions, though they may not detect diseases at the microscopic level [7]. Biomarkers indicate disease stress but may not offer real-time detection.
Plant inspection technologies that enable in vivo imaging have commonly included Magnetic Resonance Imaging (MRI), X-rays, Positron Emission Tomography (PET), and confocal microscopy [8,9]. However, their applicability has been limited due to the low resolution and slow image acquisition speed. Table 1 summarizes a comprehensive comparison of several plant disease detection methods.

Table 1.
Current available methods for detecting plant diseases induced by pathogens.
These potential challenges highlight the rising demand for the development of a non-invasive optics-incorporated, high-resolution imaging method, which generates real-time visualizations to detect plant diseases in the agriculture sector.
Among growing trends in imaging techniques, OCT is robust imaging technique capable of capturing both two-dimensional (2D) and three-dimensional (3D) images in micrometer scale resolutions [10]. The significant imaging depth, high resolution, high sensitivity, and rapid acquisition speed of OCT make it an effective technique, extensively used in the past decade for identifying plant diseases, monitoring growth, and assessing microbiological parameters [11,12,13,14,15]. Moreover, several reports have revealed the successful applications of OCT for the morphological analysis of plant tissues, highlighting its utility in plant disease detection [15,16,17,18].
The aim of this study was to explore the morphological differences between healthy and defective apple leaf specimens at an initial stage. An intensity detection simulation integrated with optical cross-sectional modeling, known as OCT, was developed as a non-destructive imaging model that provides cross-sectional and depth-resolved quantitative information.
2. Materials and Methods
2.1. Preparation of Plant Materials for Disease Detection
The apple leaf specimens used in the experiment were collected from apple orchards in Sangju, Gyeongbuk Province, Korea. To investigate morphological variations, the specimens were collected at random from both healthy and infected trees. The experiment was conducted within 2 h of sample collection to preserve the biological integrity of the specimens.
2.2. Optical Cross-Sectional Modeling Method
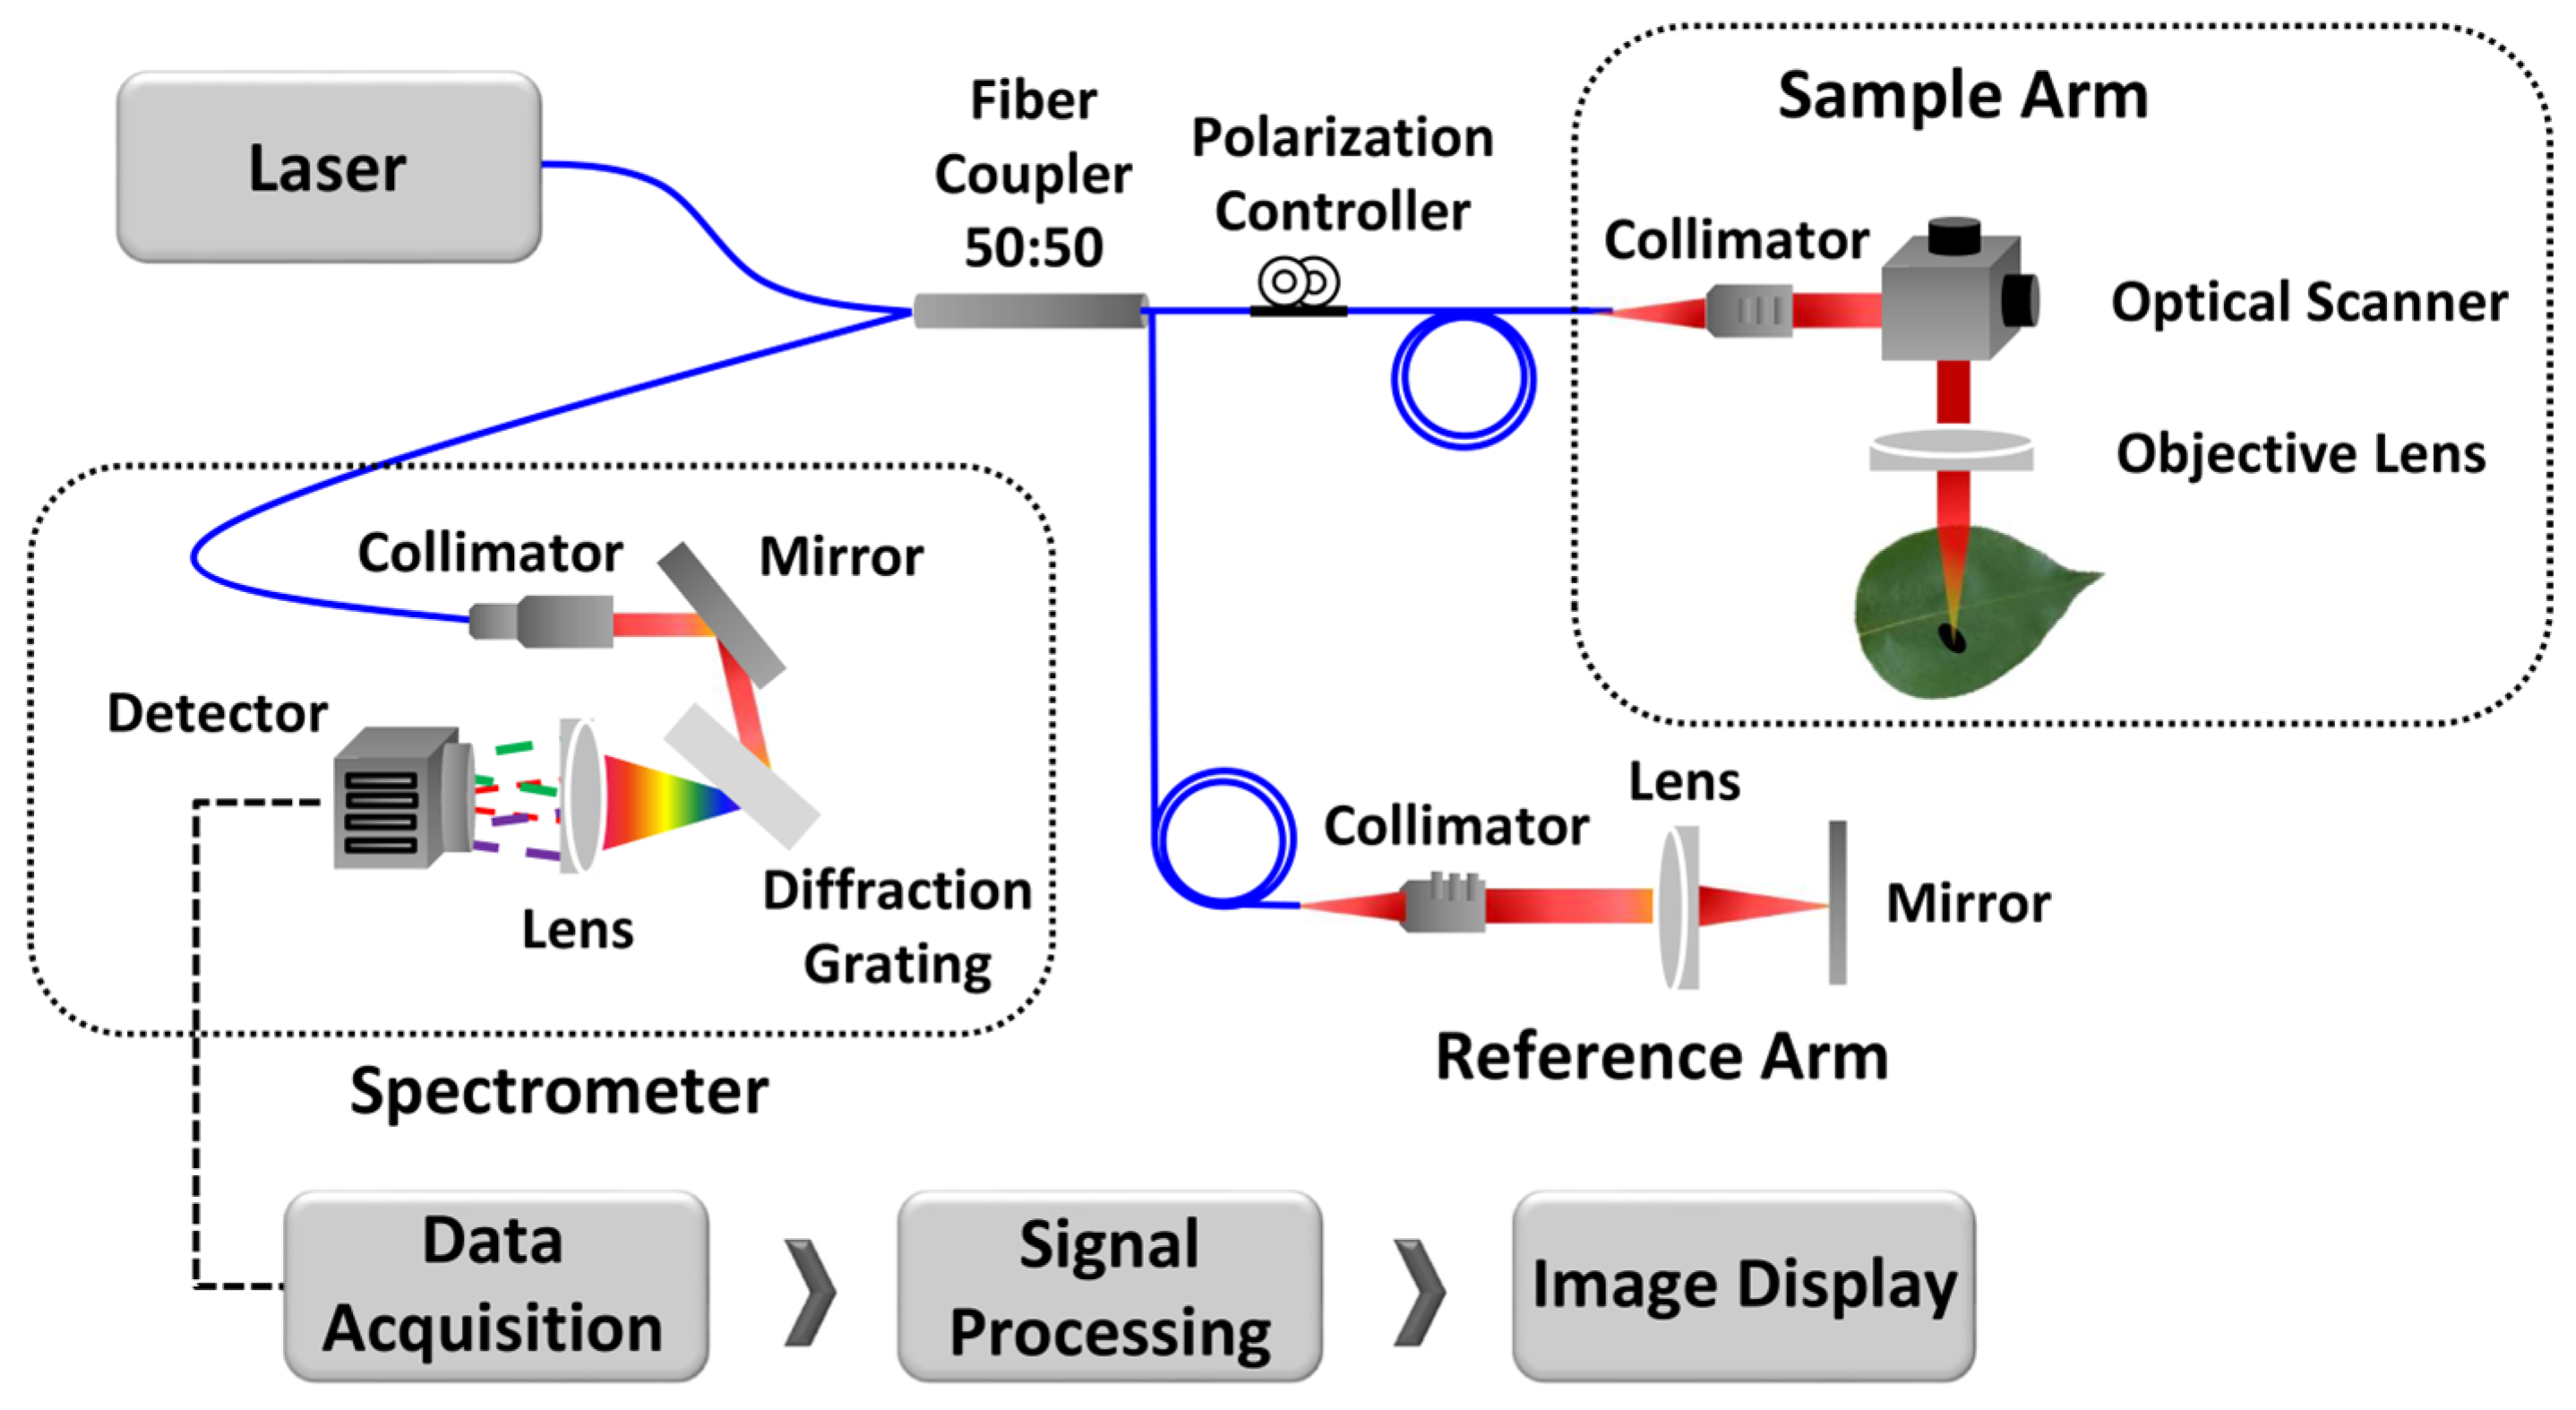
The schematic representation of the custom Spectral Domain OCT (SD-OCT) system for optical cross-sectional modeling is illustrated in Figure 2. The system uses a broadband laser light source (λo = 840 nm, EXALOS AG, Schlieren, Switzerland) with a Full Width at Half Maximum (FWHM) of 65 nm. The laser beam is divided into reference and sample paths using a 50:50 optical fiber coupler. A galvanometer-based optical scanner is used for the transverse scanning of leaf samples. Backscattered signals from both the sample and reference paths are interfered with at the coupler and detected by a 4096-pixel line scan camera (spL4096-140 km, Basler, Ahrensburg, Germany).
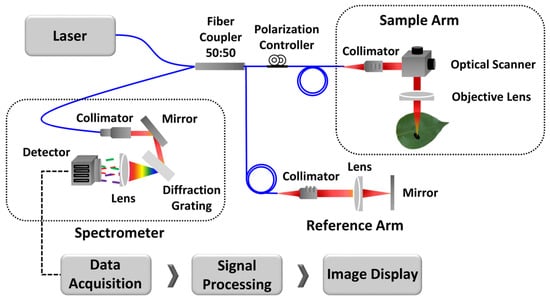
Figure 2.
The schematic of the optical cross-sectional modeling method.
To distribute the light components at the detection end, a transmission-type diffraction grating with a spatial frequency of 1200 lp/mm (Wasatch Photonics, Logan, UT, USA) and a nominal diffraction angle of 46.05° is used. A wavenumber linearization technique is applied to enhance axial resolution and signal sensitivity, thereby improving the Signal-to-Noise Ratio (SNR) and correcting for any distortion in the Point Spread Function (PSF). During the scanning, cross-sectional images of the specimens are captured, focusing on healthy samples from unaffected trees, seemingly healthy leaves from infected trees, and defective samples from infected trees.
2.3. Intensity Detection Simulation Technique
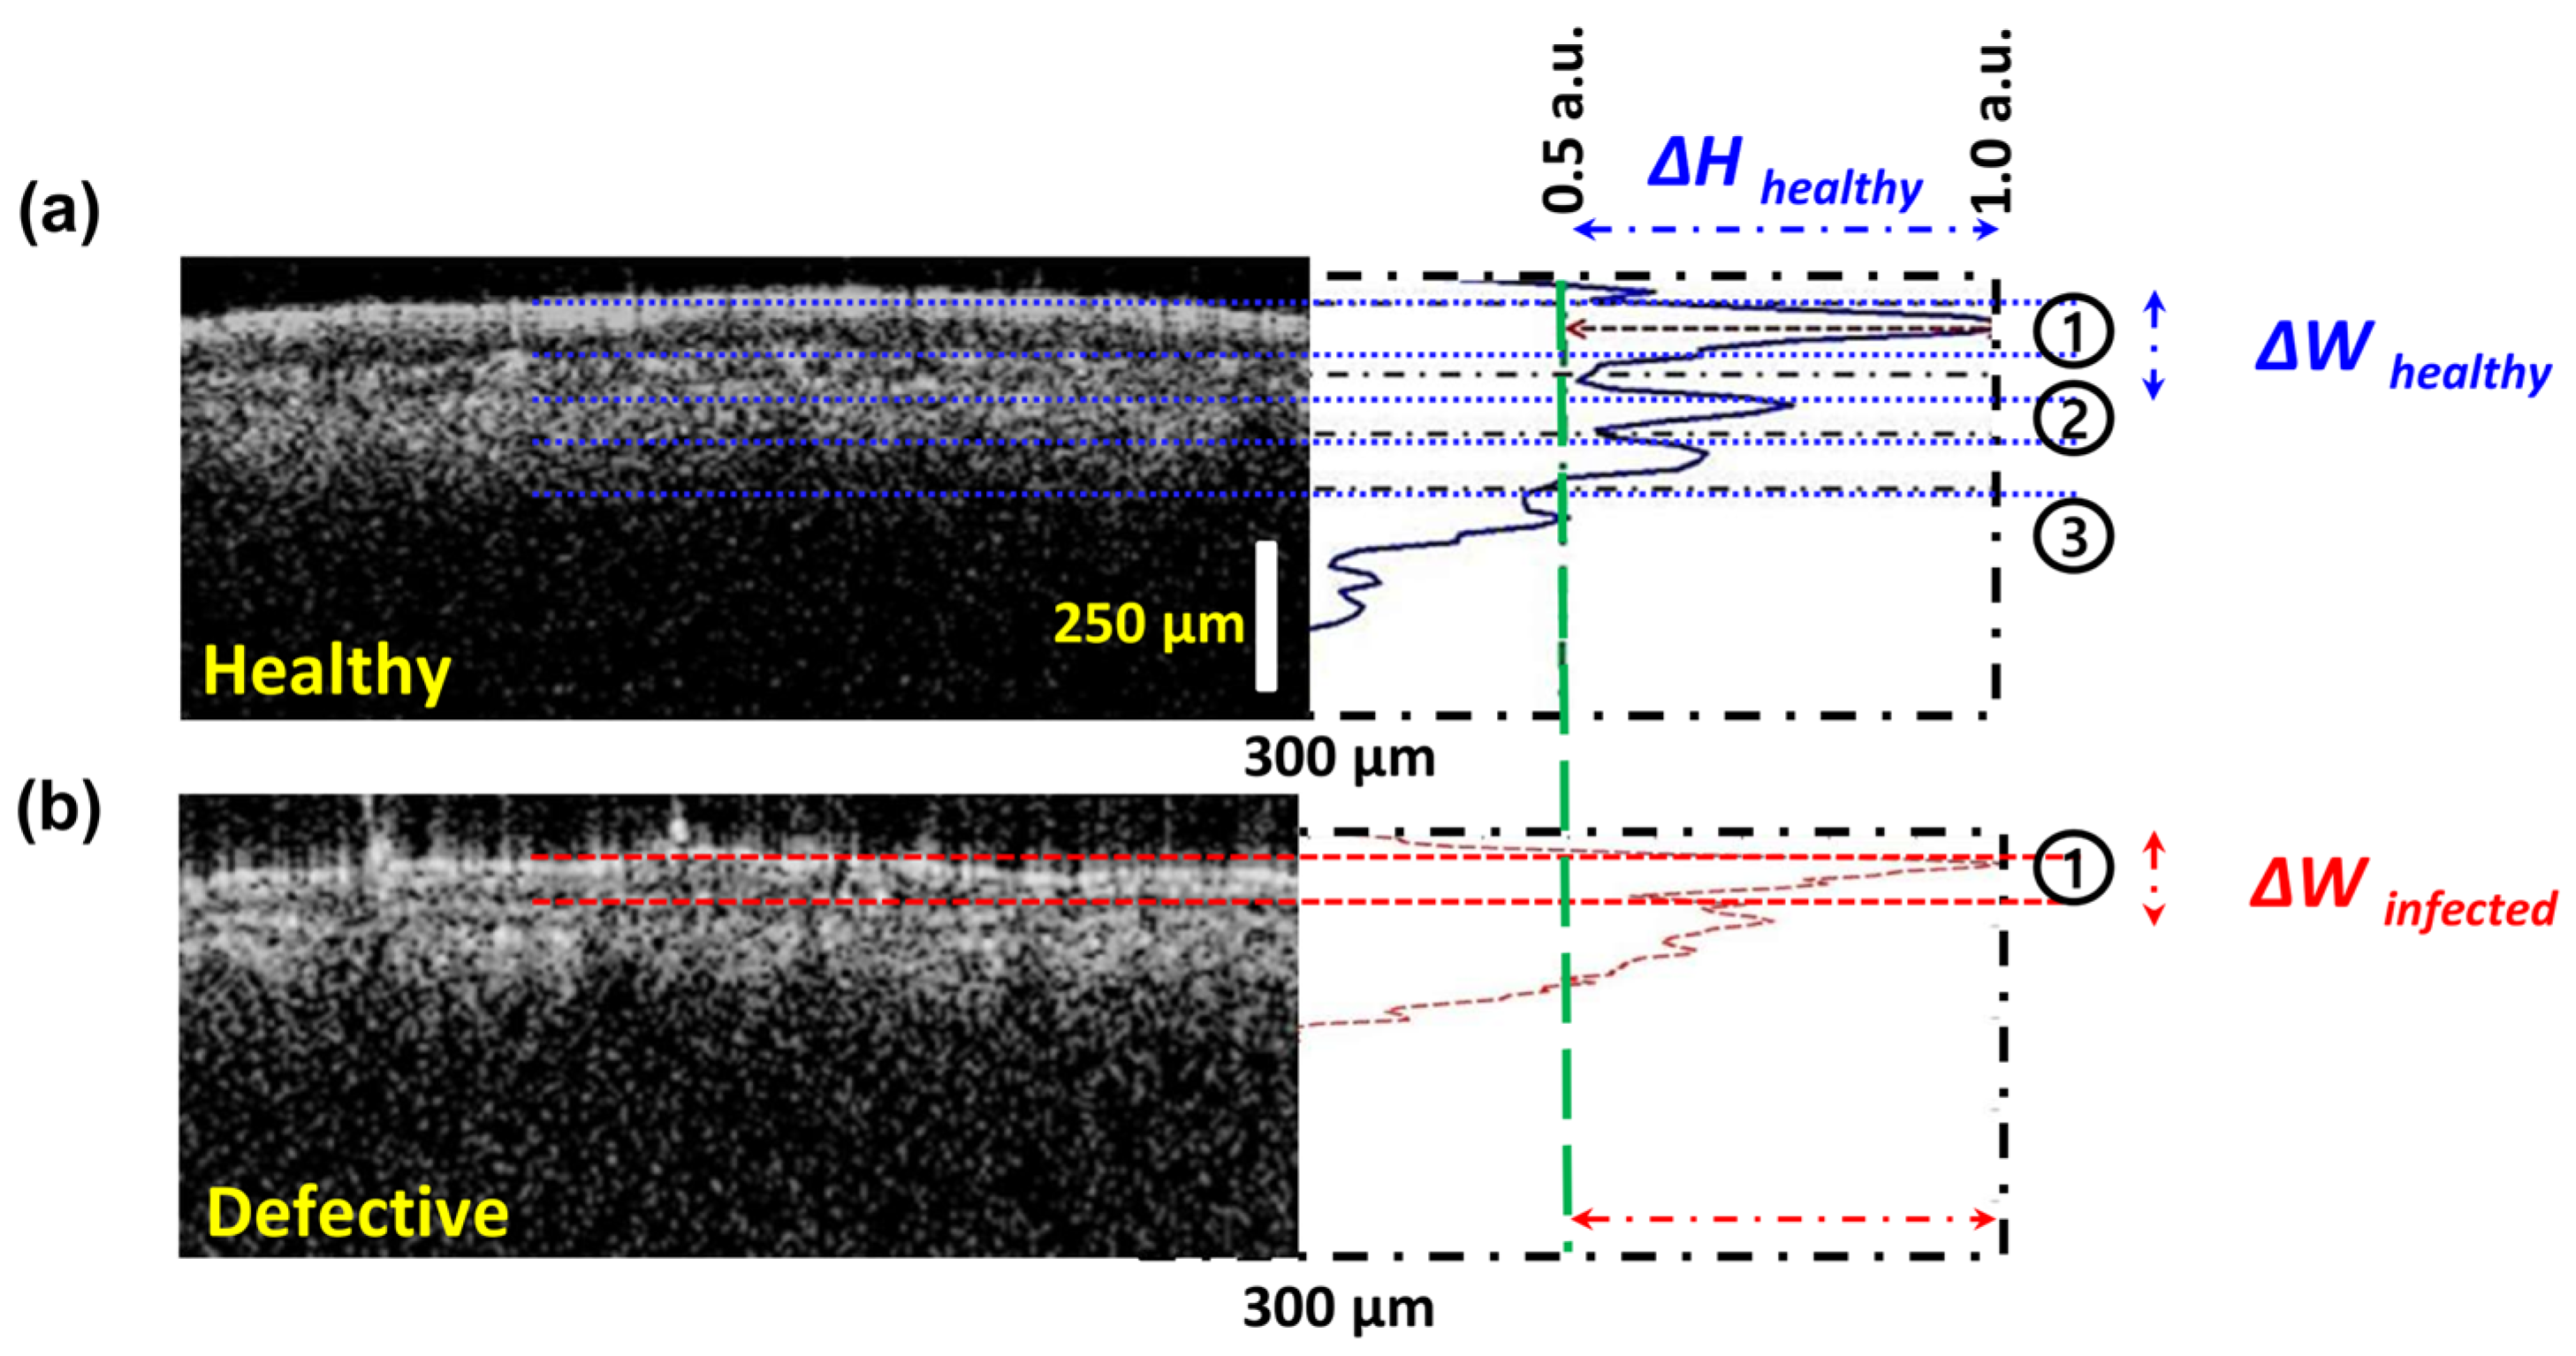
The intensity detection simulation technique was primarily developed based on the OCT signal intensity from the amplitude scan (A-scan) depth profile, acquired through the multi-layered structure and variations in the absorption coefficient. Figure 3 shows the comparison of amplitude depth scans obtained from healthy (Figure 3a) and defective (Figure 3b) apple leaf specimens. The data from each blue and red peak correspond to the characteristics of the individual layers of the leaf specimens. The indicated ΔH specifies the peak height information of healthy layers, while ΔW indicates the peak width information of these layers.
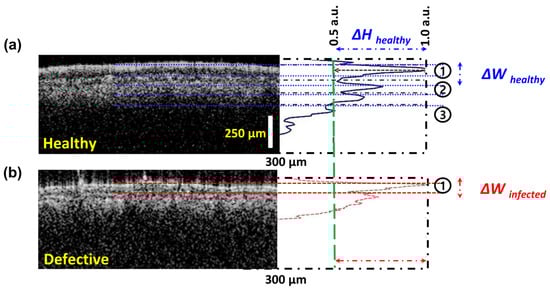
Figure 3.
Graphical description of the intensity detection simulation technique using OCT images and corresponding intensity profiles of (a) healthy and (b) defective tissue, illustrating differences in layered structure and intensity profile width (ΔW) and height (ΔH).
For the A-scan depth profiles, a refractive index of 1.42 was used. An automated intensity detection algorithm, developed with C++, was implemented to identify corresponding intensity positions along the depth axis in all collected 2D OCT images. Due to the physical characteristics of the leaf samples, the 2D OCT images were initially unflat-tened. During the inspection phase, a cropped window containing 50 intensity signals (OCT axial intensity lines) was applied in real-time to establish the Region of Interest (ROI). The algorithm systematically detected the peak intensity in each A-scan line. The identified maximum intensity positions from all 50 A-scan lines were then rearranged and indexed linearly to create a flattened 2D OCT image. Finally, the A-scan lines within this flattened 2D OCT area were combined and averaged to generate a single average signal intensity plot, which is further detailed in Section 3.
3. Results and Discussion
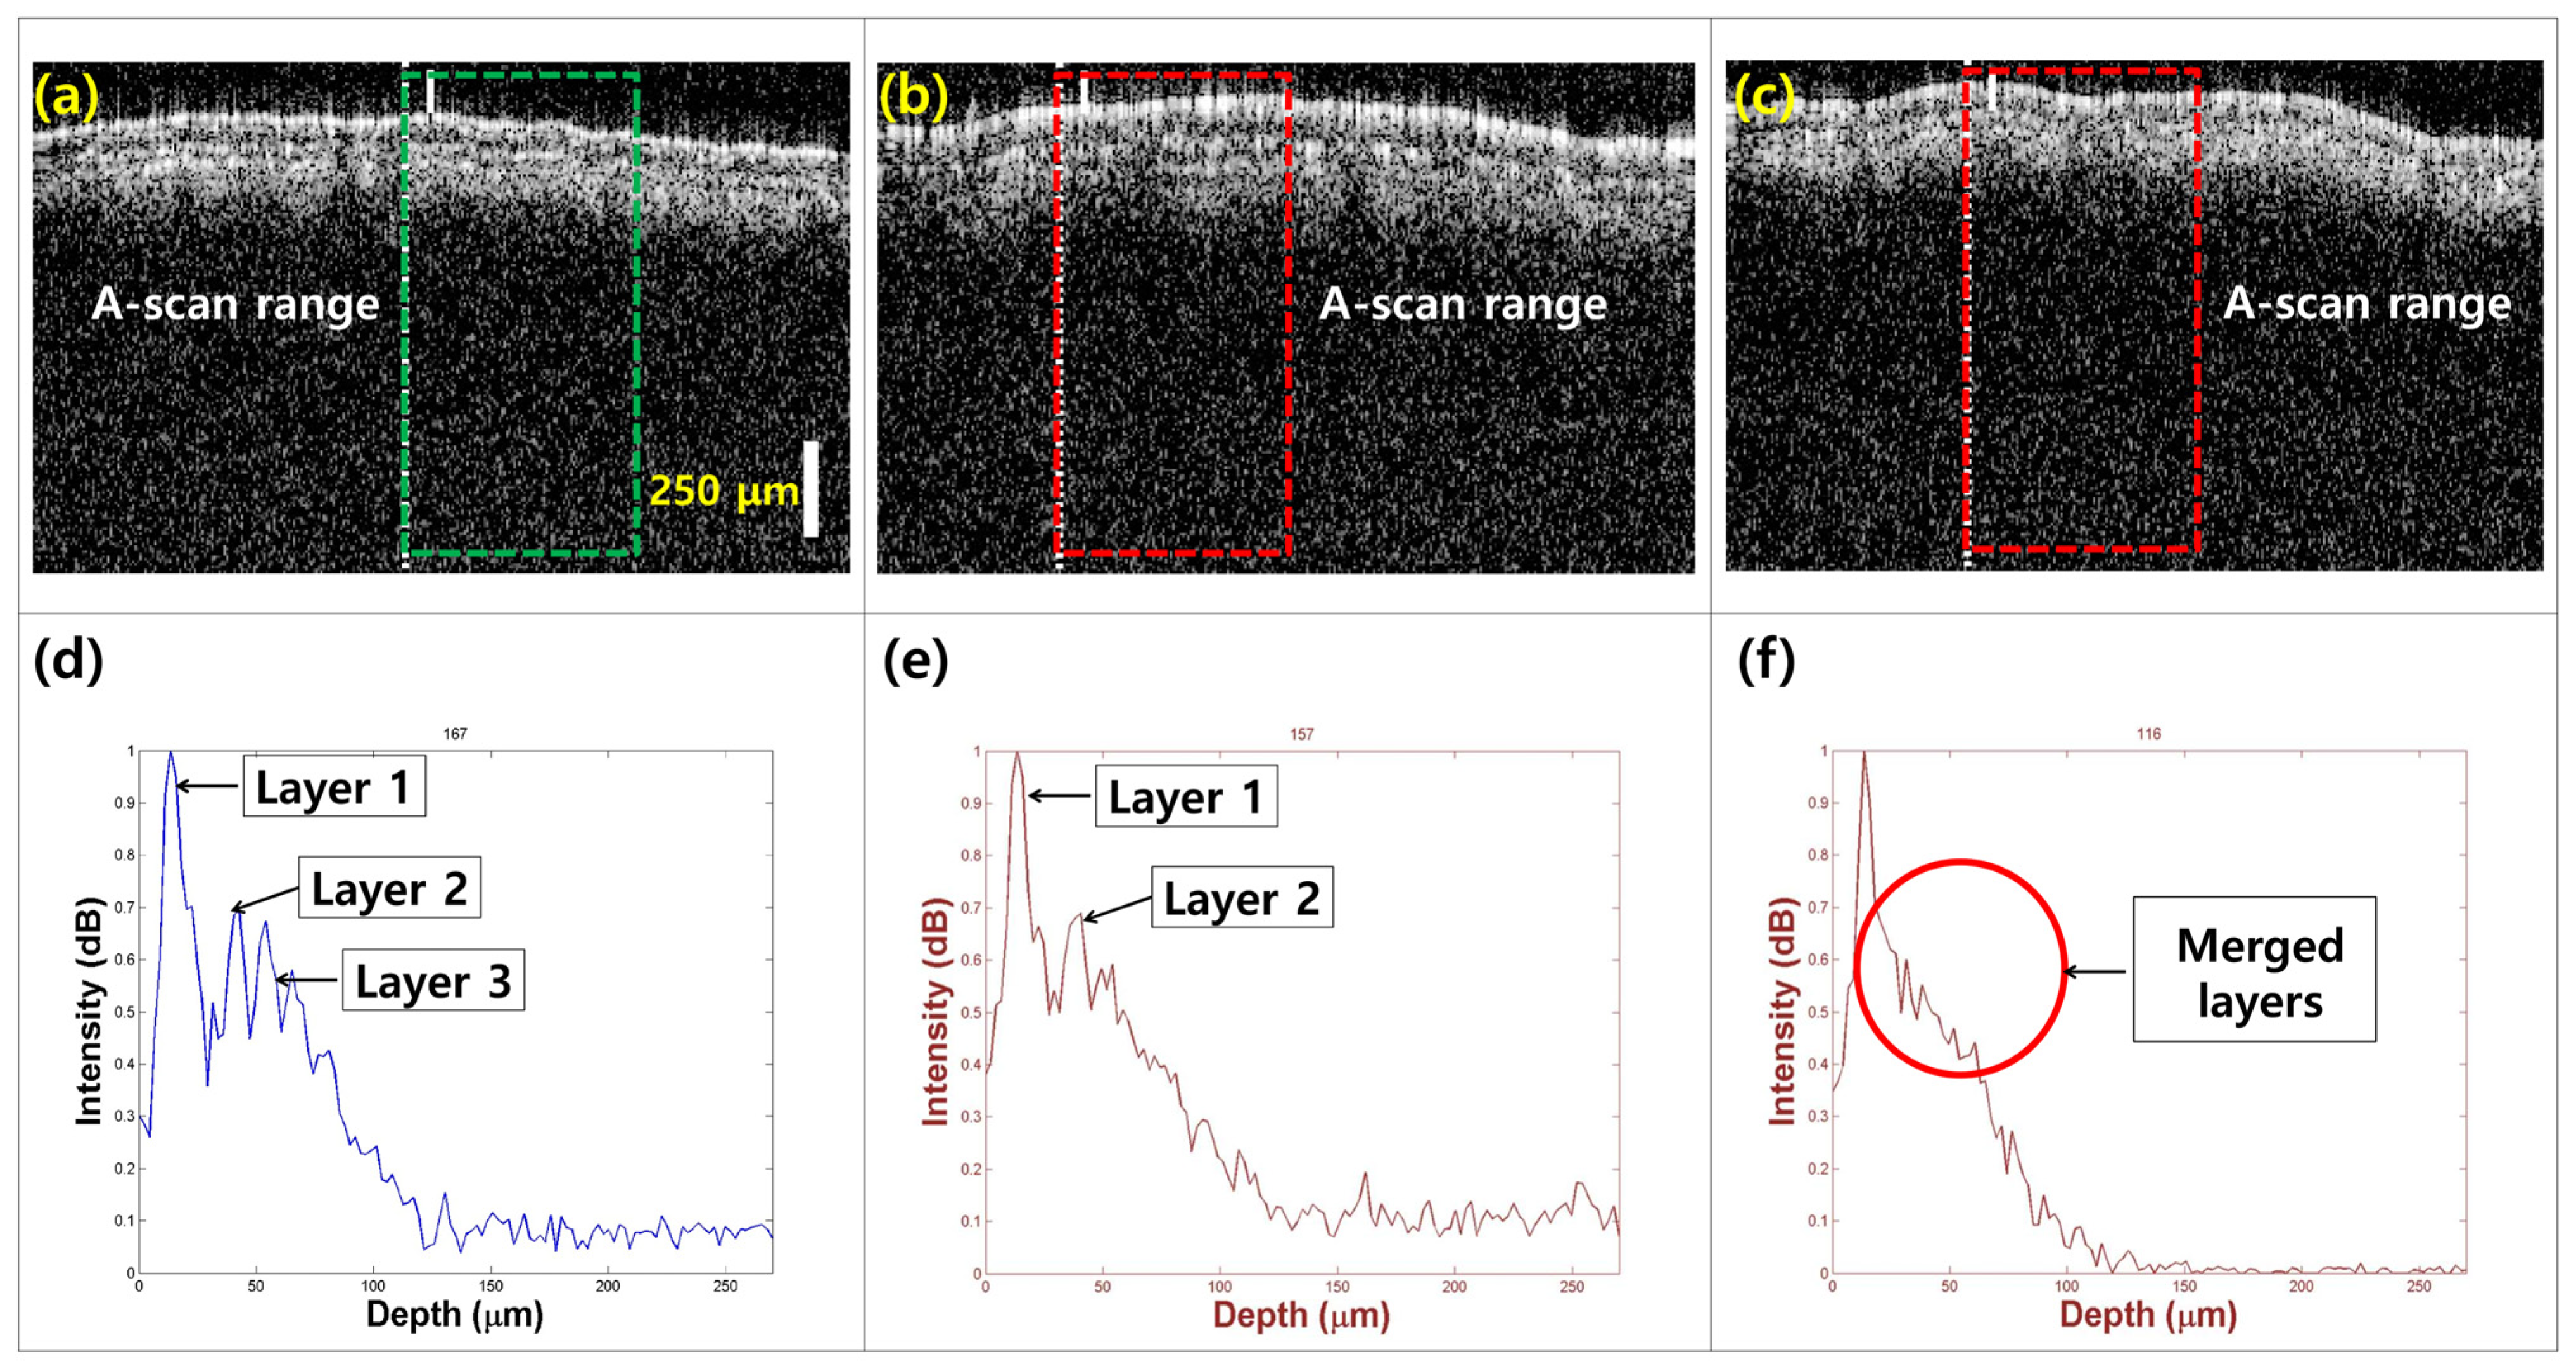
To characterize the morphological variations in the three leaf categories, cross-sectional images were captured using OCT imaging. Figure 4 compares the models of healthy leaves (Figure 4a), seemingly healthy leaves from infected trees (Figure 4b), and defective leaves (Figure 4c). The rectangular regions indicate the ROI in the intensity detection simulation. In healthy specimens, distinct leaf layers are clearly visible (Figure 4a). In contrast, the layers appear defective in seemingly healthy specimens from infected trees (Figure 4b). The third defective leaf category shows further loss of layer detail, with the formation of a single merged layer (Figure 4c).
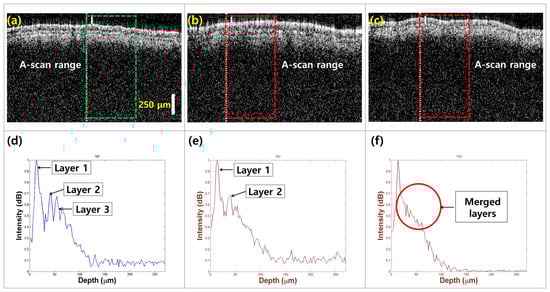
Figure 4.
The morphological and depth direction intensity comparison between (a) healthy leaf specimens, (b) apparently healthy leaf specimens from infected trees, and (c) defective leaf specimens. Depth profile comparison showing signal peak intensity variations and layer information for (d) healthy, (e) apparently healthy, and (f) defective leaf specimens.
Figure 4d–f shows a comparative visualization of intensity detection depth profiles for healthy, apparently healthy, and defective leaves, revealing significant variations in peak intensity and the number of identifiable peaks. In Figure 4d, the depth profile for healthy leaf samples shows multiple peaks, with the first peak corresponding to the top layer of the leaf. This allows for the identification of three visible layers (layer 1 to layer 3), showing that the optical properties of healthy leaves facilitate effective imaging and analysis. The entire leaf structure can be detected within a depth range of 100 μm, indicating that healthy specimens maintain their structural integrity and optical clarity. In contrast, Figure 4e presents the depth profile for apparently healthy leaf specimens, with a marked reduction in the number of visible layers. This finding suggests that although these leaves appear healthy externally, underlying structural changes may be occurring, potentially indicating early stages of infection or stress. The diminishing depth information further emphasizes the need for careful monitoring of such specimens, as the loss of layer detail could compromise overall leaf health and function. Figure 4f illustrates the depth profile of defective specimens, limited to only 25 μm, indicating a significant reduction in depth range. The profiles show a pronounced merging of the leaf layers into a single peak, indicating a loss of distinct structural integrity. This result reinforces the hypothesis that defective leaves show considerable morphological changes due to disease or environmental stress, affecting their optical properties and, consequently, their viability.
These qualitative and quantitative analyses demonstrate a clear correlation between the OCT images and the intensity detection simulation depth profiles. The ability to distinguish between healthy, apparently healthy, and defective leaf specimens based on depth profile characteristics underscores the potential of this method for the early detection of leaf defects. Implementing this technique in practical settings could enhance the accuracy of disease diagnosis in apple orchards, enabling timely interventions that may reduce crop loss and improve harvest quality.
4. Conclusions
Quantitative and morphological analyses offer significant advantages for diagnostic evaluations of plant material defects. This study investigated the capability of an intensity detection simulation integrated with an optical cross-sectional modeling method called OCT to assess the quality of apple leaf specimens collected from plantations in Korea. The depth-direction intensity detections and optical cross-sectional models demonstrated that this imaging modality effectively diagnoses and distinguishes defective apple leaf specimens from healthy ones through cross-sectional thickness analysis, a distinction that is not possible with visual inspection alone. Thus, the proposed method presents an ideal solution for detecting defective leaf specimens, facilitating effective disease management in apple cultivation and leading to fruitful outcomes in the agricultural industry.
Author Contributions
Conceptualization, M.J. and J.K.; methodology, S.H., D.S., and R.E.W.; software, D.K. and N.S.K.; validation, R.E.W.; formal analysis, B.N.S.; investigation, R.E.W., M.J., and J.K.; resources, U.W., M.J., and J.K.; data curation, S.H., D.S., J.K., and M.J.; writing—original draft preparation, R.E.W., N.S.K.; and D.K.; writing—review and editing, H.M., N.S.K., and R.E.W.; visualization, R.E.W. and N.S.K.; supervision, R.E.W. and U.W.; project administration, R.E.W.; funding acquisition, U.W., R.E.W., and B.N.S. All authors have read and agreed to the published version of the manuscript.
Funding
This research was supported by the Science and Technology Human Resource Development Project, Ministry of Education, Sri Lanka, funded by the Asian Development Bank (Grant No. STHRD/CRG/R3/SJ/07) research grant funded by the University of Sri Jayewardenepura, Sri Lanka (Grant No: ASP/01/RE/ENG/2022/86), and research grants funded by the Sri Lanka Institute of Information Technology, Sri Lanka (Grant Nos. PVC(R&D)RG/2024/13 and PVC(R&D)RG/2024/16).
Institutional Review Board Statement
Not applicable.
Informed Consent Statement
Not applicable.
Data Availability Statement
Dataset available on request from the authors.
Conflicts of Interest
The authors declare no conflicts of interest.
References
- Girotto, O.S.; Furlan, O.O.; Moretti Junior, R.C.; Goulart, R.d.A.; Baldi Junior, E.; Barbalho-Lamas, C.; Fornari Laurindo, L.; Barbalho, S.M. Effects of Apples (Malus domestica) and Their Derivatives on Metabolic Conditions Related to Inflammation and Oxidative Stress and an Overview of by-Products Use in Food Processing. Crit. Rev. Food Sci. Nutr. 2024, 1–32. [Google Scholar] [CrossRef] [PubMed]
- Tamietti, G.; Matta, A. First Report of Leaf Blotch Caused by Marssonina Coronaria on Apple in Italy. Plant Dis. 2003, 87, 1005. [Google Scholar] [CrossRef] [PubMed]
- Sulaiman, A.; Anand, V.; Gupta, S.; Alshahrani, H.; Reshan, M.S.A.; Rajab, A.; Shaikh, A.; Azar, A.T. Sustainable Apple Disease Management Using an Intelligent Fine-Tuned Transfer Learning-Based Model. Sustainability 2023, 15, 13228. [Google Scholar] [CrossRef]
- Fruit: World Production by Type. 2022. Available online: https://www.statista.com/statistics/264001/worldwide-production-of-fruit-by-variety/ (accessed on 18 September 2024).
- Gautam, A.K.; Kumar, S. Chapter 12—Techniques for the Detection, Identification, and Diagnosis of Agricultural Pathogens and Diseases. In Natural Remedies for Pest, Disease and Weed Control; Egbuna, C., Sawicka, B., Eds.; Academic Press: Cambridge, MA, USA, 2020; pp. 135–142. ISBN 978-0-12-819304-4. [Google Scholar]
- Fang, Y.; Ramasamy, R.P. Current and Prospective Methods for Plant Disease Detection. Biosensors 2015, 5, 537–561. [Google Scholar] [CrossRef]
- Abdhul Rahuman, M.A.; Kahatapitiya, N.S.; Amarakoon, V.N.; Wijenayake, U.; Silva, B.N.; Jeon, M.; Kim, J.; Ravichandran, N.K.; Wijesinghe, R.E. Recent Technological Progress of Fiber-Optical Sensors for Bio-Mechatronics Applications. Technologies 2023, 11, 157. [Google Scholar] [CrossRef]
- Minker, K.R.; Biedrzycki, M.L.; Kolagunda, A.; Rhein, S.; Perina, F.J.; Jacobs, S.S.; Moore, M.; Jamann, T.M.; Yang, Q.; Nelson, R.; et al. Semiautomated Confocal Imaging of Fungal Pathogenesis on Plants: Microscopic Analysis of Macroscopic Specimens. Microsc. Res. Tech. 2018, 81, 141–152. [Google Scholar] [CrossRef]
- Narvankar, D.S.; Singh, C.B.; Jayas, D.S.; White, N.D.G. Assessment of Soft X-Ray Imaging for Detection of Fungal Infection in Wheat. Biosyst. Eng. 2009, 103, 49–56. [Google Scholar] [CrossRef]
- Wijesinghe, R.E.; Kahatapitiya, N.S.; Lee, C.; Han, S.; Kim, S.; Saleah, S.A.; Seong, D.; Silva, B.N.; Wijenayake, U.; Ravichandran, N.K.; et al. Growing Trend to Adopt Speckle Variance Optical Coherence Tomography for Biological Tissue Assessments in Pre-Clinical Applications. Micromachines 2024, 15, 564. [Google Scholar] [CrossRef]
- Saleah, S.A.; Lee, S.-Y.; Wijesinghe, R.E.; Lee, J.; Seong, D.; Ravichandran, N.K.; Jung, H.-Y.; Jeon, M.; Kim, J. Optical Signal Intensity Incorporated Rice Seed Cultivar Classification Using Optical Coherence Tomography. Comput. Electron. Agric. 2022, 198, 107014. [Google Scholar] [CrossRef]
- Saleah, S.A.; Kim, S.; Luna, J.A.; Wijesinghe, R.E.; Seong, D.; Han, S.; Kim, J.; Jeon, M. Optical Coherence Tomography as a Non-Invasive Tool for Plant Material Characterization in Agriculture: A Review. Sensors 2024, 24, 219. [Google Scholar] [CrossRef] [PubMed]
- Kim, H.; Du, X.; Kim, S.; Kim, P.; Wijesinghe, R.E.; Yun, B.-J.; Kim, K.-M.; Jeon, M.; Kim, J. Non-Invasive Morphological Characterization of Rice Leaf Bulliform and Aerenchyma Cellular Regions Using Low Coherence Interferometry. Appl. Sci. 2019, 9, 2104. [Google Scholar] [CrossRef]
- Ravichandran, N.K.; Wijesinghe, R.E.; Shirazi, M.F.; Kim, J.; Jung, H.-Y.; Jeon, M.; Lee, S.-Y. In Vivo Non-Destructive Monitoring of Capsicum Annuum Seed Growth with Diverse NaCl Concentrations Using Optical Detection Technique. Sensors 2017, 17, 2887. [Google Scholar] [CrossRef]
- Wijesinghe, R.E.; Lee, S.-Y.; Ravichandran, N.K.; Shirazi, M.F.; Moon, B.; Jung, H.-Y.; Jeon, M.; Kim, J. Bio-Photonic Detection Method for Morphological Analysis of Anthracnose Disease and Physiological Disorders of Diospyros Kaki. Opt. Rev. 2017, 24, 199–205. [Google Scholar] [CrossRef]
- Wijesinghe, R.E.; Lee, S.-Y.; Kim, P.; Jung, H.-Y.; Jeon, M.; Kim, J. Optical Inspection and Morphological Analysis of Diospyros Kaki Plant Leaves for the Detection of Circular Leaf Spot Disease. Sensors 2016, 16, 1282. [Google Scholar] [CrossRef]
- Wijesinghe, R.; Lee, S.-Y.; Ravichandran, N.K.; Han, S.; Jeong, H.; Han, Y.; Jung, H.-Y.; Kim, P.; Jeon, M. Optical Coherence Tomography-Integrated, Wearable (Backpack-Type), Compact Diagnostic Imaging Modality for in Situ Leaf Quality Assessment. Appl. Opt. 2017, 56, D108. [Google Scholar] [CrossRef] [PubMed]
- Kalupahana, D.; Kahatapitiya, N.S.; Silva, B.N.; Kim, J.; Jeon, M.; Wijenayake, U.; Wijesinghe, R.E. Dense Convolutional Neural Network-Based Deep Learning Pipeline for Pre-Identification of Circular Leaf Spot Disease of Diospyros Kaki Leaves Using Optical Coherence Tomography. Sensors 2024, 24, 5398. [Google Scholar] [CrossRef] [PubMed]
Disclaimer/Publisher’s Note: The statements, opinions and data contained in all publications are solely those of the individual author(s) and contributor(s) and not of MDPI and/or the editor(s). MDPI and/or the editor(s) disclaim responsibility for any injury to people or property resulting from any ideas, methods, instructions or products referred to in the content. |
© 2024 by the authors. Licensee MDPI, Basel, Switzerland. This article is an open access article distributed under the terms and conditions of the Creative Commons Attribution (CC BY) license (https://creativecommons.org/licenses/by/4.0/).