Next Article in Journal
A Rule-Based Model for Stemming Hausa Words
Previous Article in Journal
Design Factors of Water Mist in the Mystery of Landscapes
 
 
engproc-logo
Article Menu

Article Menu

Proceeding Paper

Characterization Aluminum Spot Welding with Mesh Variations of Copper Powder Added on 40, 50, and 60 Meshing †

by
Pramuko Ilmu Purboputro
* and
Patna Partono
Mechanical Engineering Department, Faculty of Engineering, Universitas Muhammadiyah Surakarta, Surakarta 57162, Indonesia
*
Author to whom correspondence should be addressed.
Presented at the 8th Mechanical Engineering, Science and Technology International Conference, Padang Besar, Perlis, Malaysia, 11–12 December 2024.
Eng. Proc. 2025, 84(1), 89; https://doi.org/10.3390/engproc2025084089
Published: 22 April 2025

Abstract

:
This study aims to determine the effect of adding copper powder with different mesh sizes on the welding point, as well as the resulting tensile strength, micro photo and hardness. The raw material of this research is aluminum type 1100. The tests included tensile strength tests (ASME QW-4629 standard), micro photo tests with a metallographic microscope, and Vickers tests (AWS D8.9-97 standard). The results of the tensile strength test rank mesh 40 (556.38), mesh 50 (739.13) and mesh 60 (1316.10) in descending order of tensile strength. The highest value of hardness is in the fusion zone (nugget). The last heat affected zone is in the base metal area and the order of hardness is, in descending order, mesh size 60, 50, and lastly, 40. For micro images, all of the results obtained are the same because they use the same material. The widest melted area in the welding area is on the 60 mesh and it decreases proportionally with the larger meshes.

1. Introduction

The aluminum flat is one of the materials that are used in the automotive industry. Aluminum has low density and ductile characteristics. Aluminum and copper are good at withstanding corrosion, good electrical conductors, and good heat conductors; however, they are difficult to adjust in the welding process. They are easily with oxygen. Aluminum welding is weak due to the ease of cracking and porosity. It needs copper powder as a filler to help improve this material for welding processes [1].
Studies on aluminum 6061-T6 and steel AISI 304 use ultrasonic spot welding (USW) on specimens of 1.5 mm thickness, and the results are as follows: if the input of energy is low, it causes interfacial failure. But if the energy is high, it causes transverse-thickness (TTT) [2].
Adding copper powder (Cu) could accelerate heat spot welding. The extensive surface area of copper powder enhances heat transfer in proportion to voltage, current, and electrical resistance. The resulting electrical resistance is directly related to the meshing of the copper powder. In this study, we use 60, 50, and 40 meshing variations [3].
This study aims to determine the effect of adding copper powder with different mesh sizes on aluminum flat spot welding and to investigate the resulting shear tensile strength, microphotograph, and hardness. The raw material used in this research is aluminum flat type 1100 [4].
Many studies were conducted to better understand the characteristics of welding point joints. The results show that the point welding joint is basically influenced by parameters such as the current, welding time, electrode tip diameter, and emphasis force. However, other factors such as electrode deformation, corrosion, material thickness differences, and material properties can also affect the result of welding point connections [5].
In the research focusing on aluminum series 6000, as well as the research on the hardness of various series of aluminum alloys, it can be seen from the results that the highest hardness value of aluminum series 6082 is found in the fusion zone (nugget) area, followed by in the HAZ and metal [4].
In the investigation of spot-welding on austenitic stainless steel material series 304 with a thickness of 2 mm, by conducting hardness and tensile strength tests with current parameters of 7, 8 and 9 kilo VA with welding times of 10, 15 and 20 cycles, it was concluded that the point that has the highest hardness is the weld metal. In addition, with the increasing current and welding time, the diameter of nuggets also increased.
From the tensile strength test, the highest tensile strength at a current of 9 kilo VA with a welding time of 20 cycles was obtained [6].
To solve the problems related to direct spot-welding resistance connection in aluminum, a compatible transition layer is required for both sides of the material in the welding connection area. The transition layer is a sheet metal for the aluminum side, and the welding joint is made using the copper end of the spot-welding machine. The results of fatigue resistance show that the fatigue strength of the connection using the transition layer has a higher value than conventional spot-welding connections [7,8,9].
The size of the nugget has a significant influence on the strength of the welding joint. Researchers also obtained results showing that the use of filler Cu against welding connections between magnesium and steel metals increased in strength along with the increase in the diameter of nuggets and welding time, compared to welding without the use of Cu fillers [10].
Previous research has shown that material properties are important for good performance in certain environments, such as snowy conditions [11]. Similarly, in welding research, understanding how materials behave at the joint, like in spot welding, is crucial for ensuring structural integrity and performance, especially in automotive parts exposed to different climates. Additionally, research on the effect of plasma nitrocarburizing temperature on the surface hardness of commercially pure titanium shows its potential to improve wear resistance, which could boost performance and durability under some conditions, particularly in welding applications [12].
This research focuses on the development and characterization of aluminum spot welding enhanced by the addition of copper powder. Specifically, it investigates how varying mesh sizes of copper powder 40, 50, and 60 mesh affect the weld quality and performance. The goal is to determine the optimal mesh size that contributes to improved mechanical properties and structural integrity of the welded joints.

2. Methods and Materials

2.1. Materials and Device

The aluminum joint used with a spot-welding machine and was then investigated by a universal testing machine. The hardness is investigated on a Vickers hardness apparatus. The metallurgical structure was investigated using SEM. The specimen is an aluminum flat 1100 series of 3 mm thickness, used as detailed in the American Society of Mechanical Engineers standard with the code ASME QW-462.9, as shown on Figure 1.
Copper (Cu)from an electrical cable, processed by grinding into a powder, was used on 40, 50, and 60 mesh.
Figure 1. Specimen (according to the annual book of ASME QW-462.9 standard). L (length) = 101.6 mm; and W (width) = 25.4 mm.
Engproc 84 00089 g001

2.2. Procedure

The procedure of the study is detailed below:
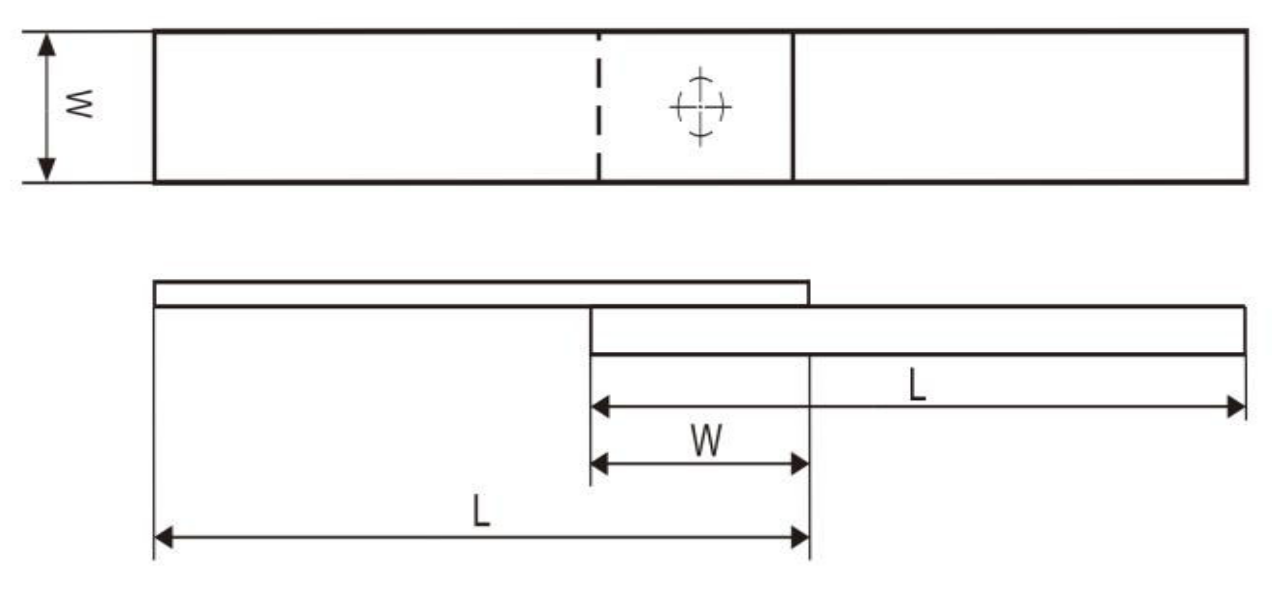
  • Cut the aluminum to obtain specimens of the ASME QW-462.9 standard, surface cleaning of the aluminum to avoid the formation of aluminum oxide on the surface.
  • The joint was formed through spot welding while secured in a clamped chuck.
  • Adjust the current and time parameters on the spot-welding apparatus.
  • Adjust the current to 9500 amperes for 8 s, while adding copper powder on the surface of the aluminum flat with 40, 50 and 60 meshes.
  • Operate spot welding for 8 s.

3. Results and Discussion

The Figure 2 above shows that the larger the value of the mesh/the smaller the size of copper, the higher the tensile strength This is because, during the welding process, copper with a smaller size fused with the aluminum material at a faster rate. The shear tension on mesh 60 is 1316.1 N, that on mesh 50 is 739.13 N and that mesh 40 is 556.38 N.
The hardness testing included the testing of mechanical properties; in general, hardness is the resistance of a material to plastic deformation. In this study, Vickers microhardness was tested using pyramid-shaped diamond inventors. The result obtained the nugget is 99.4 VHN, that in the HAZ is 67.9 VHN and in the base metal is 37.2 VHN.
The of the aluminum base metal is greater than that on the nugget. means that the nugget is in a solution-treated state. In solution treatment, the aluminum will be immersed in a saturated solution. Then, its hardness will be at its lowest as shown in Figure 3. The specimens were tested shortly after the welding spot procedure, so that natural aging would not have occurred yet.
The welding times, Tw, were 0.2, 0.3, and 0.4 s. Upon adding 40 mesh of copper, the hardness in the nugget tended towards that of the base metal at a welding time of 0.2 s; that in the HAZ occurred at a welding time of 0.3 s, and that of the base metal remained the same in every part, as shown on Figure 4.
Upon adding 50 mesh of copper, the hardness in the nugget tended towards that of the base metal at a welding time of 0.2 s that in the HAZ occurred at a welding time of 0.3, and that of the base metal remained the same in every part, as shown in Figure 5.
Upon adding 60 mesh of copper, the hardness in the nugget tended towards that of the base metal at a welding time of 0.2 s that in the HAZ occurred at a welding time of 0.3 s, and that of the base metal remained the same in every part, as shown in Figure 6.

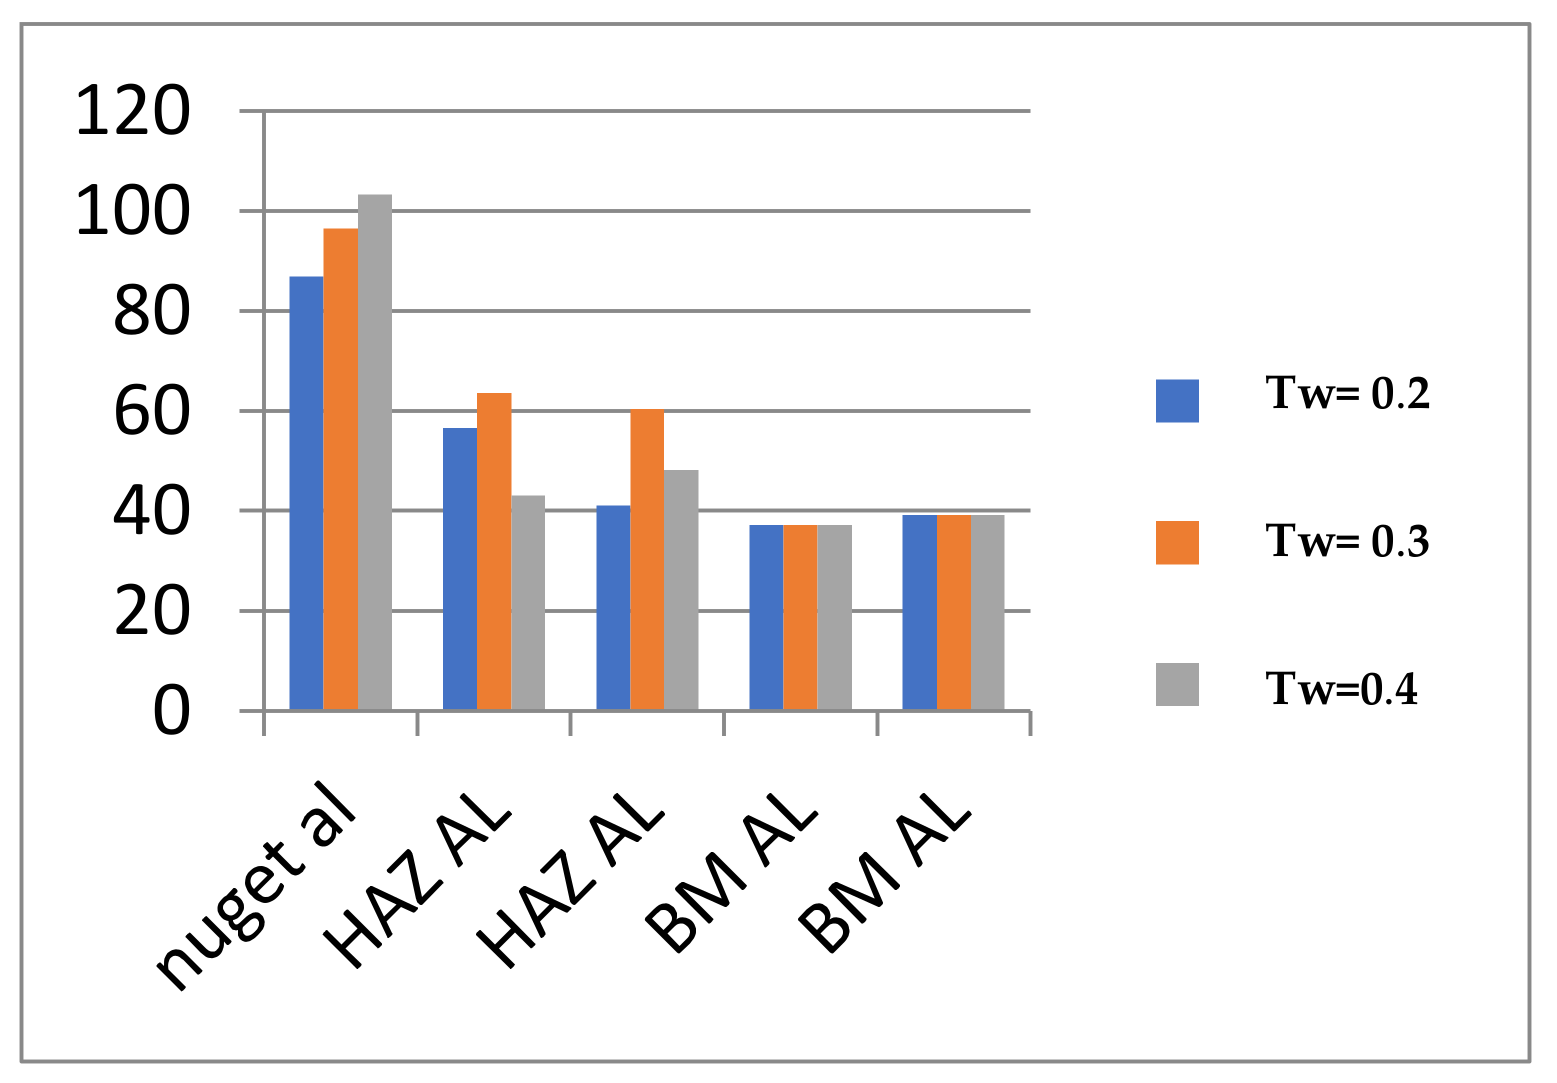
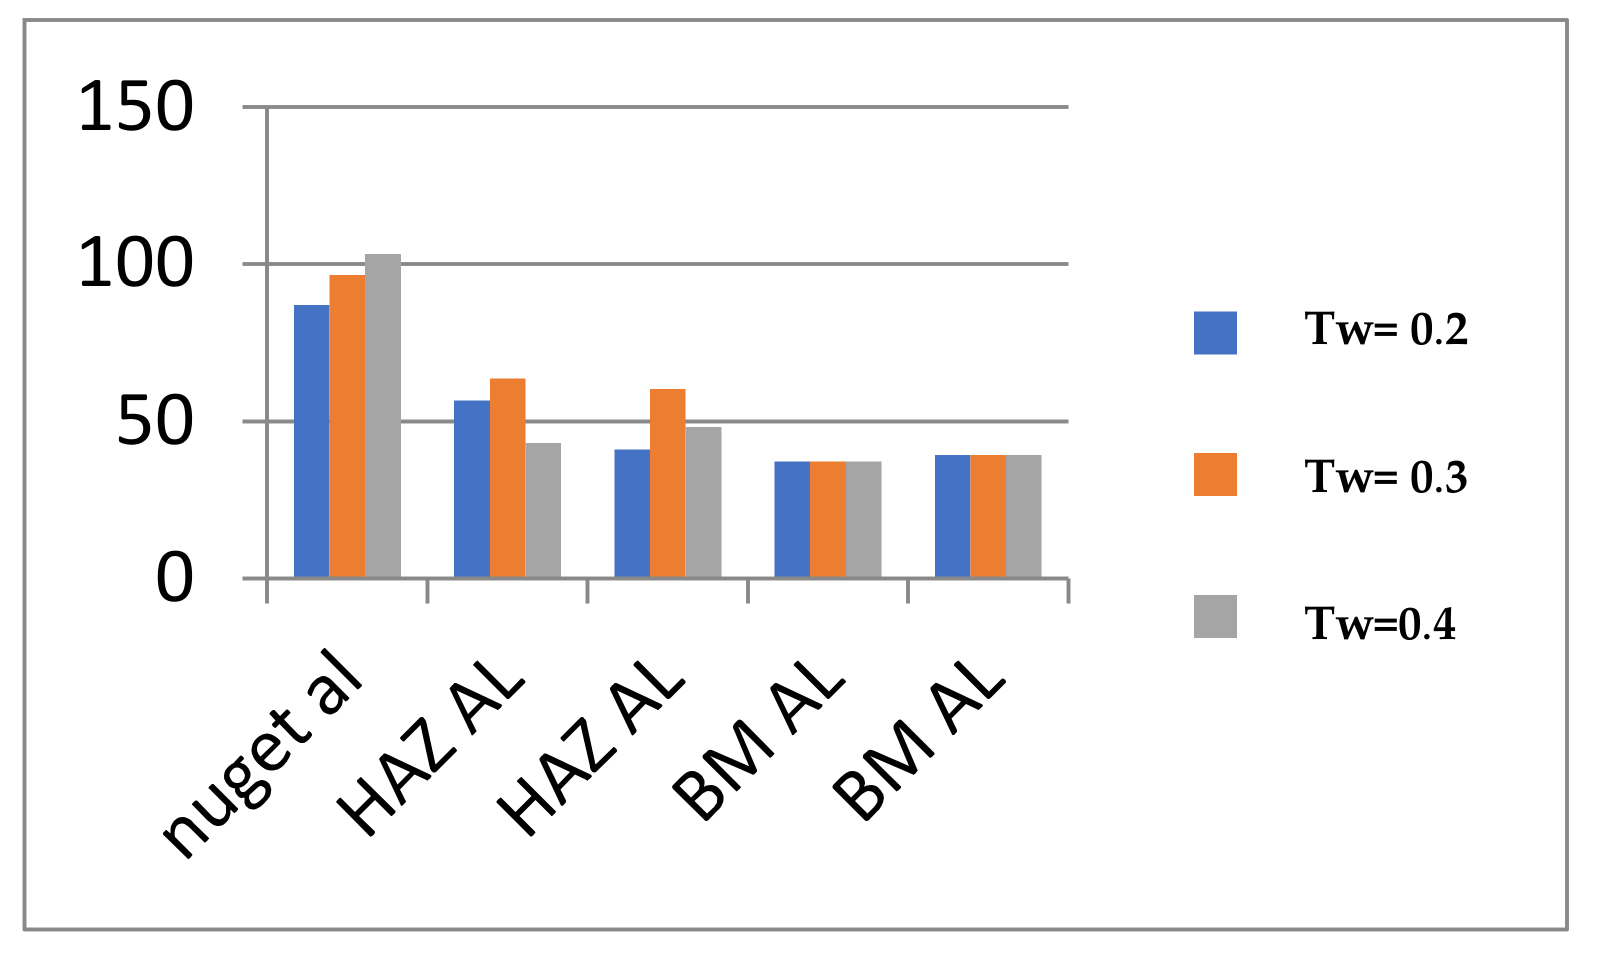
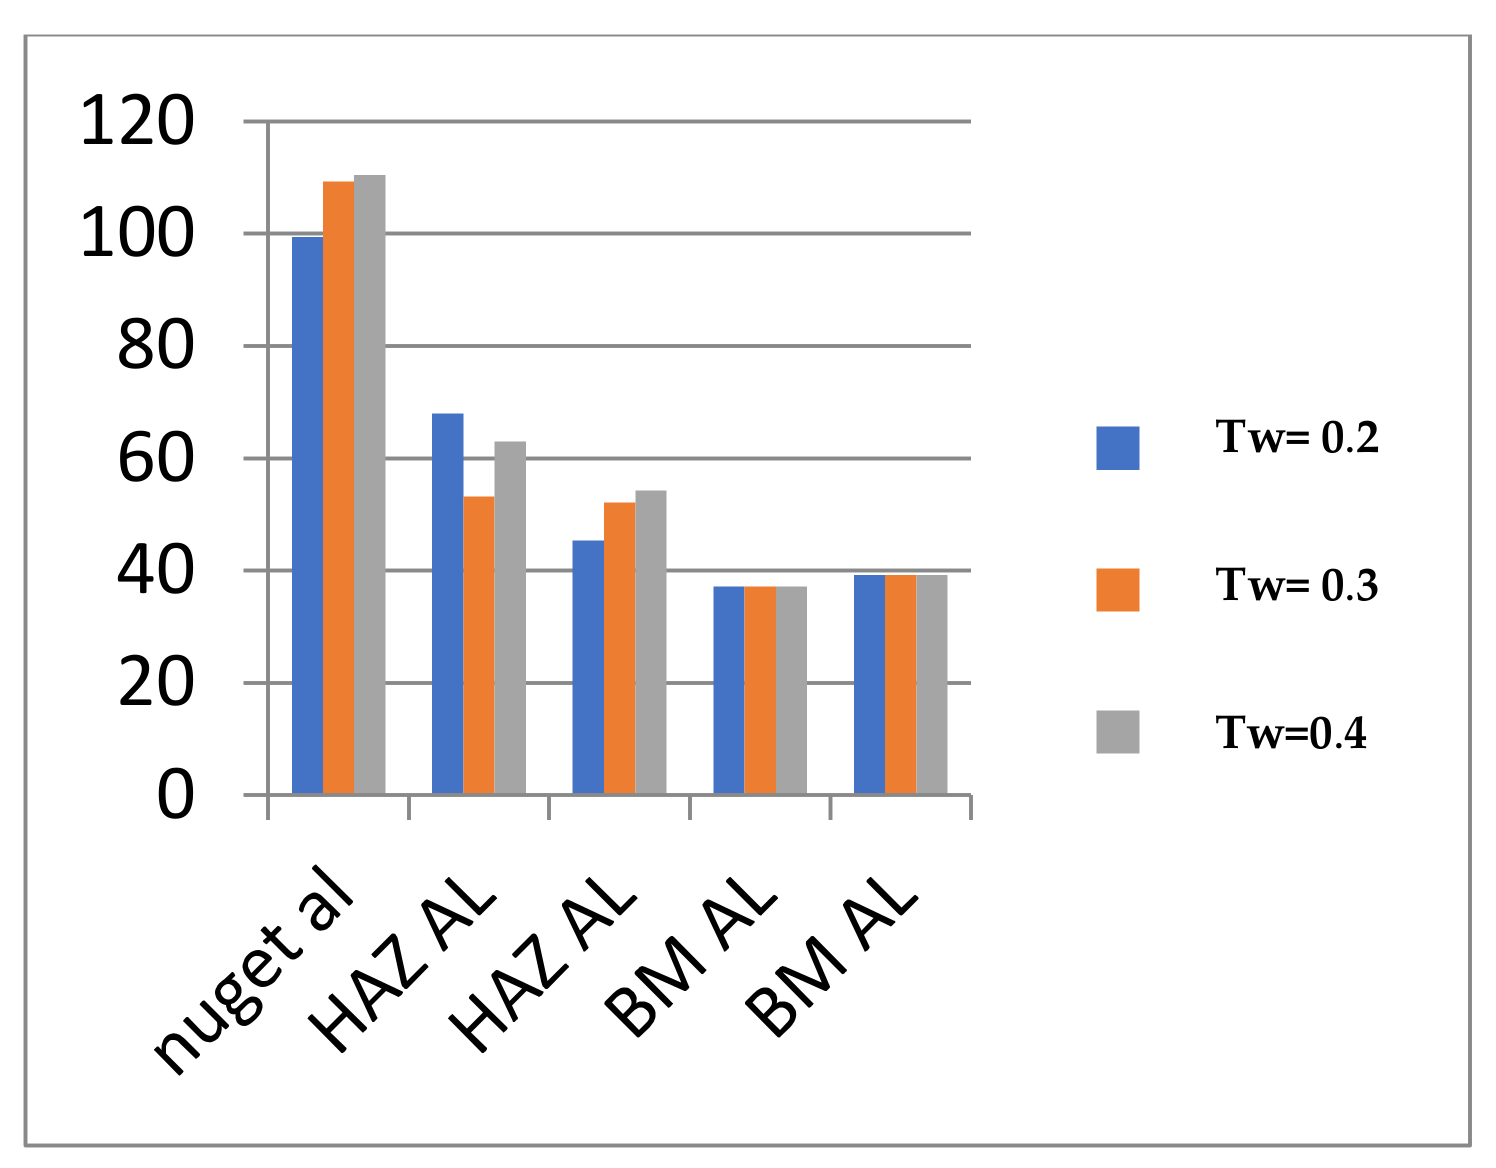
Microstructure vs. Vickers Microhardness

The results showed that there was an increase in the hardness value in the nugget area compared to the hardness value in the parent metal area. This increase in hardness is due to the largest area of nuggets receiving heat input. The increase in hardness value was followed by the HAZ area and the parent metal area that does not receive heat. Areas that receive high heat and rapid cooling will undergo changes in phases and microstructures. These can be seen in the microstructures below.
Figure 7 shows that observation of the micro photos shows little differences in microstructures because it uses the same base metal.
The value of violent distribution, obtained from the results of hardness testing, shows the same tendency, where the nugget area has the highest hardness, followed by the HAZ, and then the base metal.
Figure 8 shows the circumference of the melting zone of the α-aluminum zone. The melting zone also occurs at the inter-surface of the aluminum. The temperature reached is higher than the melting point of aluminum, but it is not high enough to reach copper’s melting point. Copper thus becomes a heat conductor. The 60 mesh of copper provides a denser and better heat conductor to reach aluminum’s melting point.
The results of SEM on spot welding with 60 mesh, 50 mesh, and 40 mesh on the nugget is shown below. The white area is aluminum, and the dark area is copper. Figure 9 shows that 50 mesh of copper exerts a greater influence on the melting zone of α-aluminum. The larger size of the copper powder allows for a higher amount of heat transfer, lowering the temperature around the copper particles to form a melting zone.
Figure 8. SEM of nugget with 60 mesh Cu.
Engproc 84 00089 g008
Figure 10 shows the result of SEM on spot welding with 40 mesh. The white area is aluminum and the dark area is copper. The 40 mesh of copper is unable to influence the melting zone of α-aluminum. The larger size of the copper powder allows for a higher amount of heat transfer to lower the temperature around the copper particle to form a melting zone.

4. Conclusions

Based on the data analysis and discussion, the following can be concluded:
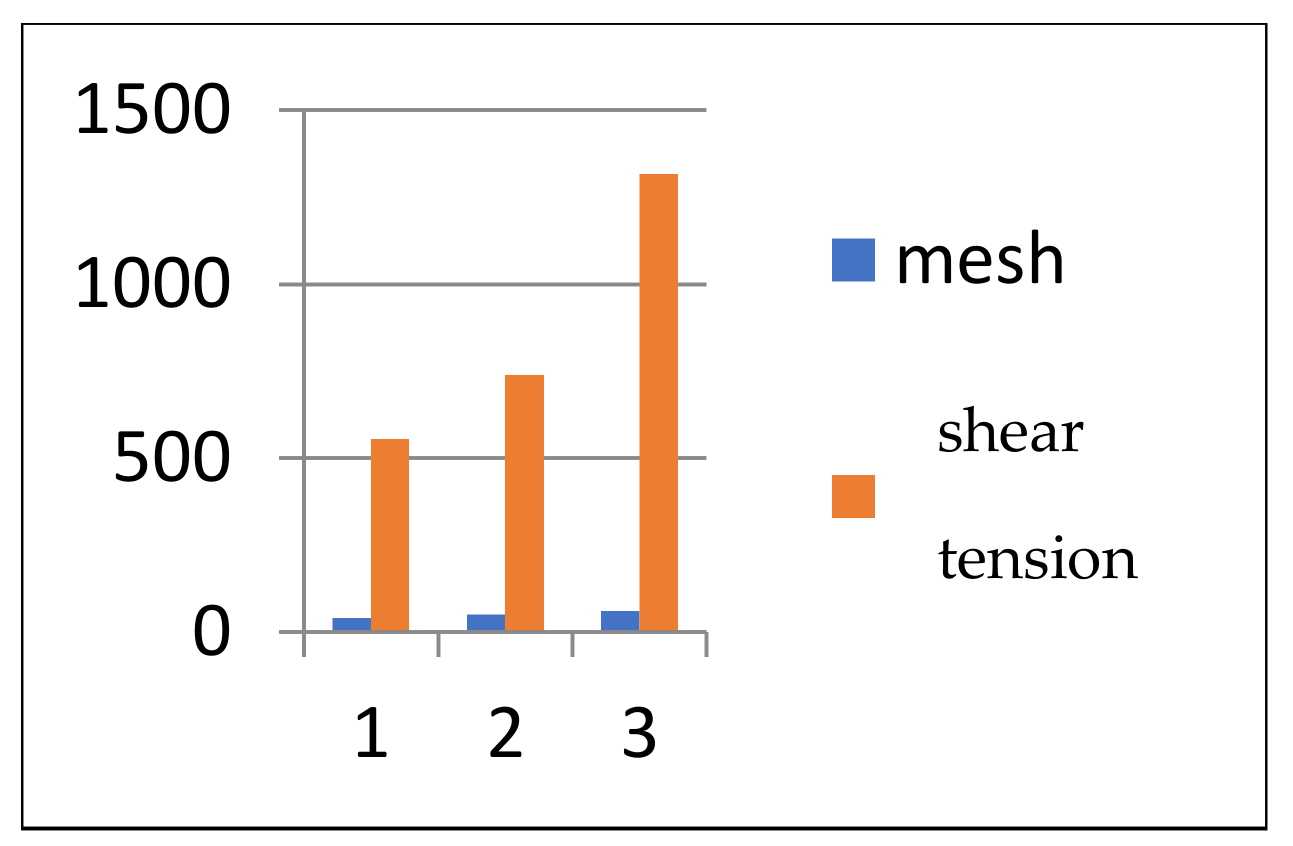
  • The larger the size of the mesh number (the smaller the size of copper powder), the greater the shear strength highest shear strength is 1316.10 N followed by that in mesh 50 which is 739.13 N, and the lowest is in mesh 40 which is 556.38 N.
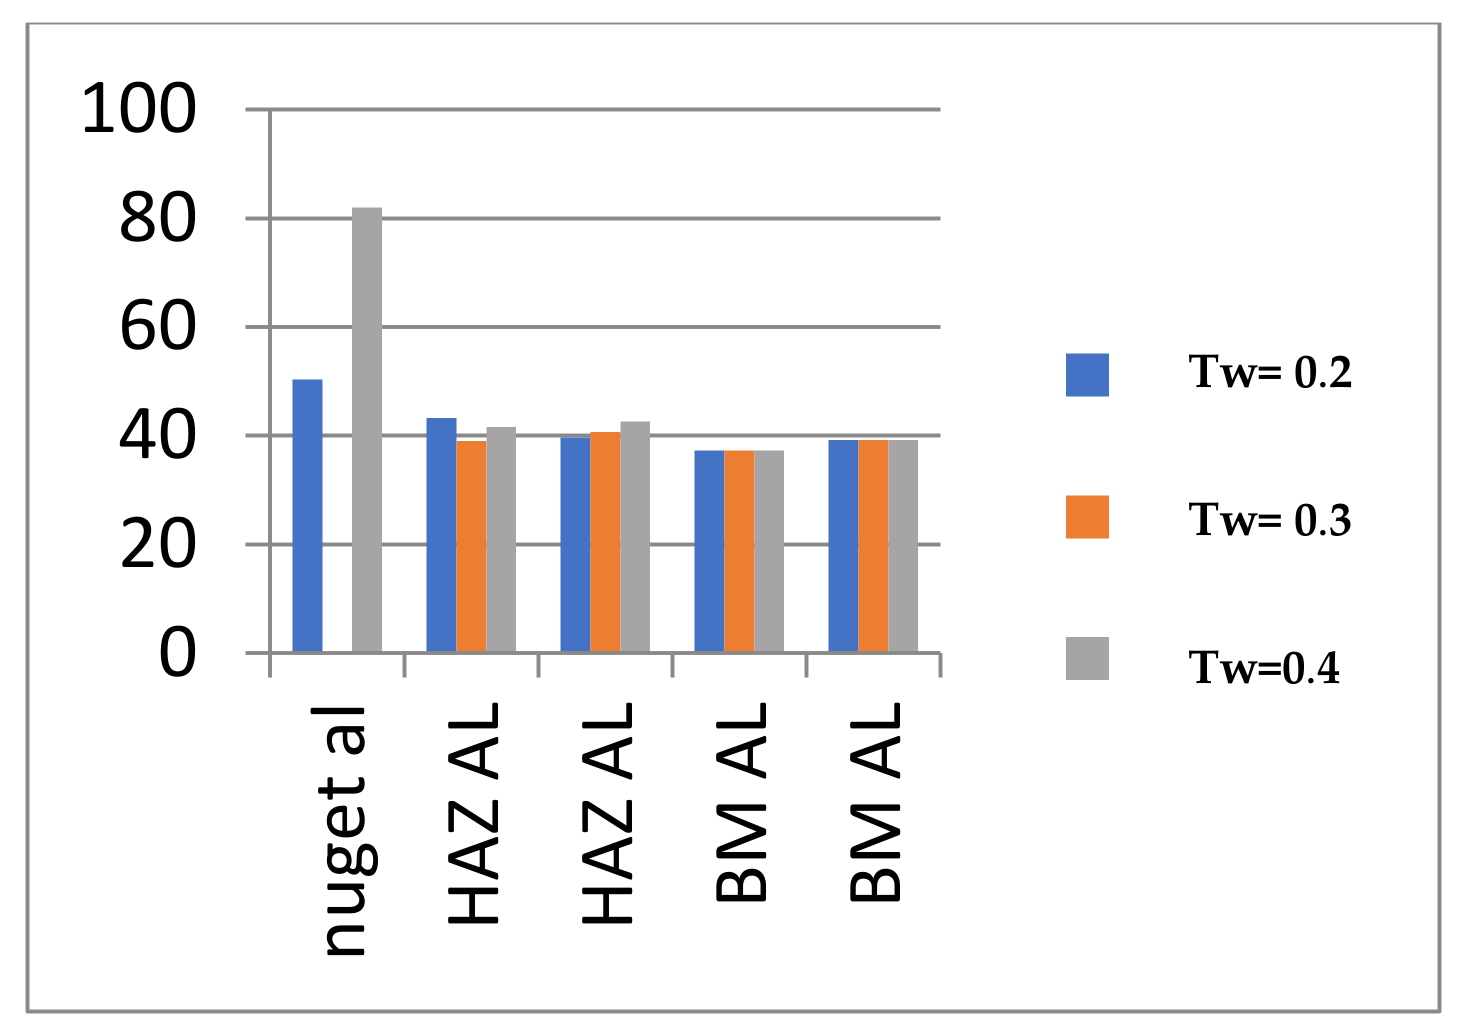
  • The highest hardness occurs in the mesh 60 nugget area at 99.4 HVN, then in the HAZ (heat-affected zone) section at 67.9 HVN, and lastly, on the main metal part (base metal) at 37.2 HVN.
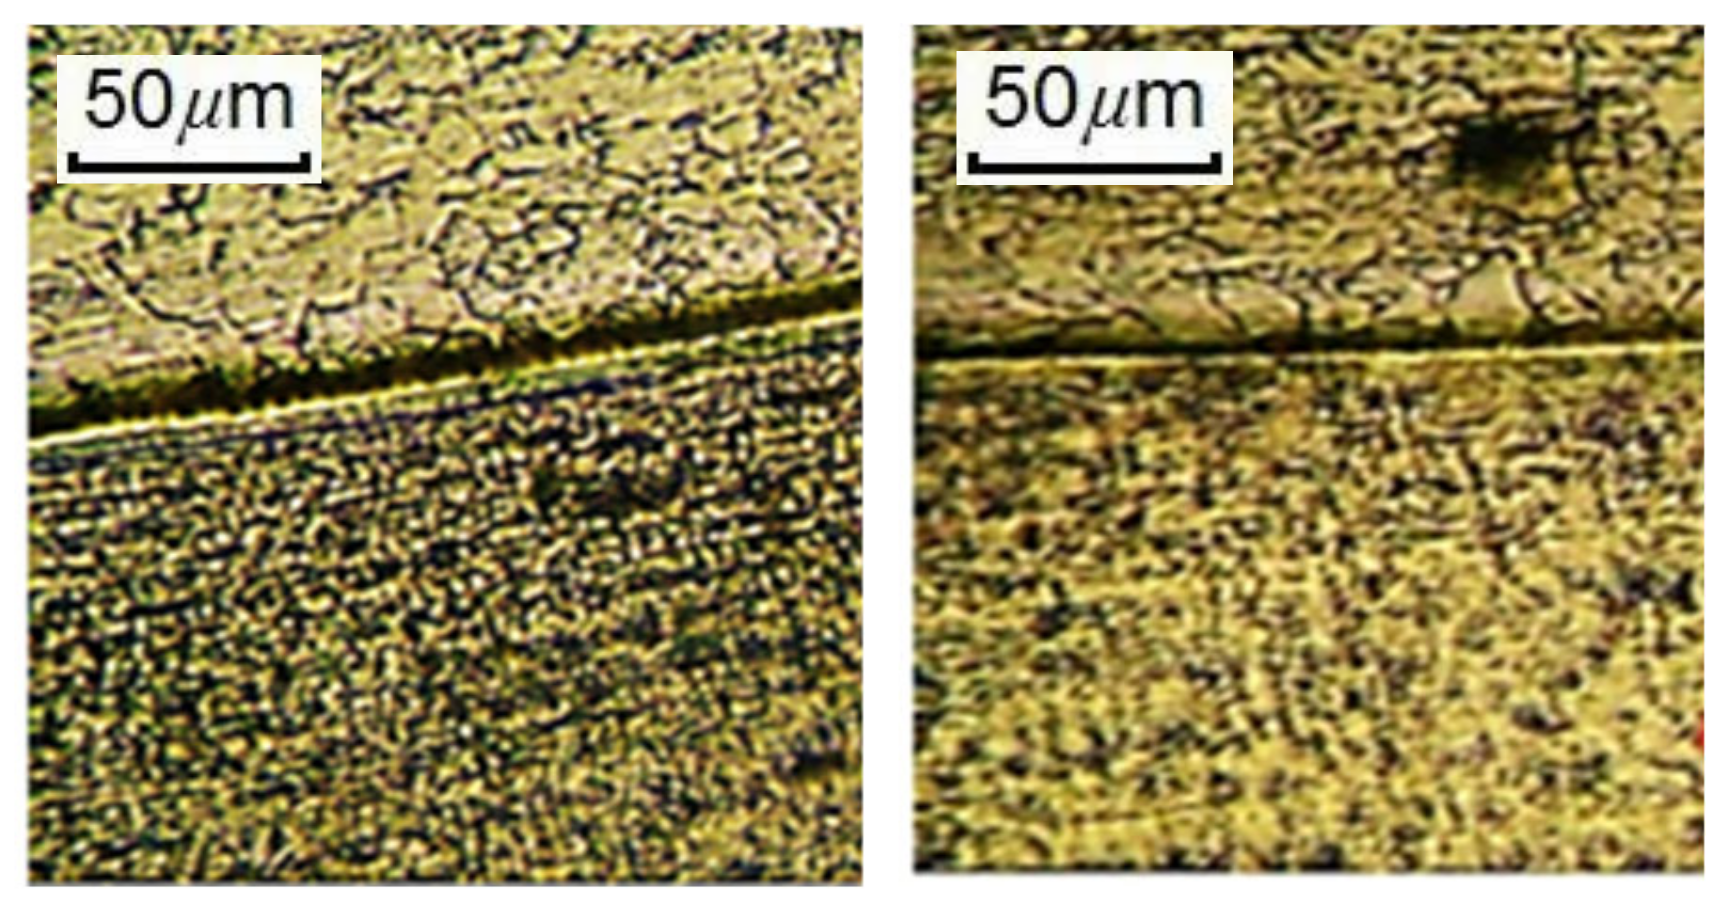
  • The microstructure was tested using 100× magnification, with the result having a similar structure despite having been given different mesh variations.
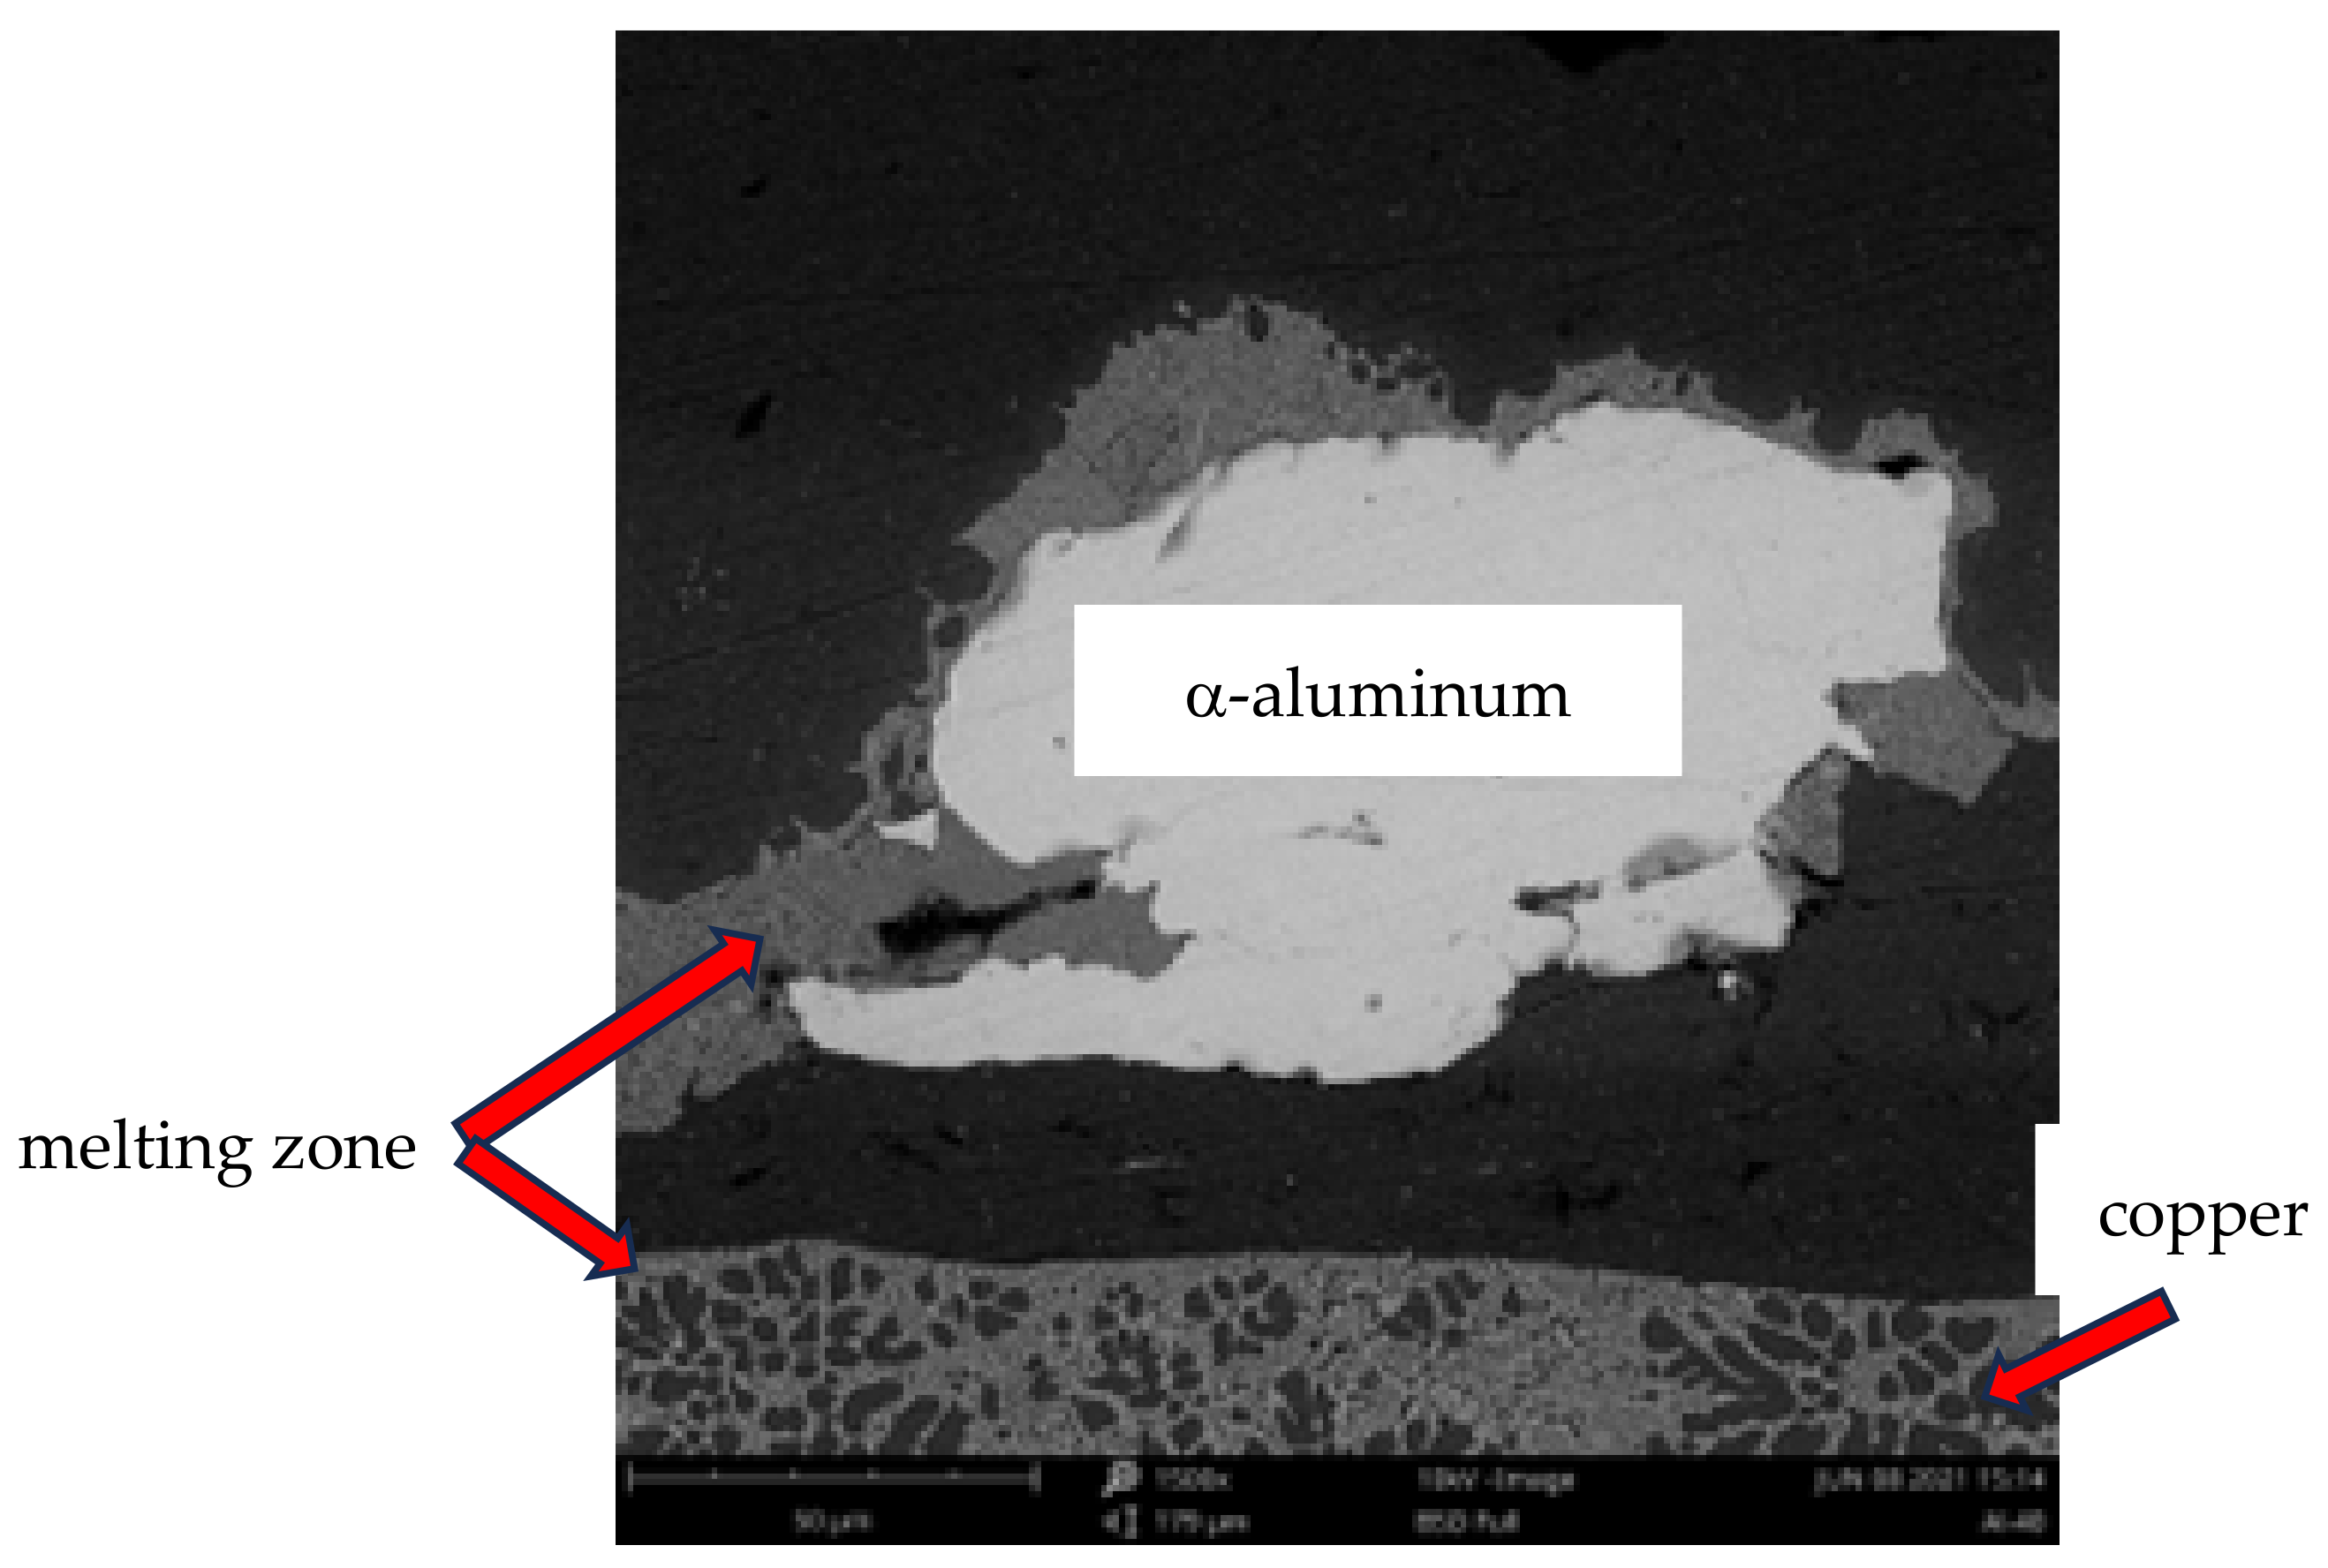
  • The SEM results show that the largest welding effect is on the 60 mesh, and it decreases proportionally with the increase the mesh size.

Author Contributions

Conceptualization, P.I.P. and P.P.; methodology, P.I.P.; Data Analysis, P.P.; validation, P.I.P.; writing—original paper, P.I.P.; writing—review and editing, P.P.; supervision, P.I.P. All authors have read and agreed to the published version of the manuscript.

Funding

This research was funded by Universitas Muhammadiyah Surakarta (UMS).

Institutional Review Board Statement

Not applicable.

Informed Consent Statement

Not applicable.

Data Availability Statement

The datasets presented in this study are not publicly accessible, as they are part of ongoing research. Interested parties may request access by contacting the corresponding author.

Acknowledgments

Acknowledgments are extended to the Faculty of Engineering at Universitas Muhammadiyah Surakarta for their support throughout the completion of this study via Hibah Integrasi Tridharma Programs (HIT), as well as to the Mechanical Engineering Laboratory for providing access to all necessary laboratory facilities.

Conflicts of Interest

The authors declare that there is no conflict of interest.

References

  1. Agustriyana, L.; Irawan, Y.S.; Sugiarto, S. PengaruhKuatArusdanWaktuPengelasanPada Proses Las Titik (Spot Welding) TerhadapKekuatanTarikdanMikrostrukturHasil Las dari Baja FasaGanda (Ferrite-Martensite). J. Rekayasa Mesin 2011, 2, 175–181. [Google Scholar]
  2. ANSI/AWS/SAE/D8.9; An American National Standard. Recommended Practies for Test Methods for Evaluating the Resistance Spot Welding Behavior of Automotive Sheet Steel Materials. American Welding Society: Miami, FL, USA, 1997; pp. 33–37.
  3. Aravinthan, A.; Nachimani, C. Analysis of Spot Weld Growth on Mild and Stainless steel. Suppl. Weld. J. 2011, 90, 143–147. [Google Scholar]
  4. Arghavani, M.R.; Movahedi, M.; Kokabi, A.H. Role of zinc layer in resistance spot welding of aluminium to steel. Mater. Des. 2016, 102, 106–114. [Google Scholar] [CrossRef]
  5. Balasundaram, R.; Patel, V.K.; Bhole, S.D.; Chen, D.L. Effect of zinc interlayer on ultrasonic spot welded aluminum-to-copper joints. Mater. Sci. Eng. A 2014, 607, 277–286. [Google Scholar] [CrossRef]
  6. Charde, N. Investigating Spot Weld Growth On 304 Austenitic Stainless Steel (2 mm). J. Eng. Sci. Technol. 2013, 8, 69–76. [Google Scholar]
  7. Qualification Standard for Welding and Brazing Prosedures, Welder, Brazers, and Welding and Brazing Operations. In Annual Book of ASME IX Standard; The American Society of Mechanical Engineers: New York, NY, USA, 2001; pp. 152–185.
  8. EAA—European Aluminium Association. Resistance During Spot Welding of Steel and Aluminium; TALAT 4500.01.03; European Aluminium Association: Brussels, Belgium, 1994. [Google Scholar]
  9. Chae, Y.; An, Y.J. Effects of micro- and nano plastics on aquatic ecosystems: Current research trends and perspectives. Mar. Pollut. Bull. 2017, 124, 624–632. [Google Scholar] [CrossRef]
  10. Nakki, P.; Setala, O.; Lehtiniemi, M. Bioturbation transports secondary microplastics to deeper layers in soft marine sediments of the northern Baltic Sea. Mar. Pollut. Bull. 2017, 119, 255–261. [Google Scholar] [CrossRef]
  11. Ella, S.; Formagne, P.Y.; Koutsos, V.; Blackford, J.R. Investigation of rubber friction on snow for tyres. Tribol. Int. 2013, 59, 292–301. [Google Scholar] [CrossRef]
  12. Darmawan, A.S.; Siswanto, W.A.; Sujitno, T. The Influence of Plasma Nitrocarburizing Process Temperature to Commercially Pure Titanium Surface Hardness. Appl. Mech. Mater. 2013, 315, 700–704. [Google Scholar] [CrossRef]
Figure 2. Histogram of shear tension.
Engproc 84 00089 g002
Figure 3. Histogram on hardness.
Engproc 84 00089 g003
Figure 4. Hardness on mesh 40.
Engproc 84 00089 g004
Figure 5. Hardness on mesh 50.
Engproc 84 00089 g005
Figure 6. Hardness on 60.
Engproc 84 00089 g006
Figure 7. Micro photograph of mesh 40 in comparison to that of mesh 60.
Engproc 84 00089 g007
Figure 9. SEM of nugget with 50 mesh Cu.
Engproc 84 00089 g009
Figure 10. SEM of nugget with 40 mesh Cu.
Engproc 84 00089 g010
Disclaimer/Publisher’s Note: The statements, opinions and data contained in all publications are solely those of the individual author(s) and contributor(s) and not of MDPI and/or the editor(s). MDPI and/or the editor(s) disclaim responsibility for any injury to people or property resulting from any ideas, methods, instructions or products referred to in the content.

