Abstract
The effects of three drip irrigation (IR1: Farmer’s, IR2:Full (100%ETc), IR3:Deficit (80%ETc) irrigation), and two fertilization (Ft1, Ft2) treatments were studied on maize yield and biomass by applying new agro-technologies (TDR—sensors for soil moisture (SM) measurements, Precision Agriculture, Remote Sensing—NDVI (Sentinel-2 satellite sensor), soil-hydraulic analyses and Geostatistical models, SM-rootzone modelling-2D-GIS mapping). A daily soil moisture depletion (SMDp) model was developed. The two-way-ANOVA statistical analysis results revealed that irrigation (IR3 = best) and fertilization treatments (Ft1 = best) significantly affect yield and biomass. Deficit irrigation and proper fertilization based on new agro-technologies for improved management decisions can result in substantial improvement on yield (+116.10%) and biomass (+119.71%) with less net water use (−7.49%) and reduced drainage water losses (−41.02%).
1. Introduction
Maize is a major irrigated crop worldwide that requires large quantities of water seasonally (400–800 m3) [1]. Worldwide, the maize cultivated area and yield are 194.18 million ha and 1118.56 million metric tons (2019/2020) [2]. The agricultural sector accounts for 70% of global [1,3,4] and for 59% of Europe’s [5] freshwater withdrawals. At present, many countries worldwide are experiencing a scarcity of fresh water [1,3,4] for potable and irrigation use. Global water demand is projected to increase by 55% between 2000 and 2050 and the climate change will have adverse impact on world water resources and food production with high degree of regional variability and scarcity [6], with the irrigation water amount being the main factor limiting crop production [1,4,7].
With the ever-increasing competition for finite water resources worldwide and the steadily rising demand for agricultural commodities, the call to improve the efficiency and productivity of water use for crop production, to ensure future food and crop products security and address the uncertainties associated with climate change, has never been more urgent [8]. The global challenge for the coming decades will be increasing crop production with less water using precision agriculture as a management strategy that helps farmers to improve crop production and water efficiency. The aim of the study was to determine the effects of three drip irrigation (IR1: Farmer’s, IR2: Full [100%ETc], IR3: Deficit [80%ETc] irrigation), and two fertilization (Ft1, Ft2) treatments on maize yield and biomass by applying new agro-technologies.
2. Materials and Methods
2.1. Experimental Plot Design, Soil Sampling and Laboratory Soil and Hydraulic Analysis
The 2.90 ha field had a factorial split plot design with main factor the three drip irrigation treatments: (a) IR1: Farmer’s, (b) IR2: Full (100%ETc) and c) IR3: Deficit (80%ETc irrigation. The sub factor was two fertilization treatments: Ft1: N-P-K = 333.63-9.16-34.86 Kg ha−1, and Ft2: N-P-K = 270.03-9.16-34.86 Kg ha−1). A GPS receiver was used to identify locations of soil samples that were collected at depth 0–40 cm and analyzed at the laboratory. The soil’s pH was measured in a 1:2 soil/water extract with a glass electrode and a pH meter. Soil organic matter was analyzed by chemical oxidation with 1 mol L−1 K2Cr2O7 and titration of the remaining reagent with 0.5 mol L−1 FeSO4 [9]. Cation-exchange capacity (CEC) was analyzed by (i) saturation of cation exchange sites with Na by “equilibration” of the soil with pH 8.2, 60% ethanol solution of 0.4N NaOAc-0.1N NaCI; and (ii) extraction with 0.5N MgNO3. Total Na and CI were determined in the extracted solution [9]. The soil’s nitrate and ammonium nitrogen were extracted with 0.5 mol L−1 CaCl2 and estimated by distillation in the presence of MgO and Devarda’s alloy, respectively. Available phosphorus P (Olsen method) was extracted with 0.5 mol L−1 NaHCO3 and measured by spectroscopy [9]. Exchangeable potassium K forms were extracted with 1 mol L−1 CH3COONH4 and measured with a flame Photometer. Field Capacity (FC) and wilting point (WP) were measured with the porous ceramic plate method with 1/3 Atm for FC and 15 Atm for WP [1]. Maize (Zea mays L., var. 1921 Hybrid) was seeded at the end of March and harvested at the end of September.
2.2. Soil Moisture Measurements, Digital 2-D-GIS Moisture Maps Utilizing GIS, Precision Agriculture and Geostatistics
The TDR (time domain reflectometry) method was used to measure soil moisture because it gives accurate results within an error limit of ±1% [1,7,10,11]. A TDR instrument and multisensory probes were used [1,7,12], placed at 0–15, 15–30, 30–45, 45–60 and 60–75 cm depths for measuring volumetric water content (θvi, …, θvn) (i = 1, 2, …, n and n = 5) of the root zone. Data were imported daily in a GIS geodatabase utilizing Precision Agriculture (PA) and geostatistics [1,7,12] in order to model and produce soil moisture 2-D maps of maize’s root zone profile.
2.3. Remote Sensing Crop’s NDVI, Evapotranspiration and Net Irrigation Requirement
Climatic data were obtained from a nearby meteorological station. The effective rainfall was calculated according to USDA-SCS (1970) [13]. The NDVI Vegetation Index [1] was calculated every week using remote sensing (RS) data (Sentinel-2 Satellite sensor) for studying spatial crop development and coefficients. The reference evapotranspiration was computed based on the F.A.O. Penman–Monteith method [1,7,8] and the net irrigation requirement (NIR) was calculated using a soil–water–crop–atmosphere model [1,7]. The crop evapotranspiration (ETc) and actual evapotranspiration (ETa) were computed using crop coefficients obtained from remote sensing—NDVI [1,7,8]. The moisture rootzone depletion was calculated using a daily soil moisture depletion (SMDp) model (1) [1,7,8]:
where: Dr,(i) = root zone depletion at the end of day i (mm), Dr,(i − 1)(TDR) = TDR sensors measured rootzone soil-water content at the end of day i − 1 (mm), Pe = effective rainfall (mm), NIR(i) = net irrigation requirement (mm), GW(i) = groundwater contribution (capillary rise) from water table on day i (mm), ETc(i) = evapotranspiration on day i (mm), DP(i) = drainage water loss out of the root zone by deep percolation on day i (mm).
Dr,(i) = Dr,(i − 1)(TDR) − Pe(i) − NIR(i) − GW(i) + ETc(i) − DP(i)
3. Results and Discussion
3.1. Study Area, Soil-Hydraulic Analysis and 2-D Moisture Maps Utilizing GIS, Precision Agriculture and Geostatistics
The experiment was carried out in a farm field located at Viotia Prefecture in Central Greece. The study area is characterized by a typical Mediterranean climate [1,4,7] with a cold winter, hot summer and low precipitation in spring and summer. Results found from sensors and analyses were used as input variables to delineate soil moisture profile digital 2D-GIS maps of the maize’s root zone. SM is the major factor for crops’ enhanced growth and production [1,7]. Spatial analysis revealed an excellent moisture distribution.
Results of laboratory soil and hydraulic analysis revealed that the field’s soil was suitable for maize’s growth [1,8,9,13] and it was characterized as Sandy Clay (SC) [1,9,13]. The soil organic matter was 2.12% (±0.17), bulk specific gravity of the soil was 1.44 g cm−3 (±0.04), plant available water was 0.0975 cm cm−1 (±0.02), pH at (1:2) soil/water extract was 8.01 (±0.23) and the cation-exchange capacity of soil was 21.47 cmol kg−1 (±1.12) (a sufficient level). The N-NO3 was found 11.05 mg kg−1 (±2.23) (a marginal level) and the N-NH4 was found 3.57 mg kg−1 (±1.04) (a low level). The phosphorus P-Olsen was found 21.71 mg kg−1 (±2.21) (a sufficient level), and the potassium K-exchangeable was found at high concentration levels (497 mg kg−1 (±20.34)).
3.2. Daily Soil Moisture Depletion (SMDp) Model and NDVI Vegetation Index
The NDVI (Normalized Difference Vegetation Index) [1] was calculated using RS data (Sentinel-2 satellite sensor) for monitoring spatial crop development and coefficients for the ETc and SMDp model (Figure 1). The NDVI vegetation index quantifies crops’ vegetation by measuring the difference between near-infrared (which vegetation strongly reflects) and red light (which vegetation absorbs). The daily TDR moisture measurements and 2D-GIS SM mapping, the accurate estimated ETc and monitoring of system inflows and estimated surface outflow and NDVI vegetation index mapping, showed a reliable daily Soil Moisture Depletion model [1,7] for the four stages of maize crop growth.
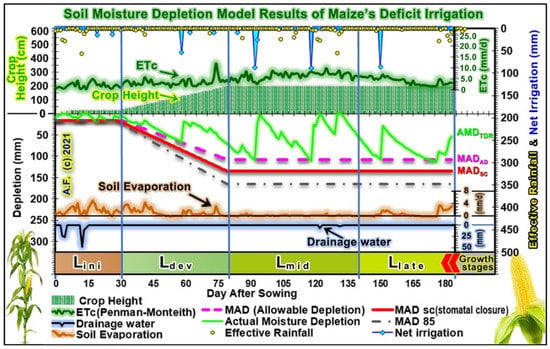
Figure 1.
Treatment IR3 results of the daily soil moisture depletion model for the four stages of maize crop growth, also depicting MADAD (Management Allowed Depletion) and MADsc (MAD at stomatal closure).
3.3. Statistical Analysis, Maize’s Yield and Biomass Results
The two-way-ANOVA statistical analysis (p = 0.05) using IBM-SPSS (v.26) [1,7,14,15] revealed that the irrigation treatments (IR3: Deficit (80%ETc) irrigation (best)) and the fertilization treatments (Ft1: (best)) significantly affect maize’s yield and biomass. Whenever a prolonged shortage of soil moisture occurs during the most sensitive growth stages (flowering (Lmid stage) and grain filling (Llate stage)) (Figure 1), this usually has as a result that the maize’s crop growth is reduced because of less or excess water supply by the farmers and the yield is consequently lower [1,7,8]. Deficit irrigation and proper fertilization based on new agro-technologies for improved management decisions can result in substantial improvement in yield (+116.10%) and biomass (+119.71%) with less net water use (−7.49%) and reduced drainage losses (−41.02%).
4. Conclusions
Prolonged shortage of soil moisture often occurs during the most sensitive growth stages (flowering (Lmid stage) and grain filling (Llate stage)) of many crops. In practice, the usual outcome is that the maize’s crop growth is reduced because of less (water stress) or excess (saturation) water supply by farmers who cannot estimate the correct soil moisture depletion, the MADAD (Management Allowed Depletion) and the net water requirements of the crop, so yield is consequently lower. Proper fertilization and deficit irrigation based on new agro-technologies for improved management decisions can result in substantial improvement on yield (+116.10%) and biomass (+119.71%) with less net water use (−7.49%) and reduced drainage water losses (−41.02%) and sustainable management.
Funding
This research received no external funding.
Institutional Review Board Statement
Not applicable.
Informed Consent Statement
Not applicable.
Data Availability Statement
Data are available on reasonable request to the corresponding author.
Acknowledgments
The technical support provided by the local farmers of Viotia region in Central Greece is gratefully acknowledged.
Conflicts of Interest
The author declares no conflict of interest.
References
- Filintas, A. Land Use Evaluation and Environmental Management of Biowastes, for Irrigation with Processed Wastewaters and Application of Bio-Sludge with Agricultural Machinery, for Improvement-Fertilization of Soils and Crops, with the Use of GIS-Remote Sensing, Precision Agriculture and Multicriteria Analysis. Ph.D. Thesis, University of the Aegean, Mitilini, Greece, 2011. [Google Scholar]
- USDA. World Agricultural Production, 2021th ed.; United States Department of Agriculture: New York, NY, USA, 2021; p. 43.
- FAO. Coping with Water Scarcity: An Action Framework for Agriculture and Food Security; FAO: Rome, Italy, 2012; p. 100. [Google Scholar]
- Stamatis, G.; Parpodis, K.; Filintas, A.; Zagana, E. Groundwater quality, nitrate pollution and irrigation environmental management in the Neogene sediments of an agricultural region in central Thessaly (Greece). Environ. Earth Sci. 2011, 64, 1081–1105. [Google Scholar] [CrossRef]
- EEA. Use of Freshwater Resources in Europe, CSI 018; European Environment Agency (EEA): Copenhagen, Denmark, 2019. [Google Scholar]
- Islam, S.M.F.; Karim, Z. World’s Demand for Food and Water: The Consequences of Climate Change. In Desalination-Challenges and Opportunities; Farahani, M.H.D.A., Vatanpour, V., Taheri, A.H., Eds.; IntechOpen: London, UK, 2019; Chapter 4; pp. 1–27. [Google Scholar] [CrossRef] [Green Version]
- Filintas, A.; Wogiatzi, E.; Gougoulias, N. Rainfed cultivation with supplemental irrigation modelling on seed yield and oil of Coriandrum sativum L. using Precision Agriculture and GIS moisture mapping. Water Supply 2021, 21, 2569–2582. [Google Scholar] [CrossRef]
- Allen, R.; Pereira, L.; Raes, D.; Smith, M. Crop Evapotranspiration. Drainage & Irrigation Paper Nº56; FAO: Rome, Italy, 1998. [Google Scholar]
- Page, A.L.; Miller, R.H.; Keeney, D.R. Methods of Soil Analysis Part 2: Chemical and Microbiological Properties; Agronomy, ASA and SSSA: Madison, WI, USA, 1982; p. 1159. [Google Scholar]
- Dioudis, P.; Filintas, A.; Koutseris, E. GPS and GIS based N-mapping of agricultural fields’ spatial variability as a tool for non-polluting fertilization by drip irrigation. Int. J. Sustain. Dev. Plan. 2009, 4, 210–225. [Google Scholar] [CrossRef]
- Dioudis, P.; Filintas, A.; Papadopoulos, A. Corn yield response to irrigation interval and the resultant savings in water and other overheads. Irrig. Drain. J. Int. Comm. Irrig. Drain. 2009, 58, 96–104. [Google Scholar] [CrossRef]
- Filintas, A.; Dioudis, P.; Prochaska, C. GIS modeling of the impact of drip irrigation, of water quality and of soil’s available water capacity on Zea mays L, biomass yield and its biofuel potential. Desalination Water Treat. 2010, 13, 303–319. [Google Scholar] [CrossRef] [Green Version]
- USDA-SCS. Irrigation Water Requirements; Technical R. No. 21; USDA Soil Conservation Service: Washington, DC, USA, 1970.
- Norusis, M.J. IBM SPSS Statistics 19 Advanced Statistical Procedures Companion; Pearson: London, UK, 2011. [Google Scholar]
- Hatzigiannakis, E.; Filintas, A.; Ilias, A.; Panagopoulos, A.; Arampatzis, G.; Hatzispiroglou, I. Hydrological and rating curve modelling of Pinios River water flows in Central Greece, for environmental and agricultural water resources management. Desalination Water Treat. 2016, 57, 11639–11659. [Google Scholar] [CrossRef]
Publisher’s Note: MDPI stays neutral with regard to jurisdictional claims in published maps and institutional affiliations. |
© 2021 by the author. Licensee MDPI, Basel, Switzerland. This article is an open access article distributed under the terms and conditions of the Creative Commons Attribution (CC BY) license (https://creativecommons.org/licenses/by/4.0/).