Abstract
This study documents the geochemical and mineralogical characteristics of three nickel reference materials for the battery minerals industry: ¼ drill cores of typical nickel-rich ores, centimeter-sized chips of run-of-mine ore, and finely ground nickel concentrate, all from the same deposit. A novel aspect of this study is that we have used both traditional geoanalytical techniques for battery mineral characterization (whole-rock geochemistry, QXRD, SEM-EDS, EPMA, and automated mineralogy), as well as emerging and novel technologies (scanning micro-XRF, LIBS, FTIR, and Raman). This multidisciplinary method provides cross-verified characterization data that can be used for building mineral identification libraries and highlights the optimized combination for the analysis of these matrix types.
Keywords:
nickel ore; reference material; battery minerals; geochemistry; automated mineralogy; XRD; ICP 1. Introduction
A variety of battery materials are used in the manufacture of batteries, typically including one or more of the following commodities: Li, C, Ni, Co, Mn, Cu, Zn, V, and P. All are ultimately sourced from naturally occurring minerals. Historically, e.g., Ni (and Co) minerals have been overlooked at many mine sites (e.g., at old Au, Ag, PGM, and Cr mines), as they were considered secondary to the main minerals. With increasing demand for raw materials, effective use of these minerals and recovery of material from old mining cites is underway. As part of the BATCircle 2.0, GTK has been researching the characterization of key battery minerals and creating a set of reference materials (RM). The results of the analytical work on Ni-bearing ores are presented using a multidisciplinary geomaterial workflow, META, or mineral, elemental, and textural analysis.
Samples of drill core, run-of-mine ore (ROM), and nickel concentrate (Figure 1) from Boliden’s Kevitsa Mine [1], Finland, were analyzed with multiple techniques: X-ray diffraction (XRD), automated mineralogy by scanning electron microscopy using energy-dispersive spectrometry (AMICS by SEM-EDS), LECO, inductively coupled plasma sass/optical emission spectrometry (ICP-MS/OES), energy-dispersive X-ray fluorescence (ED-XRF), scanning micro-XRF, electron probe microanalysis (EPMA), Raman microscopy, laser-induced breakdown spectroscopy (LIBS), and Fourier transform infrared spectroscopy (FTIR). These techniques reveal the distribution and enrichment of key Ni-hosting minerals and the relative enrichment of metals (Ni, Fe, Cu, Co, and trace elements) across three stages of the mining cycle (ore to concentrate). Refer to the supplementary data for an extended copy of this study.

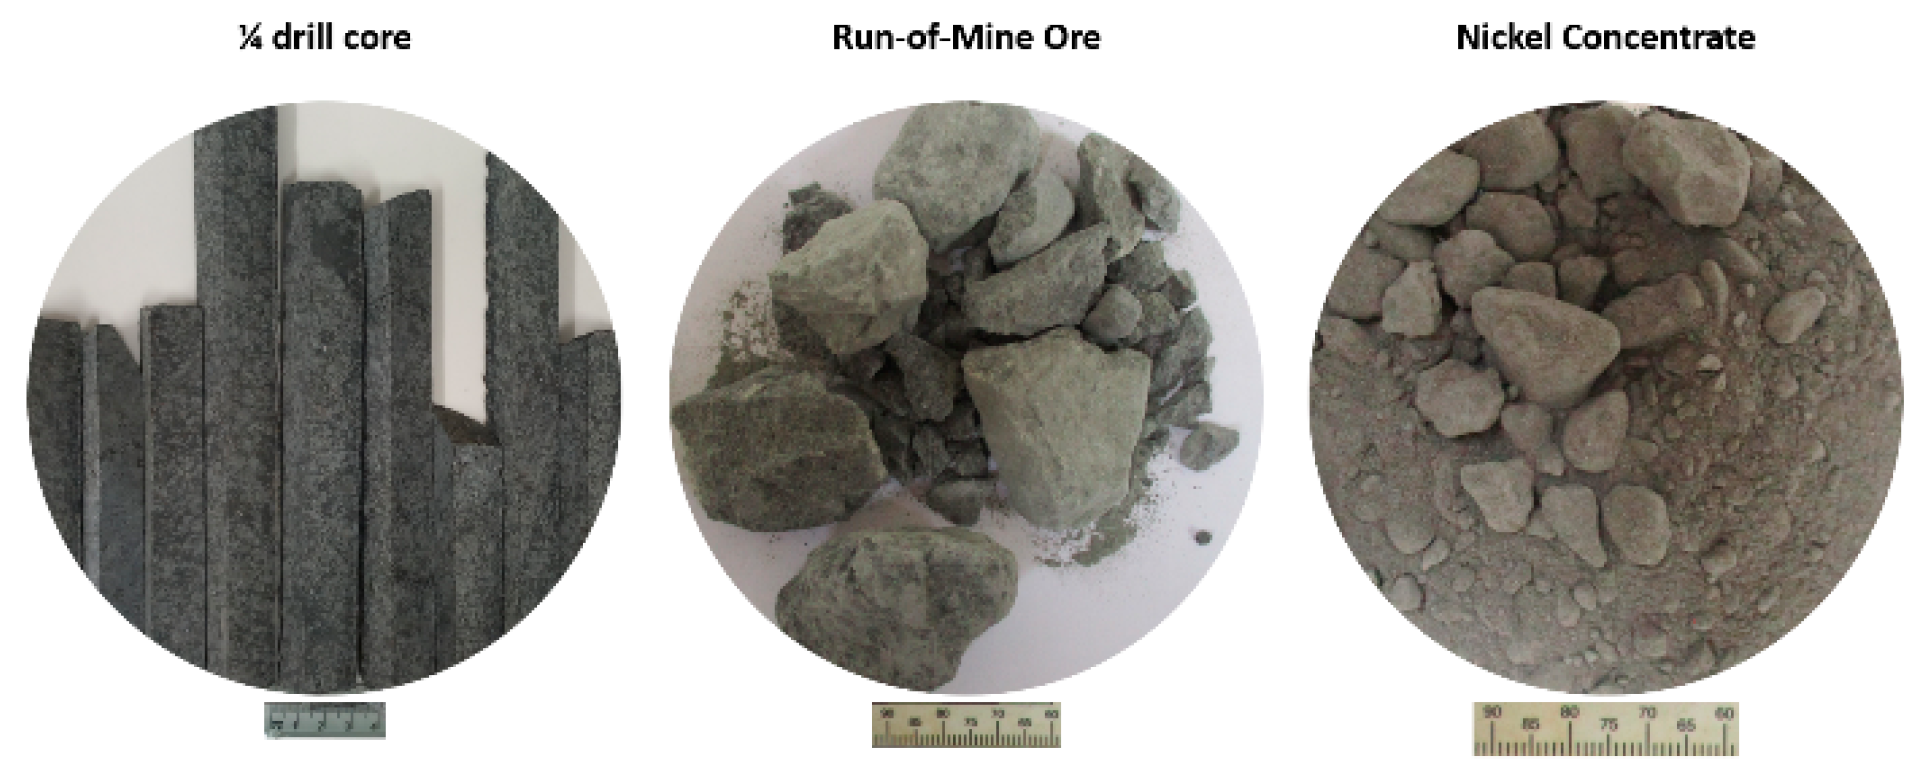
Figure 1.
Samples of drill core, run-of-mine ore (ROM), and nickel concentrate.
2. Sample Characterization
The drill core sample comprises a quarter drill core section of Ni-rich ore. The ROM sample is partially crushed, with centimeter-sized lumps and smaller particles. The nickel concentrate is a finely ground powder with occasional agglomerations up to 2 cm (Figure 1).
2.1. Whole-Rock Multi-Element Geochemical Analysis—ED-XRF, ICP-OES, ICP-MS, and LECO
The three samples were digested by alkali fusion (LiBO2 flux) and analyzed by ICP-MS/OES. Powdered samples were measured on a portable ED-XRF spectrometer. The C and S content were measured by a LECO SC-144DRPC analyzer. The Ni concentration was measured by ICP-MS in ranges from 2551 to 47,985 ppm, with good agreement with a portable ED-XRF instrument (Table 1).

Table 1.
Whole-rock multi-element geochemical analysis—ED-XRF, ICP-OES, ICP-MS, and LECO. XRF data are only shown for Ni for comparison with the Ni measured by ICP-MS.
2.2. Mineralogical Data—XRD and Automated Mineralogy
Mineralogical data were obtained by XRD analysis and automated mineralogy (Figure 2). XRD was conducted using a PANalytical X’Pert3 diffractometer on homogenized and micronized powders. The diffractograms were analyzed using HighScore Plus by PANalytical and quantified using the Rietveld method [2,3,4] with BGMN AutoQuan software. Automated mineralogy was undertaken using a Hitachi SU3900 SEM fitted with a single large area (60 mm2) Bruker SDD energy-dispersive spectrometer and running the AMICS automated mineralogy software package (Figure 3). The analysis was conducted on three rock fragments of the ROM sample and on two replicate blocks of the nickel concentrate presented to the instrument as resin-impregnated polished blocks.

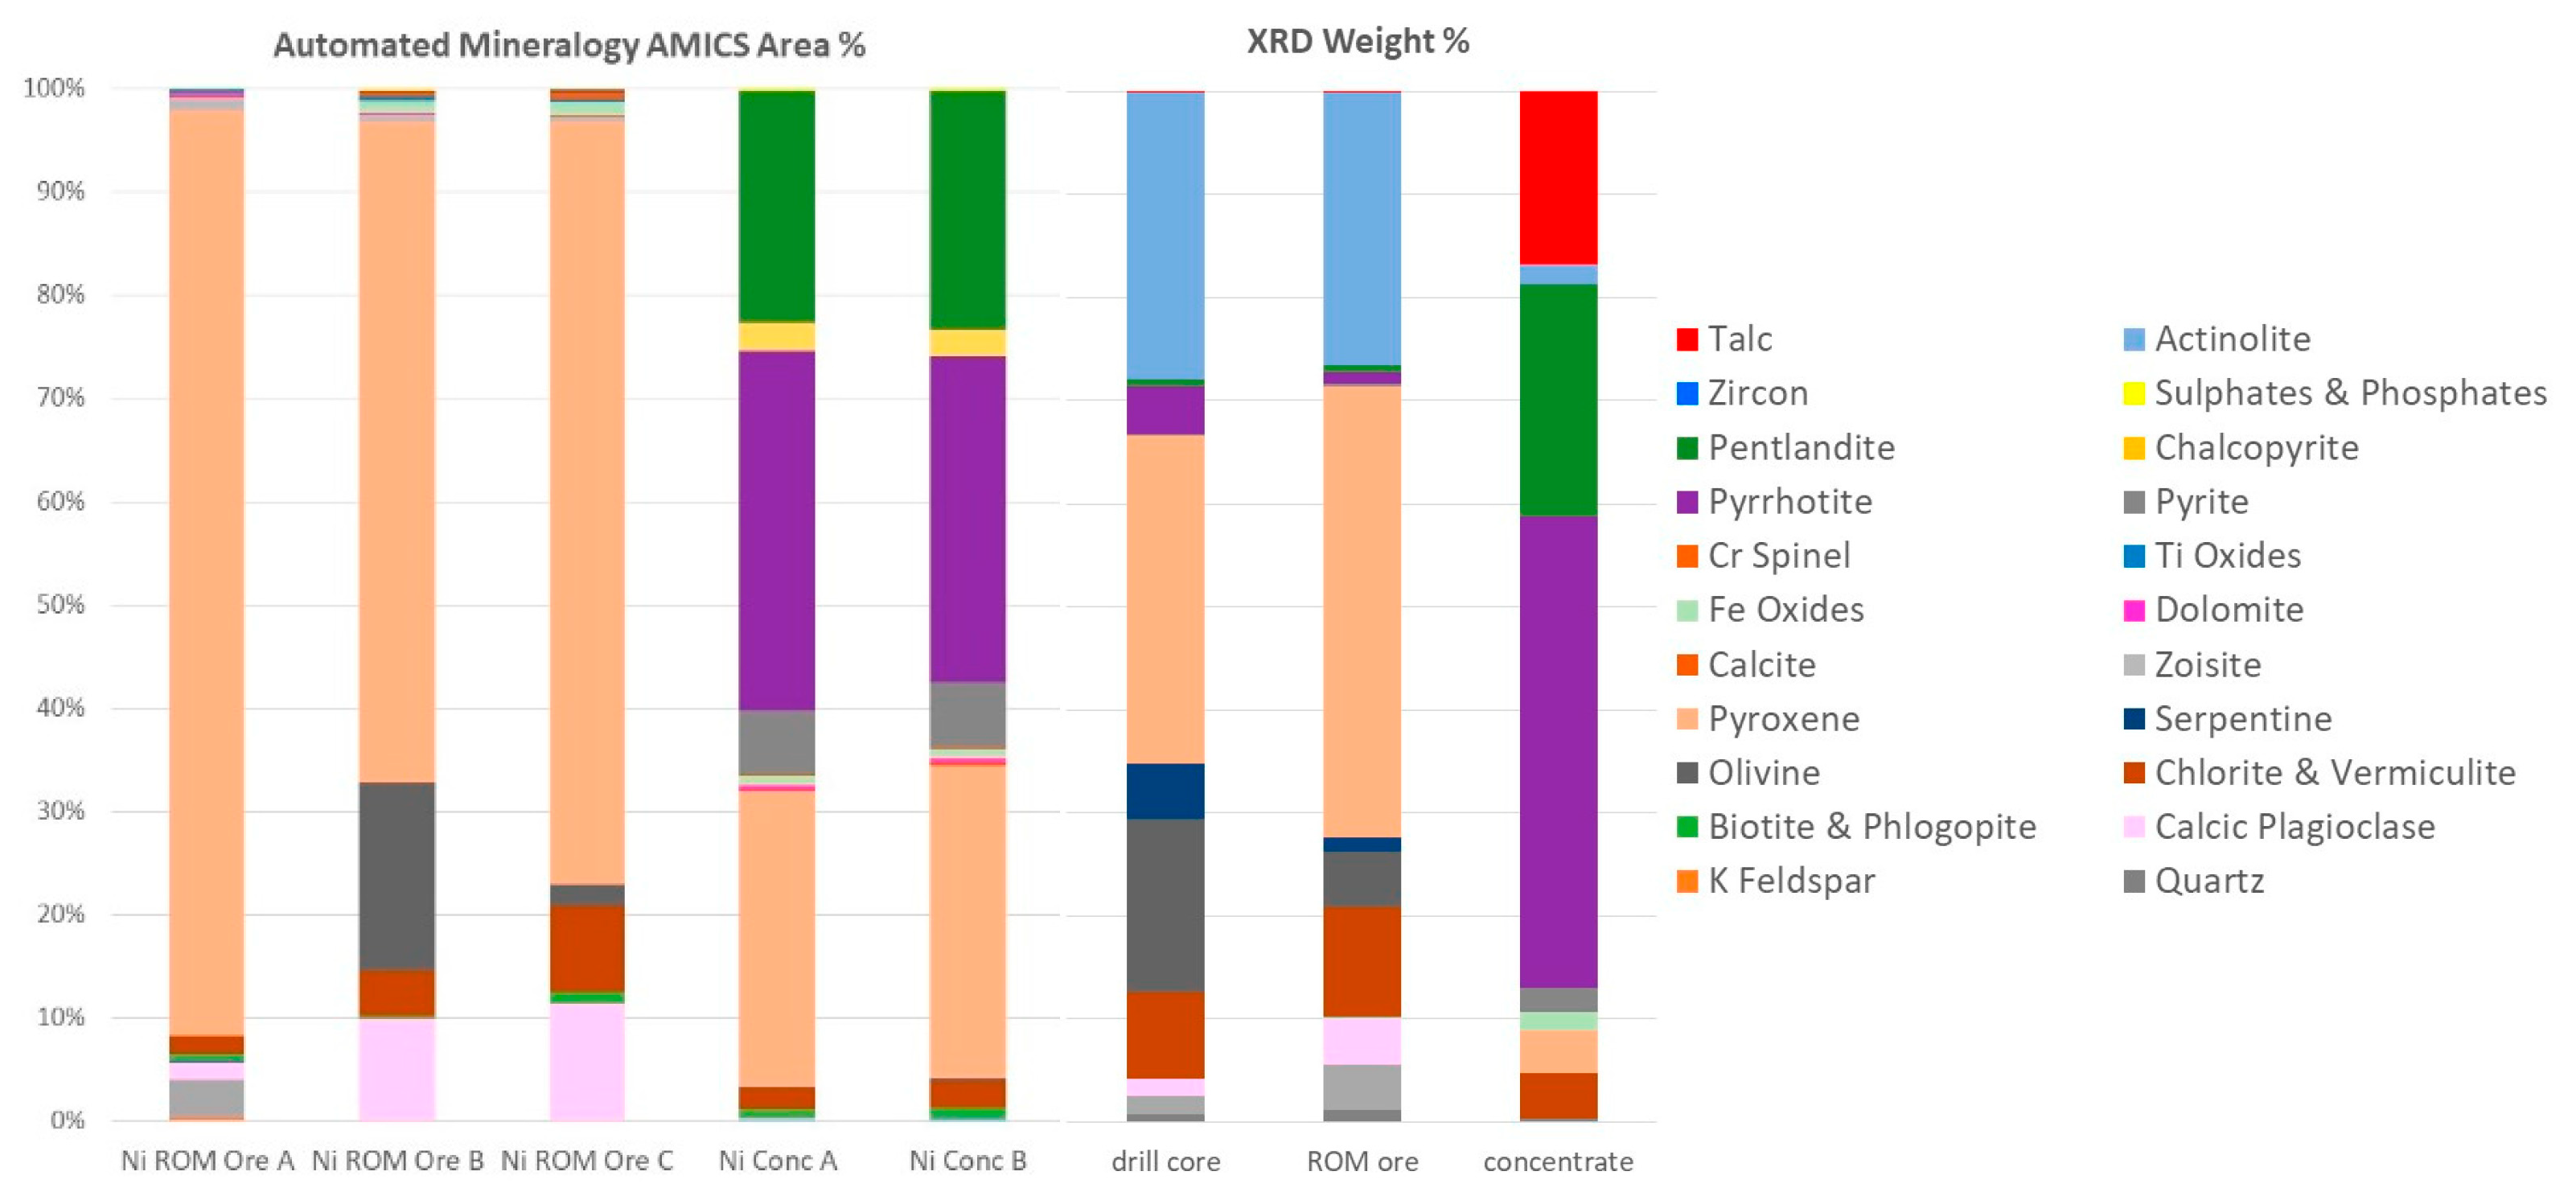
Figure 2.
Modal abundance (area percent) of Ni ROM ore rock fragments A, B, and C, and nickel concentrate replicates A and B with automated mineralogy (note that modal abundances of <0.1% are not included in the graphs). Mineral quantification (weight percent) by XRD analysis of drill core, ROM ore, and Ni concentrate.
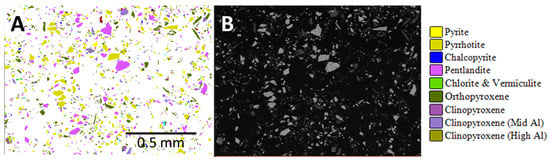
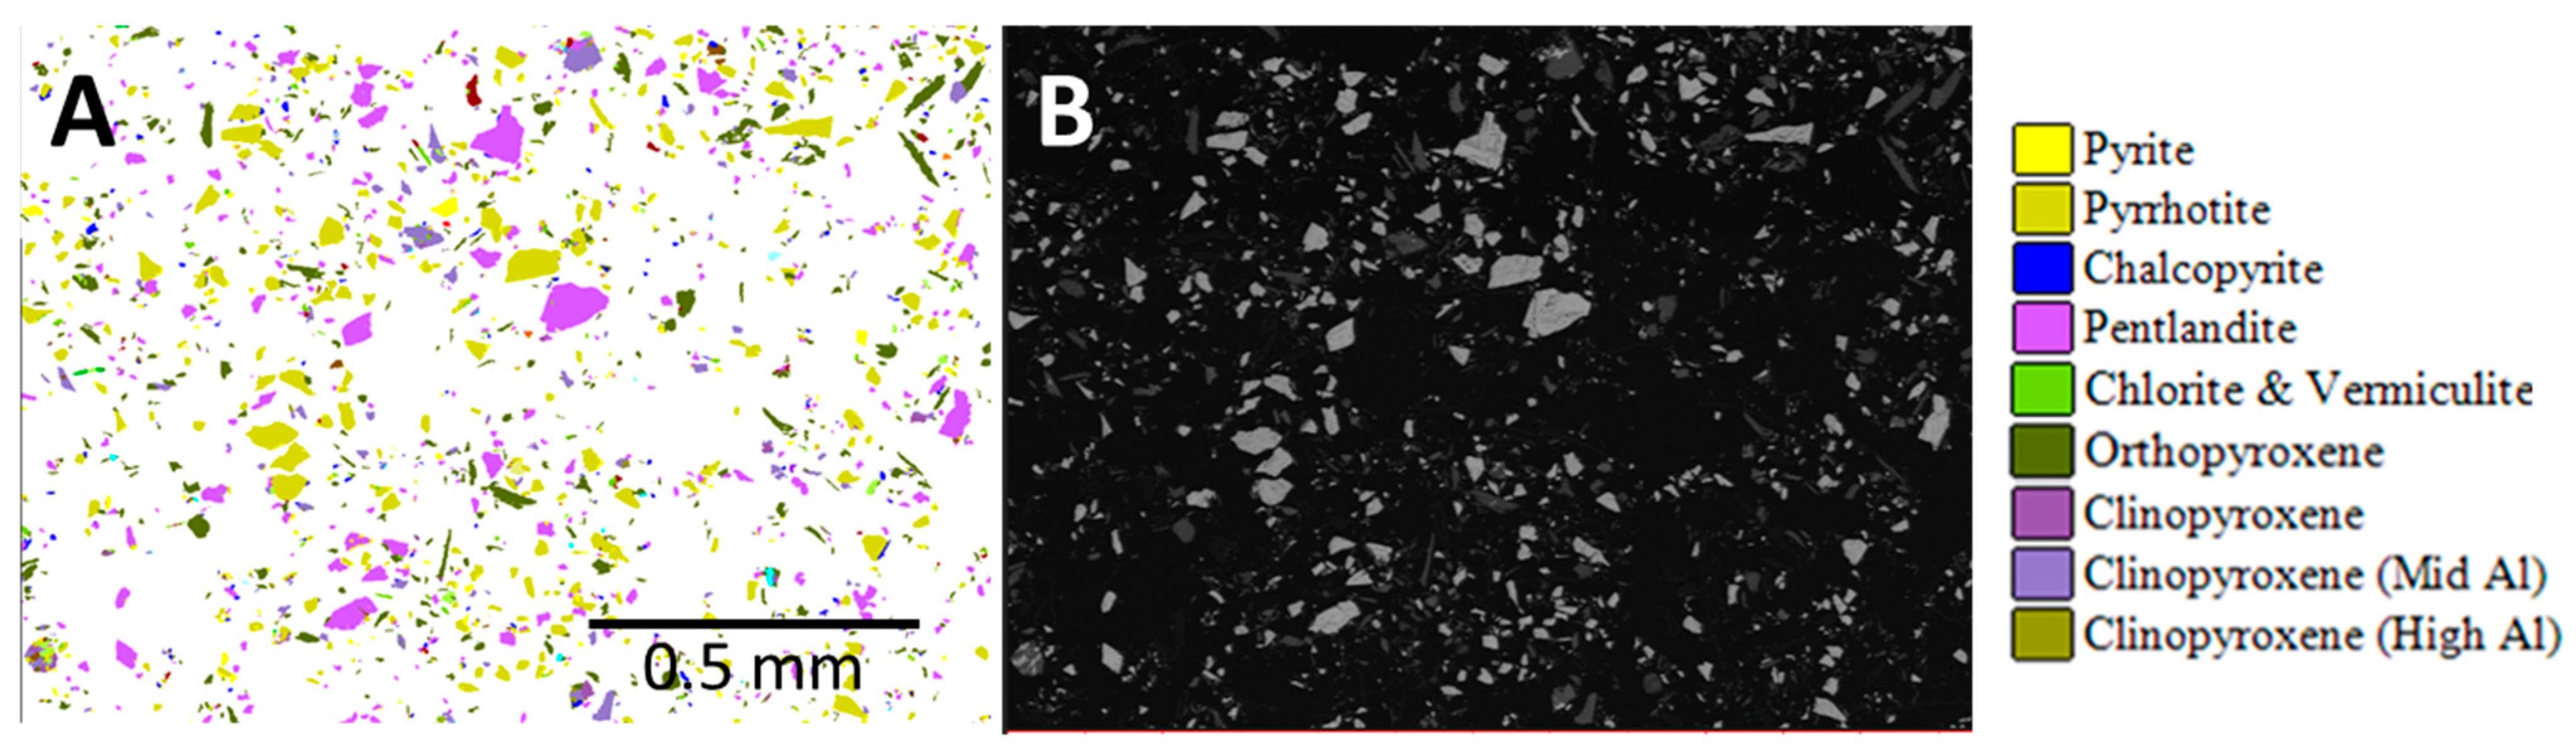
Figure 3.
Automated mineralogy particle maps. (A) Enlarged area AMICS particle image of nickel concentrate sample A and (B) corresponding area SEM-BSE image.
AMICS classified the Mg-rich minerals into six groups (olivine, serpentine, orthopyroxene, and three different clinopyroxene phases), whereas XRD identified five phases (olivine, serpentine, pyroxene, actinolite, and talc). Grain-sized data obtained by AMICS for pentlandite, chalcopyrite, and sphalerite for the nickel concentrate show that >65% of the pentlandite is less than 20 μm, >93% of the chalcopyrite is less than 20 μm, and 86–100% of the sphalerite is less than 20 μm.
2.3. Textural Data—Scanning Micro-XRF and EPMA
Scanning micro-XRF was used to map the nickel-bearing mineral phases onto the representative drill core samples, creating mineral, elemental, and textural distribution maps. The results (Figure 4A) show a correlation between ore grades and texture. High-grade ore is associated with cross-cutting sulfide veins, whereas low-grade ores are disseminated. In all ore grades, the economic minerals are heterogeneously distributed.
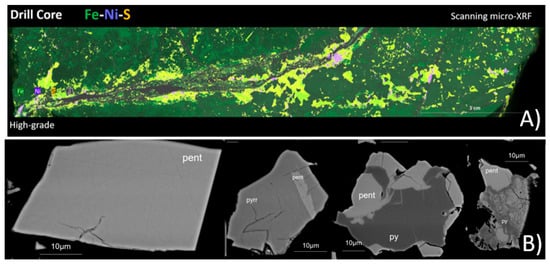
Figure 4.
(A) Example of scanning micro-XRF combined elemental map of a high-grade drill core sample for Fe, Ni, and S. Pentlandite is visualized in purple. (B) Backscattered electron images of pentlandite-bearing (pent) particles in the nickel concentrate. Pyrrhotite (pyrr) and pyrite (py) are also present.
EPMA was used to analyze the micro-chemical composition of pentlandite in the nickel concentrate while acquiring high-resolution images of the particles. The sample was presented to the instrument as an epoxy resin polished block. The results from quantitative analysis show that Co concentration in pentlandite varies from 0.46 wt% to 4.33 wt% and Ni concentration from 29.52 wt% to 34.60 wt%. Pentlandite occurs as fully liberated or partly locked grains in pyrrhotite or pyrite (Figure 4B).
2.4. Spectroscopic Data—Raman Microscopy, LIBS, and FTIR Analyses
Raman, LIBS, and FTIR data were acquired to assess which technique yields the best sample description for further statistical analysis. Raman and LIBS data were acquired on the drill core (Figure 5a), and the FTIR data on the XRD whole-rock powder. The Raman microscopy map and cumulative Raman spectrum show olivine, pyroxene, amphibole, serpentine, and the opaques representing sulfide phases (Figure 5b,c). The key LIBS spectral lines at 324 nm and 327 nm highlight the Cu excitation lines (Figure 5d). Good spectral distinction exists between the silicate and sulfide phases. Distinction between the silicates, however, is ambiguous due to matrix effects and/or similar chemistry and low spatial resolution. Figure 5e shows a sulfide grain adjacent to magnetite, while Figure 5f shows the Cu intensity distribution map, illustrating that the Cu is dominant within the sulfide.
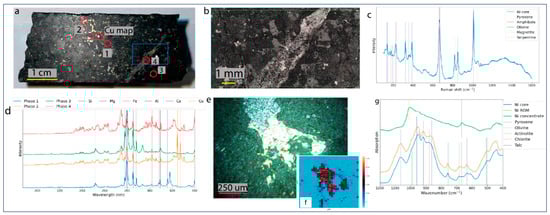
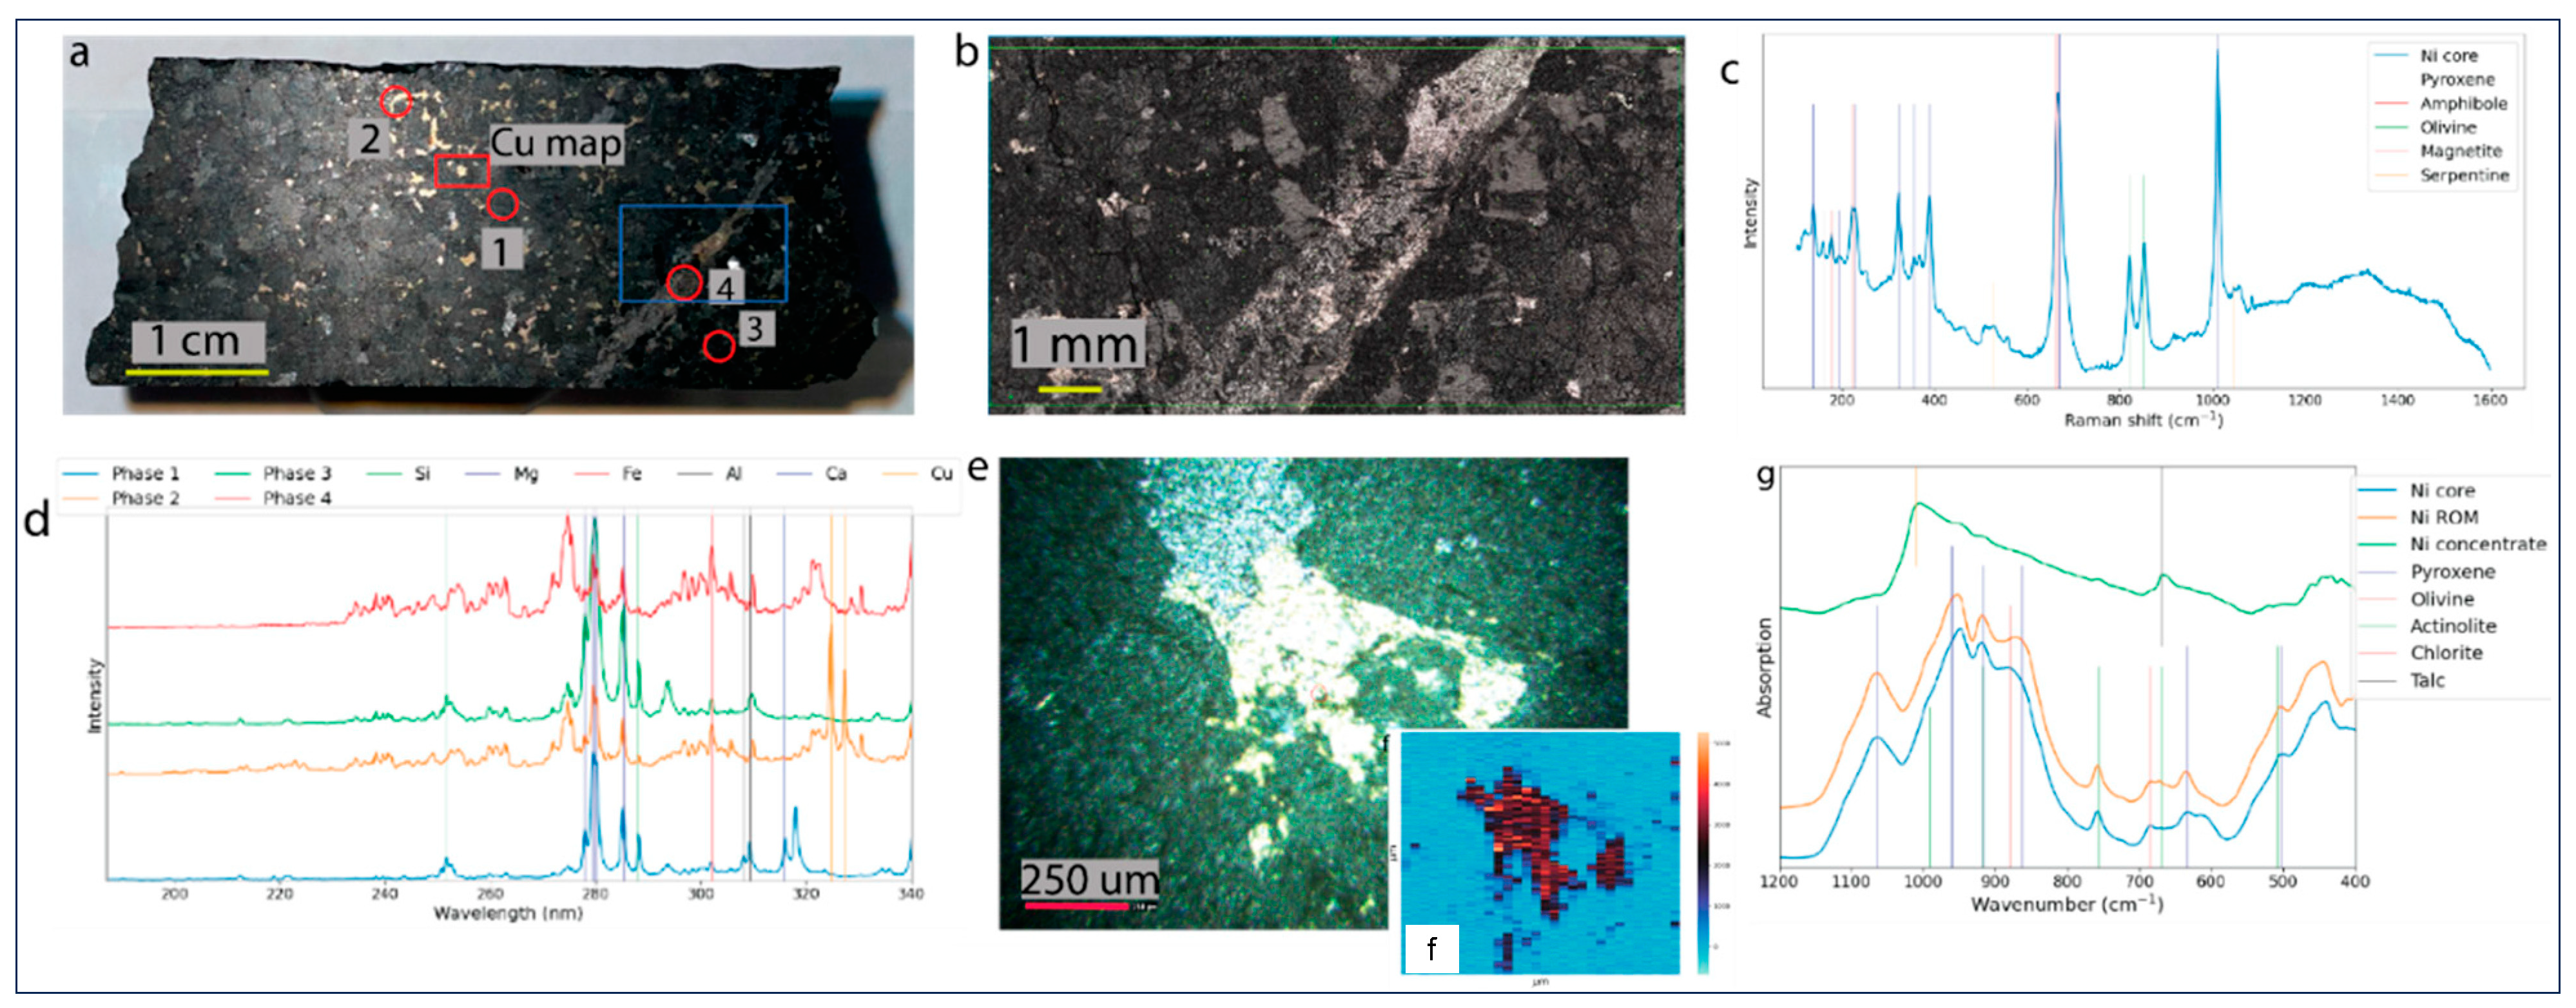
Figure 5.
(a) Polished drill core with analyzed areas annotated with red (LIBS) and blue (Raman). (b) Raman microscopy image of the blue squared area in (a). (c) Cumulative Raman spectra derived from (b), with annotated mineralogical bands. (d) LIBS spectra of spots 1–4 (figure (a)). (e) Image of a magnetite and sulfide grain under LIBS analysis. (f) Cu intensity map of grain in (e). (g) FTIR spectra of drill core, ROM, and nickel concentrate samples, with annotated mineralogical bands.
The FTIR spectrum (Figure 5g) of the drill core and ROM samples are very similar. The nickel concentrate spectrum exhibits fewer wavenumber bands, with a dominant peak at 1010 cm−1 attributed to the sulfide content and a second peak at 669 cm−1 associated with the talc. In general, sulfide phases do not excite well in IR spectroscopy (low signal-to-noise ratio), making any definitive interpretation challenging. Above the 1200 cm−1 region (not shown), the drill core and ROM samples exhibit an amphibole peak at 3680 cm−1.
3. Discussion
The multidisciplinary characterization of these nickel reference materials provided a unique opportunity to compare mineralogical and chemical data at different scales, using different modalities, to cross-validate the data and demonstrate which technique is the most suitable for each material. Both ICP-OES/MS and ED-XRF techniques are capable of measuring the full suite of elements for characterization, with good agreement between lab-based ICP-OES/MS and a portable ED-XRF instrument (Table 1). This demonstrates that portable instruments can be deployed for on-site Ni measurements.
Mineralogical data have been obtained by XRD and automated mineralogy. XRD provides a quantitative and accurate determination of minerals present in a homogenized bulk sample based on the unique structural properties of crystalline material, while the identification of the minerals by AMICS is derived from their micro-chemistry on a 2D subsample. The reconciliation between the two techniques is reasonable for the major mineral groupings when appreciating the differences between the two techniques. An advantage of XRD is its ability to identify talc—a major penalty phase causing disruptions in mineral processing due to its hydrophobic nature. In turn, AMICS is very powerful in analyzing and imaging minerals present at low concentrations that cannot be detected by XRD. Moreover, AMICS provides vital textural and association data. Hence, these techniques should be considered complementary and used simultaneously. The quantification of pentlandite calculated by XRD has been verified against the Ni content obtained by ICP-MS using a mass balance approach. At low concentration, there is a good correlation between the pentlandite quantification by XRD and Ni content by ICP-MS. For the nickel concentrate sample, automated mineralogy has quantified pentlandite at 22.8% (average—modal mineralogy mass) and XRD at 22.6%, suggesting higher Ni content than that measured by ICP-MS.
FTIR is a very efficient technique that can rapidly collect valuable bulk mineralogical/structural information on-site. However, in order to fully exploit its capabilities, more samples are required for building appropriate classification and quantification models [4]. Good results on laboratory-based Raman and LIBS instruments suggest that the techniques can also provide robust data on portable instruments upon appropriate calibration.
4. Conclusions
This study summarizes the results of a comprehensive multidisciplinary geochemical, mineralogical, and textural characterization of three nickel reference materials including ¼ drill cores, run-of-mine ore, and nickel concentrate. The three samples have been characterized using the META multidisciplinary geomaterial workflow whereby mineralogical, elemental, or textural data can be cross-validated to provide the most accurate data and an insight into the capability of each technique.
Based on the results presented above, the best combination of techniques depends on the scale of observation required. Bulk analytical techniques such as XRD and ICP provide the gold standard methods for mineralogical and chemical analysis, particularly when used together. Portable ED-XRF technology has also been proven to measure comparable fast and cost-efficient data on-site. In addition to this, automated mineralogy offers both mineralogical and textural insights.
From a textural perspective, automated mineralogy and micro-XRF complement each other. EPMA is capable of quantifying mineral micro-chemistry, such as the distribution of Co-rich pentlandite within individual grains. Raman microscopy is not only a spectroscopic tool but also a mineralogical mapping tool, with direct mineralogical identification. LIBS technology is a very powerful tool and can be used for spectroscopic characterization, elemental quantification (when coupled with ICP-OES/MS), or textural characterization.
Supplementary Materials
An extended copy of the study can be found at: https://tupa.gtk.fi/raportti/arkisto/26_2023.pdf (16 January 2024).
Author Contributions
Conceptualization, A.R.B., L.S. and N.A.; methodology, L.S., N.A., J.H. and A.R.B.; software, L.S. and N.A.; validation, L.S. and N.A.; formal analysis, L.S. and N.A.; investigation, L.S., N.A., M.F., S.L., R.M.M., E.M.J. and T.J.P. resources A.R.B.; data curation, L.S. and N.A.; writing—original draft preparation, L.S., N.A., J.T. and A.R.B.; writing—review and editing, A.R.B., L.S., N.A., J.H. and J.T.; visualization, L.S. and N.A.; project administration, A.R.B.; funding acquisition, A.R.B. All authors have read and agreed to the published version of the manuscript.
Funding
This study was partially funded by Business Finland, as part of the BATCircle 2.0 Project, Work Package 5, Circular Battery Materials Value System. Micro-XRF was supported by the Academy of Finland via RAMI infrastructure project (#337560).
Data Availability Statement
Data is contained in the article.
Acknowledgments
Duncan Pirrie, Helford Geoscience LLP, and Matt Power, Vidence are acknowledged for the automated mineralogy analysis.
Conflicts of Interest
The authors declare there are no conflicts of interest.
References
- Santaguida, F.; Luolavirta, K.; Lappalainen, M.; Ylinen, J.; Voipio, T.; Jones, S. The Kevitsa Ni-Cu-PGE deposit in the Central Lapland Greenstone Belt in Finland. In Mineral Deposits of Finland; Maier, W.D., Lahtinen, R., O’Brien, H., Eds.; Elsevier: Amsterdam, The Netherlands, 2015; pp. 195–210. [Google Scholar] [CrossRef]
- Post, J.E.; Bish, D.L. Rietveld Refinement of Crystal Structures Using Powder X-Ray Diffraction Data. Miner. Soc. Am. 1989, 20, 277–308. [Google Scholar]
- Bish, D.L.; Post, J.E. Quantitative Mineralogical Analysis Using the Rietveld Full-Pattern Fitting Method. Am. Miner. 1993, 78, 932–940. [Google Scholar]
- Calvert, C.S.; Palkowsky, D.A.; Pevear, D.R. A Combined X-Ray Powder Diffraction and Chemical Method for the Quantitative Mineral Analysis of Geologic Samples. In Quantitative Mineral Analysis of Clays; Clay Minerals Society Workshop Lectures: Chantilly, VA, USA, 1989; ISBN 978-1-881208-21-1. [Google Scholar]

Disclaimer/Publisher’s Note: The statements, opinions and data contained in all publications are solely those of the individual author(s) and contributor(s) and not of MDPI and/or the editor(s). MDPI and/or the editor(s) disclaim responsibility for any injury to people or property resulting from any ideas, methods, instructions or products referred to in the content. |
© 2024 by the authors. Licensee MDPI, Basel, Switzerland. This article is an open access article distributed under the terms and conditions of the Creative Commons Attribution (CC BY) license (https://creativecommons.org/licenses/by/4.0/).