Abstract
Detecting coastal morphodynamics is a crucial task for monitoring shoreline changes and coastal zone management. However, modern technology viz., Geoinformatics paves the way for long-term monitoring and observation with precise output. Therefore, this study aimed to produce explicit shoreline change maps and analyze the historical changes of the coastline at the east coast of the Ampara District in Sri Lanka. The histogram threshold method is used to extract data from satellite images. The time-series satellite images, acquired from 1987 to 2017, toposheet, and Google Earth historical images were compared having adjusted with the ground-truth to find the seashore changes in the study area. The histogram threshold method is used on band 5 (mid-infrared) for separating land from water pixels which means that the water pixel values were classified to one (1) and land pixel values to zero (0). The extracted shoreline vectors were associated with each other to determine the dynamics of changing shoreline of the study area. The Digital Shoreline Analysis System (DSAS) was used to find shoreline movements for each period of time. As a result, it was observed by the cross-section analysis within 100 m shoreline—seaward range along the study area—in which severe erosion has occurred northward of the Oluvil Harbor and anomalous accretion southward of the harbor because of the breakwaters constructed in the port entrance which hinder the long shore sediment transport along the study area. This situation has resulted in many ramifications to the coastal zone of the study area in socio-economic and environmental aspects in which the coastal protection mechanisms have not been well implemented to curb such issues.
1. Introduction
Ecosystem conservation and environmental management of coastal habitats are essential for safeguarding the security, good living conditions of the society, and the success of socio-economic ranges of the coastal fringe community. Thus, urgent efforts are needed to conserve the coastal environment from the poor coastal zone management process, which ignores natural ecosystems that have seriously been impacted by climatic and/or anthropogenic actions. Coastal zone management helps minimize impacts arising from natural and manmade disasters, such as sea-level rise, tsunami, erosion and biodiversity loss [1].
The coast comprises the interface between land and sea, and the shoreline is represented by the margin between the two [2]. Because of the dynamic nature of the shoreline, morphological features, such as dune crest and cliff, vegetation line, and hydrology, are useful to determine the shoreline position [3]. This context reveals that the coast and shoreline are most commonly employed for the purpose of shoreline change mapping.
The radical change of the shoreline over time is one of the most important factors to be taken into consideration when designing structures along the coastline [2,3,4,5,6,7]. Detecting, extracting and monitoring shoreline changes using historical Google Earth images, aerial photography, unmanned aerial vehicle survey, and ground truth survey using GPS and real-time kinematic are vital for coastal zone management [8,9]. Physical and anthropogenic activities trigger shoreline changes in various aspects such as erosion and accretion [10,11,12,13,14,15,16,17].
This study targets to delineate the adaptation to the ever-changing shoreline using the GIS technology with particular focus on the histogram thresholding method [13] in the coastal area of the Ampara District Sri Lanka. The geomorphology of the east coast is characterized by three major landforms, such as bay and headlands, straight sandy shoreline/beaches, and deltas/saline flats [18]. The coastal habitats in the Ampara District are vulnerable to sea-level rise, storm surges, i.e., tsunami and flooding. The coastal vegetation consists of mangroves, shrubs, and coconut and paddy plantations [19]. The beach of Ampara District consists of a gentle seabed with fine sand. It has perpetually been subjected to erosion and accretion due to natural and anthropogenic factors. For example, the Oluvil harbor construction area was highly eroded due to dredging and nourishment operations and historical images showed that the vegetation cover and a shoreline recession have significantly changed before and after the development [6,7,10,11,12,13]. The key factors of changing the shoreline in the Oluvil harbor northwards to the Nochchiyadi river mouth are either erosion or accretion which was observed at a rate of 7.81 ha erosion and −0.23 ha annual growth rate between 1981 and 2015 [6]. Many studies have been presented the coastal morphodynamic conditions using various low-cost technological advancements such as kite aerial photography [6,13,20].
The objectives of this study are (a) to map historical changes of the shoreline over 30 years in the Oluvil Harbor area, (b) to detect shoreline morphodynamics using time series data from 1987 to 2017, and to show the intensity of shoreline changes with the aid of GeoSpatial Technology.
2. Study Area
2.1. Oceanographic and Climate Framework
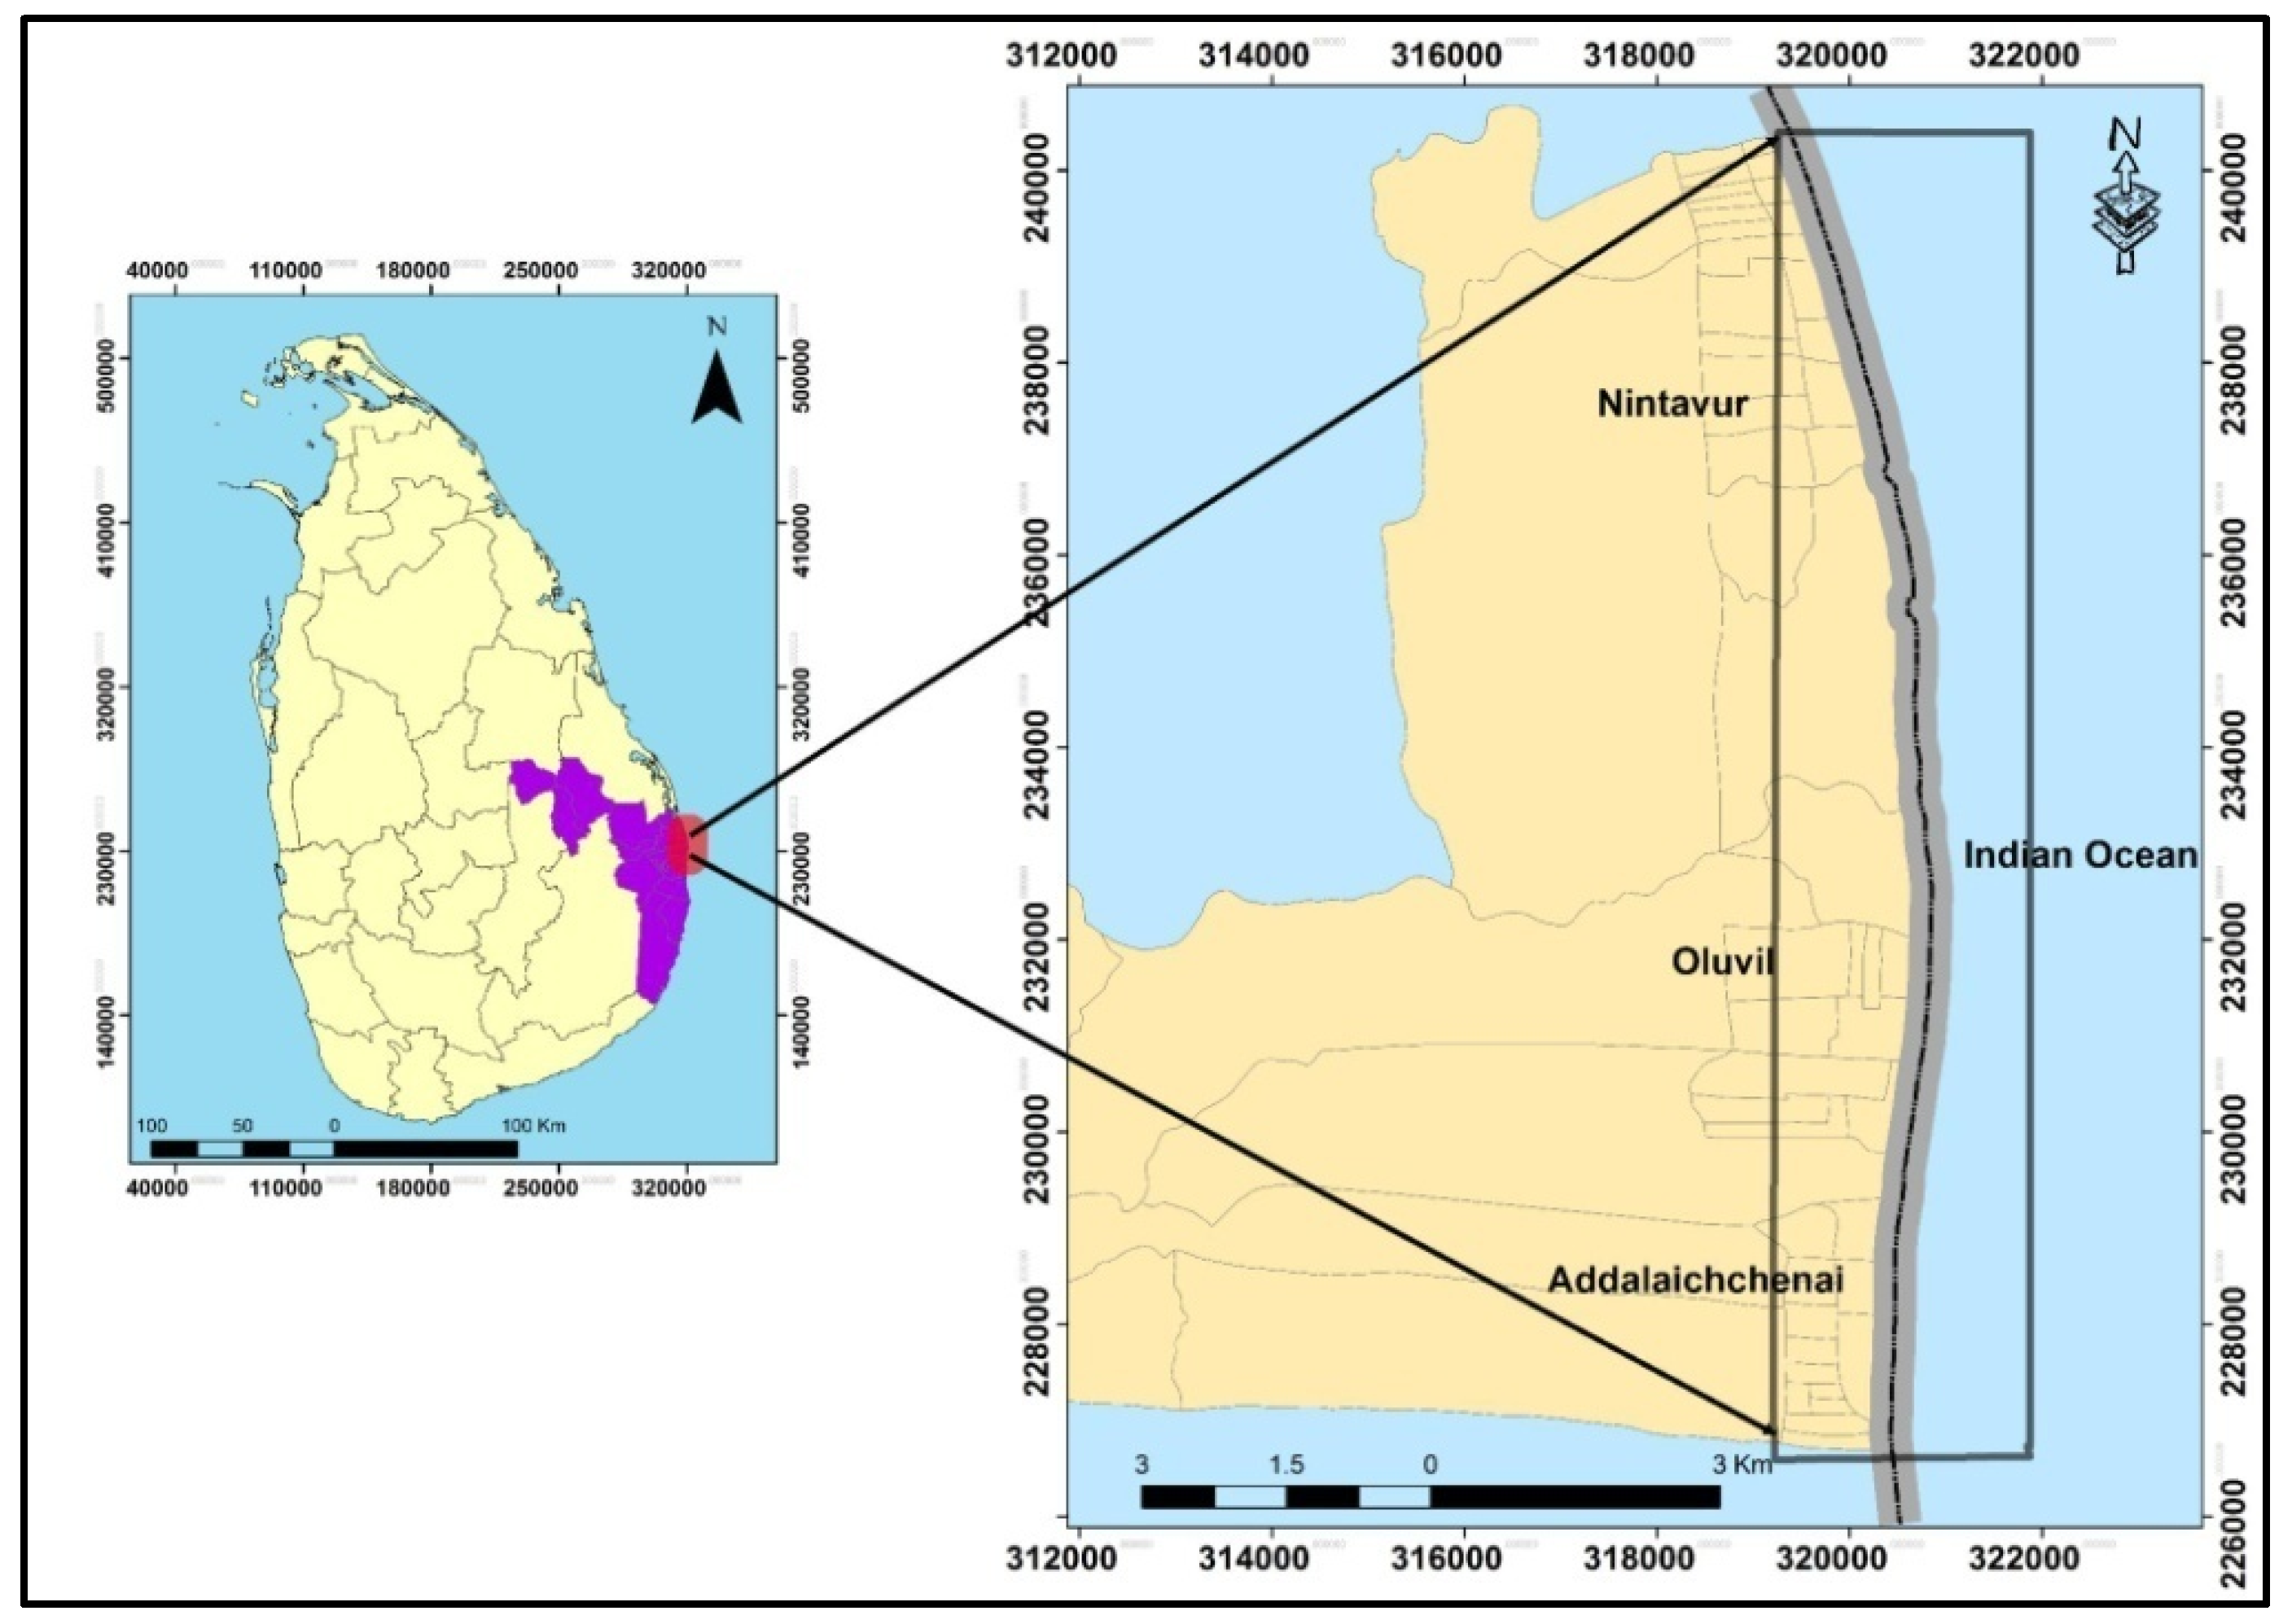
The study area is located between longitude 70°20′48″ to 70°20′55″, and latitude 81°51′23″ to 81°55′23″ on the east coast of the Ampara District in Sri Lanka (Figure 1). The length of the shoreline is about 6 km from Nochchiyadi (Nintavur) in the north to Palamunai (Addalaichchenai) in the south. The areas of the beach are interrupted by the Kaliodai River. According to the climate classification defined by Köppen [21], the Oluvil study area falls under a tropical dry or savanna climate and the ample rainfall receptionis recorded in northeast monsoon period, prevails between November to January.
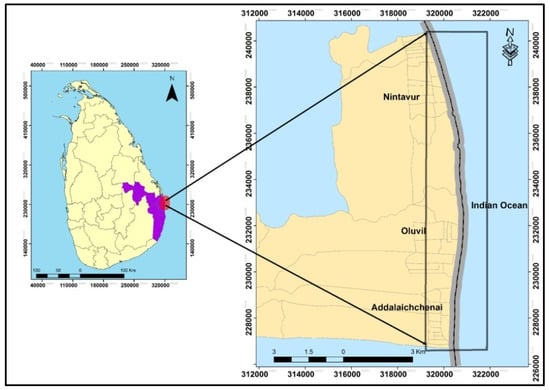
Figure 1.
Study area between Nintavur and Addalaichchenai.
In the study area, the influence of the tide on the coast is lower but the maximum water level is observed in December–January and the minimum sea water level is observed in the August–September period. This is because the monsoonal wind influences the study area. During such periods, for the maximum sea water level, the erosion increases in the coast due to the increasing inundation as well as for the minimum water level, the sedimentation occurs along the study area. The tidal range and seasonal range of sea level around the coast of Sri Lanka is 0.4 m to 0.6 m and 20 cm–30 cm, respectively. The tidal range around Sri Lanka shows lower variability as it is the semi-diurnal type. Yet, the tidal variability on the east and west coast reflects slightly higher (0.44 m) variability [20,22].
According to Frigaard and Margheritini [23], the wave heights range from 0.5 m to 2.0 m on the coast of the study area. The coastal morphological changes occur due to the dynamics of the monsoonal wind. Longshore sediment transport from south to north is triggered by waves coming from the southern direction resulting in the sedimentation in the port entrance plus anomalous erosion and accretion in the north and south, respectively [24]. In addition, waves from northerly directions create longshore sediment transport from south to north resulting in accretion in the port entrance and erosion in the southward direction of the port.
2.2. Geographic and Geologic Framework
The coastal zone is defined in Sri Lanka as “the area lying within a limit of 300 m landward of the mean high-water level and a limit of 2 km seaward of the mean low water level” [24]. The morphological changes of the Nintavur coastal areas in Ampara District have been identified as the factors influencing the waves and river flooding of the Nochcniyadi and Wavvalodai rivers [25]. The flooding broke sand bars across the river mouth resulting in a widened estuary, increased sediment load, and coastal erosion. In order to control the coastal erosion, offshore breakwaters were constructed in the Indian Ocean. Subsequently, those breakwaters have created the tombolo landforms and small bays in the embayment of the coast. The eastern coastline of Sri Lanka is configured with gentle fine sand. Because of this nature, it is subjected to frequent modification because of the wave action in the study area.
Many unplanned human activities particularly marine infrastructure developments have harmed the coastal environment of the study area. According to Ameer [26], the port constructed within the period 2008–2012 has affected the Oluvil area heavily. According to the long-term observation, it is evident that the port construction has induced erosion northward of the port and accretion southward of the port anomalously, yet, creating frequent modification in the beach profile. Unlike natural harbors, the Oluvil port is a man-made harbor and the breakwaters at the entrance were built at the length of 1320 m with the view to curb the wave surge. After 2013, since the port was in operation, erosion and accretion were observed northwards and southwards of the port, respectively. Then, it was decided to construct three more offshore breakwaters with the length of 100 m each with selected dimensions and at a selected spacing. Fishbone groins and artificial nourishment of the eroded beach have been established to mitigate erosion and accretion impact in Oluvil beach [27]. Nonetheless, the offshore breakwater construction and artificial nourishment operations were futile against the anomalous erosion and accretion on the coast and the fishbone groins were not implemented in the coast of study area. The dredging of the port entrance in order to navigate the vessels still induces erosion in the northward of the port. A major portion of the Kaliodai river mouth was also affected because of the construction of a port in the study area.
3. Materials and Methods
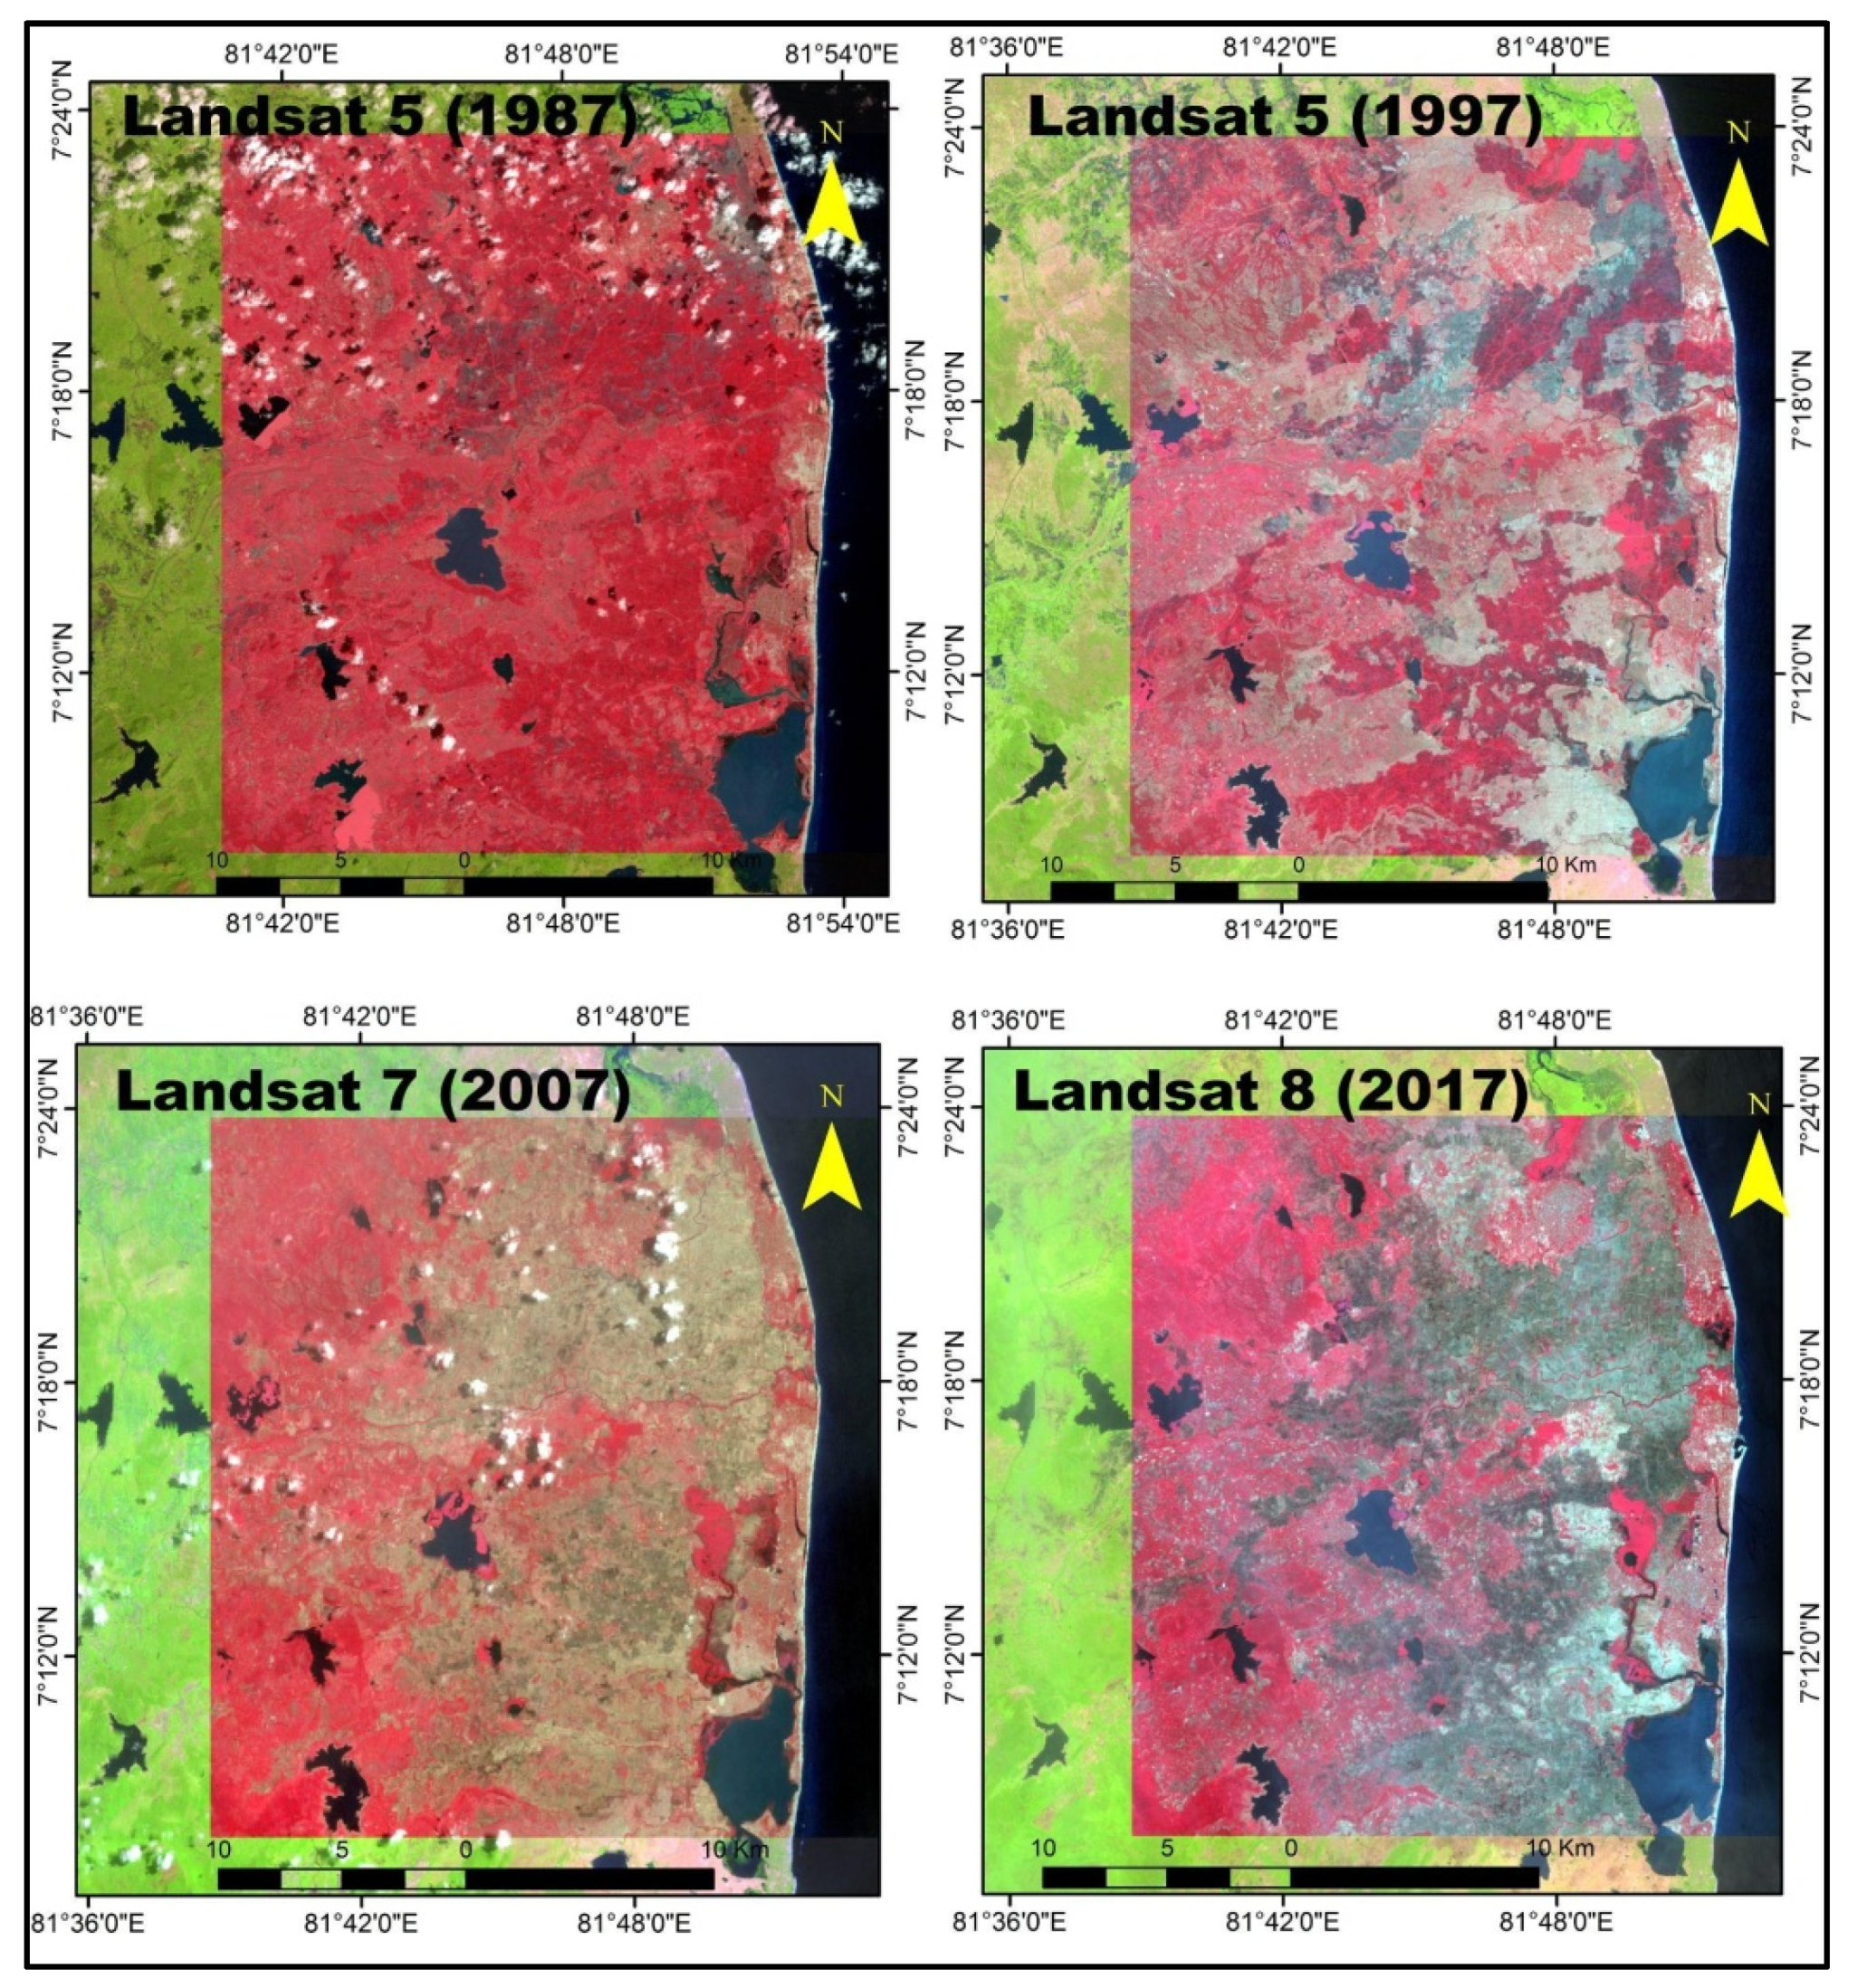
Remote Sensing data covering the coastal area of Ampara District were acquired from Landsat ETM+ (1987, 1997, 2007) and Landsat OLI/TIRS (2017) from the Earth Explorer web portal (https://earthexplorer.usgs.gov/, accessed on: 2 March 2020). The spatial resolution for the Landsat data was 30 m (Table 1). Thus, Google Earth images and toposheets were compared and adjusted to find the historical changes of the beaches in the study area. The four Landsat images were geo-referenced at the Universal Transverse Mercator projection zone 44N and resampled to 30 m with the nearest neighborhood algorithm [28]. The ERDAS Imagine (version 14.1) and ENVI (version 4.2) software were used for image analysis and visualize the water-land interface. Figure 2 shows Landsat satellite images in false color for 1987, 1997, 2007, and 2017.

Table 1.
Data acquisition and sensor information.
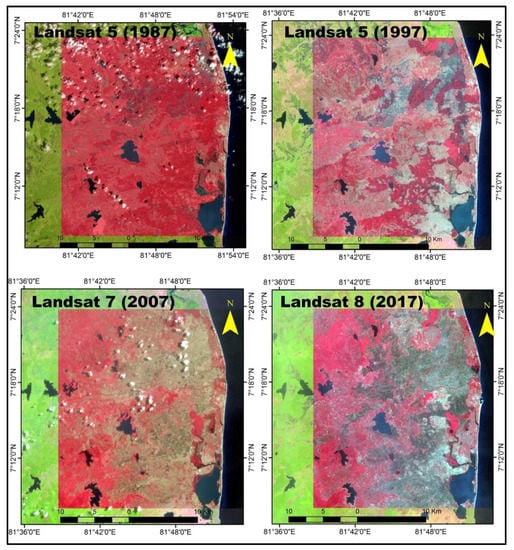
Figure 2.
Landsat images of false-color combination for 1987 and 2017 period at the east coast of the Ampara District in Sri Lanka. The coordinate system of the study area is WGS 84 UTM Zone 44 N.
This approach is evaluated by accuracy assessment which requires the ground truth maps to find the extracted ever-changing coastal morphodynamics to compare with the shoreline from the time-series images. The binary images were obtained by geometric and radiometric correction from the image process techniques. The 1987 Landsat TM image was used as the reference image for registering the other images through image-to-image registration. We used twenty ground control points for georeferencing and we set the root mean square error (RMSE) ≤ 0.5 pixels, revealing a high geometric matching of the Landsat images. The techniques were processed in the ArcGIS software (version 10.3) to extract the pixel information of the ever-changing coastal morphology. Land and water features were produced using raster-to-vector conversion methods in each image. Then, the two polyline layers were overlaid to estimate shoreline changes (i.e., measuring the distance between lines through cross-shore transects) as well as to explore the erosion or accretion pattern in the coastal area in each period; 1987–1997, 1997–2007, and 2007–2017. The space between cross-shore transects was 100 m and the measuring tool in ArcMap was used to measure the distance.
Nevertheless, this study explores a new method to delineate the adaptation to the ever-changing shoreline with the histogram thresholding method [12]. The study uses satellite data acquired in 10 years’ time series for three decades. The histogram thresholding method is used on band 5 (mid-infrared) for separating land from water. The threshold values have been chosen such that all water pixels are classified as water, and most of the land pixels have been classified as land. In this case, water pixels are then assigned to one and land pixels to zero [15].
4. Results
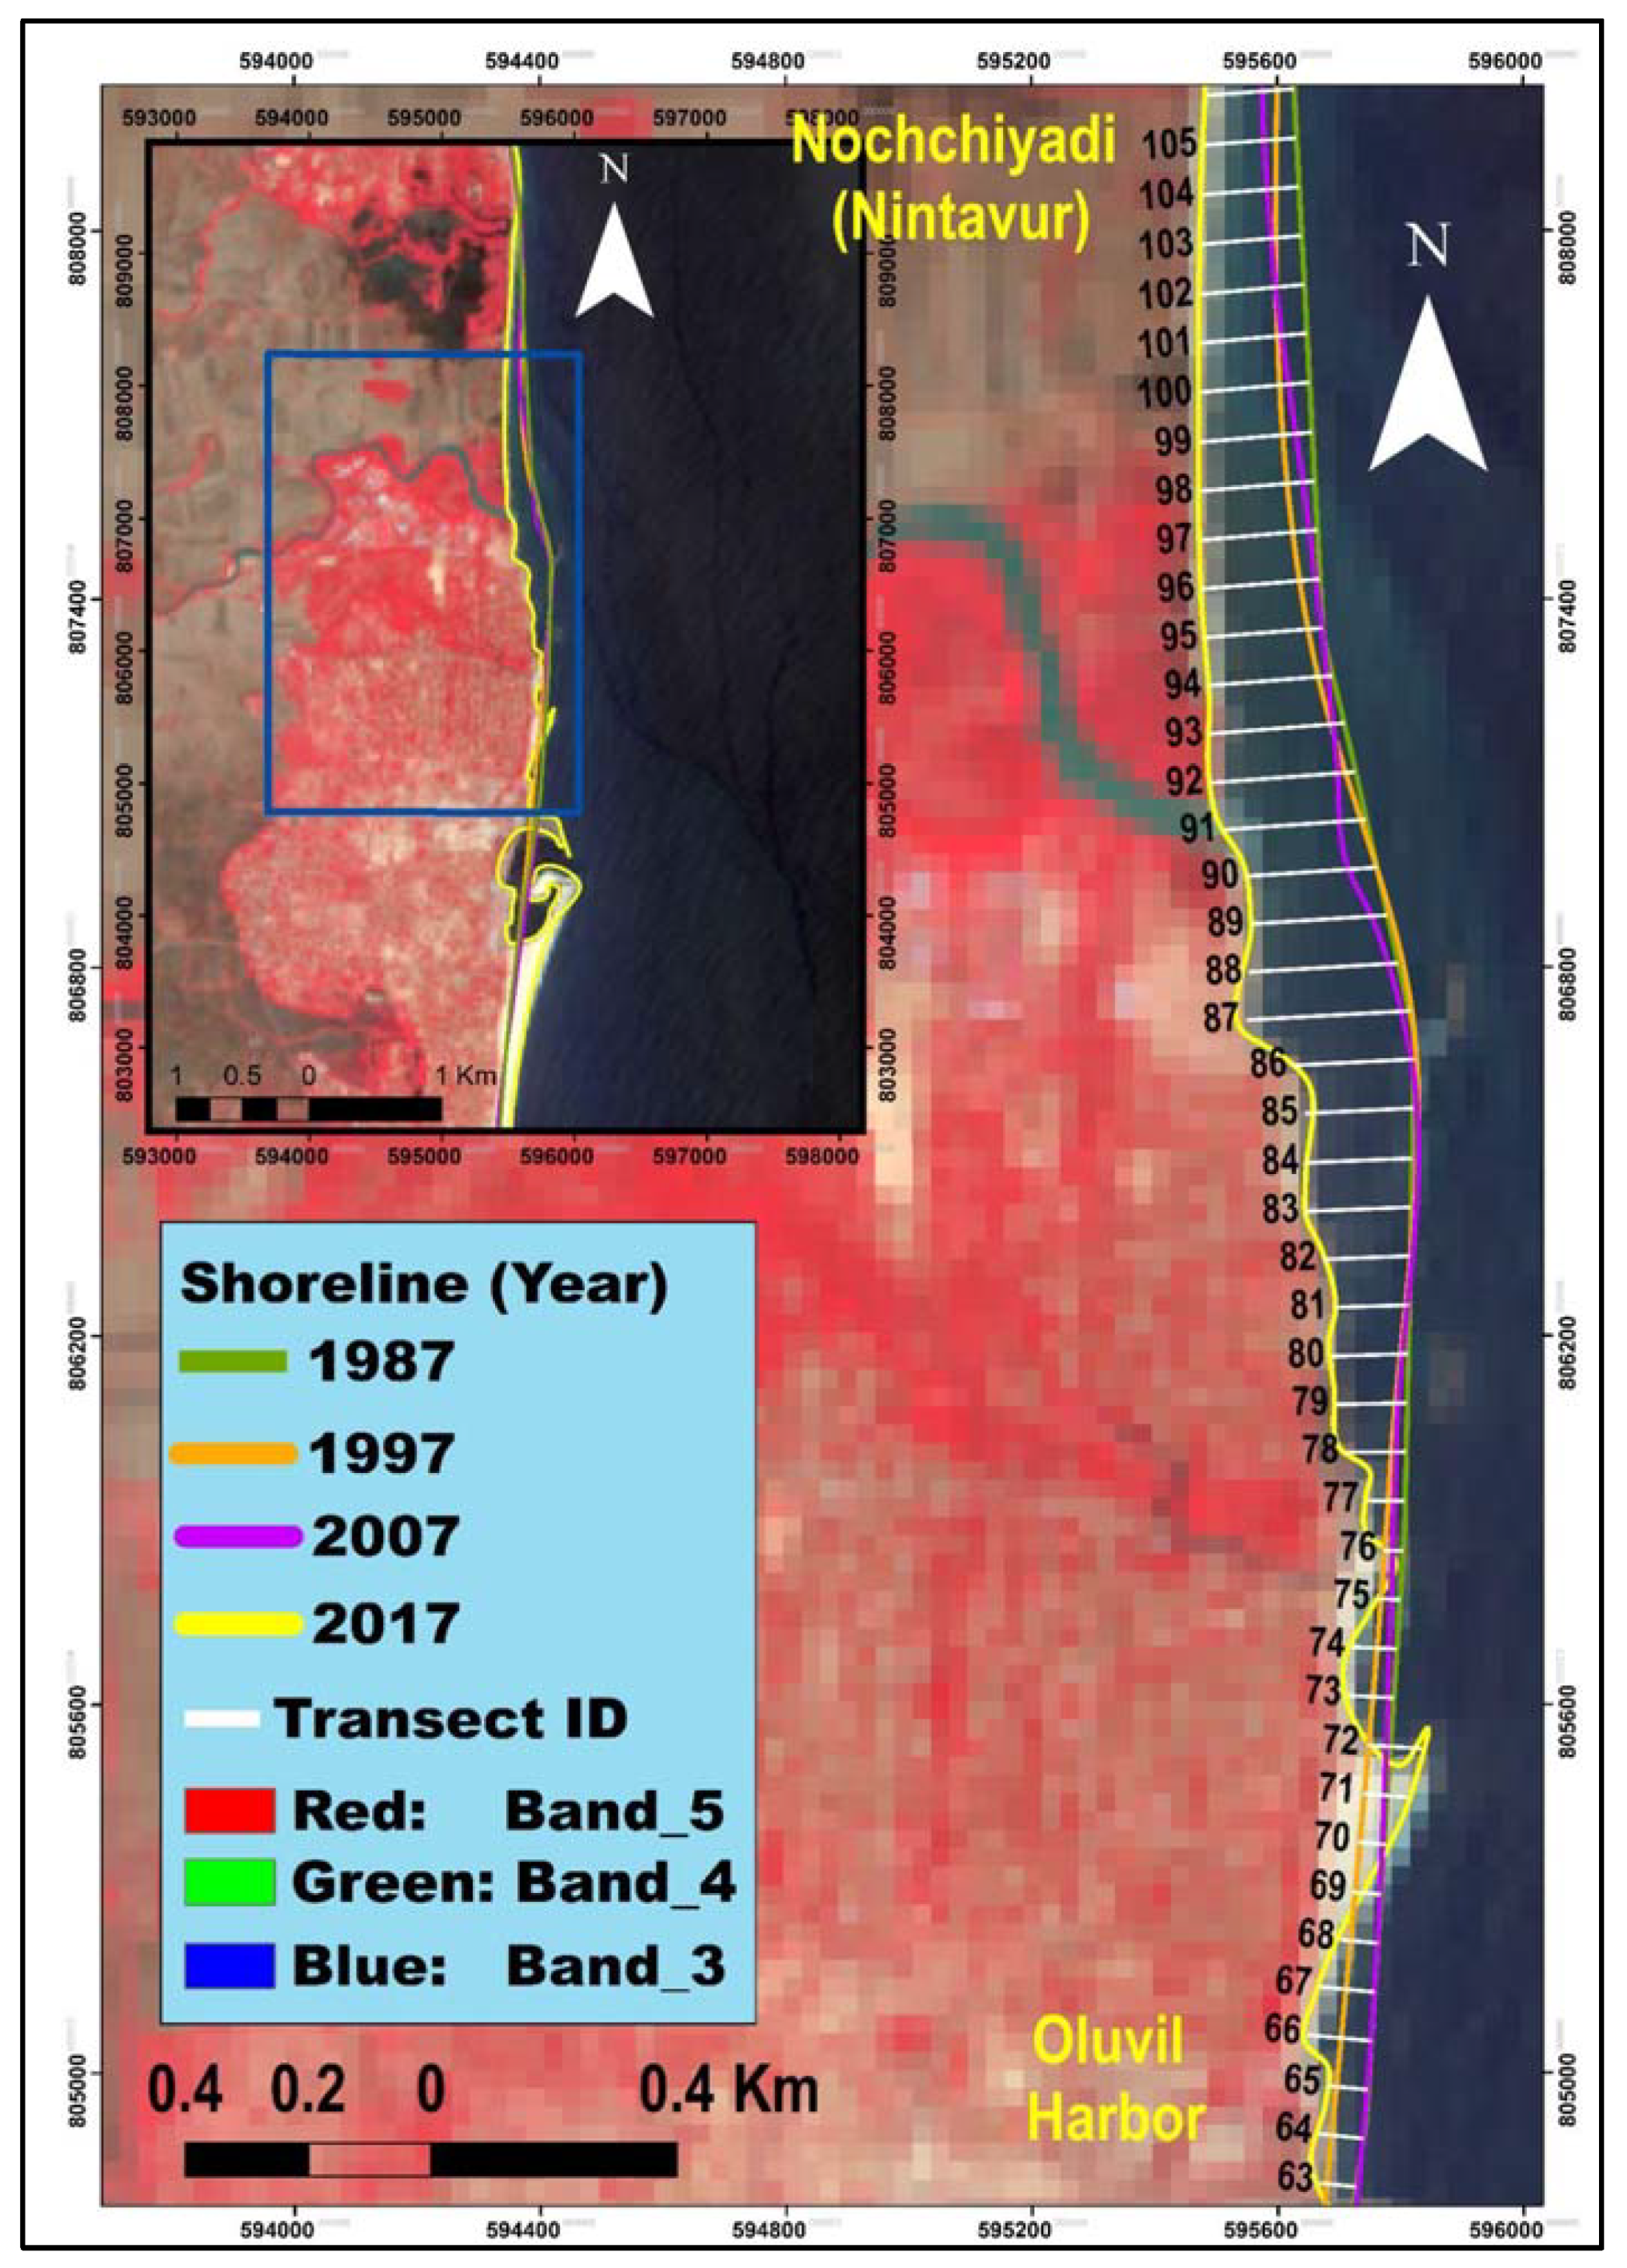
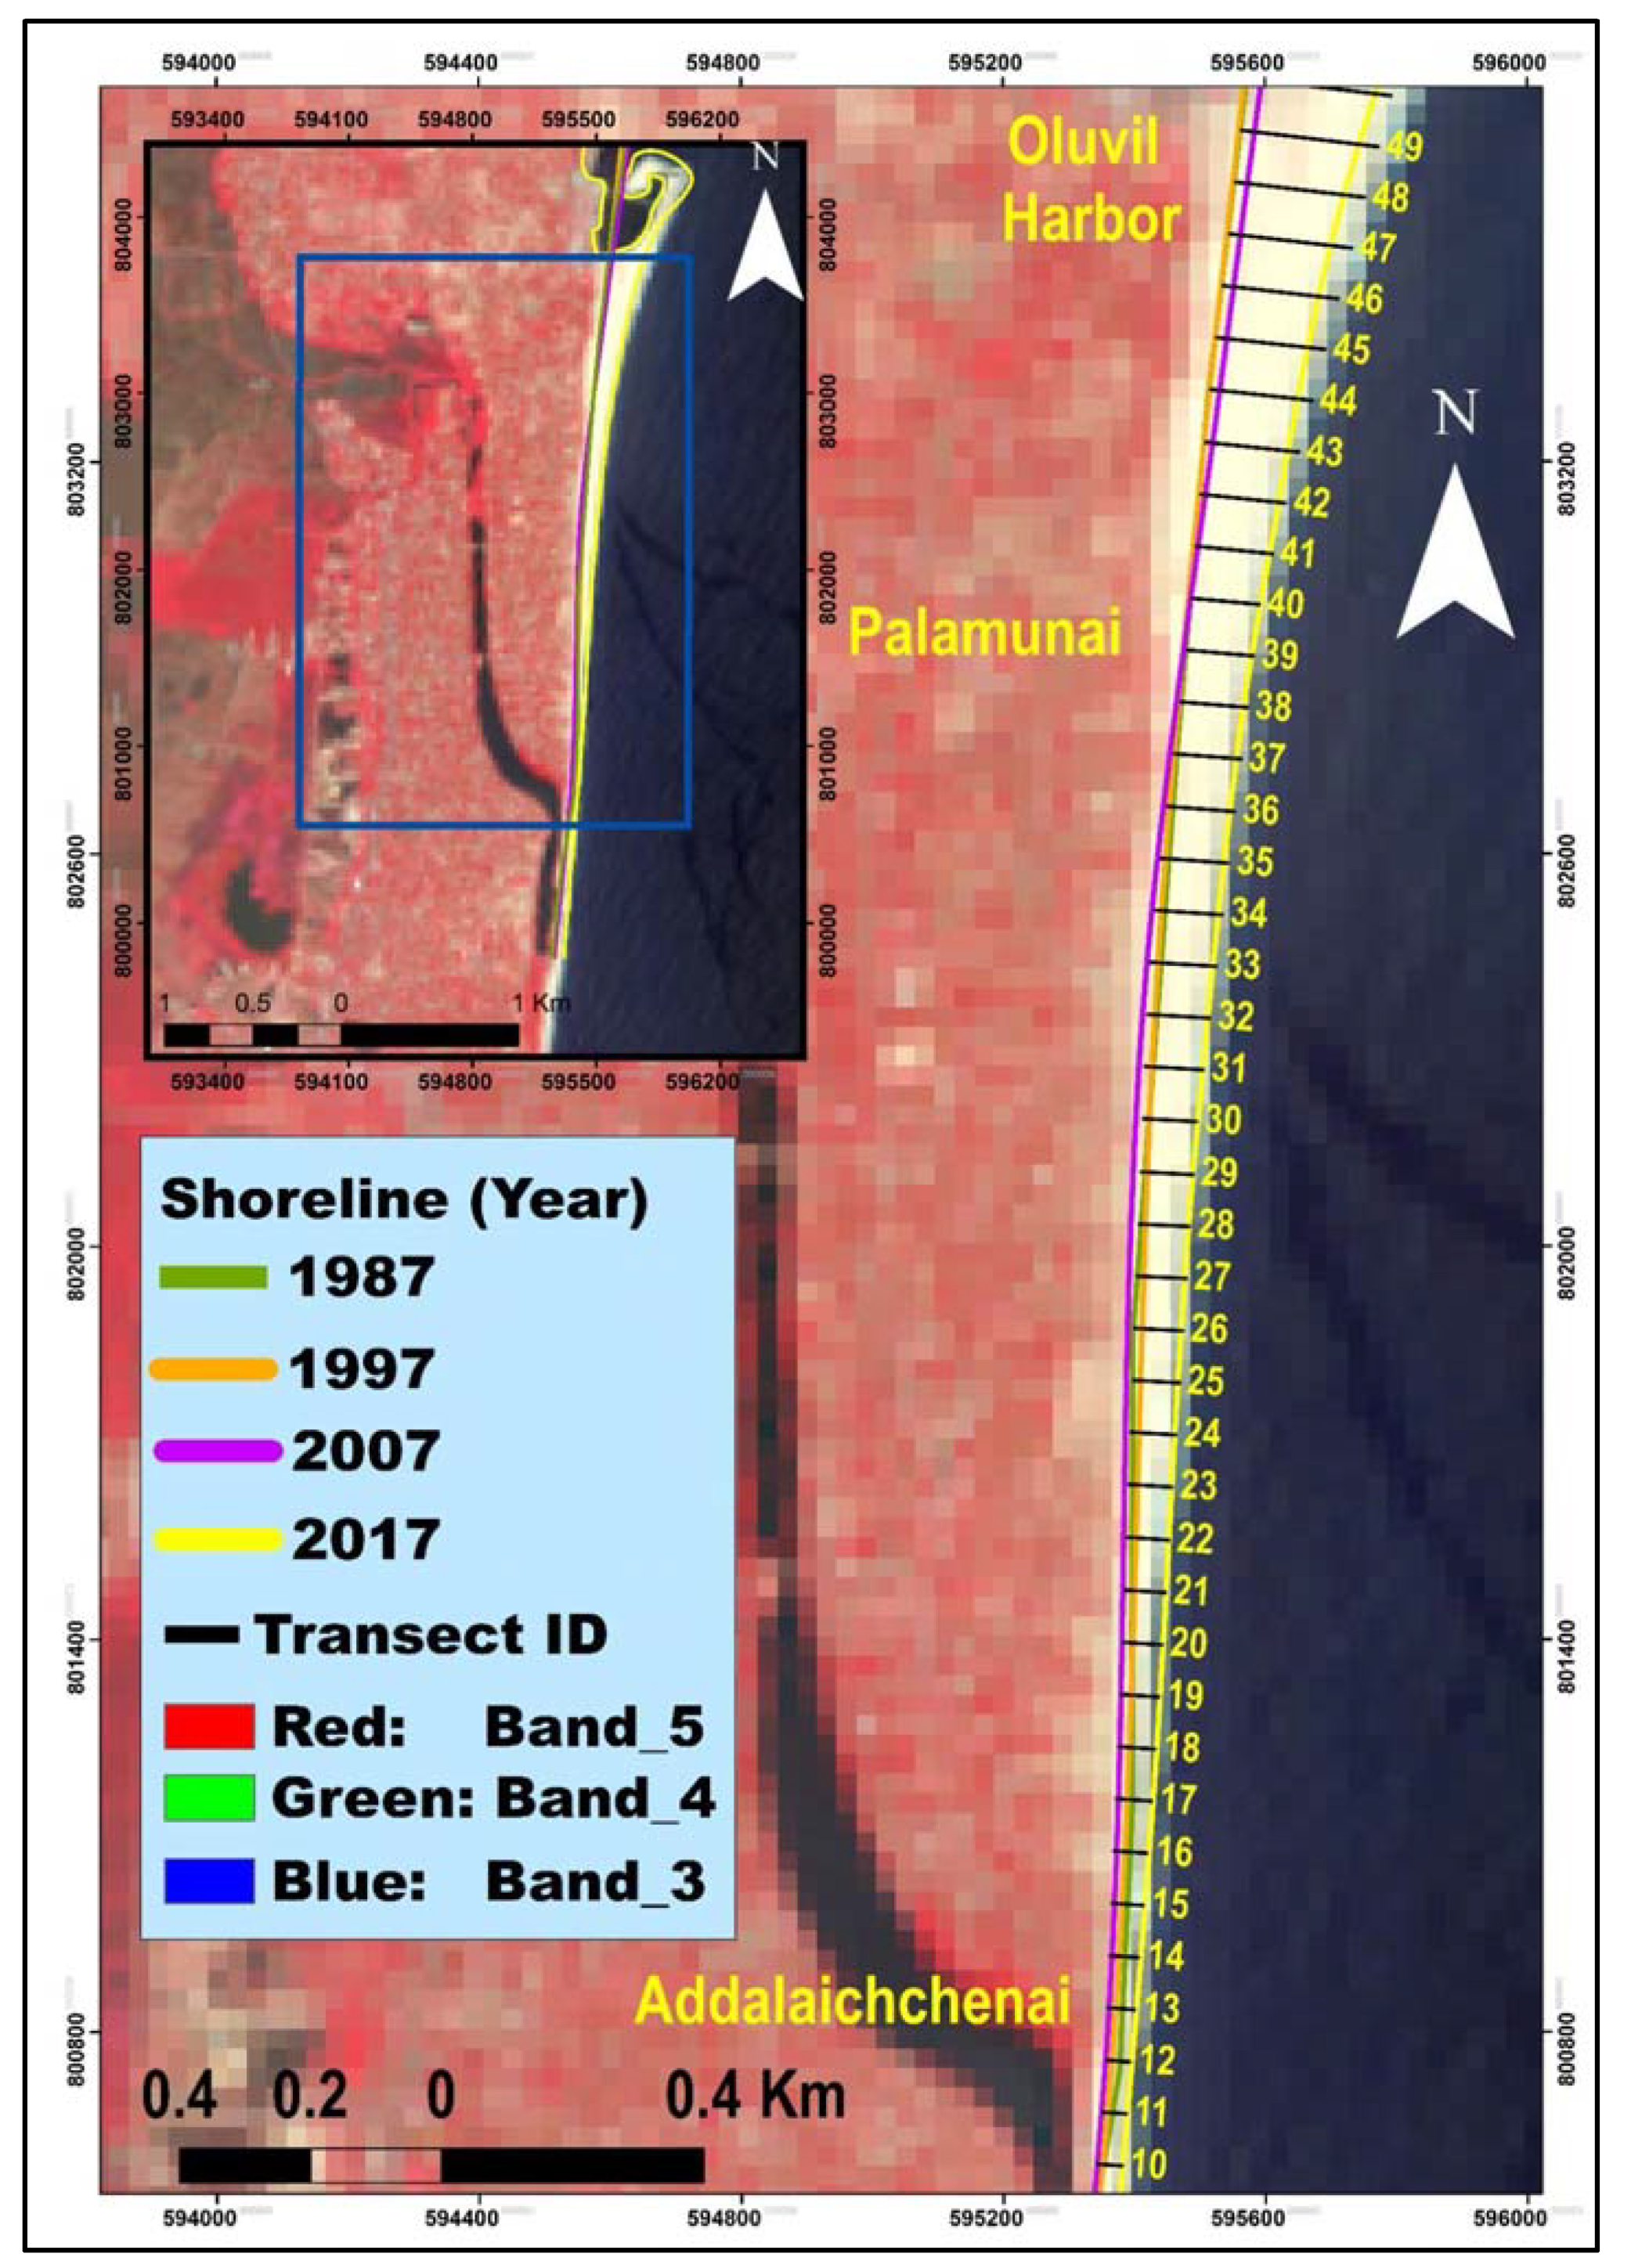
The comparison analysis of shoreline changes at different dates shows that the shoreline has shifted significantly between the period between 1987 and 2007 (Figure 3), due to the erosion and accretion process.
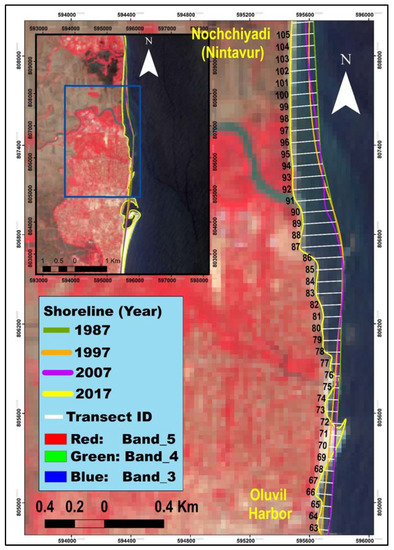
Figure 3.
Satellite-derived shorelines northwards of the harbor.
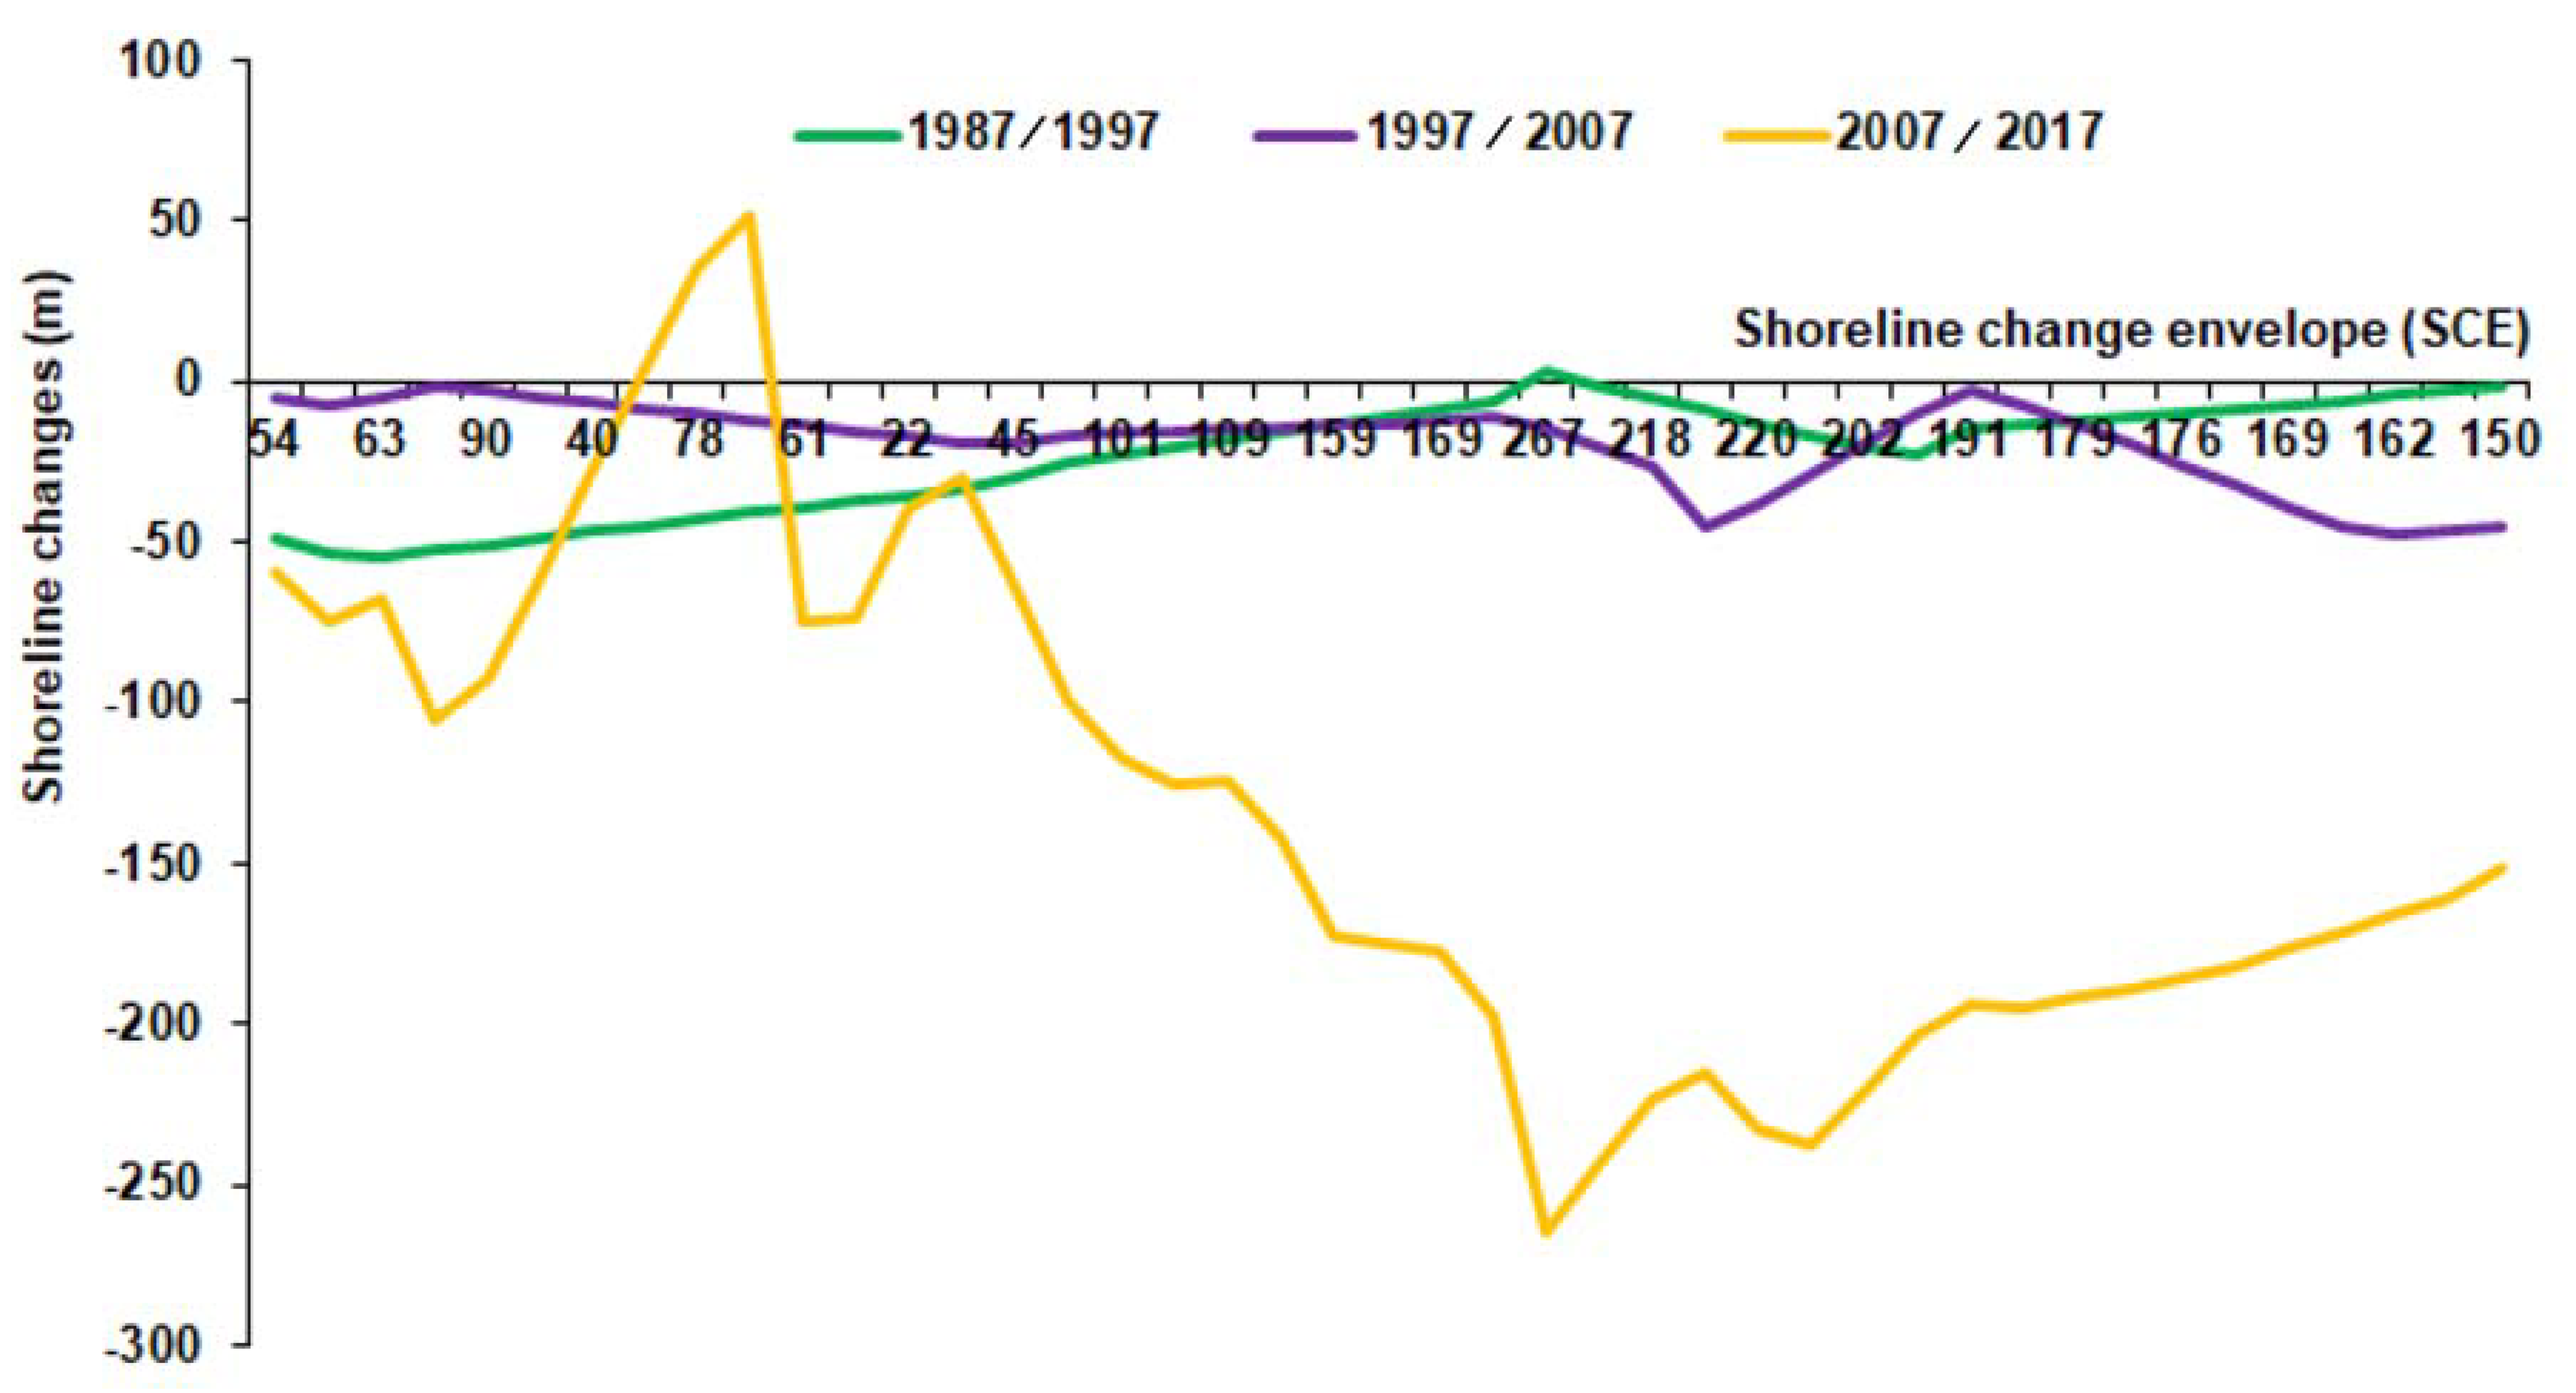
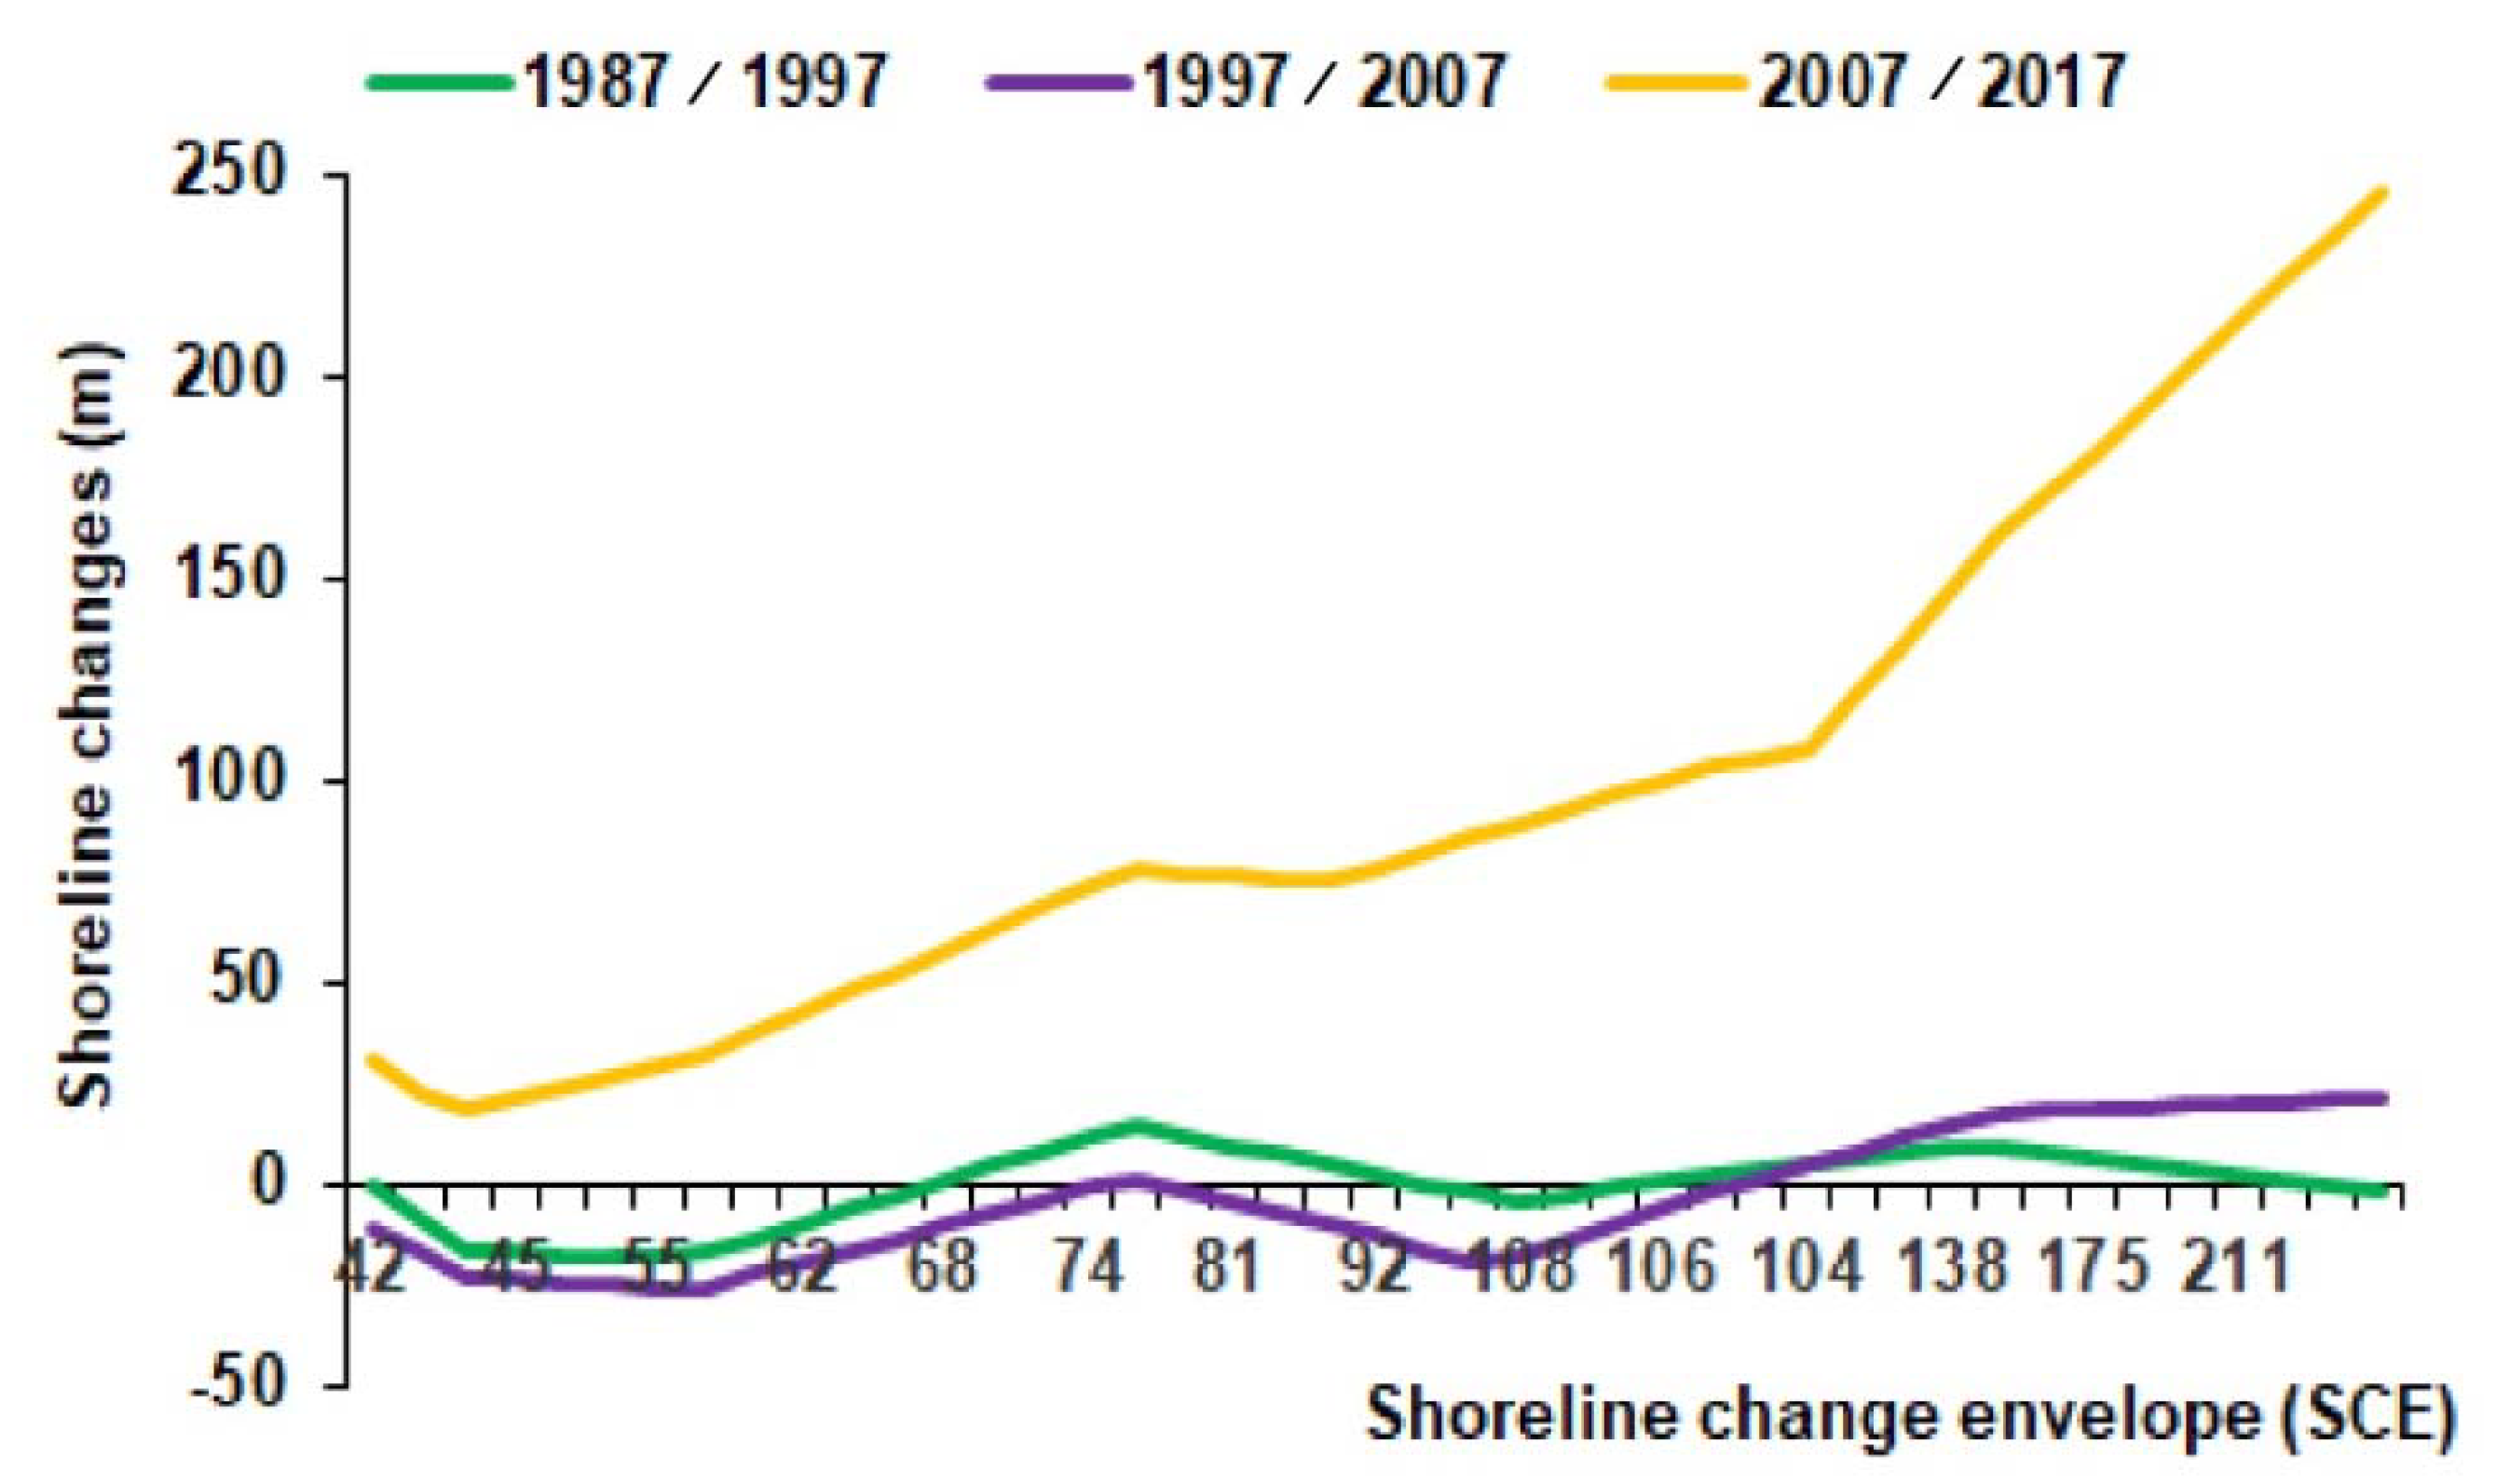
In this study, the erosionwas measured along cross-sections of 100 m (shoreline to landward range), 2 km northwards from harbor mouth. The coastal shoreline has slightly changed between 1987–1997 and 1997–2007 while noticeable coastal changes were observed during 2007–2017. Thus, the seashore erosion process was well-defined as a zigzag line by the shoreline change envelope (SCE) with values ranging from 61 to 162 in the period from 2007 to 2017 (Figure 4).
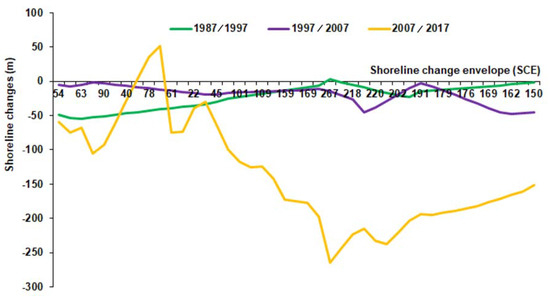
Figure 4.
Profile of shoreline change vs. shoreline change envelope northwards of the harbor.
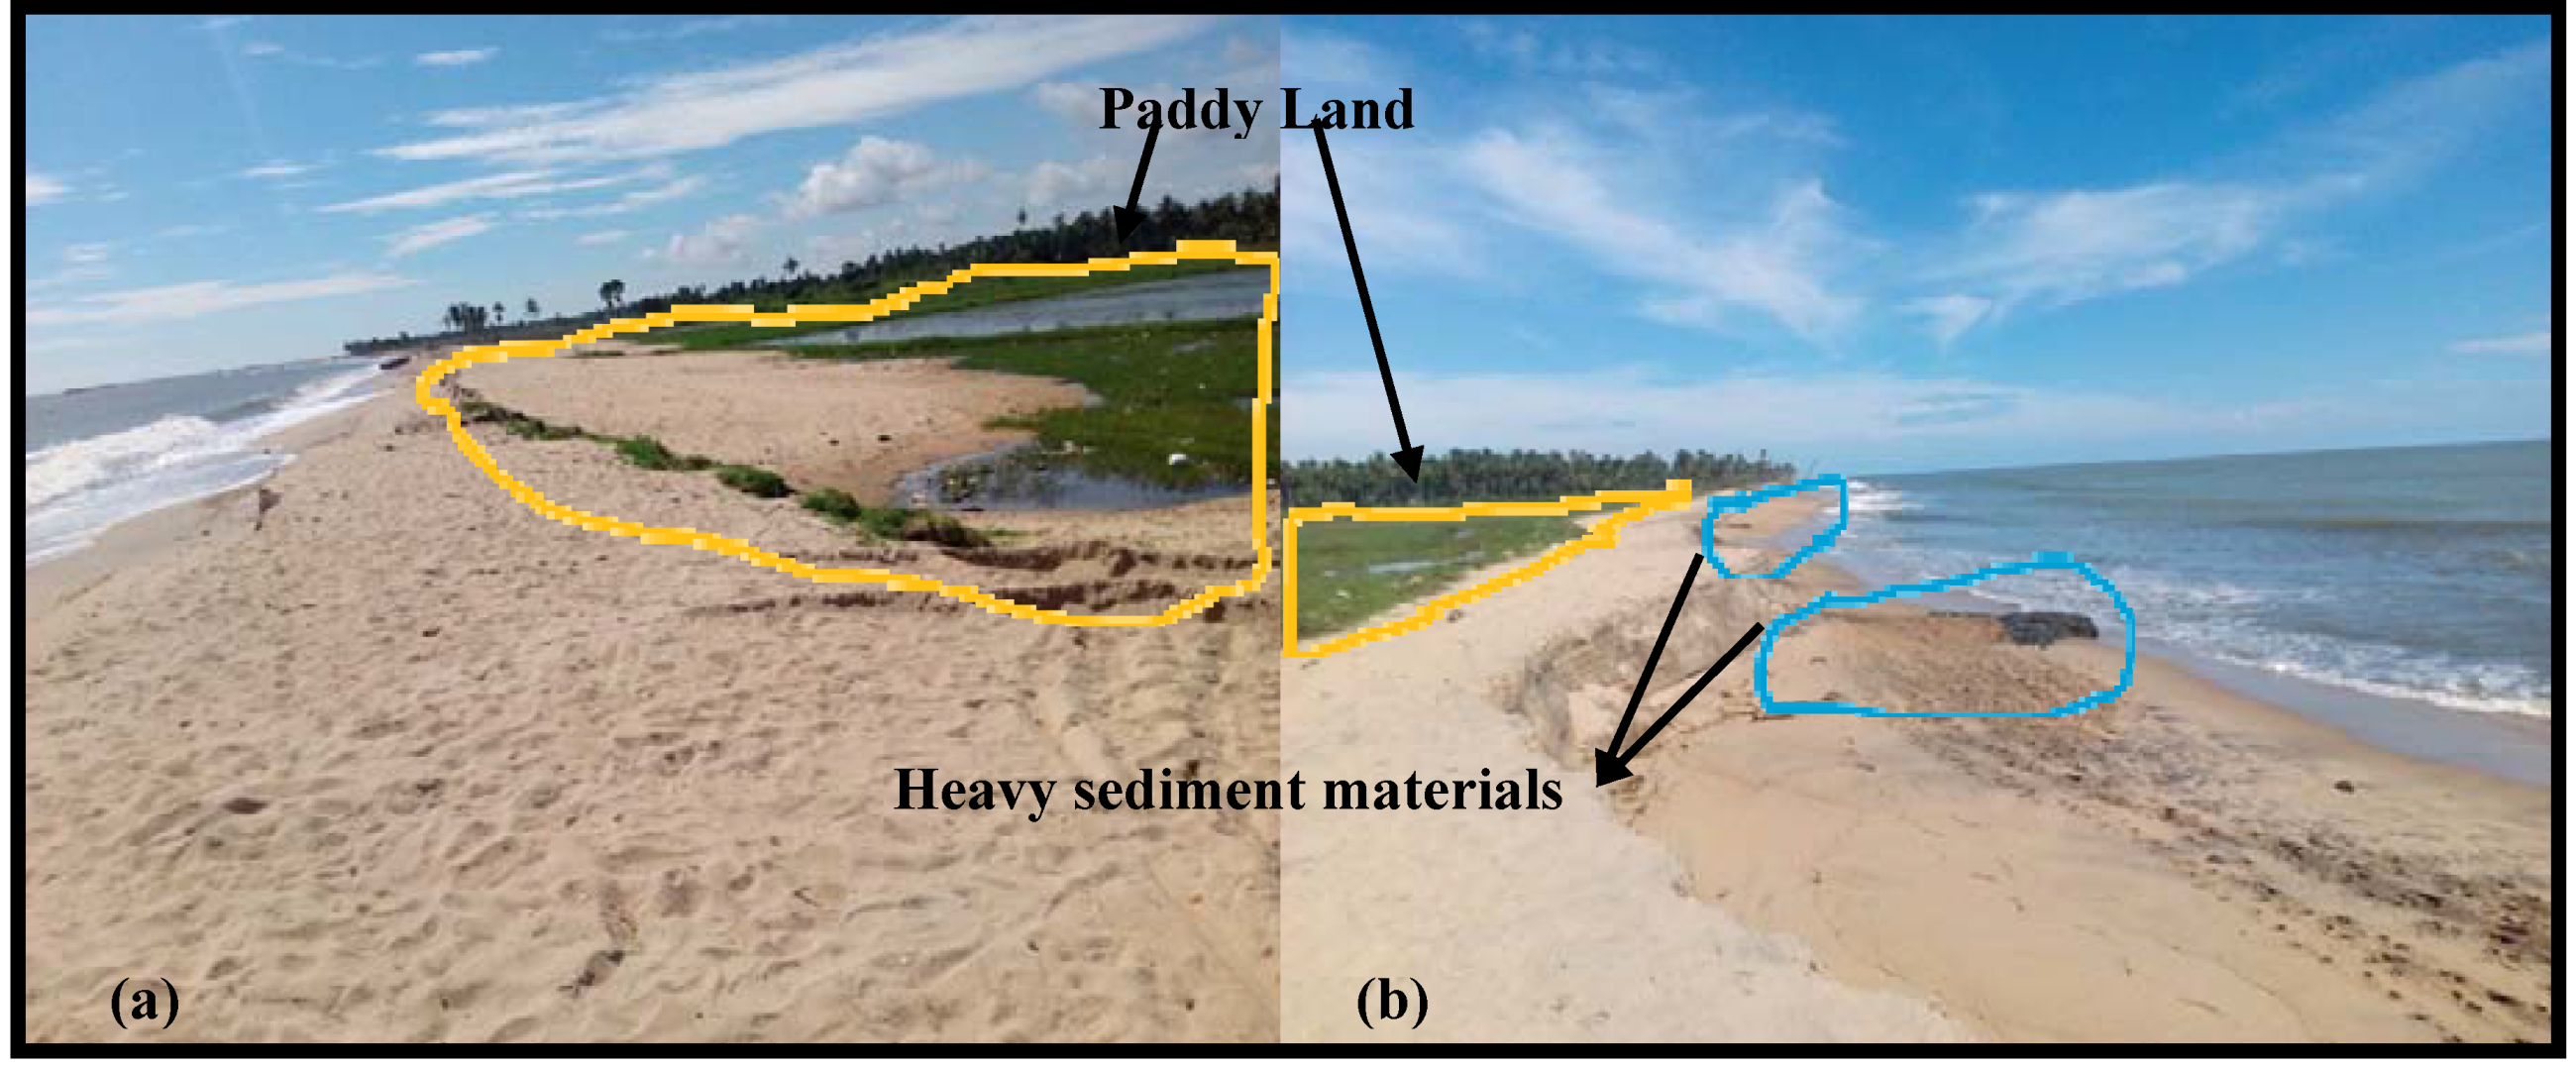
According to the results, severe erosion was identified in the study area. Nearly 70 percent of seashore areas were affected by wave action from the harbor mouth up to 2 km northwards (Figure 5).
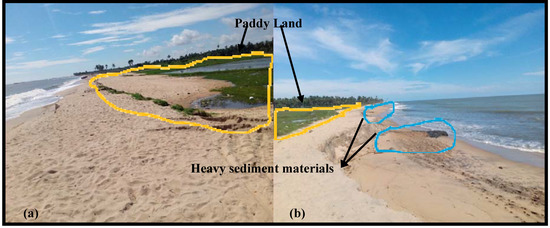
Figure 5.
Heavy sediments, i.e., coarse sand deposited in Nochchiyadi paddy land area in Nintavur: (a) area before coastal erosion, (b) area after coastal erosion (note that bank collapse ca. 1 m in height).
The measures estimated by cross-sections between 100 m and 2 km from the harbor mouth southwards allowed identifying maximum ranges of the shoreline advance of 3000 m in the southern part of the harbor area (Figure 6 and Figure 7). In the southward direction, significant changes due to the accretion were identified approximately 250 m from the harbor mouth along the shoreline as a tail in 2007 to 2017 (Figure 7).
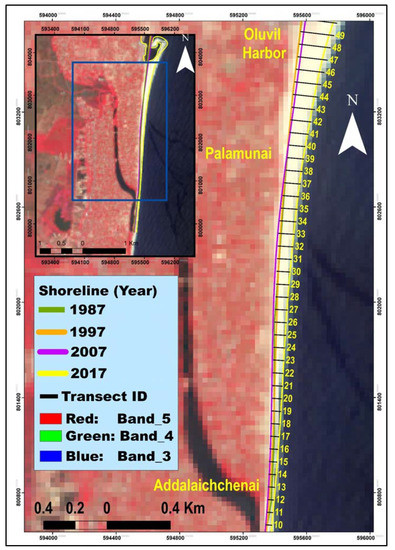
Figure 6.
Accretion and shoreline changes southwards of the harbor.
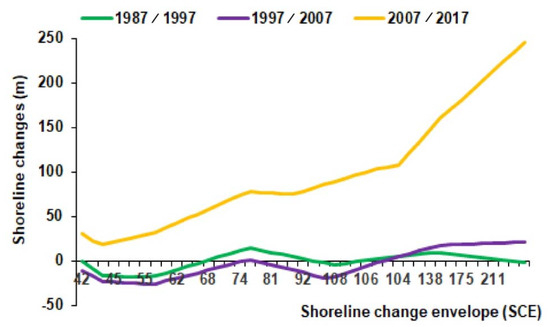
Figure 7.
Profile of shoreline change vs. shoreline change envelope in the south of the harbor.
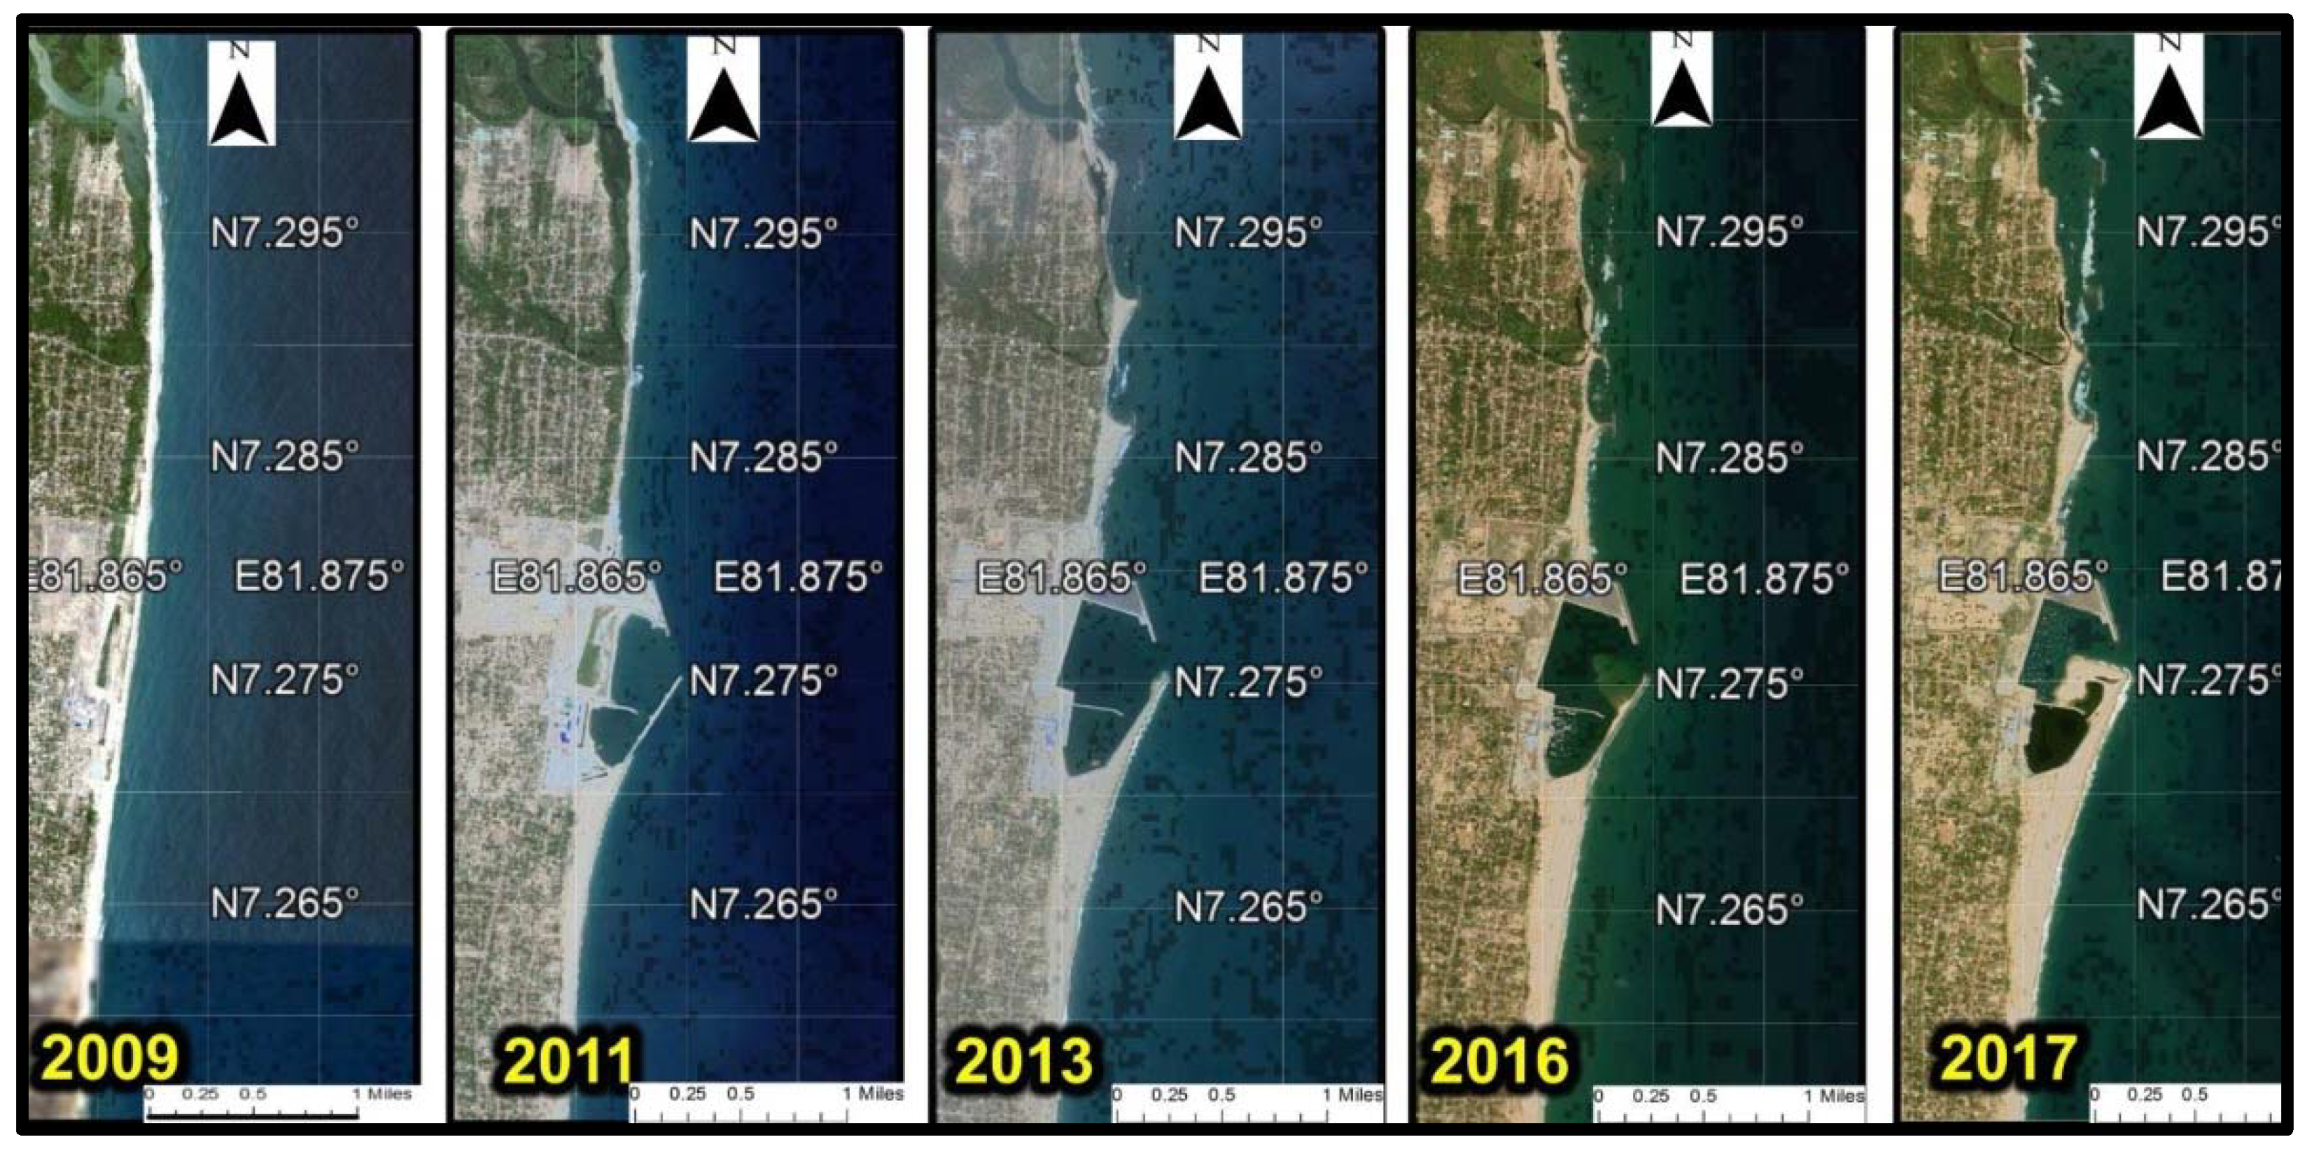
In this connection, the shoreline has shifted in a large variety of accretion pictures from year to year and season to season after the construction of the harbor, as shown in the Google historical images (Figure 8). The historical Google Earth images were extracted for March 2009, December 2011, August 2013, April 2016, and September 2017. The dredging in order to navigate the ships and sand dumping with the view to artificially nourish the beach was conducted between 2009 and 2011 as well as between 2011 and 2013. The port was designed to dredge for 8 m to anchor a ship with 5000 tons deadweight.
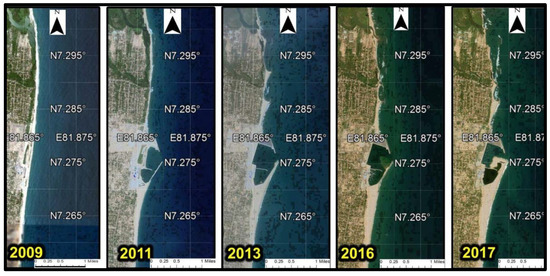
Figure 8.
Morphological changes of the littoral zones of the east coast from 2009 to 2017. (Image pixel: 30 m × 30 m, positional accuracy: 39.7 m and RMSE: 0.4–171.6 m.). Note that the 2011 image is different from other images because the harbor construction work was in progress.
5. Discussion
The Ampara District is situated in the dry zone of Sri Lanka, which receives ca. 1700 mm rainfall annually. According to Alahacoon and Edirisinghe’s study [29], Ampara showed a declining trend of rainfall. There is not much river discharge in this region and small tank cascade systems feed for agricultural lands (i.e., paddy) in this region [19]. A few dams were made for major rivers, such as Gal Oya, Kalugal Oya, and Rambukkan Oya for irrigation extension.
The satellite data were enhanced by geometrical, and radio-metrical processes. The GIS technique of the histogram threshold method [15] was employed to define land and water areas. It was found that within the last decade from 2007 to 2017, erosion and accretion were formed northwards and southwards, respectively, from the Oluvil Harbor. The main reason for coastal erosion is the land-use changes resulting from the degradation of coastal vegetation and a lack of rock barriers providing resistance to wave action [13]. The construction work of the Oluvil port commenced in 2008. After these practices, the areas were severely affected by the wave process. Thus, wave heights were typically in a range of 0.5 to 2.0 m [23]. Therefore, waves and currents were responsible for longshore sediment transport and caused the erosion in northward and accumulation in southward of the port.
The offshore wave climate has suffered changes in the last decade (2007–2017) after the tsunami disaster in 2004 during which many acres of vegetation bioshield was wiped off, resulting in changing the coastline due to tidal fluctuation and sea-level rise. In the last decade (2007–2017), coastal vegetation, i.e., mangroves and coconut plantations have been removed and/or degraded by anthropogenic activities, such as the Oluvil harbor construction, offshore and inshore breakwaters which hinder the longshore sediment transport, urbanization, and tourist development. All these factors have an impact on the drastic shoreline movement in the period from 2007 to 2017 [19].
The area consists of coconut gardens, coastal mudflats, and is fringed by mangroves. However, agricultural activities have been engaged behind the mangrove vegetation area which is protected by a bund with sands from saline water during the tidal inundation periods. Presently, coastal vegetation has been wiped out due to the sea erosion process. The seawater is penetrated into the paddy land and has affected over 250 acres so far. Thus, this process may be formed as a bay Nochchiyadi area into the paddy land, in the future. However, currently, it is protected by coarse sediment materials in the coastal narrow stretch (Figure 5).
The gradual change of shoreline positions was identified from a variety of impacts on ecological conditions, i.e., lack of coastal vegetation and climatic vulnerabilities in the study area [13]. In this study, it is recommended that three different solutions to control the present issues: offshore breakwaters, fishbone groins and simulated nourishment system northward of the harbor. We recommend to implement such solutions all together to minimize the longshore sediment transportation process in the study area [23].
The results show that the coastal protection work within the study area has not been succeeded after the port construction practices. The Oluvil port was constructed as fully fledge commercial and fishery harbor for commercial and fishing activities. Unfortunately, at present, due to the erosion and sedimentation problem, even the fishing activities are unable to undertake in the harbor. Therefore, it is clear that more studies should be done to stabilize and reach the sustainable development of the Nintavur-to-Addalaichchenai coastal area of the Ampara District in the future.
This situation continues to undermine the weak economy of the coastal populations who have already faced the disruption of their livelihoods, economics, and basic social well-being. It has been clear that the proper ecosystem management would also support to minimize the impacts arising from natural and manmade disasters in the study area.
In the northern part of the harbor, between 100 m to 5 km from the harbor mouth, the observed erosion was approximately 250,000 cubic meters in 2009 due to the extreme monsoon [23]. Seasonal changes are driven by wave climate conditions, although, there are no doubts that the harbor existence has an influence on wave propagation processes.
There are national projects in Sri Lanka for mitigating marine erosion. Few examples of restoring the shorelines are including beach recovery from the sand nourishment, dividing shoreline into several zones, water barrage (the concrete weir), and restoring coastal vegetation as a bioshield [30,31]. Coastal habitats in Ampara are highly demanding for tourist hotels, boatyards, and ports, which leads to environmental consequences such as pollution and degradation of coastal ecosystems. Therefore, our study is important to see coastal changes over time in connection with the harbor realization (i.e., Oluvil harbor) and coastal erosion.
6. Conclusions
This study is important to disclose the evolution of shoreline change (1987–2017) in the east coast of the Ampara District in Sri Lanka using Landsat imagery. We delineated the water land interface using the histogram threshold of band 5 (mid-infrared) and then detected the historic shoreline changes over 30 years. Furthermore, we demonstrate how the construction of the Oluvil harbor in 2008 has had an impact in the accretion and erosion patterns, and thus, in the shoreline movement (advance/retreat) in the last decade (2007–2017). This knowledge can help stakeholders and coastal managers to make future decisions that benefit the society that lives close to the seashore.
Author Contributions
Conceptualization, I.L.M.Z.; methodology, I.L.M.Z.; formal analysis, I.L.M.Z.; writing—original draft preparation, I.L.M.Z.; writing—review and editing, B.M.; writing—review and editing, A.L.I.; writing—review and editing, K.N. All authors have read and agreed to the published version of the manuscript.
Funding
This research received no external funding.
Institutional Review Board Statement
Not applicable.
Informed Consent Statement
Not applicable.
Data Availability Statement
Not applicable.
Conflicts of Interest
The authors declare no conflict of interest.
References
- Madurapperuma, B.; Dellysse, J. Coastal Fringe Habitat Monitoring Using Kite Aerial Photography: A Remote Sensing-based Case Study. J. Trop. For. Environ. 2018, 8. [Google Scholar] [CrossRef]
- Woodroffe, C. Coasts: Forms, Process and Evolution; Press Syndicate of the University of Cambridge University: Cambridge, UK, 2002. [Google Scholar]
- Boak, E.H.; Turner, I.L. Shoreline definition and detection: A review. J. Coast. Res. 2005, 21, 688–703. [Google Scholar] [CrossRef] [Green Version]
- Indiveri, A.; Marsico, A.; Pennetta, L. Erosion hazard assessment along the Capitolo coast (Monopoli, southern Italy). J. Maps 2013, 9, 274–278. [Google Scholar] [CrossRef]
- Vassilakis, E.; Papadopoulou-Vrynioti, K. Quantification of Deltaic Coastal Zone Change Based on Multi-Temporal High Resolution Earth Observation Techniques. ISPRS Int. J. Geo-Inf. 2014, 3, 18–28. [Google Scholar] [CrossRef]
- Nijamir, K.; Kaleel, M.I.M. Coastal morphodynamics associated natural Hazards: A case study of the Oluvil area in Ampara district, Sri Lanka. World Sci. News 2018, 97, 113–124. [Google Scholar]
- Vassilakis, E.; Tsokos, A.; Kotsi, E. Shoreline Change Detection and Coastal Erosion Monitoring Using Digital Processing of a Time Series of High Spatial Resolution Remote Sensing Data. Bull. Geol. Soc. Greece 2017, 50, 1747–1755. [Google Scholar] [CrossRef] [Green Version]
- Madurapperuma, B.D.; Dellysse, J.E.; Zahir, I.L.M.; Iyoob, A.L. Mapping shoreline vulnerabilities using kite aerial photographs at OluvilHarbour in Ampara. In Proceedings of the 7th International Symposium, SEUSL, Oluvil, Sri Lanka, 7–8 December 2017. [Google Scholar]
- Madurapperuma, B.; Lamping, J.; McDermott, M.; Murphy, B.; McFarland, J.; Deyoung, K.; Smith, C.; MacAdam, S.; Monroe, S.; Corro, L.; et al. Factors Influencing Movement of the Manila Dunes and Its Impact on Establishing Non-Native Species. Remote Sens. 2020, 12, 1536. [Google Scholar] [CrossRef]
- Ervita, K.; Marfai, M.A. Shoreline Change Analysis in Demak, Indonesia. J. Environ. Prot. 2017, 08, 940–955. [Google Scholar] [CrossRef] [Green Version]
- Gómez, C.; Wulder, M.; Dawson, A.G.; Ritchie, W.; Green, D.R. Shoreline Change and Coastal Vulnerability Characterization with Landsat Imagery: A Case Study in the Outer Hebrides, Scotland. Scott. Geogr. J. 2014, 130, 279–299. [Google Scholar] [CrossRef]
- Kannan, R.; Ramanamurthy, M.V.; Kanungo, A. Shoreline change monitoring in Nellore Coast at East Coast Andhra Pradesh District using Remote Sensing and GIS. IJIRST Int. J. Innov. Res. Sci. Technol. 2016, 2, 316–324. [Google Scholar]
- Madurapperuma, B.D.; Dellysse, J.E.; Zahir, I.L.M.; Iyoob, A.L. Mapping coastal fringe community variability of Pottuvil using high-resolution kite aerial photography. In Proceedings of the Peradeniya University International Research Session, Peradeniya, Sri Lanka, 24 November 2017; Volume 21. [Google Scholar]
- Madurapperuma, B.; Barger, J.; Collin, M.; Emerson, C.; Fleming, S.; Murphy, B. A geospatial recipe for identifying social values and fragmentation issues of the Friends of the Dunes Land Trust. Humboldt J. Soc. Rel. 2019, 41, 8–21. [Google Scholar]
- Masria, A.; Nadaoka, K.; Negm, A.; Iskander, M. Detection of Shoreline and Land Cover Changes around Rosetta Promontory, Egypt, Based on Remote Sensing Analysis. Land 2015, 4, 216–230. [Google Scholar] [CrossRef] [Green Version]
- Moore, L.J. Shoreline mapping techniques. J. Coast. Res. 2000, 161, 111–124. [Google Scholar]
- Lan, P.T.; Son, T.S.; Gunasekara, K.; Nhan, N.T.; Hien, L.P. Application of Remote Sensing and GIS technology for monitoring coastal changes in estuary area of the Red river system, Vietnam. J. Korean Soc. Surv. Geod. Photogramm. Cartogr. 2013, 31, 529–538. [Google Scholar] [CrossRef] [Green Version]
- Mathiventhan, T.; Jayasingam, T. Geomorphological changes along the East Coast of Sri Lanka. Intern. J. Res. Stud. Biosci. 2018, 6, 6–12. [Google Scholar]
- Dellysse, J.E.; Madurapperuma, B.D. Developing a coastal GIS model of Sri Lanka to pinpoint areas at risk of Tsunamis. IdeaFest: Interdis. J. Creat. Work. Res. Humboldt State Univ. 2018, 2, 44–52. [Google Scholar]
- Wijeratne, E.M.S.; Pattiaratchi, C.B. Sea Level Variability in Sri Lankan waters. Understanding Sea-level Rise and Variability, a World Climate Research Programme Workshop and a WCRP Contribution to the Global Earth Observation System of Systems. 2006. Available online: https://www.wcrp-climate.org (accessed on 4 August 2020).
- Koeppen, W. Das Geographische System der Klimate, Handbuch der Klimatologie [The Geographical System of the Climate, Handbook of Climatology]; Borntraeger: Berlin, Germany, 1936. [Google Scholar]
- Prasanna, H.M.I.; Gunathilaka, M.D.E.K.; Welikanna, D.R. Variability of the Sounding Datums Around Sri Lankan Coastline. Geospatial Information for a Smarter Life and Environmental Resilience; FIG: Hanoi, Vietnam, 2019. [Google Scholar]
- Frigaard, P.B.; Margheritini, L. Oluvil Port Development Project 3rd Party Opinion on Report by Lanka Hydraulic Institute Ltd.: Oluvil Port Development Project: Studies on Beach Erosion; Aalborg University: Aalborg, Denmark, 2011. [Google Scholar]
- Government of Sri Lanka (GOSL). Coast Conservation Act No.57 of 1981; Government of Sri Lanka: Sri Lanka, 1981.
- Nijamir, K.; Thennakoon, T.; Herath, H.J.R.; Kaleel, M.I.M. Exploring Physical and Human Induced Coastal Morphodynamics: A Study with Reference to Nintavur to Addalaichenai Coastal Areas of Ampara District, Sri Lanka. Acad. J. Interdiscip. Stud. 2021, 10, 347. [Google Scholar] [CrossRef]
- Ameer, F. Physical impacts of Oluvil harbour. In Proceedings of the 5th International Symposium 2015—IntSym, SEUSL, Oluvil, Sri Lanka, 7–8 December 2015; pp. 450–461. [Google Scholar]
- Wickramaratne, S.; Dissanayake, D.M.S.S.; Dharmadasa, M.D.V.S. Numerical Modelling of siltation and erosion issues at Oluvil Port—Sri Lanka. In Proceedings of the 8th International Conference on Coastal and Port Engineering in Developing Countries (PIANC-COPEDEC VIII), Chennai, India, 22–24 February 2012. [Google Scholar]
- Alesheikh, A.A.; Ghorbanali, A.; Nouri, N. Coastline change detection using remote sensing. Int. J. Environ. Sci. Technol. 2007, 4, 61–66. [Google Scholar] [CrossRef] [Green Version]
- Alahacoon, N.; Edirisinghe, M. Spatial Variability of Rainfall Trends in Sri Lanka from 1989 to 2019 as an Indication of Climate Change. ISPRS Int. J. Geo-Inf. 2021, 10, 84. [Google Scholar] [CrossRef]
- Samarasekara, R.S.M.; Sasaki, J.; Jayaratne, R.; Suzuki, T.; Ranawaka, R.; Pathmasiri, S.D. Historical changes in the shoreline and management of Marawila Beach, Sri Lanka, from 1980 to 2017. Ocean. Coast. Manag. 2018, 165, 370–384. [Google Scholar] [CrossRef] [Green Version]
- Dellysse, J.E.; Madurapperuma, B.D.; Kuruppuarachchi, K.A.J.M. Preliminary study on biomass mapping along the coastal zone of Hambantota region, Sri Lanka using Landsat imagery. In Proceedings of the Open University Research Sessions, Nawala, Nugegoda, 16–17 November 2017; pp. 497–500. [Google Scholar]
Publisher’s Note: MDPI stays neutral with regard to jurisdictional claims in published maps and institutional affiliations. |
© 2021 by the authors. Licensee MDPI, Basel, Switzerland. This article is an open access article distributed under the terms and conditions of the Creative Commons Attribution (CC BY) license (https://creativecommons.org/licenses/by/4.0/).

