Abstract
This study investigates the impact of landfills on surrounding vegetation in Naples, Italy, utilizing Sentinel-2 and Landsat 8 imagery processed with Sen2like. Seventeen landfill sites were studied with indices NDVI and GCI using four years of data, revealing significant vegetation growth reduction near two landfills compared to farther areas. Continuous monitoring is crucial, and satellite imagery offers an effective assessment tool. The study establishes a correlation between landfills and vegetation, underlining the need for ongoing monitoring and exploring additional factors influencing vegetation health within landfill environments. The findings contribute valuable insights to promote sustainable landfill management and protect surrounding ecosystems.
1. Introduction
Landfills are widely used globally for waste disposal due to their cost-effectiveness, but improper management can have adverse environmental impacts [1,2]. Contamination of water systems, vegetation, and air, along with public health risks, are significant concerns. Remote sensing has emerged as a valuable non-invasive tool for monitoring landfill impacts on the environment and identifying potentially contaminated areas [3].
One critical concern is the potential for landfill leakage, which can release harmful substances, including heavy metals, into the environment, affecting plant life and ecosystems. Remote sensing, particularly using vegetation indices like NDVI, can detect geochemical stresses induced by heavy metal contamination in vegetation before visible evidence appears [1].
This paper aims to analyse vegetation changes around potentially polluted landfill sites using the trends of NDVI, GCI, and NDWI indices throughout a specific acquisition window. By understanding the relationship between landfills, vegetation, and environmental risks, it supports sustainable landfill management and early mitigation of impacts on ecosystems. Integrated technologies like remote sensing and GIS analysis effectively allow us to identify and monitor landfill sites, providing valuable data for environmental assessment and planning. Non-invasive and cost-effective methods offer comprehensive insights into landfill changes, enabling better environmental management and protection [4].
2. Study Area
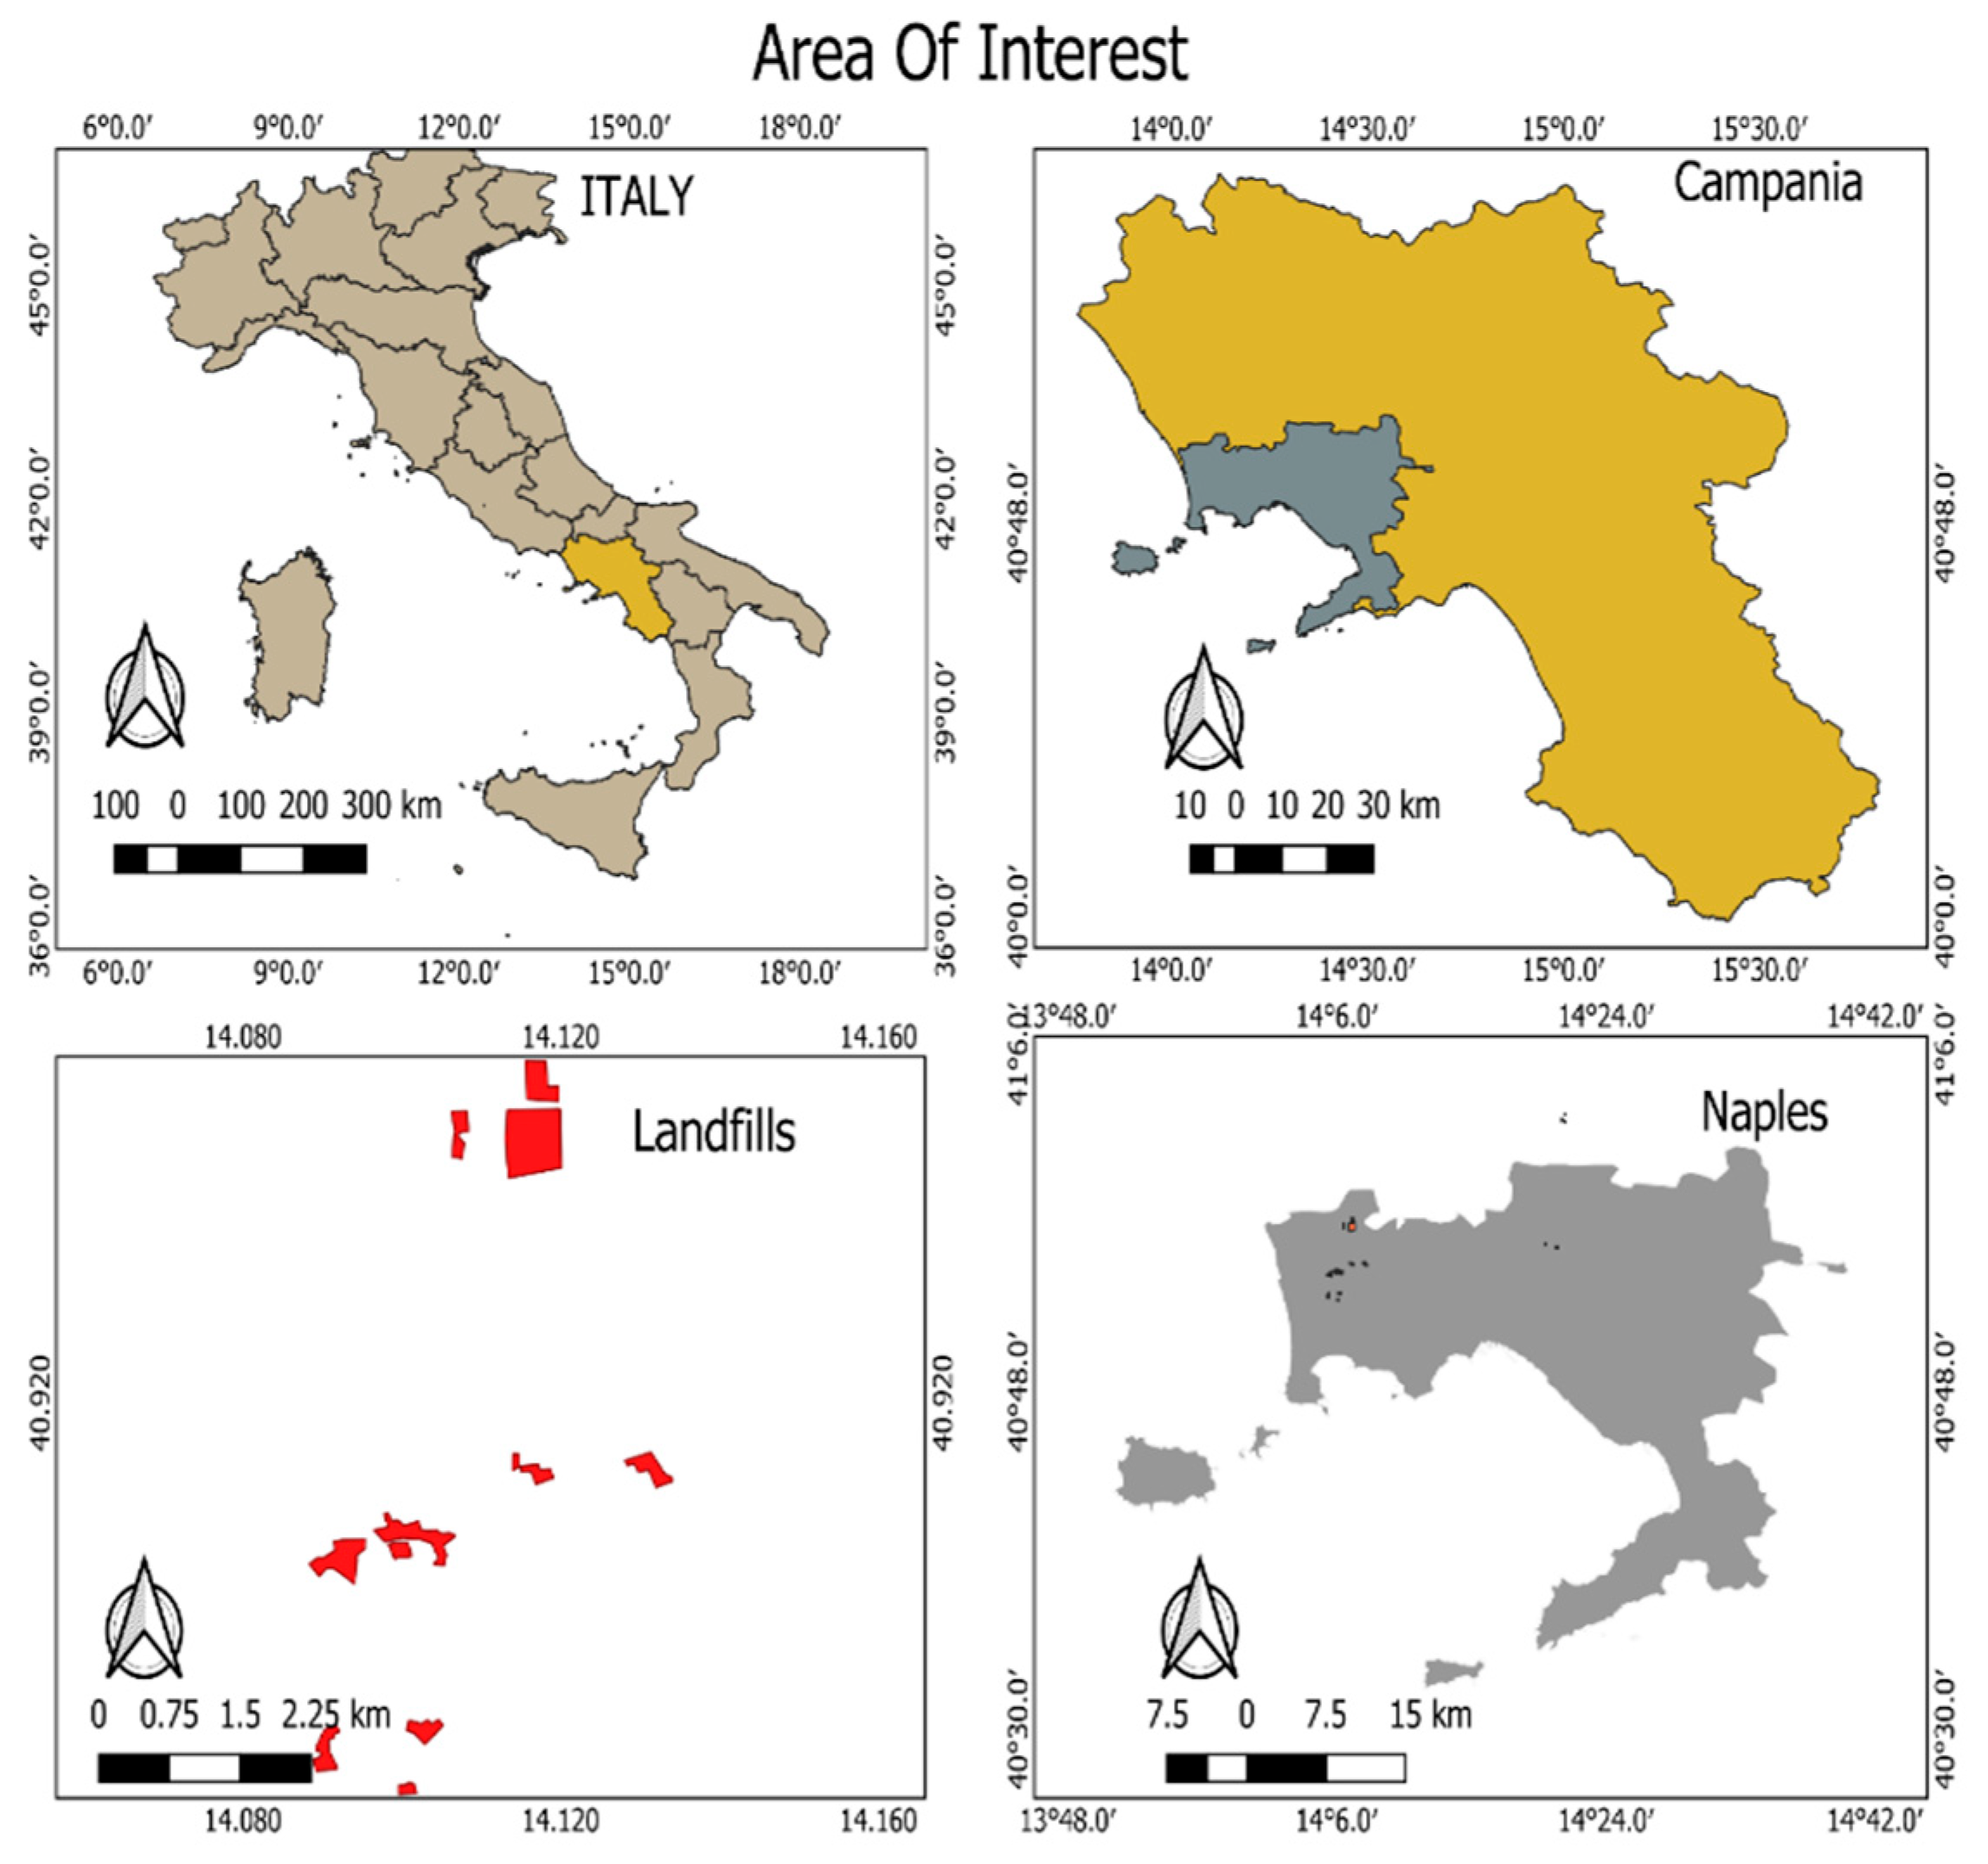
The study area encompasses a total of 17 landfill sites spread over the province of Naples, within the Campania region, in Italy. Figure 1 provides a visual representation of the geographical distribution of these sites within the study area. These sites were selected based on their significance in waste disposal and their potential impact on the surrounding environment, particularly on vegetation. Landfill sites within the boundary of the study area are managed by SAPNA (Sistema Ambiente Provincia di Napoli); however, there are additional target points which are categorised as “anomalous sites”. Consequently, data availability for the latter ones is limited because they are not legal landfills, and due to the mixed nature, there is no specific type of waste attributed to them.
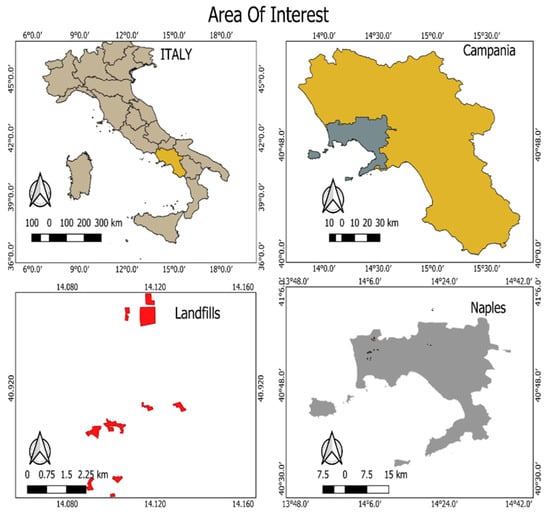
Figure 1.
Landfills in Naples, Campania region, Italy.
Table 1 presents the size of each landfill measured in square meters. This information is crucial in order to understand and quantify the potential environmental implications.

Table 1.
Landfill dimensions in square meters.
Data Used
In our research study, Sentinel-2 and Landsat 8 satellite imagery acquired from 2018 to 2022 over the study area were processed using the Sen2Like tool. This tool was developed by the European Space Agency (ESA) under the EU Copernicus programme with the main goal to generate Sentinel-2-like harmonised/fused surface reflectance with higher periodicity by integrating an additional compatible mission sensor such as Landsat 8. The virtual constellation obtained by Sen2like allows us to increase the total number of acquisitions over an AOI of about 30% compared to the actual Sentinel-2 satellites [5].
TheSen2Like processing workflow encompasses essential steps such as geometric and atmospheric corrections, spectral band adjustments, and transformation to Nadir BRDF-normalized reflectance, ensuring accurate and consistent output [6]. During the data fusion process, the Landsat 8 spatial resolution was enhanced through upscaling data with a pacing from 30 m to 10 m pixels.
By leveraging this combined Sentinel-2/Landsat 8-harmonized data, we gained deeper insights into temporal changes in landfill areas, enabling comprehensive land cover mapping, vegetation dynamics monitoring, and an assessment of landfill impacts on the environment, facilitating evidence-based decision-making for effective landfill management and environmental conservation strategies.
3. Methodology
3.1. Landfill Classification
The 17 landfills in the study area were categorized into two groups based on the surrounding vegetation characteristics. The first group consisted of 12 landfills with a homogeneous vegetation cover around them, exhibiting similar properties in terms of phenological status of plants and density. For the remaining 5 landfill sites, the surrounding vegetation exhibited heterogeneous characteristics in terms of species density.
3.2. Zone Division Using Multi-Buffer Ring Tool
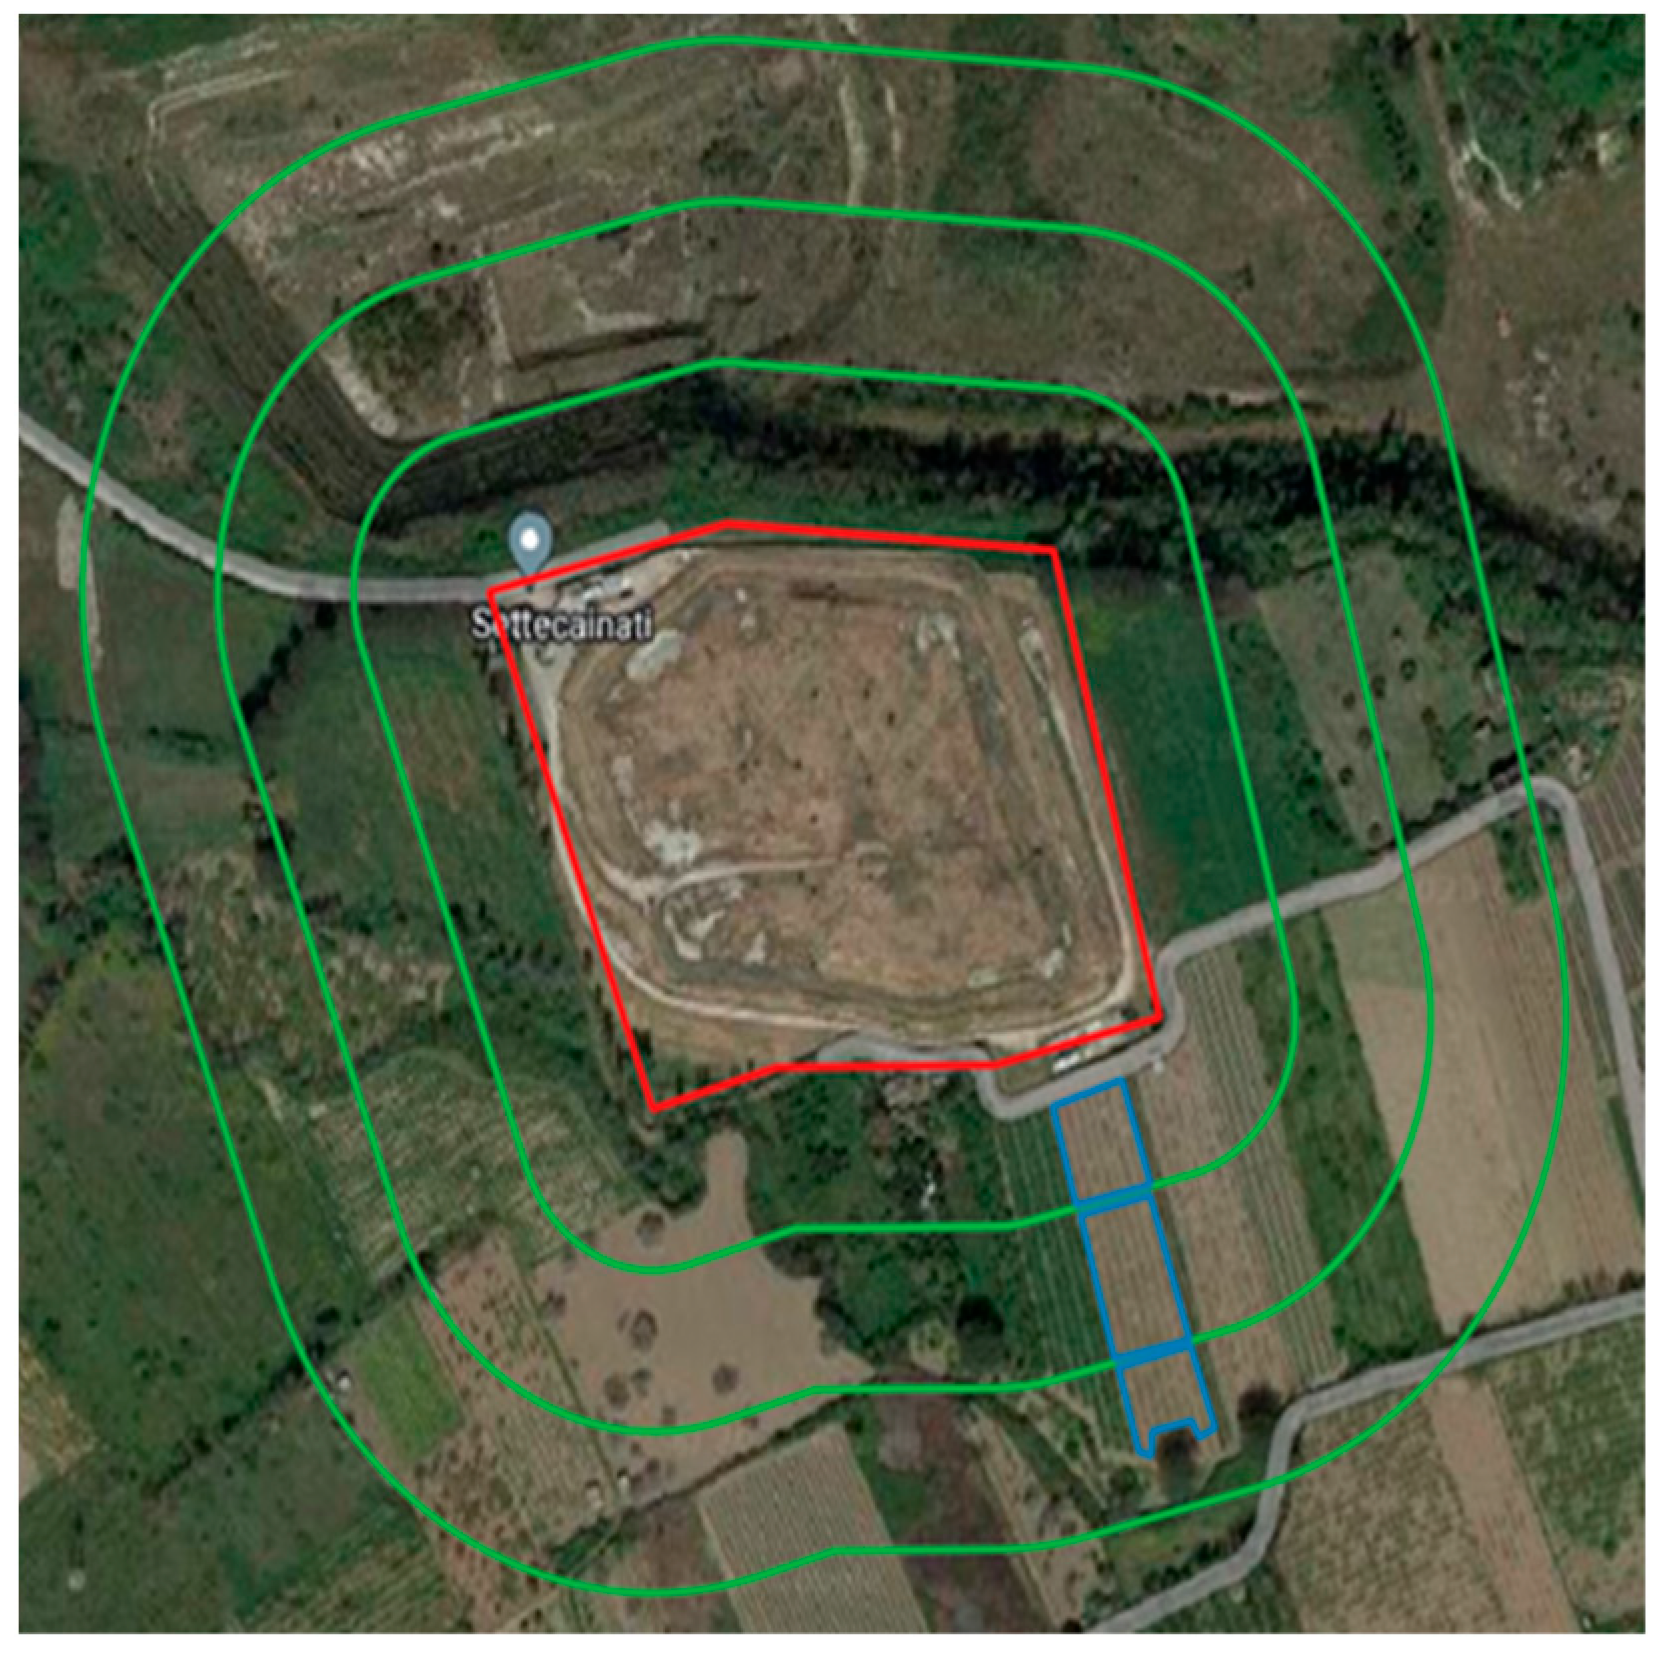
To better delineate the areas around the landfills, a multi-buffer ring technique was employed in QGIS, where three concentric rings, equally spaced apart by 50 m, were defined for each site for a total buffer zone radius of 150 m. The buffer zones were then further subdivided for in depth analysis.
3.3. Vegetation Indices Calculation
The first phase of the analysis involved image processing of data from both Sentinel-2 and Landsat 8 satellites. The algorithm extracted specific bands, including the red, green, blue, near-infrared (NIR), and red-edge bands, from the acquired images. Subsequently, three important vegetation indices, namely the normalized differential vegetation index (NDVI), the normalized difference water index (NDWI), and the green chlorophyll index (GCI) [7], were calculated using the extracted bands. These indices were then stacked to create 3D images, which were saved in a designated folder. This process was repeated for all available images, enabling a comprehensive time-series analysis [8].
3.4. Area of Interest Analysis
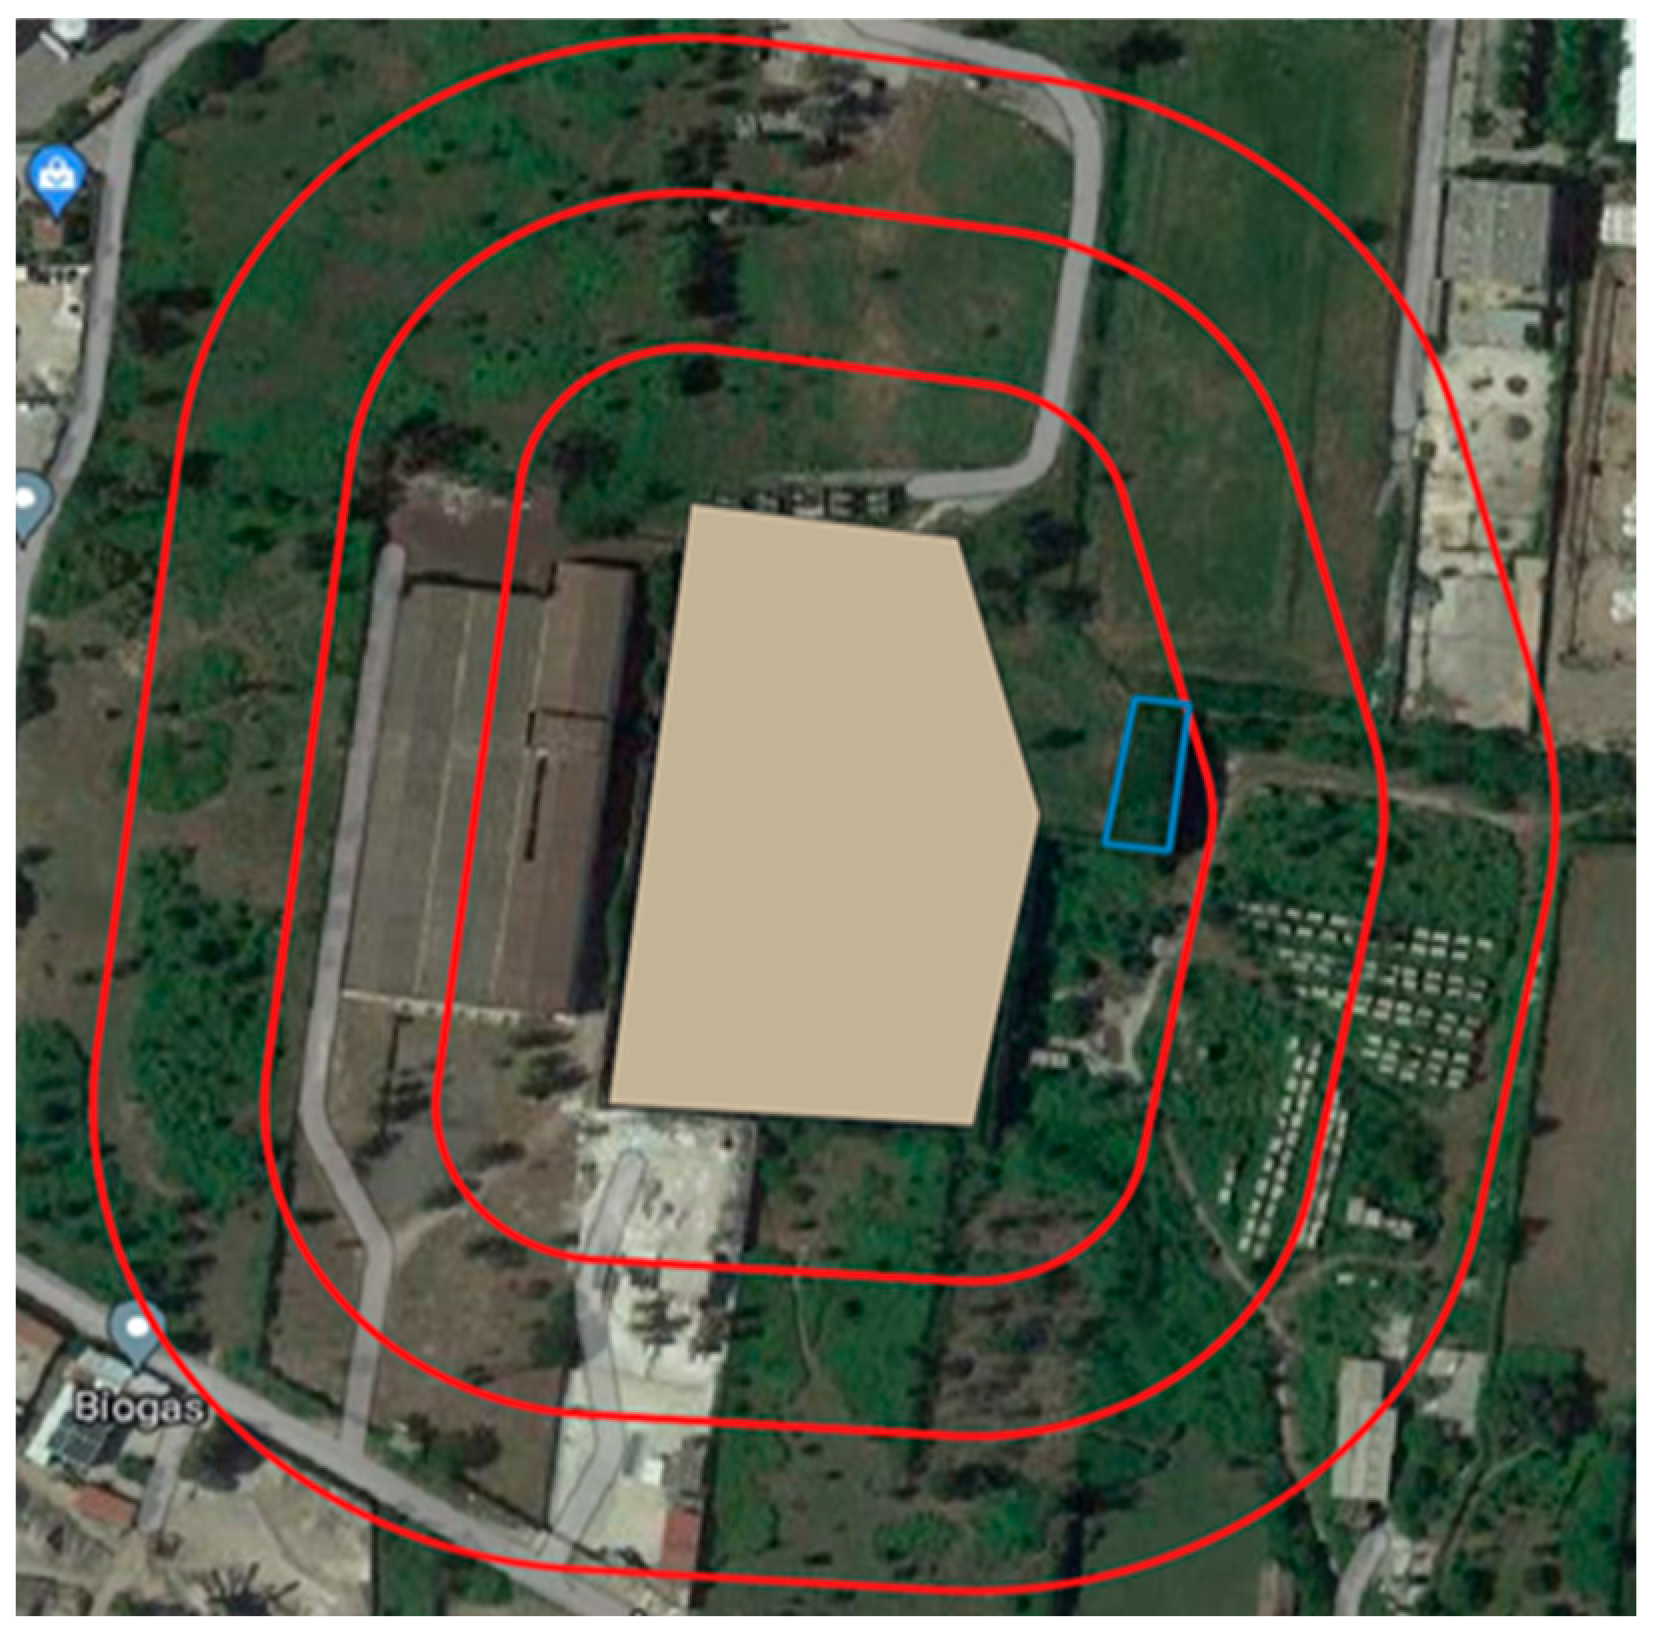
In the second phase, the algorithm focused on analysing specific areas of interest around the landfills. To achieve this, the algorithm utilized the shapefile containing the relevant spatial information about the selected zones, previously determined by the buffer ring analysis (refer step 2). For the first group with homogeneous vegetation, the algorithm drew individual polygons in each zone, effectively creating three polygons around each landfill (Figure 2). For the second group with heterogeneous vegetation, the algorithm selected a single area of interest closest to the landfill (Figure 3). Then, the algorithm calculated the average values of the previously computed vegetation indices within these specified regions. The process was repeated for all available images in the designated folder, resulting in averaged values for each index for each zone and landfill.
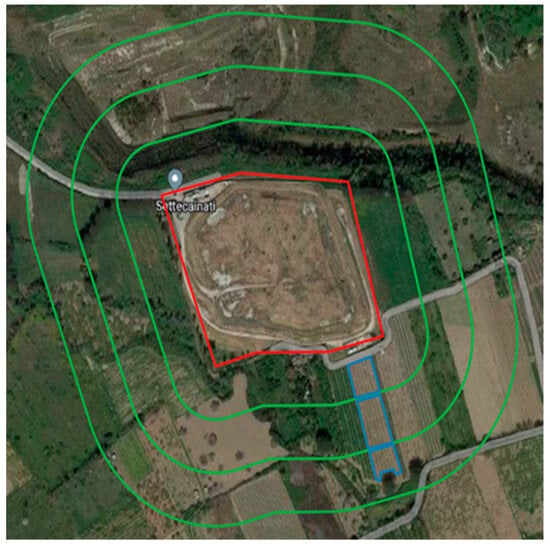
Figure 2.
Zone division—homogeneous vegetation group.
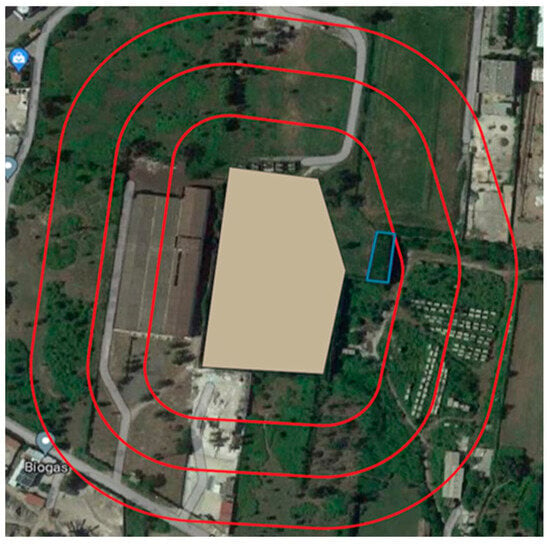
Figure 3.
Zone division—heterogeneous vegetation group.
3.5. Data Analysis and Comparison
The final stage of the analysis involved in-depth data exploitation and comparison. The algorithm compiled and analysed the averaged values of NDVI, NDWI, and GCI over the entire year and for each landfill site, including its internal zones. In this research, data from 2018 to 2022 were collected and analysed to establish temporal patterns and trends related to vegetation dynamics around the landfills. By comparing the results between the two groups (homogeneous and heterogeneous vegetation) as well as examining long-term trends, we were able to discern the impact of landfills on surrounding vegetation and assess any potential changes in the vegetation characteristics over time. Through this comprehensive methodology, the study sought to shed light on the complex interactions between landfills and vegetation, providing valuable insights into how the presence of landfills influences the surrounding environment and the ecosystem dynamics over time.
4. Results and Discussion
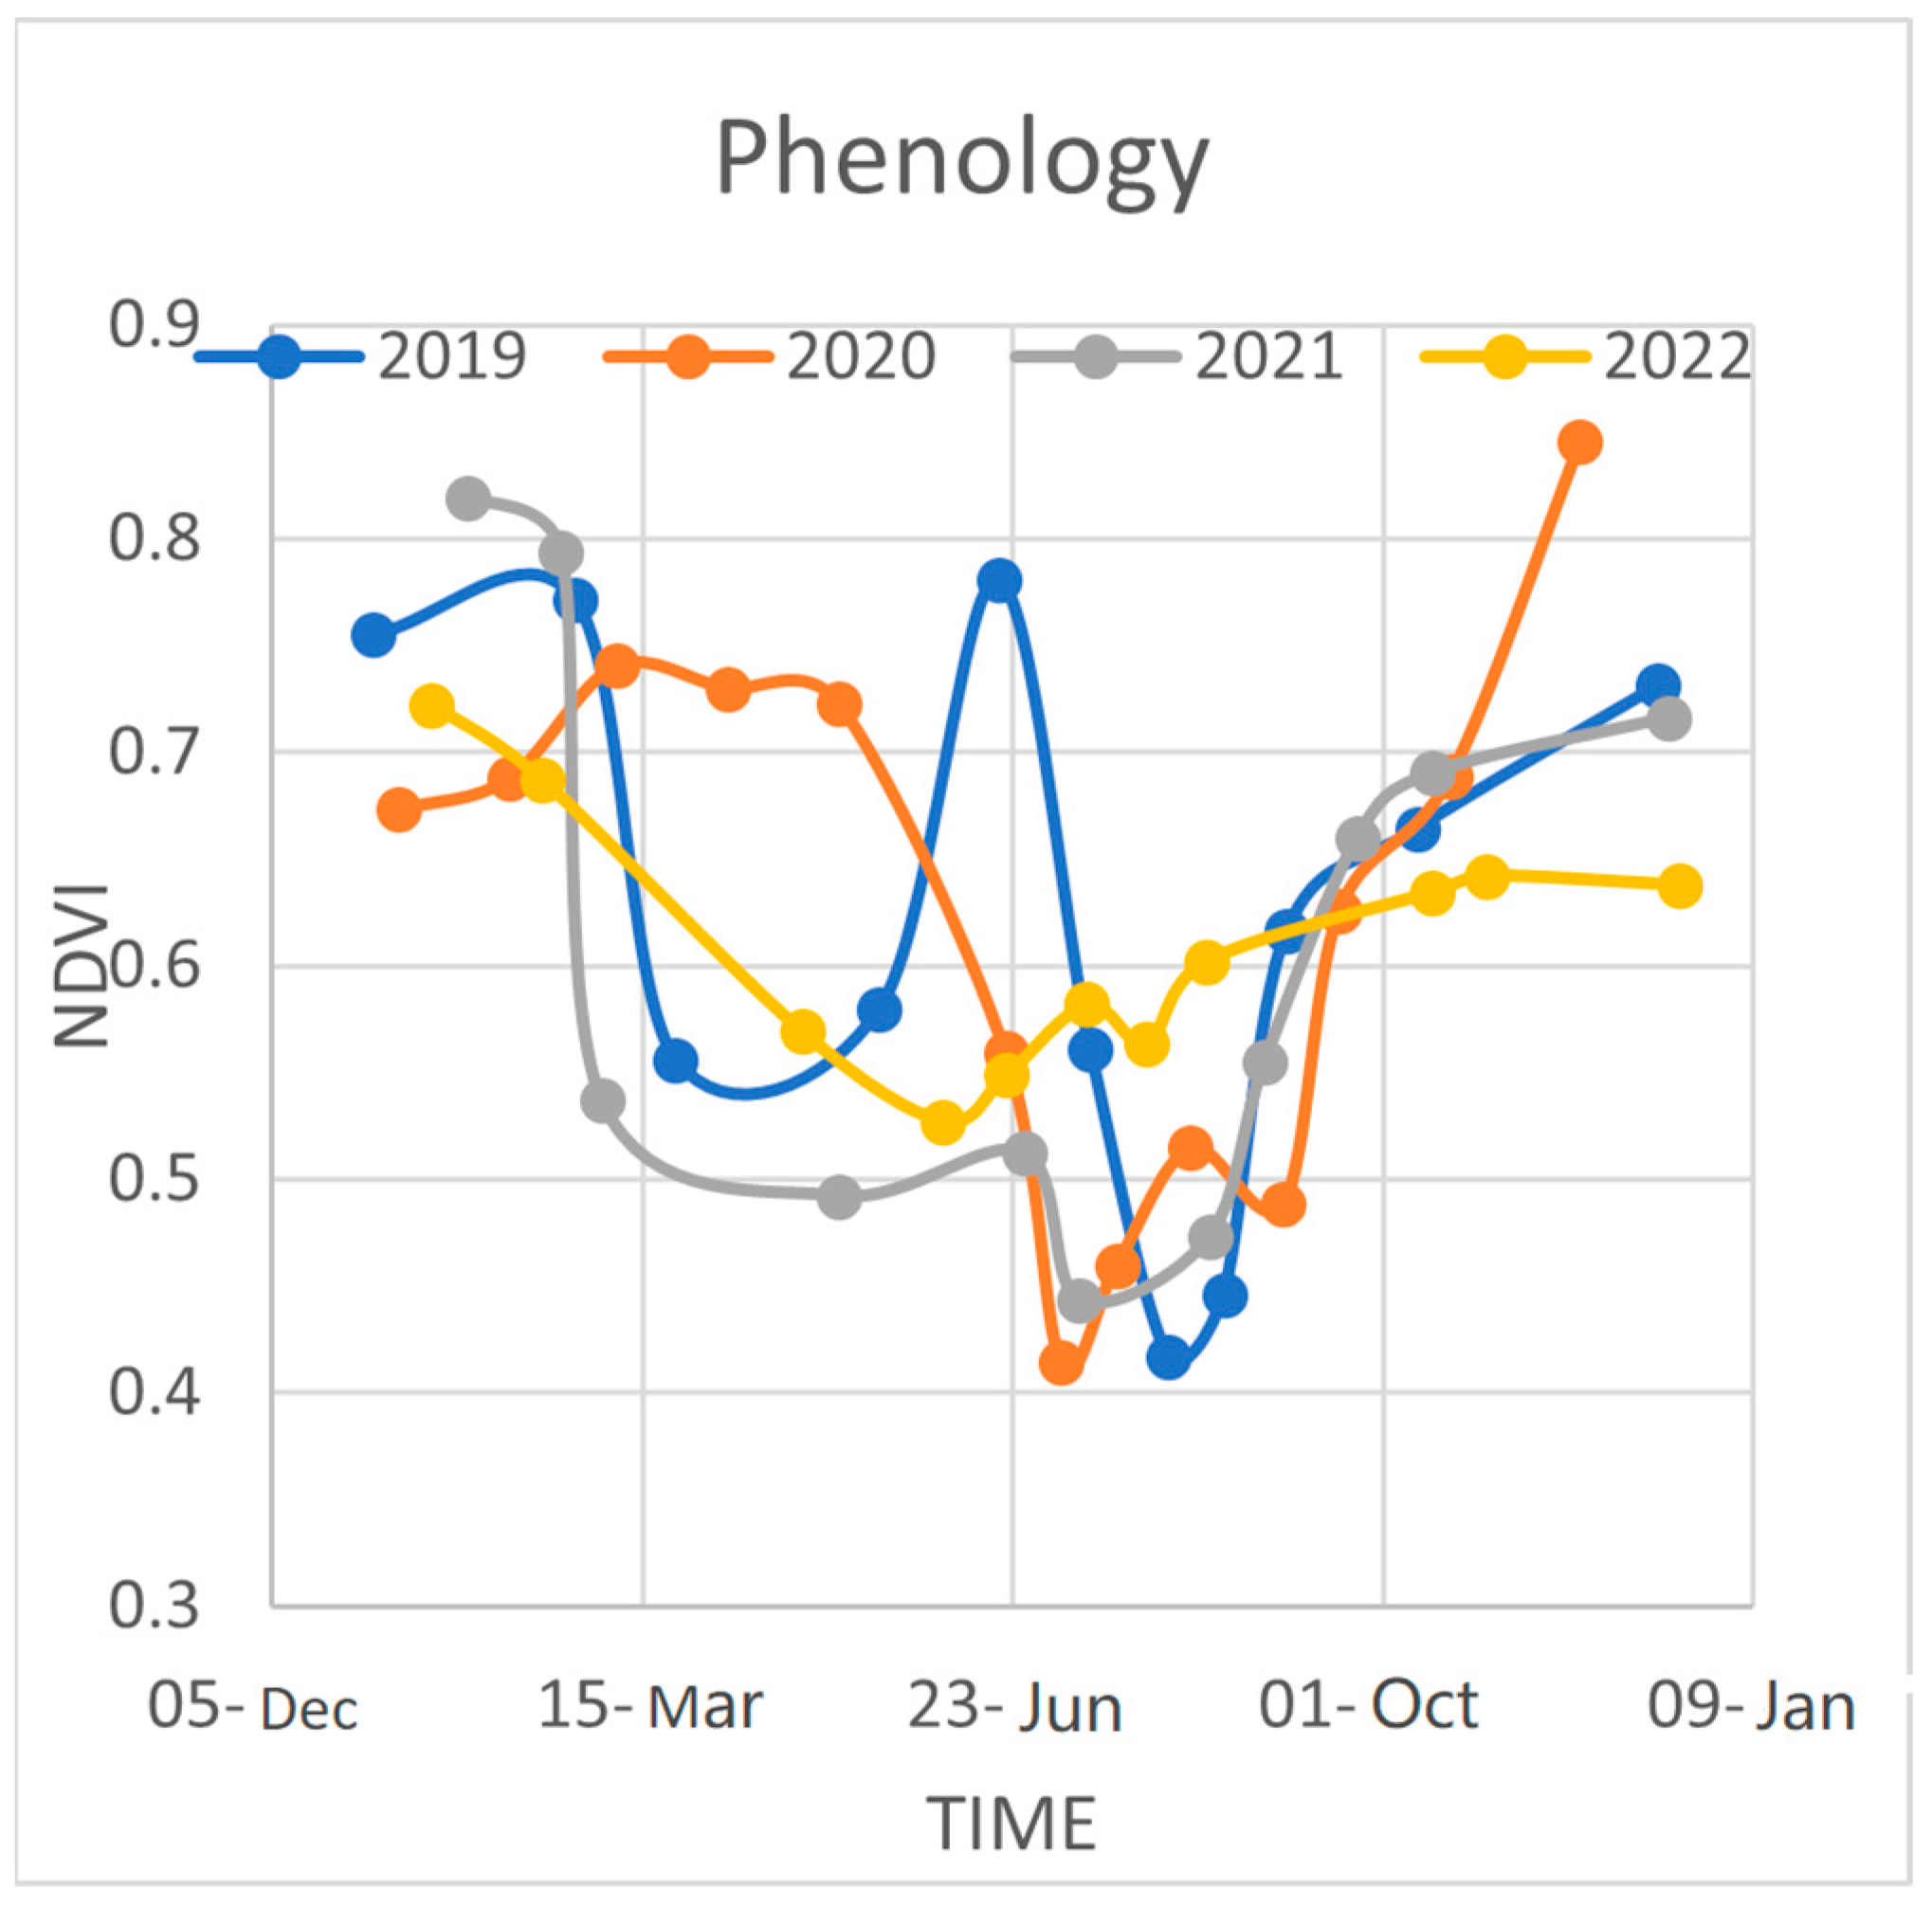
Based on observations from the 17 landfill sites, our study revealed that out of the 12 sites with uniform vegetation (Figure 4) within the 150 m buffer zone, two sites, among the homogeneous ones, exhibited a noticeable impact on surrounding vegetation. These two sites showed lower NDVI, NDWI, and GCI values in the vegetated areas near the landfill compared to areas further away, as depicted in Figure 5. While we calculated all three indices to assess the effect, we found that their behaviour was similar. Therefore, in this presentation of results, we are focusing on NDVI as a representative indicator of vegetation health and its response to landfill site proximity.
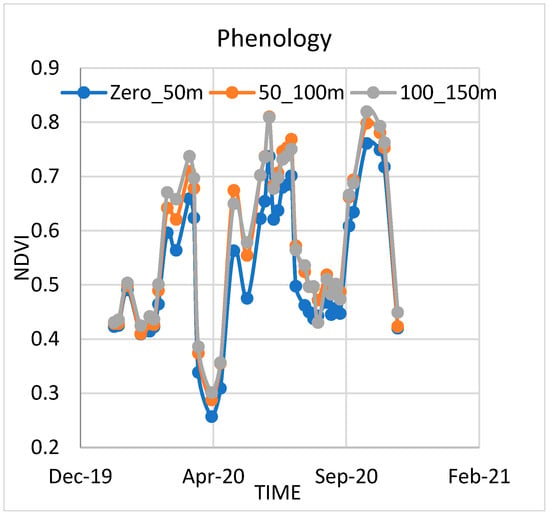
Figure 4.
Landfill site with homogeneous vegetation.
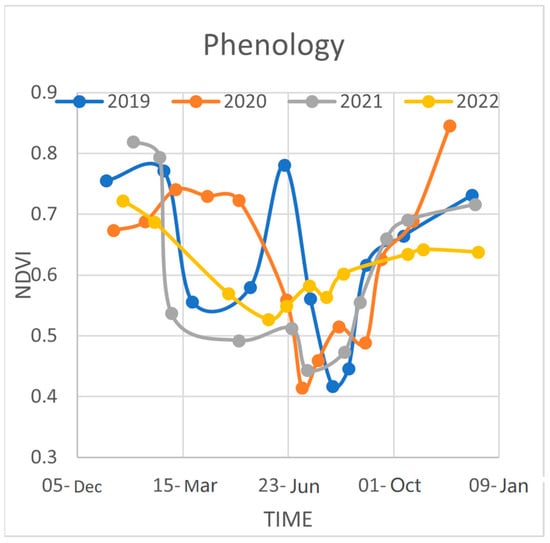
Figure 5.
Landfill site with heterogeneous vegetation.
To gain further insights, we examined the remaining five sites where uniform vegetation was not observed in the buffer zone. A specific area was selected, and the data were compared with data from the following year to assess vegetation changes over time. However, no specific effects were observed in these areas.
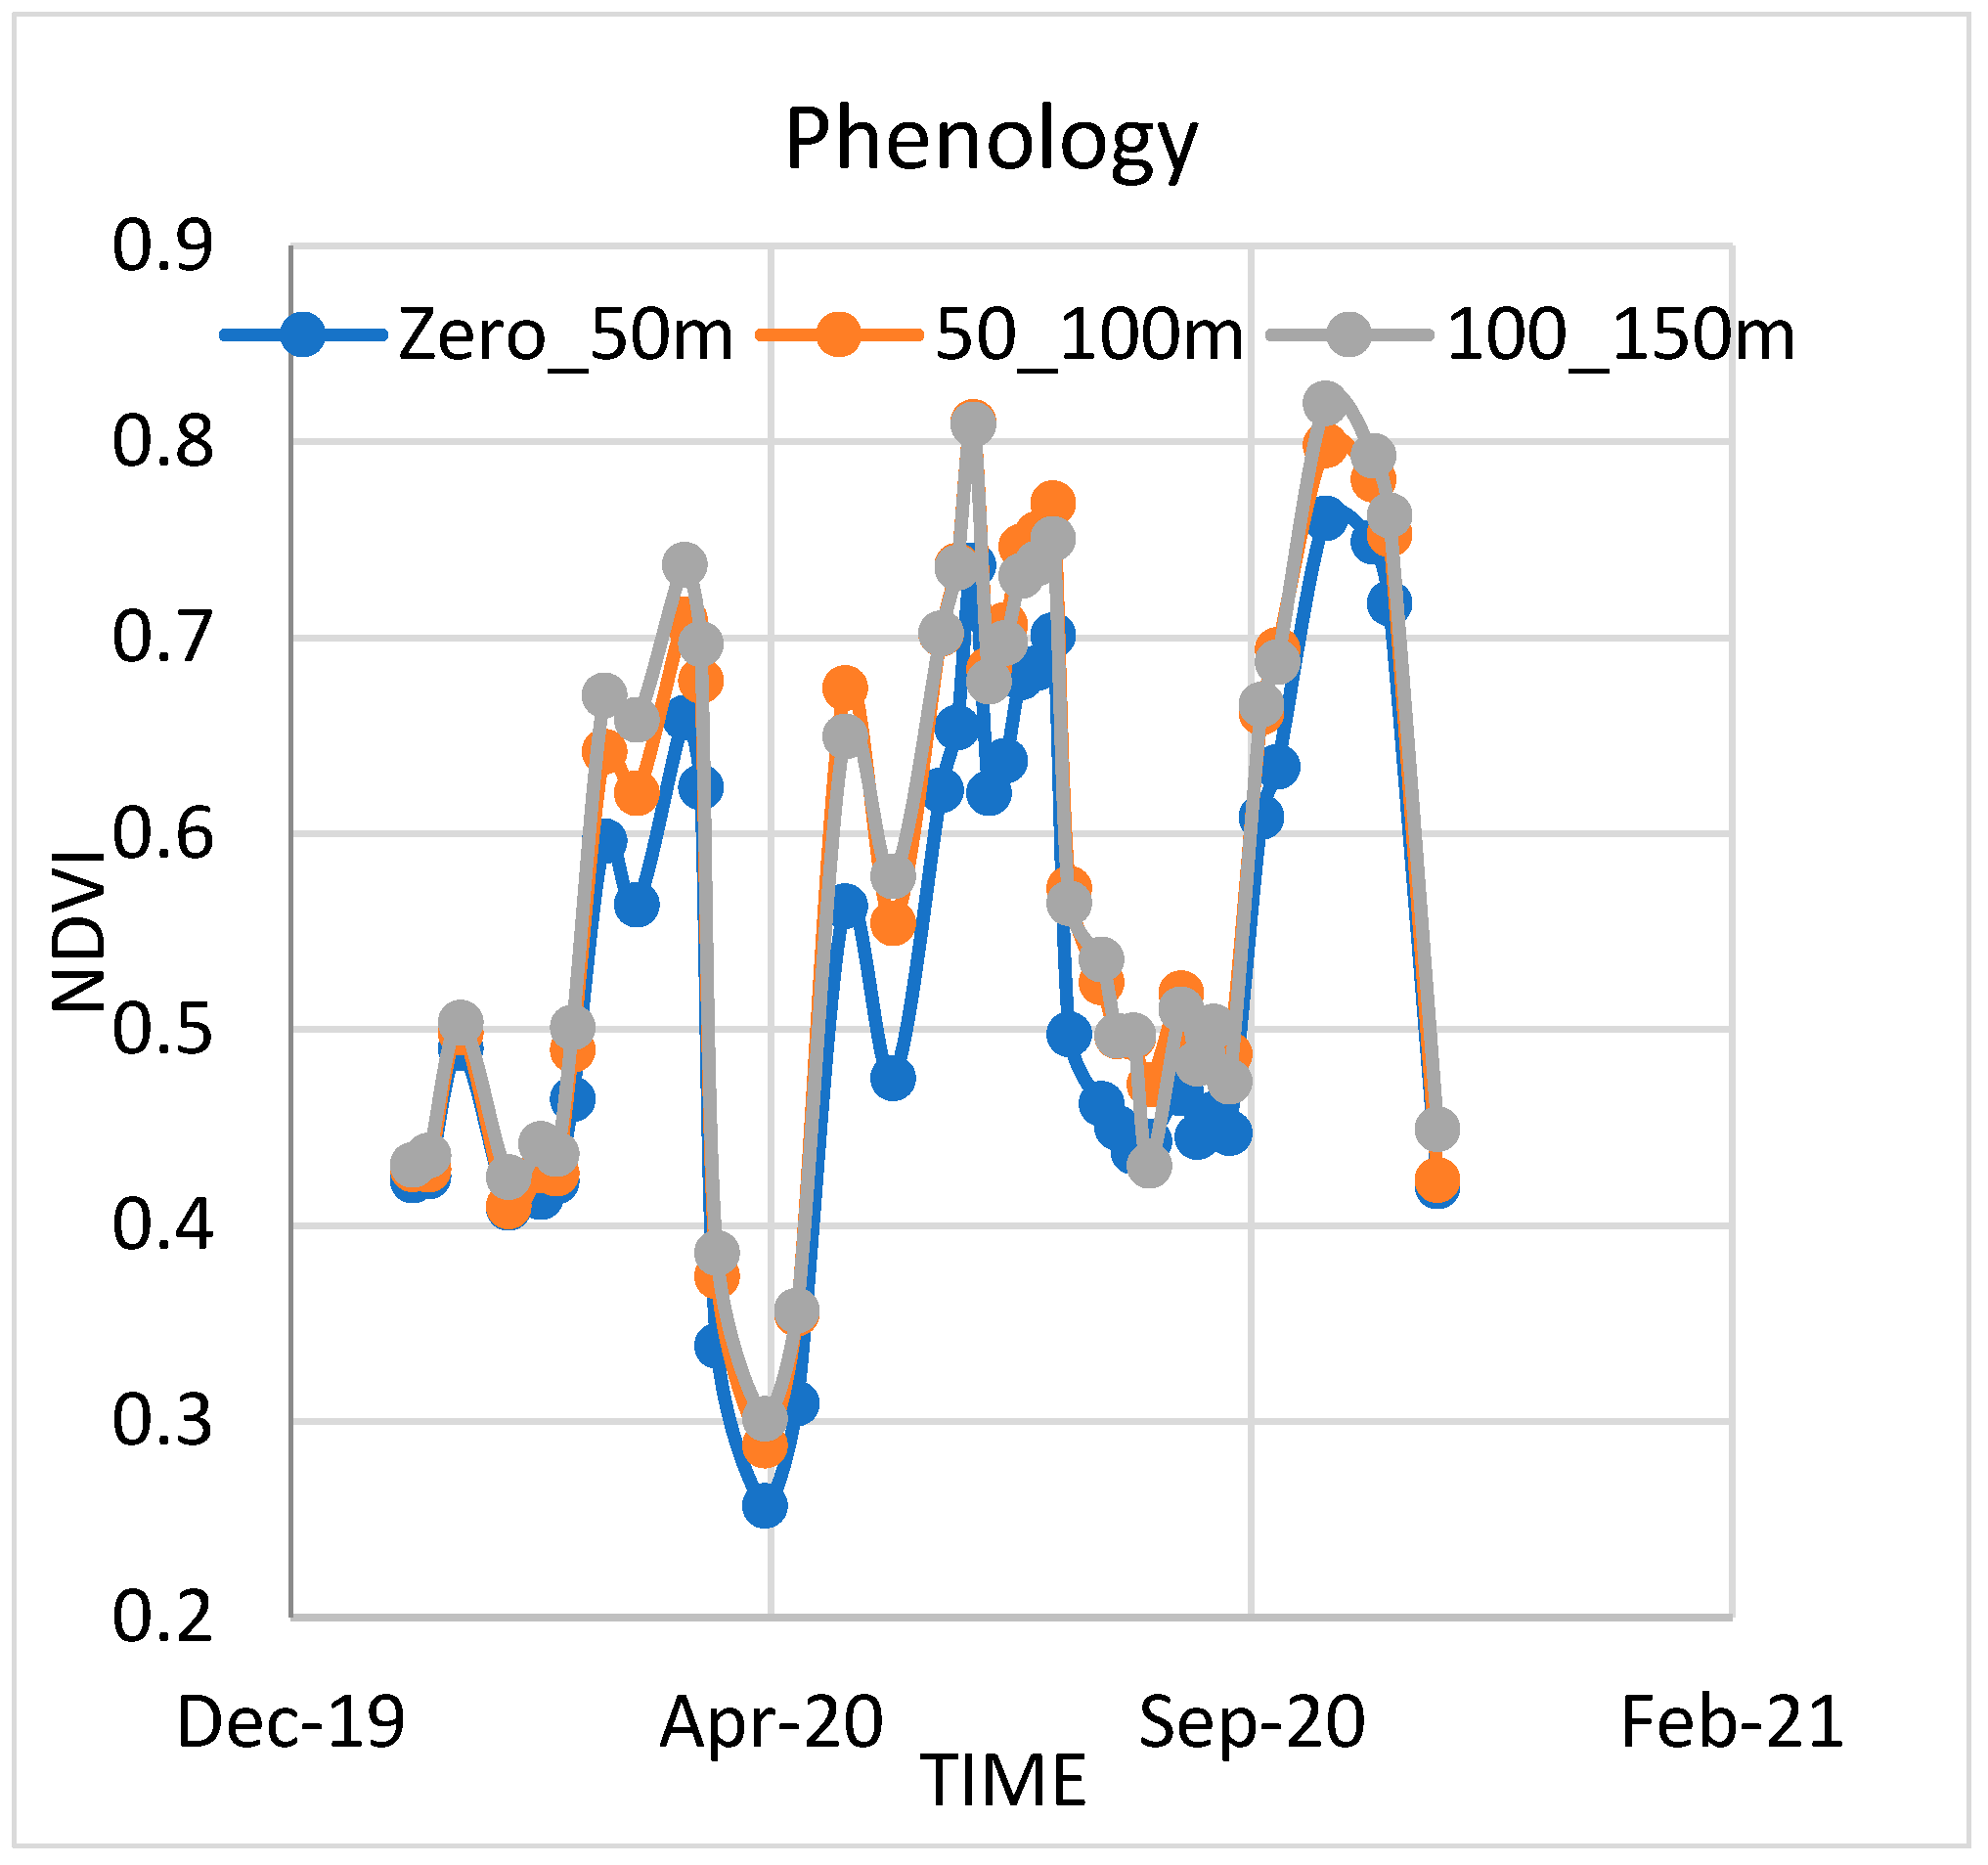
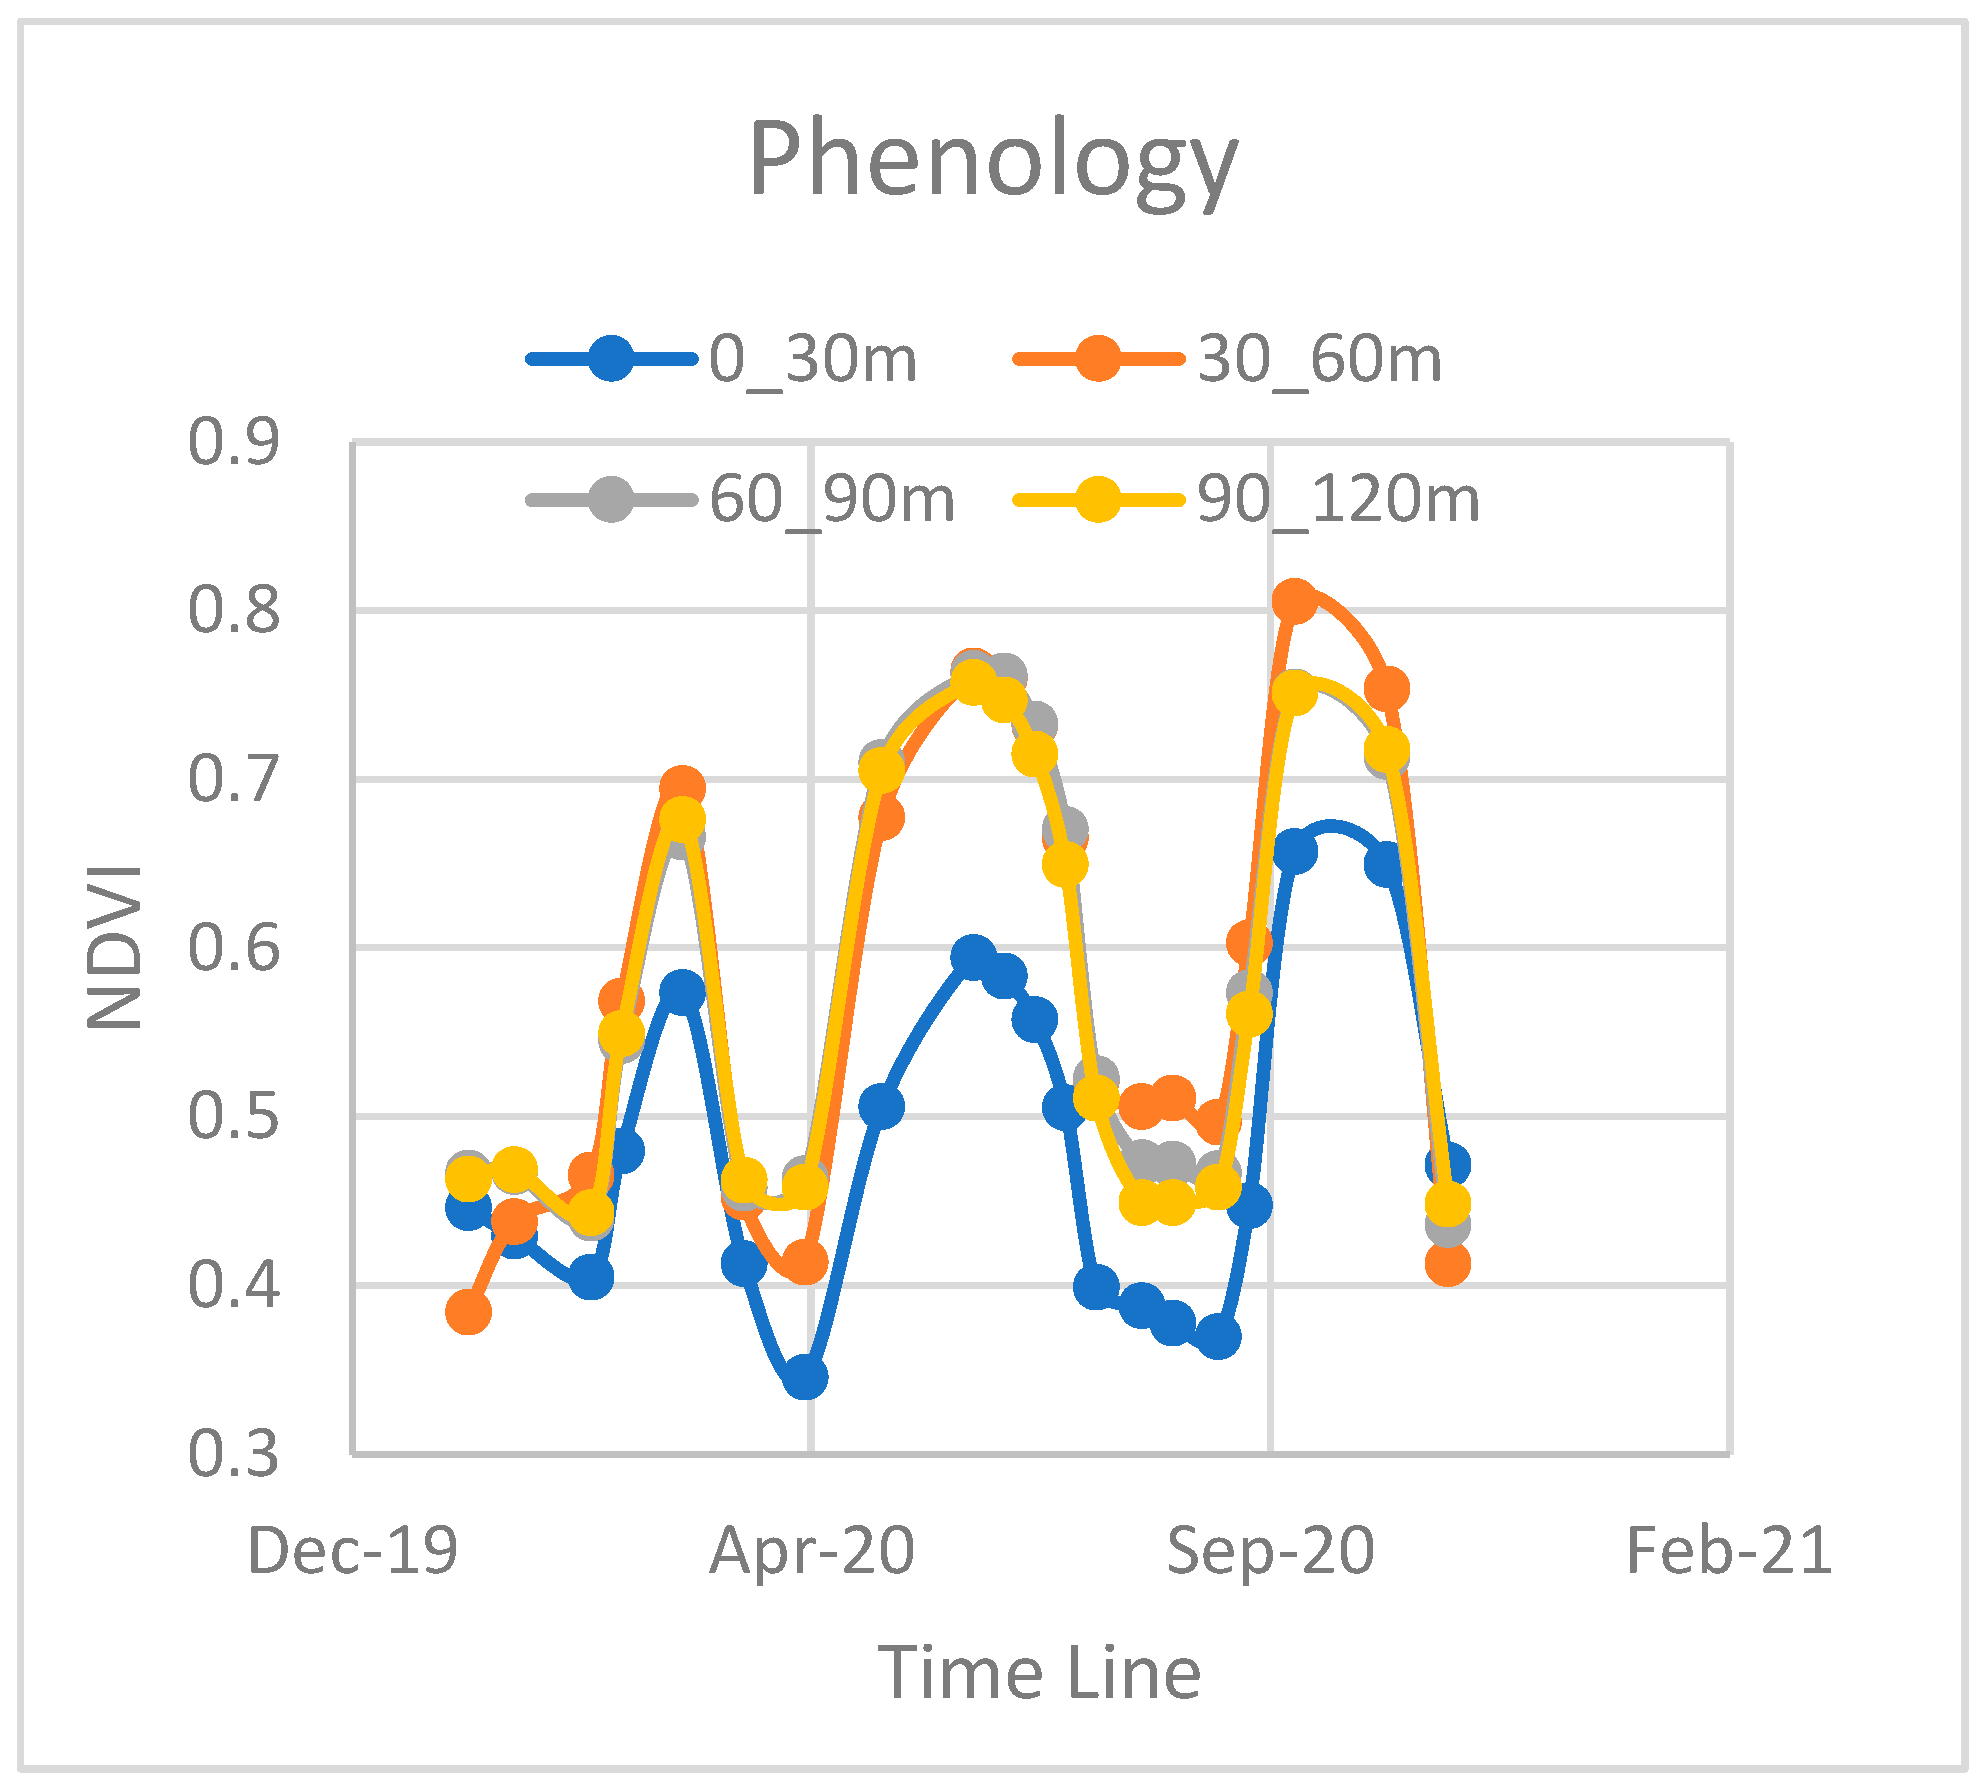
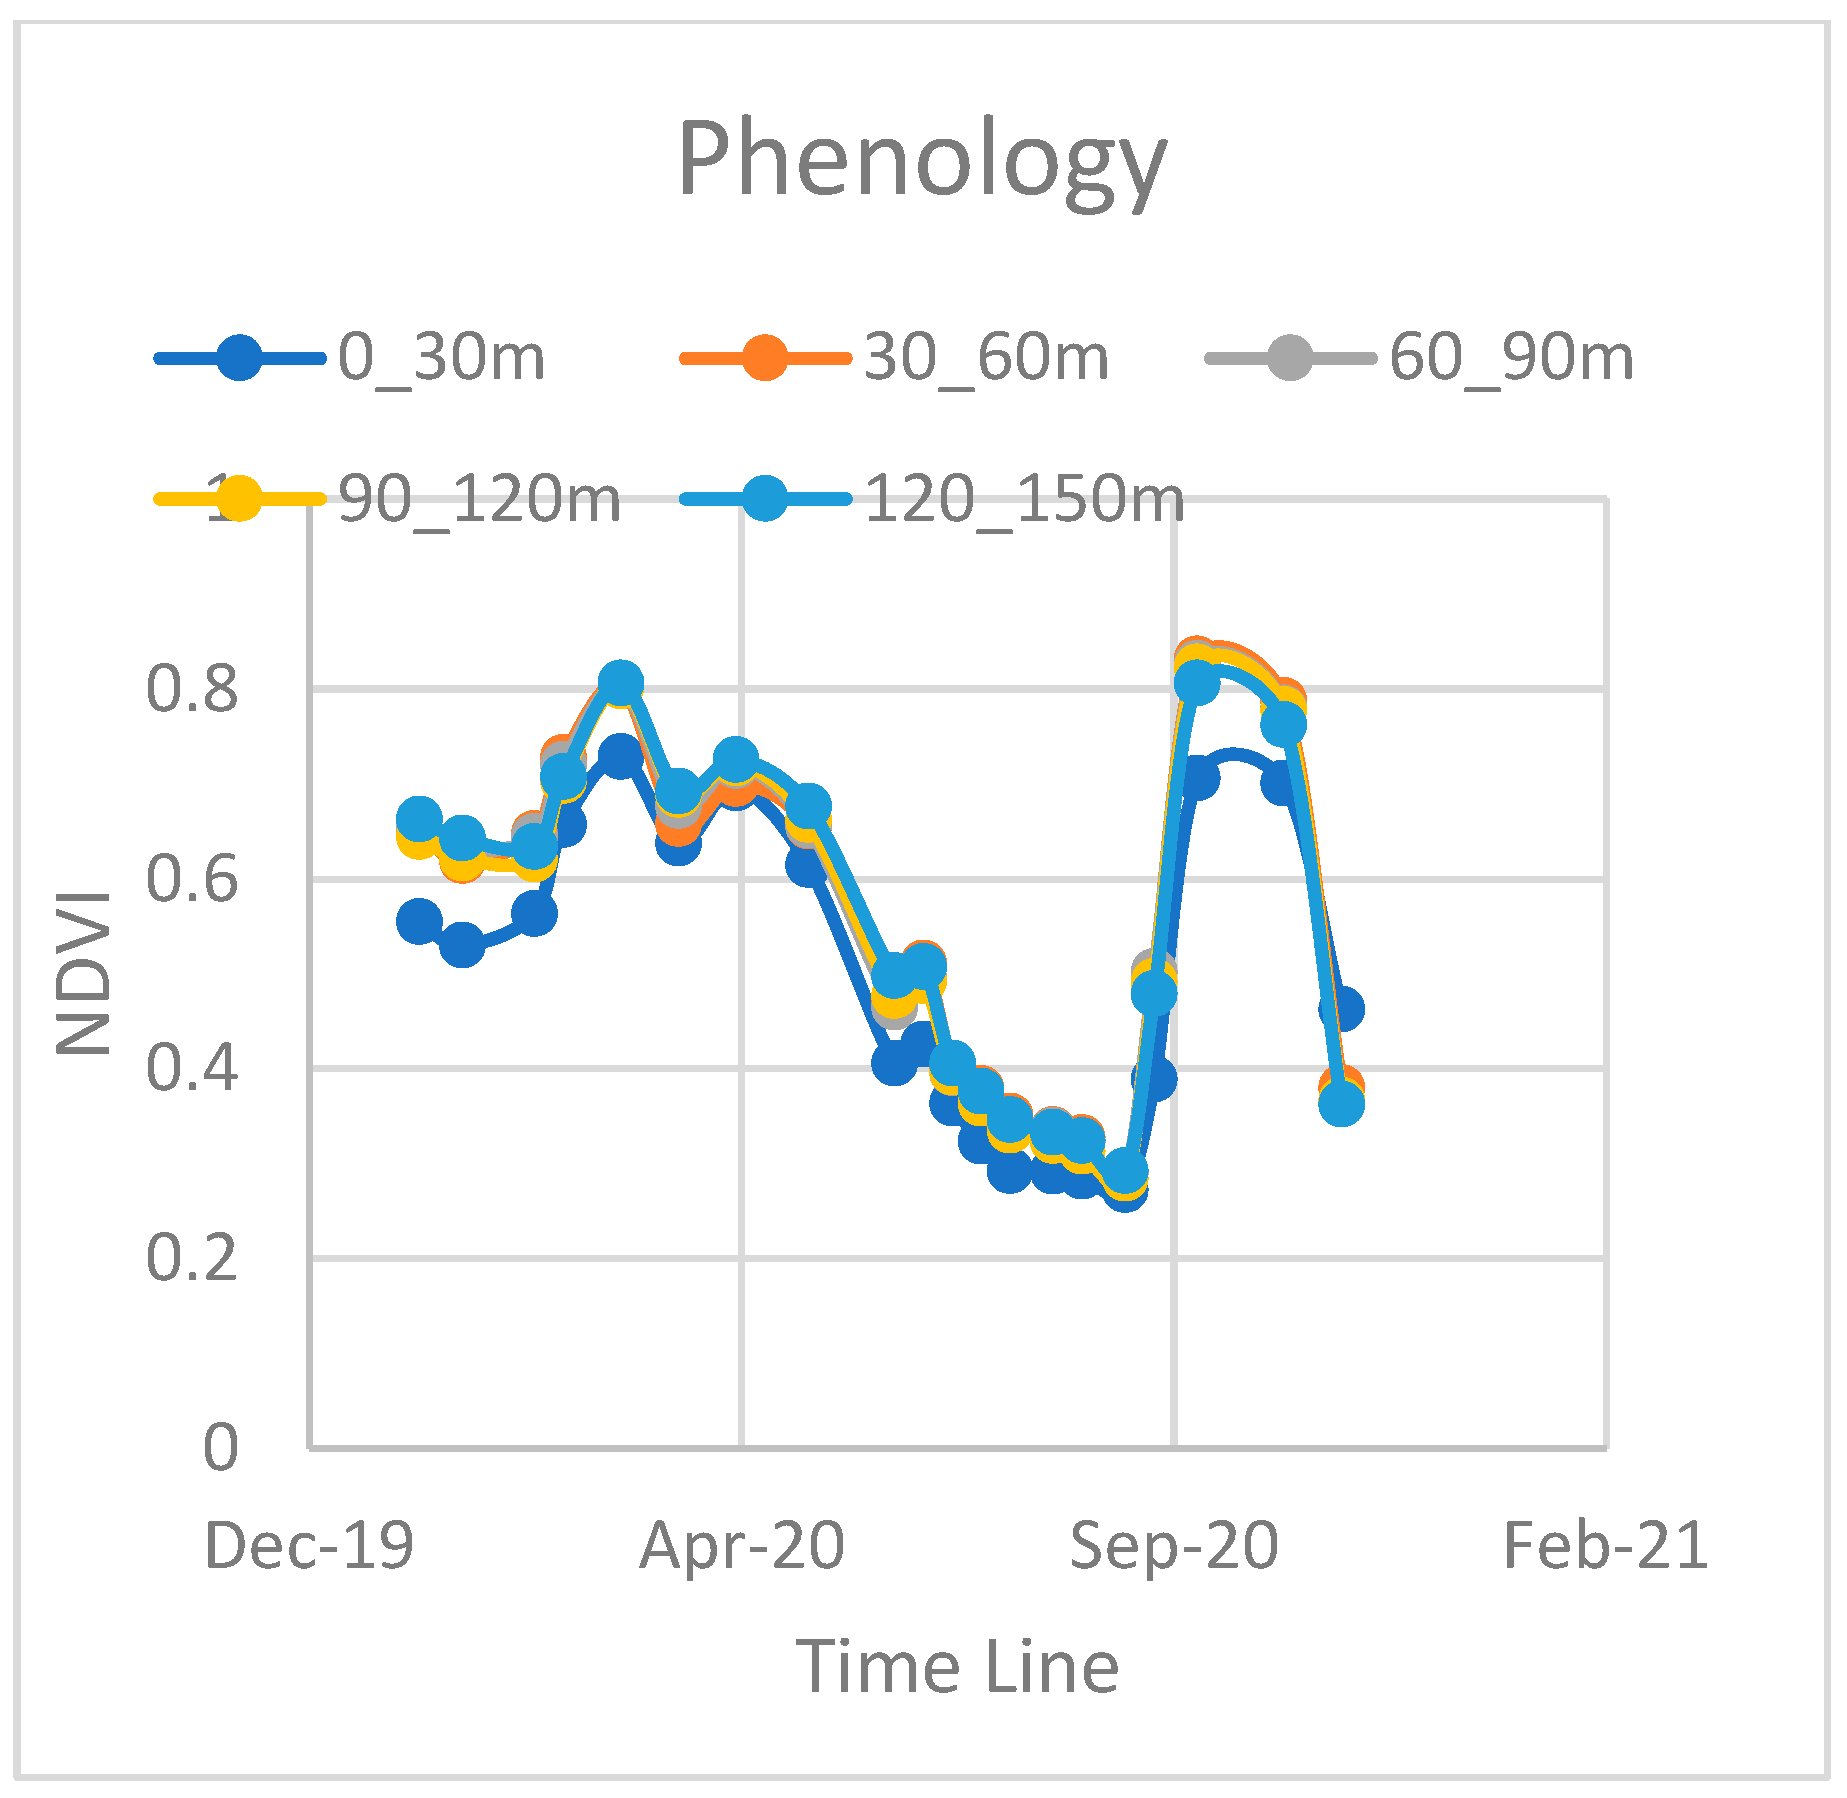
To conduct a more focused analysis on the affected regions, we reduced the buffer zone size around the landfill sites to 30 m. This adjustment allowed for a better discrimination of vegetation disturbances in the area surrounding the landfill site. Also, this methodology was applied against the two sites where the impact on vegetation near the landfill was as expected, as our analysis revealed compelling results for the selected areas (Figure 6 and Figure 7).
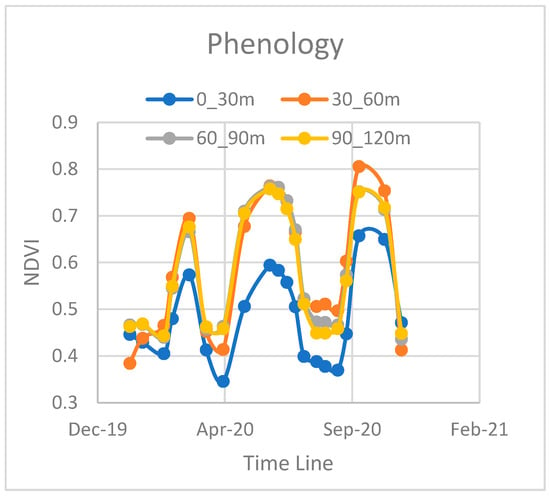
Figure 6.
Phenology with 30-meter buffer zone (Target 1).
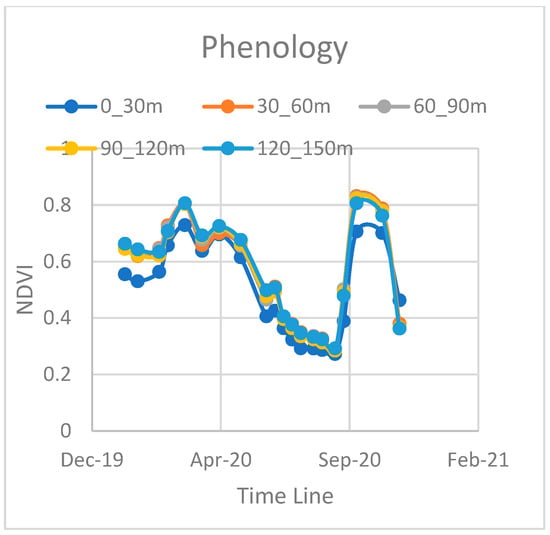
Figure 7.
Phenology with 30-meter buffer zone (Target 2).
We observed considerable changes in NDVI values, indicating the impact of the landfill on the surrounding vegetation. It was observed that in the two affected areas that the vegetation near the landfill exhibited a 20% and 10% reduction in growth compared to the vegetation farther away from the landfill (blue lines in Figure 6 and Figure 7) [9].
5. Conclusions
In this study, we focused on 17 landfill sites in the region of Naples, categorizing them into two groups based on surrounding vegetation characteristics. Through a comprehensive methodology that involved the use of Sentinel-2 and Landsat 8 satellite imagery processed by the Sen2Like tool, we analysed vegetation dynamics within the buffer zones around these landfills. The analysis revealed that two sites exhibited a noticeable impact on surrounding vegetation, as indicated by lower NDVI, NDWI, and GCI values near the landfill.
To gain more insights into the affected regions, we reduced the buffer zone size to 30 m and focused on the two identified areas showing significant impact. Our study demonstrated considerable changes in NDVI and GCI values, highlighting the influence of landfills on the surrounding vegetation. These findings emphasize the importance of effective landfill management to safeguard the environment and surrounding ecosystem. Continuous monitoring and further research will be essential to comprehensively understand the long-term effects of landfills and guide future conservation efforts. Overall, this study contributes valuable insights into the complex interactions between landfills and vegetation, providing a basis for informed decision-making and sustainable landfill management practices. By understanding the impact of landfills on vegetation dynamics, we can work towards preserving and protecting our environment for future generations.
In continuation of this study, efforts are underway to develop a continuous monitoring system for the landfills and establish a linkage between ground-based and satellite-based measurements [10]. This integrated approach will enable the real-time assessment of environmental changes and support effective and sustainable landfill management strategies [11].
As part of our future research, we aim to enhance the monitoring and response mechanisms for landfill-affected vegetation [12]. In instances of anomaly detection or irregular crop behaviour, we plan to promptly acquire PRISMA satellite imagery for closer analysis. By leveraging this imagery, we intend to investigate the specific parameters responsible for such variations, including chlorophyll, carotenoids, and water content. Additionally, in cases where current satellite images are unavailable, we will utilize the insights gained from this study to pinpoint the optimal timeframes for observation. This strategic timeline will guide the request and analysis of relevant satellite imagery, enabling us to gain a deeper understanding of the factors influencing vegetation dynamics near landfills. This proactive approach will contribute to more effective and sustainable landfill management practices and further our commitment to preserving and protecting our environment for generations to come.
Author Contributions
Conceptualization: R.V. and E.C.; Methodology: R.V., G.L. and S.S.; Software: R.V.; Validation: R.V. and S.S.; Formal analysis & Investigation: S.S.; Data curation and Writing—original draft preparation: R.V.; Writing—review and editing: G.L., S.S. and M.L.; Visualization: M.L.; Supervision: G.L. and S.S.; Project administration: M.L. All authors have read and agreed to the published version of the manuscript.
Funding
This research received no external funding.
Institutional Review Board Statement
Not applicable.
Informed Consent Statement
Not applicable.
Data Availability Statement
The data used to support the findings of this study are available from the corresponding author upon reasonable request.
Acknowledgments
We would like to express our sincere gratitude to Serco Italian Spa for their collaboration and support throughout the course of this research. This work was conducted as part of the Clear Up Project, a collaborative effort that has greatly contributed to our understanding of landfill impacts on the environment. We also extend our appreciation to the Italian Space Agency (ASI) for providing the necessary funding that made this research possible.
Conflicts of Interest
The authors declare no conflict of interest.
References
- Singh, J.; Kalamdhad, A. Effects of Heavy Metals on Soil, Plants, Human Health, and Aquatic Life. Int. J. Res. Chem. Environ. 2011, 1, 2011. [Google Scholar]
- Vaverková, M.D. Landfill impacts on the environment. Geosciences 2019, 9, 413. [Google Scholar] [CrossRef]
- Dewidar, K.M. Landfill detection in Hurghada, North Red Sea, Egypt, using thematic mapper images. Int. J. Remote Sens. 2002, 23, 939–948. [Google Scholar] [CrossRef]
- Hannan, M.A.; Al Mamun, M.A.; Hussain, A.; Basri, H.; Begum, R.A. A review on technologies and their usage in solid waste monitoring and management systems: Issues and challenges. Waste Manag. 2015, 43, 509–523. [Google Scholar] [CrossRef] [PubMed]
- Papale, L.G.; Guerrisi, G.; De Santis, D.; Schiavon, G.; Del Frate, F. Satellite Data Potentialities in Solid Waste Landfill Monitoring: Review and Case Studies. Sensors 2023, 23, 3917. [Google Scholar] [CrossRef] [PubMed]
- Saunier, S.; Pflug, B.; Lobos, I.M.; Franch, B.; Louis, J.; De Los Reyes, R.; Debaecker, V.; Cadau, E.G.; Boccia, V.; Gascon, F.; et al. Sen2Like: Paving the Way towards Harmonization and Fusion of Optical Data. Remote Sens. 2022, 14, 3855. [Google Scholar] [CrossRef]
- Gitelson, A.A.; Vina, A.; Ciganda, V.; Rundquist, D.C.; Arkebauer, T.J. Remote estimation of canopy chlorophyll content in crops. Geophys. Res. Lett. 2005, 32, 2005. [Google Scholar] [CrossRef]
- Kong, D.; McVicar, T.R.; Xiao, M.; Zhang, Y.; Peña-Arancibia, J.L.; Filippa, G.; Xie, Y.; Gu, X. phenofit: An R pack -age for extracting vegetation phenology from time series remotesensing. Methods Ecol. Evol. 2022, 13, 1508–1527. [Google Scholar] [CrossRef]
- Folkard, A.M.; Cummins, D.I. Hyper-spectral remote sensing of the spread of soil contaminants from landfill sites. In Contaminated Soil; Thomas Telford Ltd.: London, UK, 1998; pp. 1–153. [Google Scholar]
- Shaker, A.; Faisal, K.; Yan, W.Y. Integration between Ground-Based and Space-Based Measurements for Monitoring Landfill Sites. In Proceedings of the Geomatics Technologies in the City—First International Geomatics Symposium in Saudi Arabia, Jeddah, Saudi Arabia, 10–13 May 2011. [Google Scholar]
- The “CLEAR_UP” Project: Landfill monitoring and Environment Assessment Research using PRISMA, SIA/Serco SpA/CNR-IGARSS July 2023. Available online: https://2023.ieeeigarss.org/view_paper.php?PaperNum=4774 (accessed on 20 September 2023).
- Available online: https://github.com/senbox-org/sen2like (accessed on 20 May 2023).
Disclaimer/Publisher’s Note: The statements, opinions and data contained in all publications are solely those of the individual author(s) and contributor(s) and not of MDPI and/or the editor(s). MDPI and/or the editor(s) disclaim responsibility for any injury to people or property resulting from any ideas, methods, instructions or products referred to in the content. |
© 2023 by the authors. Licensee MDPI, Basel, Switzerland. This article is an open access article distributed under the terms and conditions of the Creative Commons Attribution (CC BY) license (https://creativecommons.org/licenses/by/4.0/).

