Abstract
Mobile location-based services (MLBS) are attracting attention for their potential public and personal use for a variety of applications such as location-based advertisement, smart shopping, smart cities, health applications, emergency response, and even gaming. Many of these applications rely on Inertial Navigation Systems (INS) due to the degraded GNSS services indoors. INS-based MLBS using smartphones is hindered by the quality of the MEMS sensors provided in smartphones which suffer from high noise and errors resulting in high drift in the navigation solution rapidly. Pedestrian dead reckoning (PDR) is an INS-based navigation technique that exploits human motion to reduce navigation solution errors, but the errors cannot be eliminated without aid from other techniques. The purpose of this study is to enhance and extend the short-term reliability of PDR systems for smartphones as a standalone system through an enhanced step detection algorithm, a periodic attitude correction technique, and a novel PCA-based motion direction estimation technique. Testing shows that the developed system (S-PDR) provides a reliable short-term navigation solution with a final positioning error that is up to 6 m after 3 min runtime. These results were compared to a PDR solution using an Xsens IMU which is known to be a high grade MEMS IMU and was found to be worse than S-PDR. The findings show that S-PDR can be used to aid GNSS in challenging environments and can be a viable option for short-term indoor navigation until aiding is provided by alternative means. Furthermore, the extended reliable solution of S-PDR can help reduce the operational complexity of aiding navigation systems such as RF-based indoor navigation and magnetic map matching as it reduces the frequency by which these aiding techniques are required and applied.
1. Introduction
Navigation is a service that we rely on during our daily activities and is defined as the task of successfully providing directions from a starting point to a destination. The goal of any navigation system is finding the time-varying navigation states: position, velocity, and attitude of a moving platform with high precision [1]. Existing navigation technologies and techniques can be categorized into absolute measurements (also known as reference-based) systems, relative measurements (also known as Dead Reckoning) systems, or a combination of both [2]. Global navigation satellite system (GNSS) is one of the main technologies used for navigation with the global positioning system (GPS) being the prevalent system. GNSS is a reference-based system that uses a set of satellites for the purpose of positioning and attitude estimation. Although GNSS is always expanding and improving with the presence of many constellations such as GPS, BEIDOU, GALILEO, and QZSS, and the increasing number of satellites per constellation providing wide coverage, GNSS navigation is not always accurate and stable, and in many cases it can fail to provide a positional solution [3]. This results from degraded GNSS services in certain environments such as urban canyons and indoors. To compensate for the shortcomings of GNSS, relative navigation techniques are used as an alternative or aiding in the case of a combined system.
Relative navigation techniques cannot measure the position and attitude directly and rely on other techniques to evaluate the navigation states. Inertial navigation is one of the prominent relative navigation techniques that can aid GNSS systems to achieve a continuous navigation solution. An inertial navigation system (INS) is a self-contained navigation system that relies on inertial measurements provided by an inertial measurements unit (IMU) to compute position, velocity, and attitude information [2,4]. The bases of inertial navigation are based on Newton’s 1st and 2nd laws of motion and uses a technique known as dead reckoning (DR) [2]. The inertial measurements are provided from an IMU that consists of a combination of 3-axis accelerometers and 3-axis gyroscopes to measure the acceleration and angular rate vectors. In some cases, extra sensors are available and used in conjunction with an IMU to provide more information for navigational purposes such as a three-axis magnetometer to provide magnetic field measurements and a barometer for pressure measurements. The sensor measurements provided by the IMU are processed using DR to track the changing navigation states of the platform, where the position is updated by knowing the distance traveled and the direction of motion [5]. An initialization process for obtaining the initial position is required along with an alignment process for finding the initial attitude difference between the navigation platform and the navigation frame—local level frame (LLF)—[6]. The miniaturization and power efficiency of IMU sensors made possible by micro-electro-mechanical systems (MEMS) technology advancements [7,8,9,10,11,12] led to their inclusion in many of the consumer-based devices such as smartphones and wearable devices. The availability of sensor-enabled smart devices led to an increasing interest in MLBS applications such as military applications, gaming, personal navigation and localization [13], and emergency service providers tracking [14] especially when GNSS services are degraded. Indoor MLBS applications fall under three main sectors: government, business, and individual [15], and can fall in multiple sectors at a time. These sectors are considered to be the commercial drivers of MLBS market, and they dictate the level of required services [16].
On the other hand, MEMS IMU tend to suffer from high measurement errors which makes them less reliable. IMUs are categorized based on their performance and underlying fabrication technologies. Although there is no definitive metric or a well-defined and agreed upon grouping performance thresholds [17,18], in general, there are four grades—in some cases five—of IMUs that are based on grouping of likewise performance and main applications. A comparison of the different types and grades of IMUs is presented in [2]. The comparison shows the relatively high errors of the MEMS IMUs—also referred to as commercial grade—in comparison to the higher more expensive counterparts, where the performance charts show that MEMS technology suffers from the highest error budget in comparison to other technologies.
Since DR is a relative navigation technique, and since MEMS IMU suffer from high errors, the navigation solution drifts quickly from the true values of position and attitude. Hence, DR requires correction techniques or even aiding from other technologies to provide corrections for the navigation states. Methods for correction have been developed and used to enhance the performance of DR. Some of these correction techniques include: zero velocity update (ZUPT) [19], zero angular rate update (ZARU) [20], magnetic angular rate update (MARU) [21], and heuristic drift reduction (HDR) [22]. These techniques exploit certain motion constraints to provide corrections, but in the case of smartphone-based navigation, many of these conditions do not occur frequently. Pedestrian dead reckoning (PDR) is a modified form of DR that was developed especially for pedestrian navigation and uses human motion information—namely the gait cycle (GC)—to improve the performance over regular DR methods. PDR consists of four main parts: attitude estimation, step detection, heading estimation, and step length estimation.
This research presents a modified PDR system for smartphone navigation that exploits tendencies in human motion to further reduce the error accumulation in the navigation states. The developed system can: accurately detect steps under varying motion speeds and smartphone use cases, provide frequent attitude corrections without imposing motion restrictions on the user, and estimate motion direction with high accuracy. The contributions of this system are: (1) accurately detect steps using sensor fusion while being able to verify steps taken and compensate for missed steps, (2) provide attitude corrections as frequent as a step-by-step basis without imposing motion constraints on the user and without relying on previous attitude states to eliminate drift, (3) estimate the direction of motion of the user with high accuracy by analyzing the accelerations within a step and eliminating outliers to obtain a reduced data set that accurately captures the direction of motion of the user.
This article is organized as follows: After covering some of the state-of-the-art PDR systems and the innovations in the PDR modules in Section 2, the developed method for PDR and the underlying enhancements in each of the main PDR subsystems is presented in Section 3. In Section 4, a description of the testing and experimental setup is provided, followed by performance analysis, evaluation, and discussion in Section 5. Finally, conclusions are presented in Section 6.
2. Related Work
The main idea of PDR is to detect the steps the user takes while having a good estimate of the length and direction of the step taken by the pedestrian [23]. Using this approach, the accelerometer data are no longer integrated throughout the navigation process. Instead, the data are being used for detecting steps taken by the user, that are then used for position estimation based on the step length of the pedestrian and his orientation. Figure 1 shows an illustrative example of a 2D PDR where the position is only described as east and north components in the LLF.
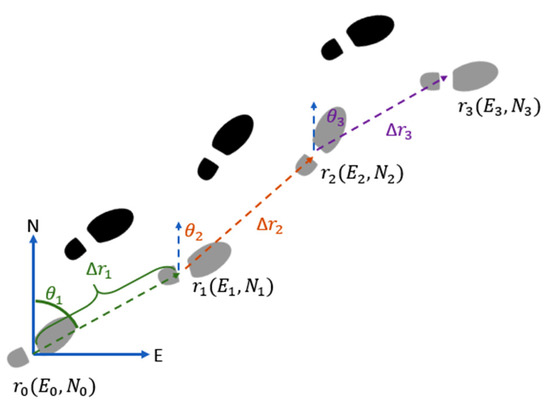
Figure 1.
Pedestrian Dead Reckoning (PDR).
PDR systems can be categorized into two categories: strapdown systems and free-moving (handheld devices) systems. For strapdown PDR systems, we utilize the human GC [24,25,26]. GC describes the step cyclic motion and is split into two main parts: the stance phase which is the period when the pedestrian foot is in contact with the ground, and the Swing phase which is when the foot is swinging in between two consecutive stances. Human gait analysis studies the human motion patterns through the kinematic, kinetic, spatial, and temporal parameters [25]. The repetitiveness of the GC makes it ideal for breaking down the pedestrian navigation problem, as most body segments have expected cyclic and repetitive accelerations and angular rate signals under nominal motion. A GC example with all phases is presented in Figure 2.
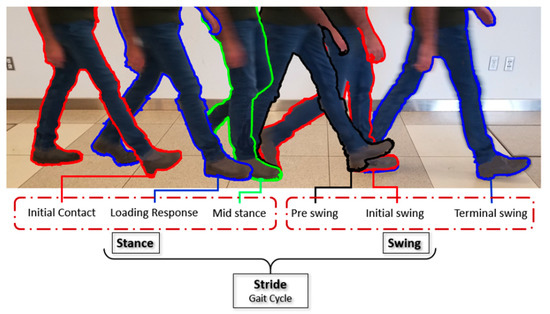
Figure 2.
Human gait cycle (GC) [27].
This approach decreases the accumulated error in position over time as it breaks down the pedestrian navigation problem into smaller independent modules that accumulate less error over time. Alternatively, it imposes new challenges such as optimal step detection, step length estimation, and user orientation tracking. A general block diagram of PDR systems is shown in Figure 3, where the PDR mechanization block combines the information of the detected step—heading and length—and uses them to compute the current position derived from the previous position. This also imposes the requirement of knowing the initial position and attitude as a starting point for the navigation solution.
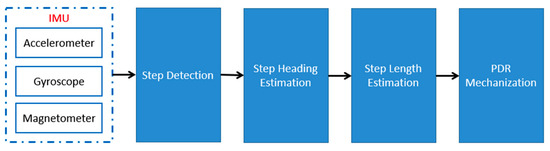
Figure 3.
PDR block diagram.
Enhancements applied to any of the PDR subsystems will enhance the full system performance, hence the following subsections cover the recent advances in each of the PDR subsystems. Since the aim of this article is to develop a PDR for smartphones, novelties in the subsystem that can benefit free-moving PDR systems are presented.
2.1. Step Detection
PDR navigation systems require a robust step detection algorithm. The effect of a step miss or a fake step count can vary on the performance of PDR depending on the methodology of how the step count is being used. For elaboration, consider an algorithm that utilizes a fixed step length for a user. If the step detection algorithm fails to capture a step or is fooled into counting a step, this will lead to an error of a step length in the navigation solution. Now consider a long period of navigation where the algorithm skips multiple steps, this will lead to a high magnitude of positional error.
Step detection algorithms rely on pattern detection in the sensor measurements. These patterns are prominent and distinguishable for strapdown systems that are tethered to a body-segment where the navigation device is in alignment with the motion, such as the foot. Such an approach relishes the benefits of closely capturing the characteristics of GC such as the static state of the foot during the stance phase, making it easier to detect a step.
The use of a smartphone for step detection is more complex than strapdown systems due to the high dynamicity of the smartphone. In the case of smartphones for navigation, there is no detectable zero velocity region for the stance phase of the GC as the human upper body half is in continuous motion unlike the foot. Furthermore, the device might exhibit none-walking related motion from the arm movement causing orientation changes and accelerations that do not represent the walking behavior. Finally, the use case of the phone and its placement will alter the patterns in the acceleration signals, hence it is hard to use a generalized method for step detection that works seamlessly across all possible phone placements and walking behavior.
Step detection for smartphone navigation applications is usually based on peak and valley pair detection. It usually incorporates the use of thresholds to filter out false peaks or employs motion mode and/or smartphone use case classifiers to adaptively tune the parameters for step detection. The thresholds for step detection can be computed and adaptively tuned in many ways. When the accelerations are compensated for gravity, zero-crossing can be a very efficient way to detect steps [28]. Alternatively, peak/valley pairs from accelerations are used based on thresholds that can be obtained through the training/learning process [29] but might suffer from being user-dependent. A more efficient step detection combines a multi-level threshold system that adaptively tunes the peak/valley thresholds in real-time without the need for a training process, and incorporates temporal thresholds [30], pseudo-zero crossing, and peak validation to eliminate fake peaks and valleys [31].
Smartphone use case classifiers—such as holding, swinging, calling, pocket placement, and backpack placement—and motion mode classifiers—such as walking, running, or taking the stairs—are used to either adaptively select the appropriate set of thresholds or extraction of repetitive features for step detection. These classifiers can be implemented in many ways such as but not limited to: artificial neural networks (ANN) [32,33], decision trees (DT) [34], fuzzy logic [35], support vector machines (SVM) [36], SVM and DT fusion [37], multilayer perceptron (MLP) [38], and bidirectional long short-term memory recurrent neural networks (BLSTM-RNN) [39]. Alternative sensors from smartphones have been also utilized for step detection, such as camera sensors which is referred to as visual odometry [40,41,42,43], but they can only work under the constraint of using the device in compassing mode for the camera to capture the foot motion of the user.
2.2. Alignment and Walking Direction Estimation
Although gyroscopes are known for their short-term accuracy and reliability in comparison to accelerometers, the continuous integration of the angular rates over time will cause drift in the estimated attitudes. Errors in attitude angles affect the transformation of accelerations and magnetic measurements to LLF. On one hand, failure to do proper alignment between the navigation device—sensor/body frame (BF)—and LLF results in wrong gravity compensation, causing wrong step length estimation. On the other hand, the wrong leveling of magnetic measurements affects the quality of azimuth estimation and correction leading to the wrong direction of motion estimation. These factors combined result in fast and high drift in position estimation and divergence from the true navigation solution.
For attitude and heading estimation in PDR, the attitude and heading reference system (AHRS) algorithm is employed to enhance the PDR performance. The main concept of an AHRS is to fuse the data from magnetic, angular rate, and gravity (MARG) sensors, where each sensor is used to compensate for the biases introduced by the other sensors. The data from all sensors go through an attitude/orientation filter to get the final estimated attitude angles. Some of the commonly used AHRS systems are the fundamental AHRS [44], Mahony [45], Madgwick [46], and DLR-AHRS [44]. In the case of smartphone navigation, there is another factor which is the changing orientation of the device with respect to the user. This variability raises a new problem, where the heading of the user and the navigation device can be different in many cases. This imposes extra processing to estimate the heading of the pedestrian separately from the azimuth angle.
The attitude mechanization suffers from drift from measurement integration and imposes the need for periodic attitude corrections and realignment between the BF and LLF. The realignment process is usually carried out in two phases, the first is leveling where tilting angles—roll and pitch—are estimated, and then the azimuth is corrected from projected magnetic measurements in the LLF. For the tilt compensation, the accelerometer measurements are used to extract gravity information for the leveling process. One way to estimate the gravity components is through averaging of acceleration measurements over a window of time [47,48,49], where the underlying principle is that accelerations over time will tend to gravity value. The magnetometer is then used for azimuth estimation, and the magnetic measurements are validated to reduce the effect of magnetic interference [46,50,51,52,53]. Fusion of sensor data from accelerometer, gyroscope, and magnetometer is used for In-run calibration to estimate the errors in the measured angular rates [54,55]. Alternative sensors that can derive angular rates can be used for attitude correction such as a camera. Cameras can be used to derive visual angular rates through feature extraction from subsequent frames [56,57] and can be used to provide corrections for the estimated attitudes from the gyroscope and magnetometer. Filters and optimization techniques are used for information fusion from IMU and possible alternative sensors to form an AHRS system. Some of these techniques are but not limited to: complementary filter (CP) [58,59], extended Kalman filter (EKF) [60], unscented Kalman filter (UKF) [21,50], particle filter (PF) [51], quaternion EKF with gradient descent (GD) [61].
After the attitudes representing the misalignment between the BF and LLF are estimated, the heading direction of the user is needed. The main source of direction of motion information is the projected accelerations in the LLF, hence the majority of the research regarding this issue relies on different ways to analyze the projected accelerations. In its simplest form, the heading of a step can be computed from the arctangent of the accumulative accelerations of the step [62], but suffers from the inaccuracies in the accelerations unless filtered properly. Alternatively, some research proposes to find the best linear fit to the data—as a step is assumed to be taken in a straight line direction—through curve fitting methods such as least-squared linear regression [49], and use the arctangent of the fitted line as the heading. In some cases, it is safe to assume a straight line motion of the user, and hence the direction of motion is not changing unless a turn event occurs, and the heading change would be based on the estimated turning event angle [63]. This kind of approach is heuristic and not optimal, while it can work efficiently in corridors, it will not be able to track slight changes in heading in open areas and spaces. Principal component analysis (PCA) is another alternative that has been utilized in many studies, where PCA is applied to the horizontal plane accelerations of the LLF to extract the 1st and 2nd principal components of the data. The 1st component is used as the heading direction [37,64,65,66,67,68,69] but suffers from forward/backward directional ambiguity and requires extra processing to distinguish the forward walking direction.
Alternative sensors can be used for the heading estimation such as the gyroscope, where it exhibits relatable measurements to the direction of motion as well, especially when placed in pocket or in swinging use case [70]. In a similar manner, the magnetometer measurements can be used to detect the heading changes but not as an absolute value as the magnetic measurements provide an absolute reference to the surrounding magnetic field [71]. A fusion of both sensors can be used to limit the drift induced from the gyroscope measurement integration while avoiding the errors in heading that can be induced by magnetic disturbances [72,73].
The lack of absolute attitude correction techniques without imposing constraints or relying on alternative techniques that require infrastructure knowledge makes attitude and heading estimation an open challenge for INS. In the case of smartphone-based PDR systems, the free-motion of the device and its changing attitude with respect to the user makes it even more challenging. Frequent attitude and heading corrections are needed to increase the reliability of smartphone-based PDR systems for a longer runtime until a coordinate update (CUPT) is available. Wi-Fi fingerprinting and magnetic-map matching (MM) have been utilized to aid with the positional correction [74,75,76,77], but require regular surveying and maintenance. Furthermore, they suffer from RF interference and magnetic disturbance that occur regularly indoors due to the environment variability.
2.3. Step-Length Estimation
The final subsystem of a PDR is the step length estimation. There are mainly two approaches regarding this point: The first is using an average step length per user, and the second is to estimate the step length on the go. Studies from [24,78] show a relationship between the pedestrian physical features, frequency of steps, and their step length. It is found that the step length is directly proportional to the step frequency and with the user’s leg length and height. Other studies include the age and gender of the pedestrian as more factors for computing the step length.
In its simplest form, step length can be estimated by applying position mechanization for the in-step accelerations [79], but it requires means of bias and drift correction. In the approach of using a foot-mounted IMU this is feasible as a ZUPT would help estimate the errors in velocity and compensate for the position error. In the case of a handheld device, applying ZUPT is not feasible as the device does not experience a zero-velocity period.
Various step length models have been proposed for step length estimation and they rely on the relation between the step length and step characteristics of the user. Acceleration-based step length estimation techniques refrain from the integration of the accelerations as it imposes an error that is large relative to the step size. Instead, they employ models that utilize some of the step characteristics such as average acceleration in the step, maximum and minimum accelerations, and include a user-specific parameter that is usually based on the user’s physical features [80,81,82]. Another famous approach is the frequency-based step length estimation model, where the step is estimated as a function of the frequency of steps taken. Many models exist that use a different underlying relationship between the step frequency and the step length, whereas in some cases the relation is assumed to be linear [83,84], and user information such as height can be used to make it more adaptive [85]. In other cases, the relation is assumed to be quadratic [86]. A more informed model can use the step frequency in combination with the acceleration variances, or a combination of average, maximum, and minimum accelerations, and user-specific information such as leg length [87,88]. In all cases, these methods require user-specific information to be able to estimate the step and would usually perform well in strapdown mode.
More complex models that use machine learning and avoid the use of predetermined user-specific parameters have been tested, where the step length is computed based on artificial intelligence machine learning algorithms, feature extraction, classifiers, and alternative sensors. Some of the approaches are based on—but not limited to—long short-term memory (LSTM) [89], autoencoders [90], back propagation neural network (BP-NN) [91], DT- and ANN-based classification [92], adaptive step length parameters [93], adaptive parameters based on classifiers [94,95], and optical flow from camera [96].
Different studies for step length estimation have been carried out that mainly rely on physical features of the user such as leg length or height, or factors related to their walking behavior such as their step frequency, acceleration variance, average walking velocity, and the sway angles. The problem when using any of these models is that it needs to be trained individually per each user to obtain the user-specific estimator parameters. For models relying on physical features, the more information provided about the pedestrian the more accurate they could get. On the other hand, the use of step frequency and variance in acceleration measurements provide very promising results, but they also require a lot of preprocessing and filtering in order to obtain the signal representing only the walking motion of the pedestrian.
Usual PDR approaches suffer from the problem of restricting the user activity where there is an assumption made about the motion mode and/or use case of the navigation device. Recent state-of-the-art approaches address this issue through the use of classifiers and detectors to identify the placement of the navigation device, and motion mode of the user to enhance the navigation solution. The problem with using the classifier approach is the lack of uniform standards for the classifier categories and classes, while also requiring a vast database for training and the need for user dependant parameters in some cases. Furthermore, the addition of the classification stage imposes a new challenge for when the classification fails and/or misclassification takes place.
While there are many attitude and heading estimation approaches, the correction of the tilt angles without imposing motion restriction is still an issue. This issue propagates to the azimuth correction aided by magnetometers due to the requirement of leveling magnetic measurements with accurate tilt angle estimates. Furthermore, errors and drift in the attitude angles result in poor step heading estimation.
All these factors combined result in fast and high drift from the true trajectory, hence the need for frequent aiding by other technologies and techniques such as MM, Wi-Fi fingerprinting, pseudo indoor GNSS systems, and more. The problem with these aiding techniques is that they might rely on phenomena that are changing over time—such as magnetic mapping—and hence would require regular surveying and system maintenance and calibration. Although PDR require aiding by other technologies, it is appealing to improve the solution of PDR as a standalone system in the case of limited and infrequent corrections to make them reliable for an extended runtime. Enhancing PDR performance results in less complex and costly aiding systems requirements.
3. SBAUPT-Based Pedestrian Dead Reckoning (S-PDR)
This study presents S-PDR, an enhanced PDR system for smartphones that exploits certain motion behaviors that occur frequently for most steps taken. The flowchart of S-PDR is shown in Figure 4.
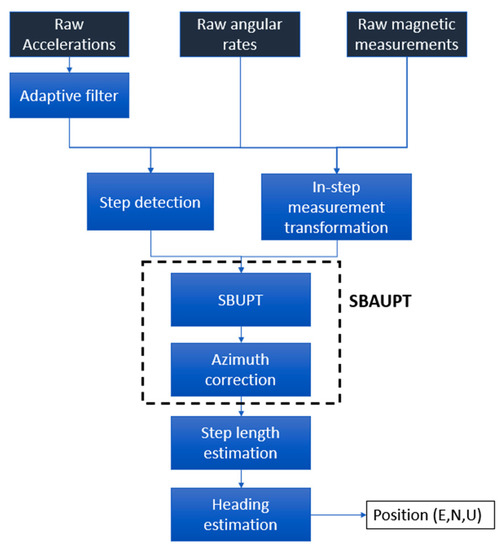
Figure 4.
S-PDR flowchart.
The developed S-PDR utilizes a step detection technique that was developed by the authors in [97] which avoids the use of classifiers for tuning the step detection parameters as it can cause issues when misclassifications occur. To improve the performance of a PDR system, S-PDR uses a recently developed attitude correction technique developed by the authors in [27] that can provide corrections frequently to prevent the attitudes from drifting and maintain a good estimate of the relation between the BF and LLF. Finally, a novel heading estimation technique is developed that uses a complementary filter with adaptive gain mapping to compute the heading from two estimates. The first heading estimate is computed from statistical analysis of the accelerations recorded in the step window, and the second is computed by applying PCA to a reduced acceleration set. The reduced set is obtained through outlier detection and eliminates accelerations that have low magnitude and are usually not descriptive of the direction of motion of the platform.
The following subsections present in-depth information and description of the methods used in each of the developed subsystems for S-PDR.
3.1. Step Detection
To enhance the performance of a PDR system, a robust step detection technique is needed. The step detection technique should be able to detect steps at varying motion speeds and under different smartphone use cases. Furthermore, it should have the ability to verify steps, whether making sure that a detected step is an actual step and not a similar pattern mistaken for a step—false positive—or a step went undetected—false negative. The developed algorithm [97] proposed an adaptive cut-off frequency filtering of the sensor measurements to adaptively remove motion noise, then uses peak and valley pair detection with temporal and spatial filtering for step detection, fusion of alternative sensors for enhanced step detection, and finally a step verification module. The following subsections briefly describe the novelties.
3.1.1. Adaptive Cut-Off Frequency Filter
The acceleration measurements represent the device motion. The measurements are poised with high noise introduced by the sensor and the motion noise of the user—for example shaking hands. The developed step detection algorithm utilizes an adaptive cut-off frequency filter, where the cut-off frequency is frequently updated based on the estimated speed of motion.
3.1.2. Temporal Filtering
Although filtering the signal removes most of the unwanted signal fluctuation interfering with the step detection, there is leftover motion noise that can affect the detection accuracy. To enhance the peak/valley extraction for step detection, temporal filtering is used to avoid unwanted peak/valley detections. The temporal filtering is carried out by introducing candidate and rejection regions. The candidate regions represent the regions where a peak/valley exists and only one peak/valley is accepted. The rejection region is the region where no peak/valley should exist and if any is detected, it is discarded.
3.1.3. Sensor Fusion
In certain types of motion such as phone swinging, other sensors exhibit motion patterns that can be useful for step detection. In the developed technique, a repetitiveness detector is employed to detect such useful information in the gyroscope and magnetometer measurements. The detector identifies the dominant axis of motion for the alternative sensors, and the signals from these sensors are used for peak/valley verification.
3.1.4. Step Validation
In some cases, signal patterns that can be mistaken for a step occur—referred to as a false positive. To verify the detected step, the candidate step must have a displacement based on the recorded accelerations. Furthermore, a detector can fail to detect a step—referred to a false negative—if the peak/valley pair detection fails. Temporal and displacement-based verification is used to account for missed steps.
3.2. Azimuth Step-Based Attitude Update (SBAUPT)
In most cases, the attitude estimation in PDR is based on the attitude mechanization from the DR technique shown in Figure 5. Unlike accelerations, the angular rates do not benefit from the cyclic repetitiveness of GC, but rather use accelerations during static periods to reset the tilt angles estimate. SBAUPT is an attitude correction technique that provides corrections over two phases. The first phase—step-based update SBUPT [98]—is the tilt angles correction without imposing motion constraints such as static periods of operation, but rather exploiting motion behaviors that occur frequently during pedestrian walking. The second phase is providing the azimuth correction from fusion of gyroscope-derived azimuth with magnetometer-based azimuth when the magnetometer is deemed accurate at sensing the earth’s magnetic field [27]. The magnetometer measurement quality is assessed on a two-level thresholding decision process to decide when to apply the correction. The following subsections briefly describe the two phases of SBAUPT.
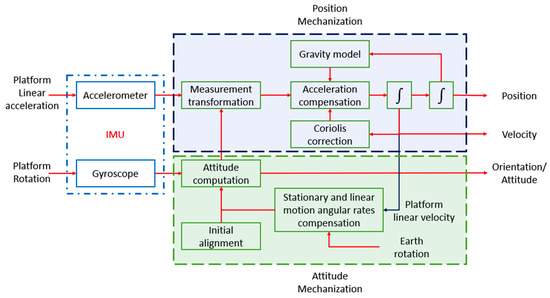
Figure 5.
Block diagram of Dead Reckoning (DR).
3.2.1. Step-Based Update (SBUPT)
Tilt angles—roll and pitch—are computed based on gravity components. A common constraint to apply tilt angle corrections is to use static periods where the accelerations are only corresponding to gravity components. When using smartphones for navigation, there are usually no static periods and the accelerometer is measuring the net force of gravity and linear acceleration of the device.
SBUPT [98] exploits periods of motion with nearly steady walking speed, where the accelerations average in a step will tend to gravity and can be used to estimate the tilt angles. To estimate the roll and pitch angles from the step-window accelerations, they need to be in the same reference frame. Usual methods use transformation to LLF to project all accelerations into the same reference frame, but using this approach introduces historically accumulated errors into the projection process. SBUPT overcomes this problem by defining a step frame (SF)—which is the final BF in the step-window. SF is an arbitrary relative frame with unknown attitudes but has known relative attitude to other BF instances within the step, and uses the in-step gyroscope measurements to transform all in-step accelerations to the same reference frame. A least squares estimator is developed and used to refine the gravity estimates and reduce the effect of leftover linear acceleration components. This process eliminates accumulation of errors as the process resets with each detected step and does not rely on absolute attitude values estimated. This correction process can be applied frequently on a step basis if the step average passes the threshold condition indicating a near-constant motion speed. Tracking the full attitude states during the step is obtained by the attitude mechanization process.
3.2.2. Azimuth Fusion
Azimuth is estimated from the attitude mechanization and suffers from drifting due to error accumulation. Magnetometers can be used for azimuth correction by utilizing the earth magnetic field information, but there must be no magnetic interference and the roll and pitch estimates must be accurate for this correction process to be successful. The developed azimuth correction technique [27] starts by evaluating the integrity of magnetic measurements using a two-level threshold pass/fail test. If the magnetic measurements pass the test, an adaptive gain mapping procedure is applied to be used for the complementary filter fusion of the magnetometer-based and the gyroscope-derived azimuth.
3.3. Heading Estimation
Many methods assume that the pedestrian is using the smartphone in compassing mode—phone screen facing up and y-axis of the phone pointing in the direction of motion—while using navigation applications, hence the pedestrian and BF main axis of motion—forward motion—are aligned and both frames have the same azimuth. Under these assumptions, the pedestrian heading is considered to be the azimuth angle of the BF alignment to the LLF. This assumption fails to track the pedestrian heading when the smartphone is reoriented in any way so that the y-axis is no longer aligned with the user’s motion direction. In this case, the PDR would mistakenly believe that the user changed direction while he did not.
To overcome this problem the pedestrian heading should be estimated separately from the smartphone orientation. Once the orientation of the BF is known with respect to LLF, the accelerations are transformed to LLF and can be used to estimate the heading of the pedestrian. The heading is derived from the components of the linear acceleration vectors of the user in LLF based on Equation (1). The horizontal component of the user’s linear acceleration vector is decomposed into the horizontal plane of LLF over the north and east axis as shown in Figure 6.
where, is the heading angle computed from the north direction, and are the linear acceleration components in east and north directions, respectively. The formulation previously presented can estimate the heading of a single acceleration sample. During a step, a sequence of accelerations is recorded corresponding to the direction of motion. One would think that all the accelerations during the step would be in the same direction but that is not the case. During a step, the user undergoes an accelerating stage followed by a decelerating stage, with a fluctuating transition that ends up generating accelerations in a variety of directions that might not be descriptive of the direction of motion. In addition to that, the accelerations have a varying vertical component due to the inverse pendulum motion of the user and the navigation device instability. This behavior can be seen in Figure 7.
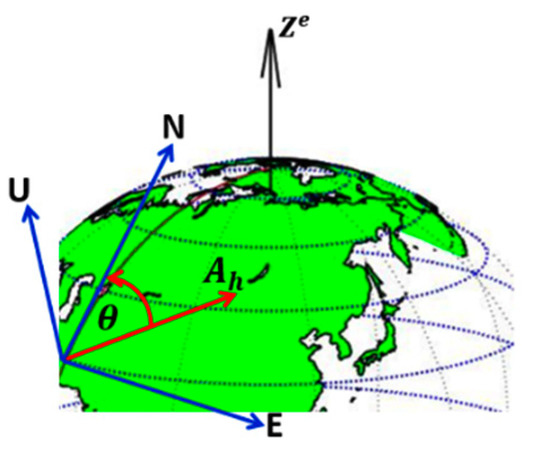
Figure 6.
Acceleration−based heading in LLF.
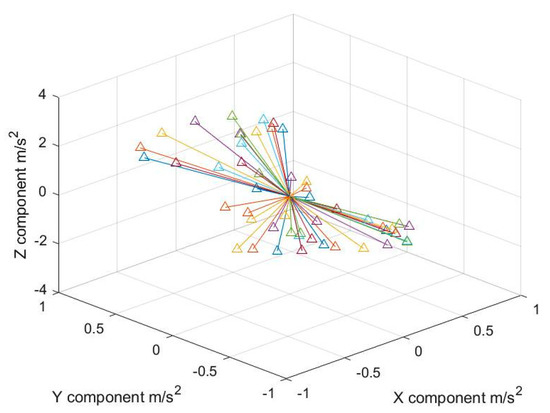
Figure 7.
In−step linear accelerations vectors direction.
The resulting headings from the horizontal components of the linear acceleration in the LLF navigation frame suffer from high fluctuations at low accelerations and reverse by approximately 180 degrees during the deceleration stage of the step. This is further illustrated in Figure 8. It is clear at that point that no single instance of the accelerations would be sufficient to determine the heading of the step. Common methods to address this issue is to use the average of the step accelerations to derive the heading or using PCA to find the dominant direction of motion. When using the accelerations average, the heading angle suffers from high errors due to the low linear acceleration average value that might approach zero. On the other hand, when using PCA the resulting direction suffers from inaccuracy due to the outlier accelerations with low magnitude and suffers from 180 degrees ambiguity, meaning that we can not distinguish forward from backward motion. Hence, an alternative solution to estimating the heading is needed.
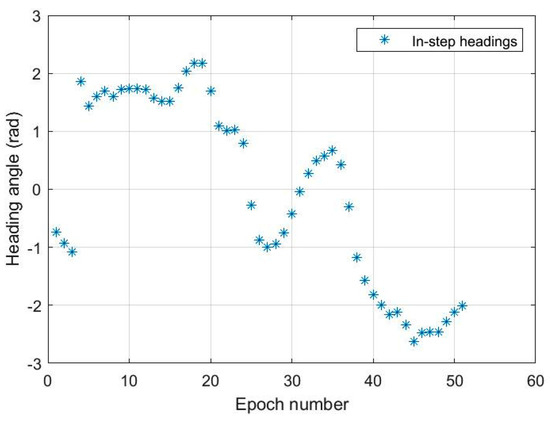
Figure 8.
In−step headings from horizontal linear accelerations.
3.3.1. Outlier Rejection and Statistical Heading Estimation
To enhance the estimation of the heading, outlier measurements in the step window need to be filtered out. The walking behavior of pedestrians includes a swaying motion as the user switches between right and left steps, this is part of the balancing process to maintain the center of gravity of the body. This motion can cause low acceleration periods of the step to deviate far from the true heading of the step and hence are considered outliers. The heading estimation is hence mainly targeting the high acceleration/deceleration stages of the step.
As per previous elaborations, the usual step is similar to a sinusoidal wave including a peak and valley pair that are both positive values due to the shift by the gravity vector. When the signals are leveled and compensated for gravity, the east and north accelerations components are nearly zero mean sinusoidal waves, and when the magnitude of the total horizontal acceleration is computed it results in inverting the valley part of the signal to a peak. Hence, the selection of the accelerations is based on a window of measurements from the two peak values in the horizontal accelerations’ components. The window around the first peak is representative of the forward direction of motion, while the window around the second peak is representative of the reverse direction of motion deceleration section of the step. The region of interest in the acceleration window is shown in Figure 9 based on magnitude filtering around the peak values, and the corresponding acceleration vectors in the east/north plane are shown in Figure 10. Finally, the in-step headings with encircled headings of interest corresponding to the selected accelerations from the measurements window are shown in Figure 11.
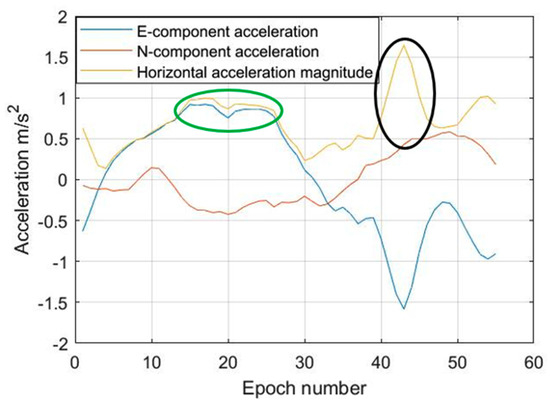
Figure 9.
In−step accelerations regions of interest.
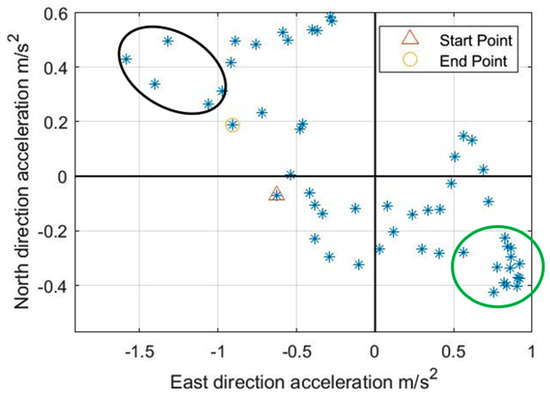
Figure 10.
In−step east vs. north accelerations scatter.
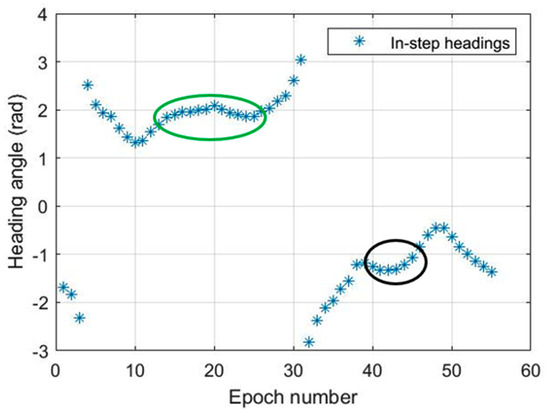
Figure 11.
In−step headings of interest.
The dominant heading angle can be verified by further analysis of the in-step headings using a histogram, where the expected outcome is to have a peak bin in the histogram representing the direction of motion, and another peak bin that is 180 degrees (π) away from the first peak representing the direction of deceleration. To resolve the ambiguity of which of the two bins represent the forward direction, the accelerations in each bin are matched back to the original accelerations signals and the bin containing the acceleration samples from the first half of the step—which is the accelerating phase of the step in the direction of motion—is the bin representing the forward motion. The distribution of the previously presented headings is illustrated in Figure 12, where there is a dominant bin at heading 2 radians and another at nearly −1.4 radians. In some cases, the true heading will be borderline between two bins and the recorded headings will be split over two bins, hence we expand the selection to take into account the direct neighbor to the left or right based on a selection criterion.
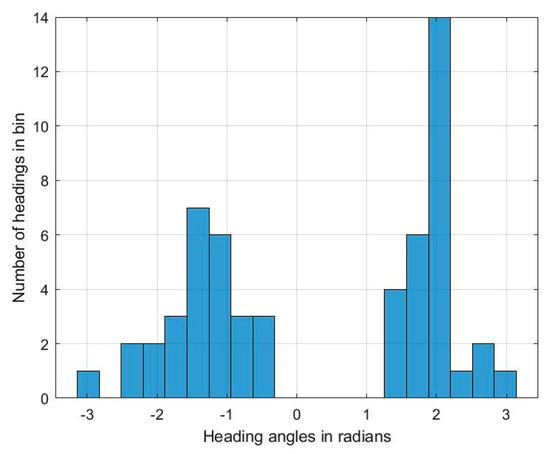
Figure 12.
In−step heading distribution histogram.
The histogram distribution is constructed with bins of width 0.1π radians resulting in 20 bins. After distinguishing the first dominant bin, the direct neighbors of the bin are examined to decide if one of them will be included in the heading computation. The right and left neighbors are inspected, and the neighbor with the greater number of measurements per bin is chosen as a candidate bin to be merged with the dominant bin. If the candidate bin has a number of measurements that is higher than a certain threshold, it will be merged with the dominant bin.
Once the dominant bin and possible direct neighbor is/are distinguished, the remaining bins in the forward phase are discarded and the search for the second dominant bin starts. It is expected that the second dominant bin is nearly π radians away from the first dominant bin as shown in the polar plot of the accelerations presented in Figure 13, and the polar histogram presented in Figure 14. The same process for selecting neighbor candidate bin is applied. The selection criterion is shown in Equations (2)–(4). Where is the dominant bin, and is the candidate neighboring bin.
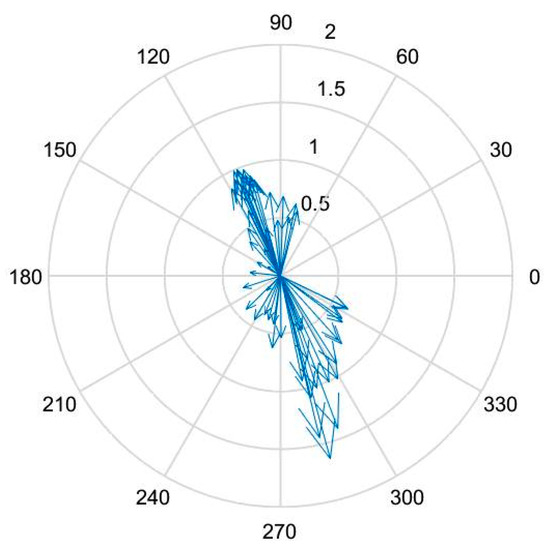
Figure 13.
Accelerations in polar axes “compass”.
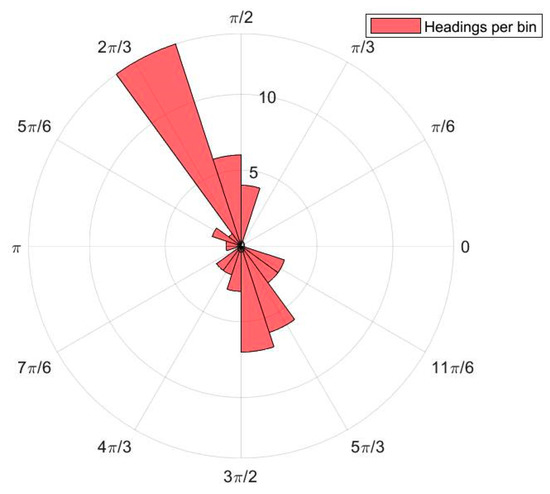
Figure 14.
Polar histogram of headings.
It is important to view the histogram in polar coordinates as it shows the continuity of the bins, where the first bin and last bin of the histogram are neighboring bins and can be merged. For example, if the direction of motion is in the north direction, the accelerating segment of the step will result in a peak bin at zero radians, and the decelerating segment will create an expected peak at negative/positive π, which are the first and last bins in the histogram, but from the polar histogram it can be seen that they are neighboring bins and can be merged together if needed.
3.3.2. Reduced-Set Acceleration PCA
With the elimination of the outlier accelerations, the remaining reduced set of accelerations from the acceleration window are more precise in describing the direction of motion. Alternatively to averaging the heading angles from the reduced-set accelerations, PCA can be applied to the reduced-set to obtain the main direction of motion. As discussed earlier, the principal components returned from the PCA suffer from directional ambiguity as they represent the correlation of the data. The effect of the outlier accelerations is evident in Figure 15, where the first principal component from the reduced set is less affected by the outliers in comparison the first principal component based on the full accelerations window.
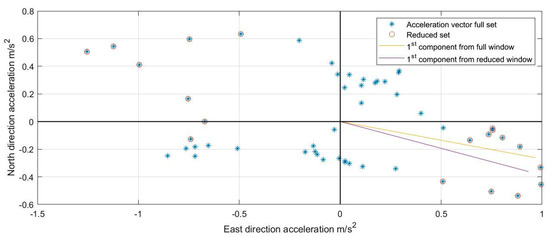
Figure 15.
Principal Component Analysis (PCA) for full step window vs. reduced step window.
The heading derived from the PCA is computed based on the components of the unity vector representing the correlation of the data as shown in Equation (5) but is also representative of the forward or backward direction of motion. Hence, two candidate headings are derived from the PCA that are π radians apart, where the second candidate is computed as in Equation (6), and the candidate coinciding with heading from the histogram matching process is chosen to be the PCA derived heading for forward motion as in Equation (7).
where is the 1st principal component in east direction, is the 1st principal component in North direction, and are the candidate headings from PCA, is the PCA heading, the min function returns the candidate angle with minimum delta from which is the heading from the histogram, and RoundToPi is a function that rounds the angles to a [] range.
Since there are two heading estimates—the first being the analytical heading from the histogram and the second being the reduced-set PCA-based heading, it is desirable to apply a fusion phase to combine the information from both estimates. The fusion is done by means of a complementary filter with an adaptive gain based on the covariances of each of the derived angles. First, the heading derived from the histogram is computed as the average of all the headings in the bins representing the forward direction of motion computed as in Equation (8), and the variance of the headings in the bins are computed based on Equation (9). For the PCA-based heading, the variance of the data points from the principal component is computed to represent how good the fit is, which is based on the residuals () that are shown in Figure 16 and computed by Equation (10). The weights used for the filter are then computed as the ratio of each variance to the total variance of both estimates as shown in Equation (11). The weights are cross corelated, so the weight computed from the PCA is used for the histogram-derived angles and vice versa. As one estimate has a higher variance and a consequently higher ratio, the higher weight should be given to the other estimate. The fusion angle is computed based on Equation (12).
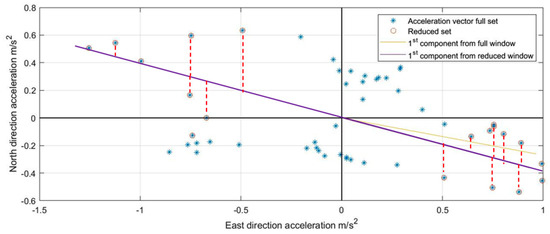
Figure 16.
Samples of residuals for the PCA.
The block diagram for the heading estimation algorithm is shown in Figure 17, the algorithm for heading estimation is shown in Algorithm 1, and the used notations are shown in Table 1.
| Algorithm 1. Heading Estimation () |
------ Statistical heading extraction -------
|
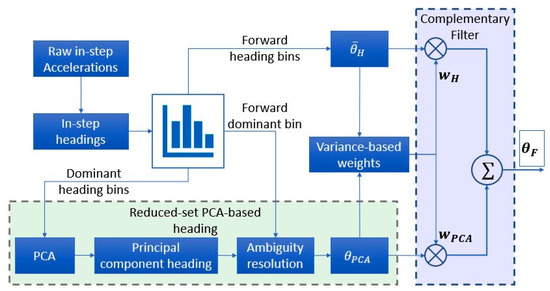
Figure 17.
Heading estimation block diagram.

Table 1.
List of notations used in the heading estimation algorithm.
3.4. Step Length Estimation
For the step length estimation the model presented in [93] which is based on the Weinberg [81] model was adopted which is shown in Equation (13). A study of different step length estimation models presented in [99] shows that the Weinberg model with personalized set of constants—user and test defined parameters—outperforms other models. The Weinberg model utilizes the maximum and minimum accelerations in the step to estimate the step length based on a conversion unit (K). The method introduced in [93] utilizes a modified Weinberg model where the conversion unit is adaptive to increase the accuracy of the estimation. The proposed adaptive conversion unit is based on a second-order polynomial of the estimated step velocity.
where, is the step length, is the adaptive conversion unit, is the maximum vertical acceleration in the step, and is the minimum vertical acceleration in the step. The trajectory is then updated using the estimated heading angle and the step length, where the current position is the previous position plus the decomposed step length based on the heading as shown in Equations (14) and (15).
4. Experimental Setup
Testing was carried out using a Samsung S8 smartphone, while reference inertial measurements and solution was provided by the Xsens MTi G-710 which is considered to be a high-grade MEMS sensor with better performance than the MEMS sensor equipped in a smartphone. The Xsens Mti G-710 is reported to have a 10°/h gyro bias stability, roll and pitch accuracy of 0.2° in static mode and 0.3° in dynamic mode, and azimuth of accuracy 0.8° when no magnetic distortion exist [100]. As a reference, the Xsens has an on-board processing option that provides a full navigation solution. The on-board processing provides full positional and attitude estimates that were used to recreate a PDR-based solution in comparison to the solution from S-PDR.
The setup and device reference frames are presented in Figure 18. Magnetometer calibration to compensate for the cross magnetic field distortion of both devices was applied for each of the tests described below, and initial alignment between the devices was carried out to accurately project the solution and measurements of both devices to the same frame. First, each device was calibrated using the six-position static test for accelerometer calibration and using a precision rate table for gyroscope calibration. Once the smartphone sensors and Xsens sensor have been calibrated separately, the devices were attached as shown in Figure 18. For each of the tests described below, a 2-min spherical data window is collected before the test starts and is used for the magnetometer ellipsoid fitting calibration to compensate for the magnetic interference between the two devices. To find the misalignment between the two devices, static data for 20 min were collected from the devices while attached. The data were compensated for biases and scale factors derived from the calibration procedures and used to find the transformation matrix from each of the two devices to LLF. Note that the static data is collected every time the devices are detached and reattached to compensate for any alignment changes. Finally, the misalignment matrix between the two devices was derived by multiplying the two transformation matrices as shown in Equation (16). Where is the alignment matrix from LLF to the Xsens frame, and is the alignment matrix from LLF to the Samsung S8 phone frame, and is the resulting alignment matrix between the two devices.
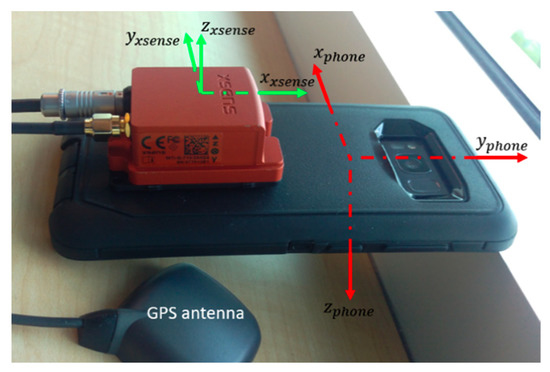
Figure 18.
Testing device configuration.
Two tests were designed with preplanned trajectories to evaluate the performance of S-PDR under different conditions. The tests were designed to reflect the cases where GNSS is degraded or even denied such as indoor, or near buildings with high reflective surface structures. Sample set 1 takes place indoor on the second floor of Engineering G building (ENG) of University of Calgary, with the purpose of testing the effects of magnetic interference. The test trajectory is shown in Figure 19. Sample set 2 takes place outdoors beside a steel building structure between CCIT, Engineering D (END), and Engineering E (ENE) buildings on the University of Calgary campus, where the purpose is to test the feasibility of using S-PDR as an alternative to GNSS when the satellite signals will have a high error due to multipath and refraction while being used in a non-stable magnetic field. The trajectory is shown in Figure 20.
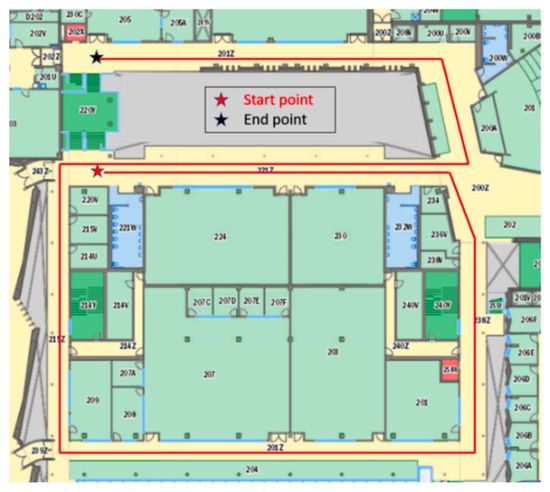
Figure 19.
Engineering G (ENG) building trajectory.
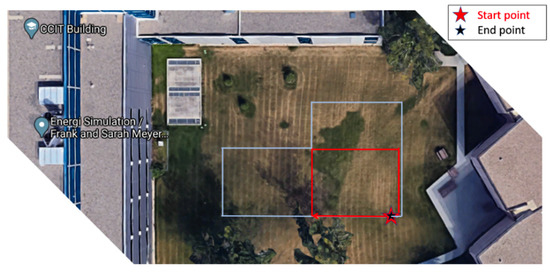
Figure 20.
Outdoor trajectory.
5. Results and Discussion
In this section, the S-PDR system will be evaluated by comparing the final trajectory tracking of the system to the true pre-determined trajectory and compared to a PDR solution based on the Xsens on-board linear accelerations and attitude estimates. The PDR implementation used for the Xsens data is based on [37]. This PDR implementation was selected to compare to for its use of classifiers, integration of magnetometer in attitude and heading estimation, and the lack of aiding from alternative technologies. The reported results in [37] show that the implemented classifier has high accuracy in comparison to different classification approaches making it appealing to compare to as a representation of classifier-based PDR approaches. Additionally, the developed PDR uses the accelerations and magnetometer measurements periodically to apply the attitude estimation but lacks magnetic interference detection and rejection, and then apply a PCA-based approach for the heading estimation. Hence, the comparison to this PDR can highlight the performance difference between the different attitude and PCA implementations.
5.1. Indoor Test
The trajectory for this test set was planned indoor on the second floor of the Engineering ENG building at the University of Calgary. The trajectory was planned to make a full loop around a block of classes to test the Azimuth estimation as the corridors are perpendicular which would make azimuth errors clear. The trajectory passes by multiple metal structures and has high magnetic interference.
A sample of the results from S-PDR and Xsens for the planned trajectory is shown in Figure 21. The trajectory is approximately 293 m long and on average took 420 steps to cover with an average step length of approximately 0.7 m for regular walking, and 370 steps with an average step length of approximately 0.8 for fast walking. As shown in the figure, the S-PDR provides a good solution in comparison to the trajectory constructed using the attitudes provided by the Xsens. The trajectory constructed from the Xsens data uses its on-board computed attitudes to transform the on-board gravity compensated linear accelerations to LLF, which is then used for step detection, step heading estimation using PCA, and step length estimation to compute a PDR trajectory solution based on [37]. The Xsens attitudes suffered from high and quick drift because of magnetic interference from the surrounding environment, which leads to higher positional error.
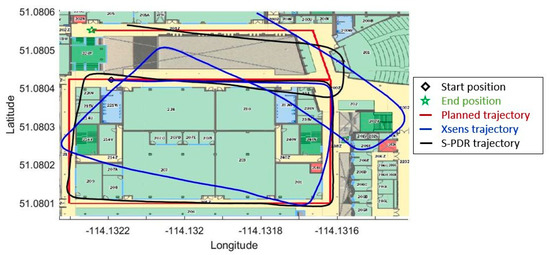
Figure 21.
ENG building reference trajectory and reconstructed trajectory using S-PDR and Xsens.
The results from the shown indoor test sample show a final positional error of 6.3 m for the S-PDR, while the Xsens trajectory had a positional error of 34.8 m. The test was carried out 20 times using the Samsung S8 phone with the Xsens attached to its back as per the configuration shown in Figure 18. The results for the 20 tests are shown in Table 2. Where the final positional error is the difference between the true position of the end point of the trajectory and the estimated end position. The average position error across the trajectory is the average error at different stages of the trajectory based on land markers and targets with known locations across the trajectory.
Table 2.
Test results for indoor ENG building test.
The table shows that S-PDR outperforms the Xsens PDR solution. For the sake of comparison, the trajectories recreated using S-PDR and the Xsens data used the same estimated step length, this way the final error difference between the two systems will be representative of the errors in attitude and headings combined. The results show that the Xsens solution has high variability which is a result of the magnetic interference and instability. The tests were carried out on different days and at different times of the day so that the magnetic print of the place would change, and as shown it highly affects the results of the Xsens.
On the other hand, the results for the S-PDR are consistent with low variation under the different surrounding environmental conditions and changes. The average final position error of the S-PDR was found to be much lower and more consistent than the Xsens, and the average position error through trajectory was also much lower than the Xsens as the S-PDR was able to track the trajectory with lower error for most of the trajectory. The analysis of the results presented in Table 2 is shown as boxplots in Figure 22, where each box represents the one sigma confidence interval, the red line inside the box represents the median value, the upper and lower limits represent the maximum and minimum values respectively, and the plus sign represents outliers in the data.
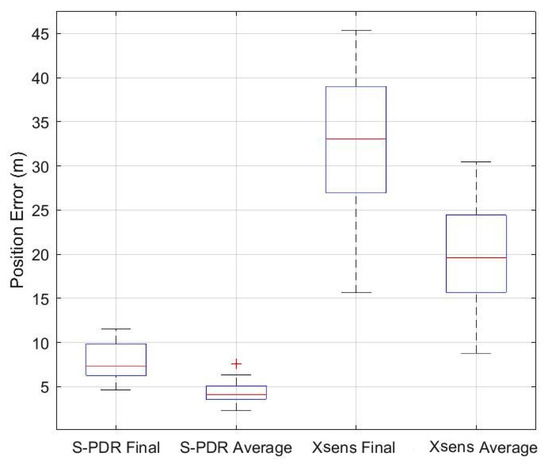
Figure 22.
Boxplot of the errors of S-PDR vs. Xsens for indoor test.
For the case of S-PDR all the tests had a final positional error ranging between 4.63 and 11.51 m, with one sigma confidence interval in the 5.9 to 10.02 m of error range. The average duration of this test was 3 min with an average trajectory length of 290 m, hence the relative final position error is found to be ranging between 1.5% to 3.5% of the trajectory.
5.2. Outdoor Test
The trajectory for this test was planned outdoor over a small, squared park found between the CCIT, END, and ENG buildings at the University of Calgary. The small park is surrounded by metal and glass structures. The glass structures contribute heavily to errors in GNSS navigation systems and would benefit from aiding by an alternative system, while the metal structures make relying on the magnetometer solely for estimating the azimuth nearly impossible due to high magnetic interference. A sample of the results from S-PDR and Xsens for the planned trajectory is shown in Figure 23. The trajectory is approximately 235 m long and on average took 340 steps to cover with an average step length of approximately 0.7 m for regular walking, and 295 steps with an average step length of approximately 0.8 for fast walking.
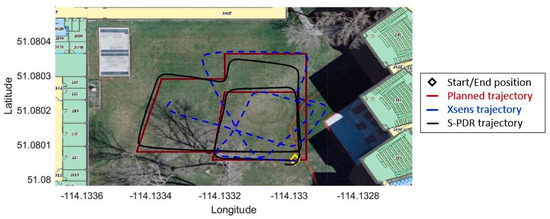
Figure 23.
Outdoor reference trajectory and reconstructed trajectory using S-PDR and Xsens.
The results from the shown outdoor test sample show a final positional error of 2.5 m for the S-PDR, while the Xsens reconstructed trajectory had a positional error of 38.32 m. The test was carried out 20 times using the same configuration as that of the indoor test and the results are shown in Table 3.
Table 3.
Test results for outdoor loop test.
Similar to the indoor test, the Xsens suffered from quick and high drift in attitudes that resulted in a high positional error. In this scenario, the magnetic interference was higher due to the large buildings metal structures surrounding the area where the tests were carried out. The attitudes derived from the Xsens on-board sensor fusion algorithm suffered from high drift resulting in poor tracking. On the other hand, the results show that S-PDR was once more consistent even with the magnetic interference due to the rejection criteria and the adaptive fusion technique it utilizes for azimuth estimation. The analysis of the results presented in Table 3 is shown as boxplots in Figure 24.
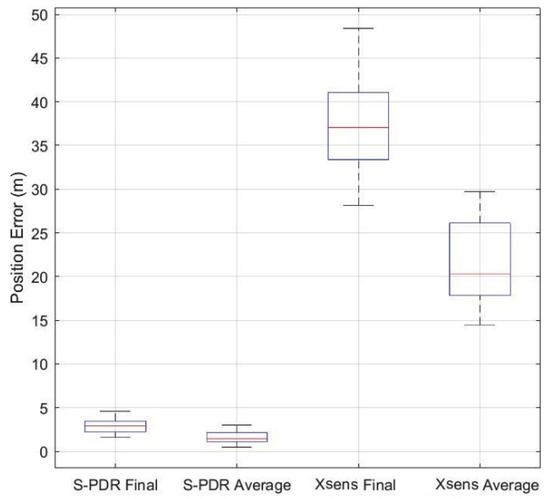
Figure 24.
Boxplot of the errors of S-PDR vs. Xsens for outdoor test.
For the case of S-PDR all the tests had a final positional error ranging between 1.59 and 4.58 m, with one sigma confidence interval in the 2.1 to 3.86 m of error range. The average duration of this test was 2 min with an average trajectory length of 230 m, hence the relative final position error is found to be ranging between 0.5% to 2.17% of the trajectory. Although the errors are lower than the indoor case, they are consistent as this trajectory was shorter and the errors increase at a higher rate as the duration of the navigation is prolonged. The findings of this test are crucial for the case of urban canyons where GNSS signals are hindered, and AHRS-based tracking suffers from magnetic interference and results in a high positional error. The S-PDR system developed was able to track the position while reducing the attitude drift and positional error, and being resistive to magnetic interference.
6. Conclusions
PDR systems suffer from the inherent drift in INS-based navigation making them reliable for a limited time and requiring aid by other technologies to correct and compensate for the errors. The aim of this article is to present a novel and enhanced PDR system that can provide a positional solution with acceptable accuracy for a prolonged operation time. By enhancing the performance of PDR, the complexity of aiding and frequency by which it is needed can be reduced. The developed system under the name S-PDR utilizes: a robust step detection technique invariant to motion mode and smartphone use case that is capable of detecting steps with high accuracy, account for misdetection, and can validate steps; an attitude correction method that can be applied frequently without imposing usage or motion constraints, that helps eliminate drift in attitude angles by exploiting user motion patterns and behavior; an enhanced PCA-based heading estimation that combines statistical analysis information from the in-step accelerations window, and accelerations outlier rejection to improve the accelerations correlation representative of motion direction. Test results show that S-PDR can successfully track the position changes of the pedestrian with a low final positional error usually below 6 m after 3 min of operation and meter level average positional error through most of the trajectory. This would have not been feasible if not for an accurate step detection, low error attitudes that do not drift over time, and accurate heading estimation that can successfully track the direction of motion of the user. This positional accuracy makes S-PDR a viable short-term solution for positioning and localization indoors and can be used for aiding GNSS in urban canyons where GNSS signals are degraded or blocked. The increased reliability of the solution impacts the complexity of aiding requirements such as Wi-Fi fingerprinting and magnetic map matching where: lower data resolution is needed—fewer data points to be surveyed—which decreases memory requirements and surveying time, less frequent corrections are needed and improves real-time processing.
Author Contributions
M.K. developed the methodology, designed the experiments, analyzed the data, and wrote the paper; N.E.-S. reviewed the methodology, verified the results, and revised the paper. All authors have read and agreed to the published version of the manuscript.
Funding
This research was funded by Nasser El-Sheimy from NSERC and Canada Research Chairs programs.
Institutional Review Board Statement
Not applicable.
Informed Consent Statement
Not applicable.
Data Availability Statement
Data will be shared upon request.
Acknowledgments
This research is under the supervision, support and funding of Nasser El-Sheimy. The authors thank the handling editor and anonymous reviewers for providing constructive remarks.
Conflicts of Interest
The authors declare no conflict of interest.
References
- Bräunl, T. Localization and Navigation. In Embedded Robotics; Springer: Heidelberg, Germany, 2008; pp. 241–269. [Google Scholar]
- Noureldin, A.; Karamat, T.B.; Georgy, J. Fundamentals of Inertial Navigation, Satellite-Based Positioning and Their Integration; Springer: Berlin, Germany, 2013; ISBN 9783642447907. [Google Scholar]
- Misra, P.; Enge, P. Global Positioning Systems: Signals, Measurements, and Performance, 2nd ed.; Ganga-Jamuna: Lincoln, MA, USA, 2010; ISBN 0970954417. [Google Scholar]
- Grewal, M.S.; Weill, L.R.; Lawrence, R.; Andrews, A.P. Global Positioning Systems, Inertial Navigation, and Integration; Wiley-Interscience: Hoboken, NJ, USA, 2007; ISBN 9780470099711. [Google Scholar]
- Hofmann-Wellenhof, B.; Legat, K.; Wieser, M. Navigation: Principles of Positioning and Guidance; Springer: Vienna, Austria, 2003; ISBN 9783709160787. [Google Scholar]
- Salychev, O.S.; Oleg, S. Applied Inertial Navigation: Problems and Solutions; BMSTU Press: Moscow, Russia, 2004; ISBN 5703823951. [Google Scholar]
- Greiff, P.; Boxenhorn, B.; King, T.; Niles, L. Silicon monolithic micromechanical gyroscope. In Proceedings of the TRANSDUCERS ’91: 1991 International Conference on Solid-State Sensors and Actuators. Digest of Technical Papers, San Francisco, CA, USA, 24–27 June 1991; pp. 966–968. [Google Scholar] [CrossRef]
- Kourepenis, A.; Borenstein, J.; Connelly, J.; Elliott, R.; Ward, P.; Weinberg, M. Performance of MEMS inertial sensors. In Proceedings of the Position Location and Navigation Symposium (Cat. No.98CH36153), Palm Springs, CA, USA, 20–23 April 1996; pp. 1–8. [Google Scholar] [CrossRef]
- El-Sheimy, N.; Niu, X. The promise of MEMS to the navigation community. Insid. Gnss 2007, 2, 46–56. [Google Scholar]
- Davidson, P.; Vazquez, M.A.; Piche, R. Uninterrupted portable car navigation system using GPS, map and inertial sensors data. In Proceedings of the 2009 IEEE 13th International Symposium on Consumer Electronics, Kyoto, Japan, 25–28 May 2009; pp. 836–840. [Google Scholar]
- Huang, C.; Liao, Z.; Zhao, L. Synergism of INS and PDR in Self-Contained Pedestrian Tracking with a Miniature Sensor Module. IEEE Sens. J. 2010, 10, 1349–1359. [Google Scholar] [CrossRef]
- Tazartes, D. An historical perspective on inertial navigation systems. In Proceedings of the 2014 International Symposium on Inertial Sensors and Systems (ISISS), Laguna Beach, CA, USA, 25–26 February 2014; pp. 1–5. [Google Scholar]
- Qian, W.-X.; Zeng, Q.-H.; Wan, J.-W.; Xiong, Z. Pedestrian navigation method based on kinematic mechanism of human lower limb. Zhongguo Guanxing Jishu Xuebao/J. Chin. Inert. Technol. 2015, 23, 24–28. [Google Scholar]
- Renaudin, V.; Yalak, O.; Tomé, P.; Merminod, B. Indoor Navigation of Emergency Agents. Eur. J. Navig. Sci. 2007, 5, 36–45. [Google Scholar]
- Cheema, M.A. Indoor location-based services: Challenges and Opportunities. Sigspatial Spec. 2018, 10, 10–17. [Google Scholar] [CrossRef]
- Nokia Mobile. Mobile Location Services; Nokia Mobile: Espoo, Finland, 2001. [Google Scholar]
- IMU and INS–VectorNav Library. Available online: https://www.vectornav.com/support/library/imu-and-ins (accessed on 10 November 2020).
- Zupt Inertial Survey Technology. Available online: https://www.zupt.com/inertial-technology/ (accessed on 9 November 2020).
- Ojeda, L.; Borenstein, J. Non-GPS navigation for security personnel and first responders. J. Navig. 2007, 60, 391–407. [Google Scholar] [CrossRef]
- Rajagopal, S. Personal Dead Reckoning System with Shoe Mounted Inertial Sensors. Master’s Thesis, KTH Royal Institute of Technology, Stockholm, Sweden, 2008. [Google Scholar]
- Zampella, F.; Khider, M.; Robertson, P.; Jimnez, A. Unscented Kalman filter and Magnetic Angular Rate Update (MARU) for an improved Pedestrian Dead-Reckoning. In Proceedings of the 2012 IEEE/ION Position, Location and Navigation Symposium, Myrtle Beach, SC, USA, 23–26 April 2012; pp. 129–139. [Google Scholar] [CrossRef]
- Borenstein, J.; Ojeda, L.; Kwanmuang, S. Heuristic Reduction of Gyro Drift for Personnel Tracking Systems. J. Navig. 2009. [Google Scholar] [CrossRef]
- Ojeda, L.; Borenstein, J. Personal Dead-reckoning System for GPS-denied Environments. In Proceedings of the 2007 IEEE International Workshop on Safety, Security and Rescue Robotics, Rome, Italy, 27–29 September 2007; pp. 1–6. [Google Scholar]
- Rose, J.; Gamble, J.G. Human Walking; Lippincott Williams and Wilkins: Philadelphia, PA, USA, 2006; ISBN 9780781759540. [Google Scholar]
- Do, T.N.; Suh, Y.S. Gait analysis using floor markers and inertial sensors. Sensors 2012, 12, 1594–1611. [Google Scholar] [CrossRef]
- Parry, J. Gait Analysis Normal and Pathological Function; SLACK: Thorofare, NJ, USA, 1992; ISBN 9781556421921. [Google Scholar]
- Khedr, M.E.; El-Sheimy, N. SBAUPT: Azimuth SBUPT for frequent full attitude correction of smartphone-based PDR. IEEE Sens. J. 2020, 1. [Google Scholar] [CrossRef]
- Shin, S.H. New Map-Matching Algorithm Using Virtual Track for Pedestrian Dead Reckoning. Etri J. 2010, 32, 891–900. [Google Scholar] [CrossRef]
- Huang, Y.; Zheng, H.; Nugent, C.; McCullagh, P.; McDonough, S.M.; Tully, M.A.; Connor, S.O. Activity monitoring using an intelligent mobile phone–A Validation Study. In Proceedings of the 3rd International Conference on Pervasive Technologies Related to Assistive Environments–PETRA ’10, Samos, Greece, 23–25 June 2010; p. 1. [Google Scholar]
- Xu, L.; Xiong, Z.; Zhao, R. An indoor pedestrian navigation algorithm based on smartphone mode recognition. In Proceedings of the 2019 IEEE 3rd Information Technology, Networking, Electronic and Automation Control Conference, ITNEC 2019, Chengu, China, 15–17 March 2019; Institute of Electrical and Electronics Engineers Inc.: New York, NY, USA, 2019; pp. 831–835. [Google Scholar]
- Lee, H.H.; Choi, S.; Lee, M.J. Step detection robust against the dynamics of smartphones. Sensors 2015, 15, 27230–27250. [Google Scholar] [CrossRef]
- Tian, Q.; Salcic, Z.; Wang, K.I.-K.; Pan, Y. A Multi-Mode Dead Reckoning System for Pedestrian Tracking Using Smartphones. IEEE Sens. J. 2016, 16, 2079–2093. [Google Scholar] [CrossRef]
- Kupke, J.; Willemsen, T.; Keller, F.; Sternberg, H. Development of a step counter based on artificial neural networks. J. Locat. Based Serv. 2016, 10, 161–177. [Google Scholar] [CrossRef]
- Susi, M.; Renaudin, V.; Lachapelle, G. Motion mode recognition and step detection algorithms for mobile phone users. Sensors 2013, 13, 1539–1562. [Google Scholar] [CrossRef]
- Kammoun, S.; Pothin, J.B.; Cousin, J.C. An efficient fuzzy logic step detection algorithm for unconstrained smartphones. In Proceedings of the IEEE International Symposium on Personal, Indoor and Mobile Radio Communications, PIMRC, Hong Kong, China, 31 August–3 September 2015. [Google Scholar]
- Park, S.Y.; Heo, S.J.; Park, C.G. Accelerometer-based smartphone step detection using machine learning technique. In Proceedings of the International Electrical Engineering Congress, IEECON 2017, New York, NY, USA, 10 March 2017; Institute of Electrical and Electronics Engineers Inc.: New York, NY, USA, 2017. [Google Scholar]
- Wang, B.; Liu, X.; Yu, B.; Jia, R.; Gan, X. Pedestrian dead reckoning based on motion mode recognition using a smartphone. Sensors 2018, 18, 1811. [Google Scholar] [CrossRef] [PubMed]
- Zhang, H.; Yuan, W.; Shen, Q.; Li, T.; Chang, H. A handheld inertial pedestrian navigation system with accurate step modes and device poses recognition. IEEE Sens. J. 2015, 15, 1421–1429. [Google Scholar] [CrossRef]
- Edel, M.; Koppe, E. An advanced method for pedestrian dead reckoning using BLSTM-RNNs. In Proceedings of the 2015 International Conference on Indoor Positioning and Indoor Navigation, IPIN 2015, Banff, AB, Canada, 3–16 October 2015; Institute of Electrical and Electronics Engineers Inc.: New York, NY, USA, 2015. [Google Scholar]
- Ozcan, K.; Velipasalar, S. Robust and Reliable Step Counting by Mobile Phone Cameras. In Proceedings of the 9th International Conference on Distributed Smart Cameras, Seville, Spain, 8–11 September 2015; pp. 164–169. [Google Scholar] [CrossRef]
- Marouane, C.; Ebert, A.; Linnhoff-Popien, C.; Christil, M. Step and activity detection based on the orientation and scale attributes of the SURF algorithm. In Proceedings of the 2016 International Conference on Indoor Positioning and Indoor Navigation (IPIN), Alcala de Henares, Spain, 4–7 October 2016; pp. 1–8. [Google Scholar]
- Aubeck, F.; Isert, C.; Gusenbauer, D. Camera based step detection on mobile phones. In Proceedings of the 2011 International Conference on Indoor Positioning and Indoor Navigation, IPIN 2011, Guimaraes, Portugal, 21–23 September 2011. [Google Scholar]
- Torteeka, P.; Chundi, X.; Dongkai, Y. Hybrid technique for indoor positioning system based on Wi-Fi received signal strength indication. In Proceedings of the 2014 International Conference on Indoor Positioning and Indoor Navigation (IPIN), Busan, Korea, 27–30 October 2014; pp. 48–57. [Google Scholar]
- Diaz, E.M.; De Ponte Muller, F.; Jimenez, A.R.; Zampella, F. Evaluation of AHRS algorithms for inertial personal localization in industrial environments. In Proceedings of the IEEE International Conference on Industrial Technology, Seville, Spain, 17–19 March 2015; Institute of Electrical and Electronics Engineers Inc.: New York, NY, USA, 2015; Volume 2015, pp. 3412–3417. [Google Scholar]
- Euston, M.; Coote, P.; Mahony, R.; Kim, J.; Hamel, T. A complementary filter for attitude estimation of a fixed-wing UAV. In Proceedings of the 2008 IEEE/RSJ International Conference on Intelligent Robots and Systems, IROS, Nice, France, 22–26 September 2008; pp. 340–345. [Google Scholar]
- Madgwick, S.O.H.; Harrison, A.J.L.; Vaidyanathan, R. Estimation of IMU and MARG orientation using a gradient descent algorithm. In Proceedings of the 2011 IEEE International Conference on Rehabilitation Robotics, Zurich, Switzerland, 29 June 2011; pp. 1–7. [Google Scholar]
- Mizell, D. Using Gravity to Estimate Accelerometer Orientation; IEEE: White Plains, NY, USA, 2003. [Google Scholar]
- Xiao, Z.; Wen, H.; Markham, A.; Trigoni, N. Robust Indoor Positioning with Lifelong Learning. IEEE J. Sel. Areas Commun. 2015, 33, 2287–2301. [Google Scholar] [CrossRef]
- Xiao, Z.; Wen, H.; Markham, A.; Trigoni, N. Robust pedestrian dead reckoning (R-PDR) for arbitrary mobile device placement. In Proceedings of the 2014 International Conference on Indoor Positioning and Indoor Navigation (IPIN), Busan, Korea, 27–30 October 2014; pp. 187–196. [Google Scholar] [CrossRef]
- Diaz, E.M.; Gonzalez, A.L.M.; De Ponte Müller, F. Standalone Inertial Pocket Navigation System. In Proceedings of the Record–IEEE PLANS, Position Location and Navigation Symposium, Monterey, CA, USA, 5–8 May 2014; Institute of Electrical and Electronics Engineers Inc.: New York, NY, USA, 2014; pp. 241–251. [Google Scholar]
- Yadav, N.; Bleakley, C. Accurate orientation estimation using AHRS under conditions of magnetic distortion. Sensors 2014, 14, 20008–20024. [Google Scholar] [CrossRef]
- Daponte, P.; De Vito, L.; Rapuano, S.; Riccio, M.; Picariello, F. Compensating magnetic disturbances on MARG units by means of a low complexity data fusion algorithm. In Proceedings of the 2015 IEEE International Symposium on Medical Measurements and Applications, MeMeA, New York, NY, USA, 4–5 May 2015; pp. 157–162. [Google Scholar]
- Ma, M.; Song, Q.; Gu, Y.; Zhou, Z. Use of magnetic field for mitigating gyroscope errors for indoor pedestrian positioning. Sensors 2018, 18, 2592. [Google Scholar] [CrossRef]
- Li, Y.; Georgy, J.; Niu, X.; Goodall, C.; El-sheimy, N. An Automatic Multi-level Gyro Calibration Architecture for Consumer Portable Devices. In Proceedings of the International Conference on Indoor Positioning and Indoor Navigation (IPIN), Busan, Korea, 27–30 October 2014. [Google Scholar]
- Li, Y.; Georgy, J.; Niu, X.; Li, Q.; El-Sheimy, N. Autonomous Calibration of MEMS Gyros in Consumer Portable Devices. IEEE Sens. J. 2015, 15, 4062–4072. [Google Scholar] [CrossRef]
- Ruotsalainen, L.; Bancroft, J.; Lachapelle, G. Mitigation of attitude and gyro errors through vision aiding. In Proceedings of the 2012 International Conference on Indoor Positioning and Indoor Navigation (IPIN), Sydney, Australia, 13–15 November 2016; pp. 1–9. [Google Scholar]
- Antigny, N.; Servieres, M.; Renaudin, V. Hybrid visual and inertial position and orientation estimation based on known urban 3D models. In Proceedings of the 2016 International Conference on Indoor Positioning and Indoor Navigation (IPIN), Alcala de Henares, Spain, 4–7 October 2016; pp. 1–8. [Google Scholar]
- Del Rosario, M.B.; Lovell, N.H.; Redmond, S.J. Quaternion-Based Complementary Filter for Attitude Determination of a Smartphone. IEEE Sens. J. 2016, 16, 6008–6017. [Google Scholar] [CrossRef]
- Fourati, H. Heterogeneous data fusion algorithm for pedestrian navigation via foot-mounted inertial measurement unit and complementary filter. IEEE Trans. Instrum. Meas. 2015, 64, 221–229. [Google Scholar] [CrossRef]
- Renaudin, V.; Combettes, C. Magnetic, Acceleration Fields and Gyroscope Quaternion (MAGYQ)-Based Attitude Estimation with Smartphone Sensors for Indoor Pedestrian Navigation. Sensors 2014, 14, 22864–22890. [Google Scholar] [CrossRef]
- Yean, S.; Lee, B.S.; Yeo, C.K.; Vun, C.H.; Oh, H.L. Smartphone Orientation Estimation Algorithm Combining Kalman Filter With Gradient Descent. IEEE J. Biomed. Heal. Inf. 2018, 22, 1421–1433. [Google Scholar] [CrossRef]
- Liu, D.; Pei, L.; Qian, J.; Wang, L.; Liu, P.; Dong, Z.; Xie, S.; Wei, W. A novel heading estimation algorithm for pedestrian using a smartphone without attitude constraints. In Proceedings of the 4th International Conference on Ubiquitous Positioning, Indoor Navigation and Location-Based Services–UPINLBS 2016, Shanghai, China, 2–4 November 2016; Institute of Electrical and Electronics Engineers Inc.: Piscataway, NJ, USA, 2017; pp. 29–37. [Google Scholar]
- Lee, J.S.; Huang, S.M. An Experimental Heuristic Approach to Multi-Pose Pedestrian Dead Reckoning Without Using Magnetometers for Indoor Localization. IEEE Sens. J. 2019, 19, 9532–9542. [Google Scholar] [CrossRef]
- Deng, Z.A.; Wang, G.; Hu, Y.; Wu, D. Heading estimation for indoor pedestrian navigation using a smartphone in the pocket. Sensors 2015, 15, 21518–21536. [Google Scholar] [CrossRef]
- Deng, Z.; Si, W.; Qu, Z.; Liu, X.; Na, Z. Heading estimation fusing inertial sensors and landmarks for indoor navigation using a smartphone in the pocket. Eurasip J. Wirel. Commun. Netw. 2017, 2017, 160. [Google Scholar] [CrossRef]
- Kourogi, M.; Kurata, T. Personal positioning based on walking locomotion analysis with self-contained sensors and a wearable camera. In Proceedings of the 2nd IEEE and ACM International Symposium on Mixed and Augmented Reality, ISMAR 2003, Tokyo, Japan, 10 October 2003; pp. 103–112. [Google Scholar]
- Kunze, K.; Lukowicz, P.; Partridge, K.; Begole, B. Which way am I facing: Inferring horizontal device orientation from an accelerometer signal. In Proceedings of the 2009 International Symposium on Wearable Computers, Linz, Austria, 4–7 September 2009; pp. 149–150. [Google Scholar] [CrossRef]
- Bojja, C.; Parviainen, J.; Collin, J.; Hellevaara, J.; Käppi, R.; Alanen, J.; Takala, K. Robust Misalignment Handling in Pedestrian Dead Reckoning. In Proceedings of the 2016 IEEE 84th Vehicular Technology Conference (VTC-Fall), Montreal, QC, Canada, 18–21 September 2016. [Google Scholar] [CrossRef]
- Bao, H.; Wong, W.C. Improved PCA based step direction estimation for dead-reckoning localization. In Proceedings of the 2013 International Conference on Cyber-Enabled Distributed Computing and Knowledge Discovery, CyberC 2013, Washington, DC, USA, 10–12 October 2013; pp. 325–331. [Google Scholar]
- Yang, X.; Huang, B.; Miao, Q. A step-wise algorithm for heading estimation via a smartphone. In Proceedings of the 28th Chinese Control and Decision Conference, CCDC 2016, Yinchuan, China, 26–28 May 2016; pp. 4598–4602. [Google Scholar]
- Shin, B.; Lee, S.; Kim, C.; Kim, J.; Lee, T.; Kee, C.; Heo, S.; Rhee, H. Implementation and performance analysis of smartphone-based 3D PDR system with hybrid motion and heading classifier. In Proceedings of the Record–IEEE PLANS, Position Location and Navigation Symposium, Monserey, CA, USA, 5–8 May 2014; pp. 201–204. [Google Scholar]
- Knauth, S. Smartphone PDR positioning in large environments employing WiFi, particle filter, and backward optimization. In Proceedings of the 2017 International Conference on Indoor Positioning and Indoor Navigation, IPIN 2017, Sapporo, Japan, 18–21 September 2017; Institute of Electrical and Electronics Engineers Inc.: Piscataway, NJ, USA, 2017; Volume 2017, pp. 1–6. [Google Scholar]
- Moder, T.; Wisiol, K.; Hafner, P.; Wieser, M. Smartphone-based indoor positioning utilizing motion recognition. In Proceedings of the 2015 International Conference on Indoor Positioning and Indoor Navigation, IPIN, Banff, AB, Canada, 13–16 October 2015. [Google Scholar]
- Li, Y.; Lan, H.; Zhuang, Y.; Zhang, P.; Niu, X.; El-Sheimy, N. Real-time attitude tracking of mobile devices. In Proceedings of the International Conference on Indoor Positioning and Indoor Navigation IPIN, Banff, AB, Canada, 13–16 October 2015; Volume 13–16. [Google Scholar] [CrossRef]
- Li, Y.; Niu, X.; Zhang, P.; Lan, H.; Zhuang, Y.; El-sheimy, N. Smartphone-based Indoor Navigation using PDR and Magnetic Matching. In Proceedings of the 28th International Technical Meeting of the Satellite Division of the Institute of Navigation, Nashville, TN, USA, 16–20 September 2015; pp. 2060–2066. [Google Scholar]
- Li, Y.; Zhang, P.; Lan, H.; Zhuang, Y.; Niu, X.; El-Sheimy, N. A modularized real-time indoor navigation algorithm on smartphones. In Proceedings of the International Conference on Indoor Positioning and Indoor Navigation, Zurich, Switzerland, 15–17 September 2010; pp. 13–16. [Google Scholar] [CrossRef]
- Li, Y.; Zhuang, Y.; Lan, H.; Zhang, P.; Niu, X.; El-Sheimy, N. WiFi-aided magnetic matching for indoor navigation with consumer portable devices. Micromachines 2015, 6, 747–764. [Google Scholar] [CrossRef]
- Shin, S.H.; Park, C.G.; Kim, J.W.; Hong, H.S.; Lee, J.M. Adaptive Step Length Estimation Algorithm Using Low-Cost MEMS Inertial Sensors. In Proceedings of the 2007 IEEE Sensors Applications Symposium, Atlanta, GA, USA, 28–31 October 2007; pp. 1–5. [Google Scholar] [CrossRef]
- Abadleh, A.; Al-Hawari, E.; Alkafaween, E.; Al-Sawalqah, H. Step detection algorithm for accurate distance estimation using dynamic step length. In Proceedings of the18th IEEE International Conference on Mobile Data Management, MDM 2017, Daejeon, Korea, 29 May–1 June 2017; pp. 324–328. [Google Scholar]
- Kim, J.W.; Jang, H.J.; Hwang, D.-H.; Park, C. A Step, Stride and Heading Determination for the Pedestrian Navigation System; Scientific Research Publishing: Wuhan, China, 2004; Volume 3. [Google Scholar]
- Weinberg, H. Using the ADXL202 in Pedometer and Personal Navigation Applications; Analog Devices Inc.: Norwood, MA, USA, 2002. [Google Scholar]
- Way, O.T.; Scarlett, J. Enhancing the Performance of Pedometers Using a Single Accelerometer; Application Note an-900; Analog Devices Inc.: Norwood, MA, USA, 2007. [Google Scholar]
- LEVI. Robert Dead Reckoning Navigational System Using Accelerometer to Measure Foot Impacts. U.S. Patent No. 5,583,776, 10 December 1996.
- Li, F.; Zhao, C.; Ding, G.; Gong, J.; Liu, C.; Zhao, F. A Reliable and accurate indoor localization method using phone inertial sensors. In Proceedings of the 2012 ACM Conference on Ubiquitous Computing, Association for Computing, Pittsburg, PA, USA, 5–8 September 2012; pp. 421–430. [Google Scholar]
- Renaudin, V.; Susi, M.; Lachapelle, G. Step Length Estimation Using Handheld Inertial Sensors. Sensors 2012, 12, 8507–8525. [Google Scholar] [CrossRef] [PubMed]
- Lee, S.W.; Mase, K. Recognition on walking behaviors for pedestrian navigation. In Proceedings of the IEEE Conference on Control Applications, New Orleans, LA, USA, 4–7 November 2001; pp. 1152–1155. [Google Scholar]
- Pepa, L.; Marangoni, G.; Di Nicola, M.; Ciabattoni, L.; Verdini, F.; Spalazzi, L.; Longhi, S. Real Time Step Length Estimation on Smartphone. In Proceedings of the 2016 IEEE International Conference on Consumer Electronics (ICCE), Nantou, Taiwan, 27–29 May 2016; pp. 315–316. [Google Scholar] [CrossRef]
- González, R.C.; Alvarez, D.; López, A.M.; Alvarez, J.C. Modified pendulum model for mean step length estimation. In Proceedings of the Annual International Conference of the IEEE Engineering in Medicine and Biology, New Orleans, LA, USA, 20 February 2007; pp. 1371–1374. [Google Scholar]
- Wang, Q.; Ye, L.; Luo, H.; Men, A.; Zhao, F.; Huang, Y. Pedestrian stride-length estimation based on LSTM and denoising autoencoders. Sensors 2019, 19, 840. [Google Scholar] [CrossRef] [PubMed]
- Gu, F.; Khoshelham, K.; Yu, C.; Shang, J. Accurate Step Length Estimation for Pedestrian Dead Reckoning Localization Using Stacked Autoencoders. IEEE Trans. Instrum. Meas. 2019, 68, 2705–2713. [Google Scholar] [CrossRef]
- Liu, Y.; Chen, Y.; Shi, L.; Tian, Z.; Zhou, M.; Li, L. Accelerometer based joint step detection and adaptive step length estimation algorithm using handheld devices. J. Commun. 2015, 10, 520–525. [Google Scholar] [CrossRef][Green Version]
- Shin, B.; Kim, C.; Kim, J.H.; Lee, S.; Kee, C.; Lee, T. Hybrid Model–Based Motion Recognition for Smartphone Users. Etri J. 2014, 36, 1016–1022. [Google Scholar] [CrossRef]
- Ho, N.H.; Truong, P.H.; Jeong, G.M. Step-detection and adaptive step-length estimation for pedestrian dead-reckoning at variouswalking speeds using a smartphone. Sensors 2016, 16, 1423. [Google Scholar] [CrossRef]
- Sun, Y.; Wu, H.; Schiller, J. A Step Length Estimation Model for Position Tracking. In Proceedings of the 2015 International Conference on Localization and GNSS (ICL-GNSS), Turin, Italy, 25–27 June 2015; Institute of Electrical and Electronics Engineers: New York, NY, USA, 2015. [Google Scholar]
- Lee, J.H.; Shin, B.; Lee, S.; Hun, J.; Kim, C.; Lee, T.; Park, J.; Recognition, A.M. Motion based Adaptive Step Length Estimation using Smartphone. In Proceedings of the 18th IEEE International Symposium on Consumer Electronics (ISCE 2014), Jeju, Korea, 22–25 June 2014; pp. 1–2. [Google Scholar] [CrossRef]
- Qian, J.; Pei, L.; Zou, D.; Qian, K.; Liu, P. Optical flow based step length estimation for indoor pedestrian navigation on a smartphone. In Proceedings of the Record–IEEE PLANS, Position Location and Navigation Symposium, Monterey, CA, USA, 5–8 May 2014. [Google Scholar]
- Khedr, M.; El-Sheimy, N. A smartphone step counter using IMU and magnetometer for navigation and health monitoring applications. Sensors 2017, 17, 2573. [Google Scholar] [CrossRef] [PubMed]
- Khedr, M.E.; Radi, A.; El-Sheimy, N. Step-Based Attitude Update (SBUPT) Technique for Pedestrian Dead Reckoning (PDR) using Handheld Devices. In Proceedings of the ION 2019 Pacific PNT Meeting, Honolulu, HI, USA, 8–11 April 2019; pp. 582–593. [Google Scholar]
- Vezocnik, M.; Juric, M.B. Average Step Length Estimation Models’ Evaluation Using Inertial Sensors: A Review. IEEE Sens. J. 2019, 19, 396–403. [Google Scholar] [CrossRef]
- MTi 100-Series. Available online: https://www.xsens.com/products/mti-100-series (accessed on 4 December 2020).


Publisher’s Note: MDPI stays neutral with regard to jurisdictional claims in published maps and institutional affiliations. |
© 2021 by the authors. Licensee MDPI, Basel, Switzerland. This article is an open access article distributed under the terms and conditions of the Creative Commons Attribution (CC BY) license (http://creativecommons.org/licenses/by/4.0/).