Article

Analysis of Differentially Expressed Genes, MMP3 and TESC, and Their Potential Value in Molecular Pathways in Colon Adenocarcinoma: A Bioinformatics Approach

1
Research Center for Functional Genomics, Biomedicine and Translational Medicine, Iuliu Haţieganu University of Medicine and Pharmacy, 23 Marinescu Street, 40015 Cluj-Napoca, Romania
2
Centre for Innovative Process Engineering (CENTIV) GmbH, 28857 Bremen Stuhr, Germany
*
Author to whom correspondence should be addressed.
These authors contributed equally to this work.
BioMedInformatics 2022, 2(3), 474-491; https://doi.org/10.3390/biomedinformatics2030030
Submission received: 1 August 2022 / Revised: 30 August 2022 / Accepted: 30 August 2022 / Published: 3 September 2022
(This article belongs to the Special Issue Feature Papers in Medical Statistics and Data Science Section)

Abstract

:
Despite the great progress in its early diagnosis and treatment, colon adenocarcinoma (COAD) is still poses important issues to clinical management. Therefore, the identification of novel biomarkers or therapeutic targets for this disease is important. Using UALCAN, the top 25 upregulated and downregulated genes in COAD were identified. Then, a Kaplan–Meier plotter was employed for these genes for survival analysis, revealing the correlation with overall survival rate only for MMP3 (Matrix Metallopeptidase 3) and TESC (Tescalcin). Despite this, the mRNA expression levels were not correlated with the tumor stages or nodal metastatic status. MMP3 and TESC are relevant targets in COAD that should be additionally validated as biomarkers for early diagnosis and prevention. Ingenuity Pathway Analysis revealed the top relevant network linked to Post-Translational Modification, Protein Degradation, and Protein Synthesis, where MMP3 was at the core of the network. Another important network was related to cell cycle regulation, TESC being a component of this. We should also not underestimate the complex regulatory mechanisms mediated by the interplay of the multiple other regulatory molecules, emphasizing the interconnection with molecules related to invasion and migration involved in COAD, that might serve as the basis for the development of new biomarkers and therapeutic targets.

1. Introduction

Although great improvements have been made in the management of colon cancer, it still represents an unmet clinical need, especially in the late stages of the disease, where the limited response to therapy and an important alteration in quality of life threaten patients’ outcomes. Colon adenocarcinoma (COAD) is a common malignant tumor of the digestive tract, with an incidence of 37.7% with 114,515 new cases and a 13.4% mortality rate with 576,858 deaths reported by Globocan in 2021 [1,2]. In most cases, this cancer is asymptomatic until late stages, with widely available screening programs only in developed countries. Meanwhile, a reduced reported screening rate in low and middle-income countries is reflected by increasing mortality for these patients [3].
Treatments in advanced stages, which are often accompanied by metastasis or locally advanced disease, face limitations in regards to systemic chemotherapy and radiotherapy due to high toxicity, while surgical removal is a viable option mostly for earlier stages [1]. With such a high number of deaths annually, it is vital to search among the many altered molecules from cancer tissue, some of them with yet unknown roles, to identify more effective molecular actors and to investigate their potential role in colon cancer, thus possibly improving patient survival [4].
Multiple molecular alterations occur during COAD development and progression, impacting the patient’s prognosis [5,6,7]. Their identification and study will improve disease management [8,9,10,11]. In the last few years, several molecular signatures have been validated as being correlated with prognostic and prediction significance [5,8,12,13].
Bioinformatic analysis of omics data has been widely used to explore the pathogenesis of human diseases [14]. The Cancer Genome Atlas (TCGA) is a comprehensive database where the molecular profiles and clinical parameters of 34 different tumor types on multiple levels (level of expression for coding and non-coding genes, mutational status, methylation patterns, or proteomic/metabolomic profile) are included [15]. The use of datasets from TCGA expands the opportunities for data mining and can provide a deeper understanding of cancer biology and tumor-specific vulnerabilities [16]. Previous studies concerning COAD gene expression profiling identified genes with an altered expression level [16,17,18]. These findings allow for the discovery of potential new molecules that may lead to a significantly more accurate diagnosis if found in the early stages, better patient stratification, and the development of new targeted therapies [19].
The more in-depth the studies are extended, the more the extracted information can define new potential molecules that can help the improvement of colon adenocarcinoma management. To identify potentially powerful “actors” in COAD progression, we chose to investigate the pathways and interaction networks associated with the most altered identified genes in COAD (top 25 upregulated coding genes and top 25 down-regulated coding genes, based on the UALCAN database (http://ualcan.path.uab.edu, 12 August 2022) using Ingenuity Pathway Analysis from Qiagen (IPA). The UALCAN portal has been widely used since its release in 2017 and has received immense praise and popularity. IPA is used to identify the interactions among the altered genes and integrate and identify the most relevant pathways associated with COAD.
This study aimed to identify the potential candidate genes in COAD and to further uncover their roles in this pathology. Among the top 25 up and 25 down-regulated genes, we explored two specific genes involved in several mechanisms from early stage to late stage colon adenocarcinomas, specifically the MMP3 and TESC genes, the only two genes among these top up and down-regulated genes that were correlated with overall survival rates (according to STARBASE).
The TESC (tescalcin) gene codifies for a protein with an intracytoplasmic localization that is expressed in several cancer types. It was recently proposed as a target for colon cancer therapy. MMP3 is known to be located intracellularly and is involved in the degradation of collagen, possessing the molecular functions of a hydrolase, metalloprotease, and protease. It is also involved in the epithelial to mesenchymal transition. In our study, the genes’ level of expression was correlated with the overall survival rate. Both genes are still not often studied in this cancer type; therefore, due to their statistical power in overall survival, we investigated the bioinformatics data related to them. For validation, we used another cohort of patients found in the COLONOMICs project [20]. In addition, these data should be further validated in additional patient cohorts on biological samples from both tumor tissue and plasma. This part was not the purpose of our study at this time.

2. Materials and Methods

2.1. Study Design

A flow chart of the study design with datasets and analysis for COAD is shown in Figure 1.

2.2. Data Mining of TCGA Data Set in COAD

The bioinformatics portal UALCAN (http://ualcan.path.uab.edu, accessed on 8 June 2022) used TCGA level 3 RNA-sequencing and clinical data from COAD. This database was used to access the altered gene expression pattern [21]. The COAD cohort is represented by 286 primary COAD tumors and 41 adjacent normal tissue to some of the samples, comparing cancer tissue samples with normal tissue samples. UALCAN lists genes that show high differential expression among normal and tumor samples in the form of an interactive heatmap. The database delivers a graphical representation of the expression profile as a heatmap with the top 25 altered genes or as a box plot for individual genes; the expression level of the searched gene is normalized as transcript per million reads, and the p-value < 0.01 is considered to be significant. In UALCAN, the difference among the groups is performed using a t-test using a PERL script with the Comprehensive Perl Archive Network (CPAN) module “Statistics: t-test” [21].

2.3. Inclusion and Exclusion Criteria

To perform the bioinformatics analysis, we selected only patients with colon adenocarcinoma. A total of 286 patients with COAD were found in the UALCAN database, with 41 matched pairs of normal adjacent tissue according to the following table. We collected data from all 286 patients, who were of both sexes, with tumors at all stages, including lymph node involvement data. The exclusion criteria were patients with rectal cancer. Data of the patients included in our bioinformatics analysis are summarized in Table 1.
For the evaluation of the significance of differences in expression levels between normal and primary tumors, or tumor subgroups based on clinicopathological features, Welch’s t-test estimations were used (* p ≤ 0.05, ** p ≤ 0.01, *** p ≤ 0.001, **** p ≤ 0.0001) [22].
The UALCAN database was used for the identification of the top 25 upregulated and top 25 downregulated genes. Additionally, UALCAN was used for the graphical representation of protein expression levels for the same transcripts. Data from The Cancer Omics Atlas (TCOA) repository database provides information about gene expression, somatic mutations, miRNA expression, and protein expression data based on an individual molecule or a specific cancer type [23]. We used it for the downloaded top 25 upregulated and top 25 down-regulated genes in COAD for analysis and mechanistic insights.

2.4. Survival Analysis STARBASE Database

The StarBase database (https://starbase.sysu.edu.cn/panGeneCoExp.php#, accessed on 14 June 2022) is a portal that can facilitate tumor subgroups’ gene expression and survival analyses, providing easy access to publicly available cancer transcriptome data contained by TCGA [24]. We evaluated the COAD patients’ survival related to the top 25 upregulated and top 25 downregulated genes. The genes’ names were keyed into the STARBASE database, and Kaplan–Meier survival plots, hazard ratio (HR), 95% confidence interval (CI), and log-rank p values were displayed directly on the web page; a log-rank p < 0.05 was considered statistically significant.

2.5. Pearson Correlation Analysis for Gene Expression Data

Data from survival analysis revealed the MMP3 and TESC coding genes that were further used for correlation analysis in COAD, using the STARBASE database [24,25]. A Pearson correlation coefficient r > 0.40, which was set as a cutoff, and a p-value ≤ 0.05 were considered statistically significant (https://starbase.sysu.edu.cn/panGeneCoExp.php, accessed on 12 June 2022).

2.6. Genetic Alterations Using cBioPortal

The frequency of gene alterations (amplification, deep deletion, and missense mutations) in cancer can be assessed by using cBioPortal (http://www.cbioportal.org, accessed on 2 August 2022). cBioportal is an interactive open-source platform that provides large-scale cancer genomics datasets [26].

2.7. MMP3 with TESC in COAD Protein Expression Levels

UALCAN also provides a protein expression analysis option for COAD, based on data available from the Clinical Proteomic Tumor Analysis Consortium (CPTAC, http://ualcan.path.uab.edu/analysis-prot.html accessed on 10 June 2022) [27].

2.8. Validation of MMP3 and TESC Expression Level with the Colonomics Database

Colonomics is a web resource for analyzing biomarkers of diagnosis and prognosis in colorectal cancer (https://www.colonomics.org/expression-browser/, accessed on 9 August 2022). It can be used to generate plots of the gene expression profiles based on a patient cohort of 98 paired adjacent mucosa and tumor tissues from colorectal cancer patients and 50 colon mucosa from healthy donors; the patient’s characteristics have been described previously by Sanz-Pamplona et al., 2014 [18]; p-value < 0.01 is considered to be significant.

2.9. Pathway Analysis in COAD

Functional annotation was performed using Ingenuity Pathway Analysis (IPA, https://digitalinsights.qiagen.com/products-overview/discovery-insights-portfolio/analysis-and-visualization/qiagen-ipa/, accessed on 2 August 2022) applying predefined pathways and functional categories of the Ingenuity Knowledge Base [28]. The ‘‘Core Analysis’ function included in IPA was used to interpret the top 25 upregulated and top 25 downregulated genes in COAD, downloaded from TCOA. After the analysis, the generated networks were arranged by a score in order of significance using the Ingenuity Knowledge Base. The significance of the bio functions and the canonical pathways were judged based on the Fisher Exact test p-value; being grouped into Disease and Disorders; Molecular and Cellular Functions; and Physiological System Development and Function. Additionally, the implication in canonical pathways was considered and ranked by the ratio value (number of molecules in a particular pathway that has the cut criteria, divided by the total number of molecules of the pathway). IPA generates networks for the altered signature in COAD that are correlated with previously identified associations between genes or proteins but independently of established canonical pathways. Moreover, these networks are linked to functions based on the molecules involved.

2.10. Multi-Cancer View of MMP3 and TESC in Cancer

Additional multi-cancer view graphical representations for MMP3 and TESC of the expression levels were downloaded from TIMER2.0 (http://timer.cistrome.org, accessed on 1 June 2022) [29,30].

3. Results

3.1. Altered Gene Expression Pattern in COAD Based on TCGA Dataset

A total number of 628 altered genes with an altered expression level (363 overexpressed and 265 downregulated genes), using as a cut-off value a fold change of ±2 and a p-value ≤ 0.05 (TCGA patient cohort linked to the TCOA online tool) was found [5]. Gene expression analysis using TCGA data portal analysis with the UALCAN database for COAD permits emphasis on the top 25 upregulated and top 25 downregulated genes, displayed as a heatmap in Figure 2 and Table S1. The Log2(fold change) and p-value are based on the analysis done using TCOA online tool.

3.2. Significance of the MMP3 and TESC in COAD

Among the top 25 upregulated and top 25 downregulated genes in COAD, two genes (MMP3 and TESC) were correlated with overall survival (OS) in COAD. Both genes are upregulated in COAD. The prognostic values of MMP3 and TESC mRNA in COAD evaluated by STARBASE online databases are displayed in Figure 3; we found that the expression of MMP3 and low expression of TESC suggest an unfavorable prognosis for patients with COAD.
No direct correlation between TESC and MMP3 (r = 0.004 and a p value = 0.925) has been revealed, as can be observed in Figure 4.

3.3. MMP3 and TESC mRNA Expression and Cancer Stages and Lymph Node-Positive/Metastatic Status in COAD

The mRNA expression levels of MMP3 and TESC in tumor tissue were much higher compared to normal tissues. The relationship between the mRNA expression levels of MMP3 and TESC and the tumor stage of COAD patients was analyzed based on the UALCAN database (Figure 5). As shown in Figure 6, the mRNA expressions of MMP3 and TESC are statistically significant across all tumor stages and lymph node status of COAD.

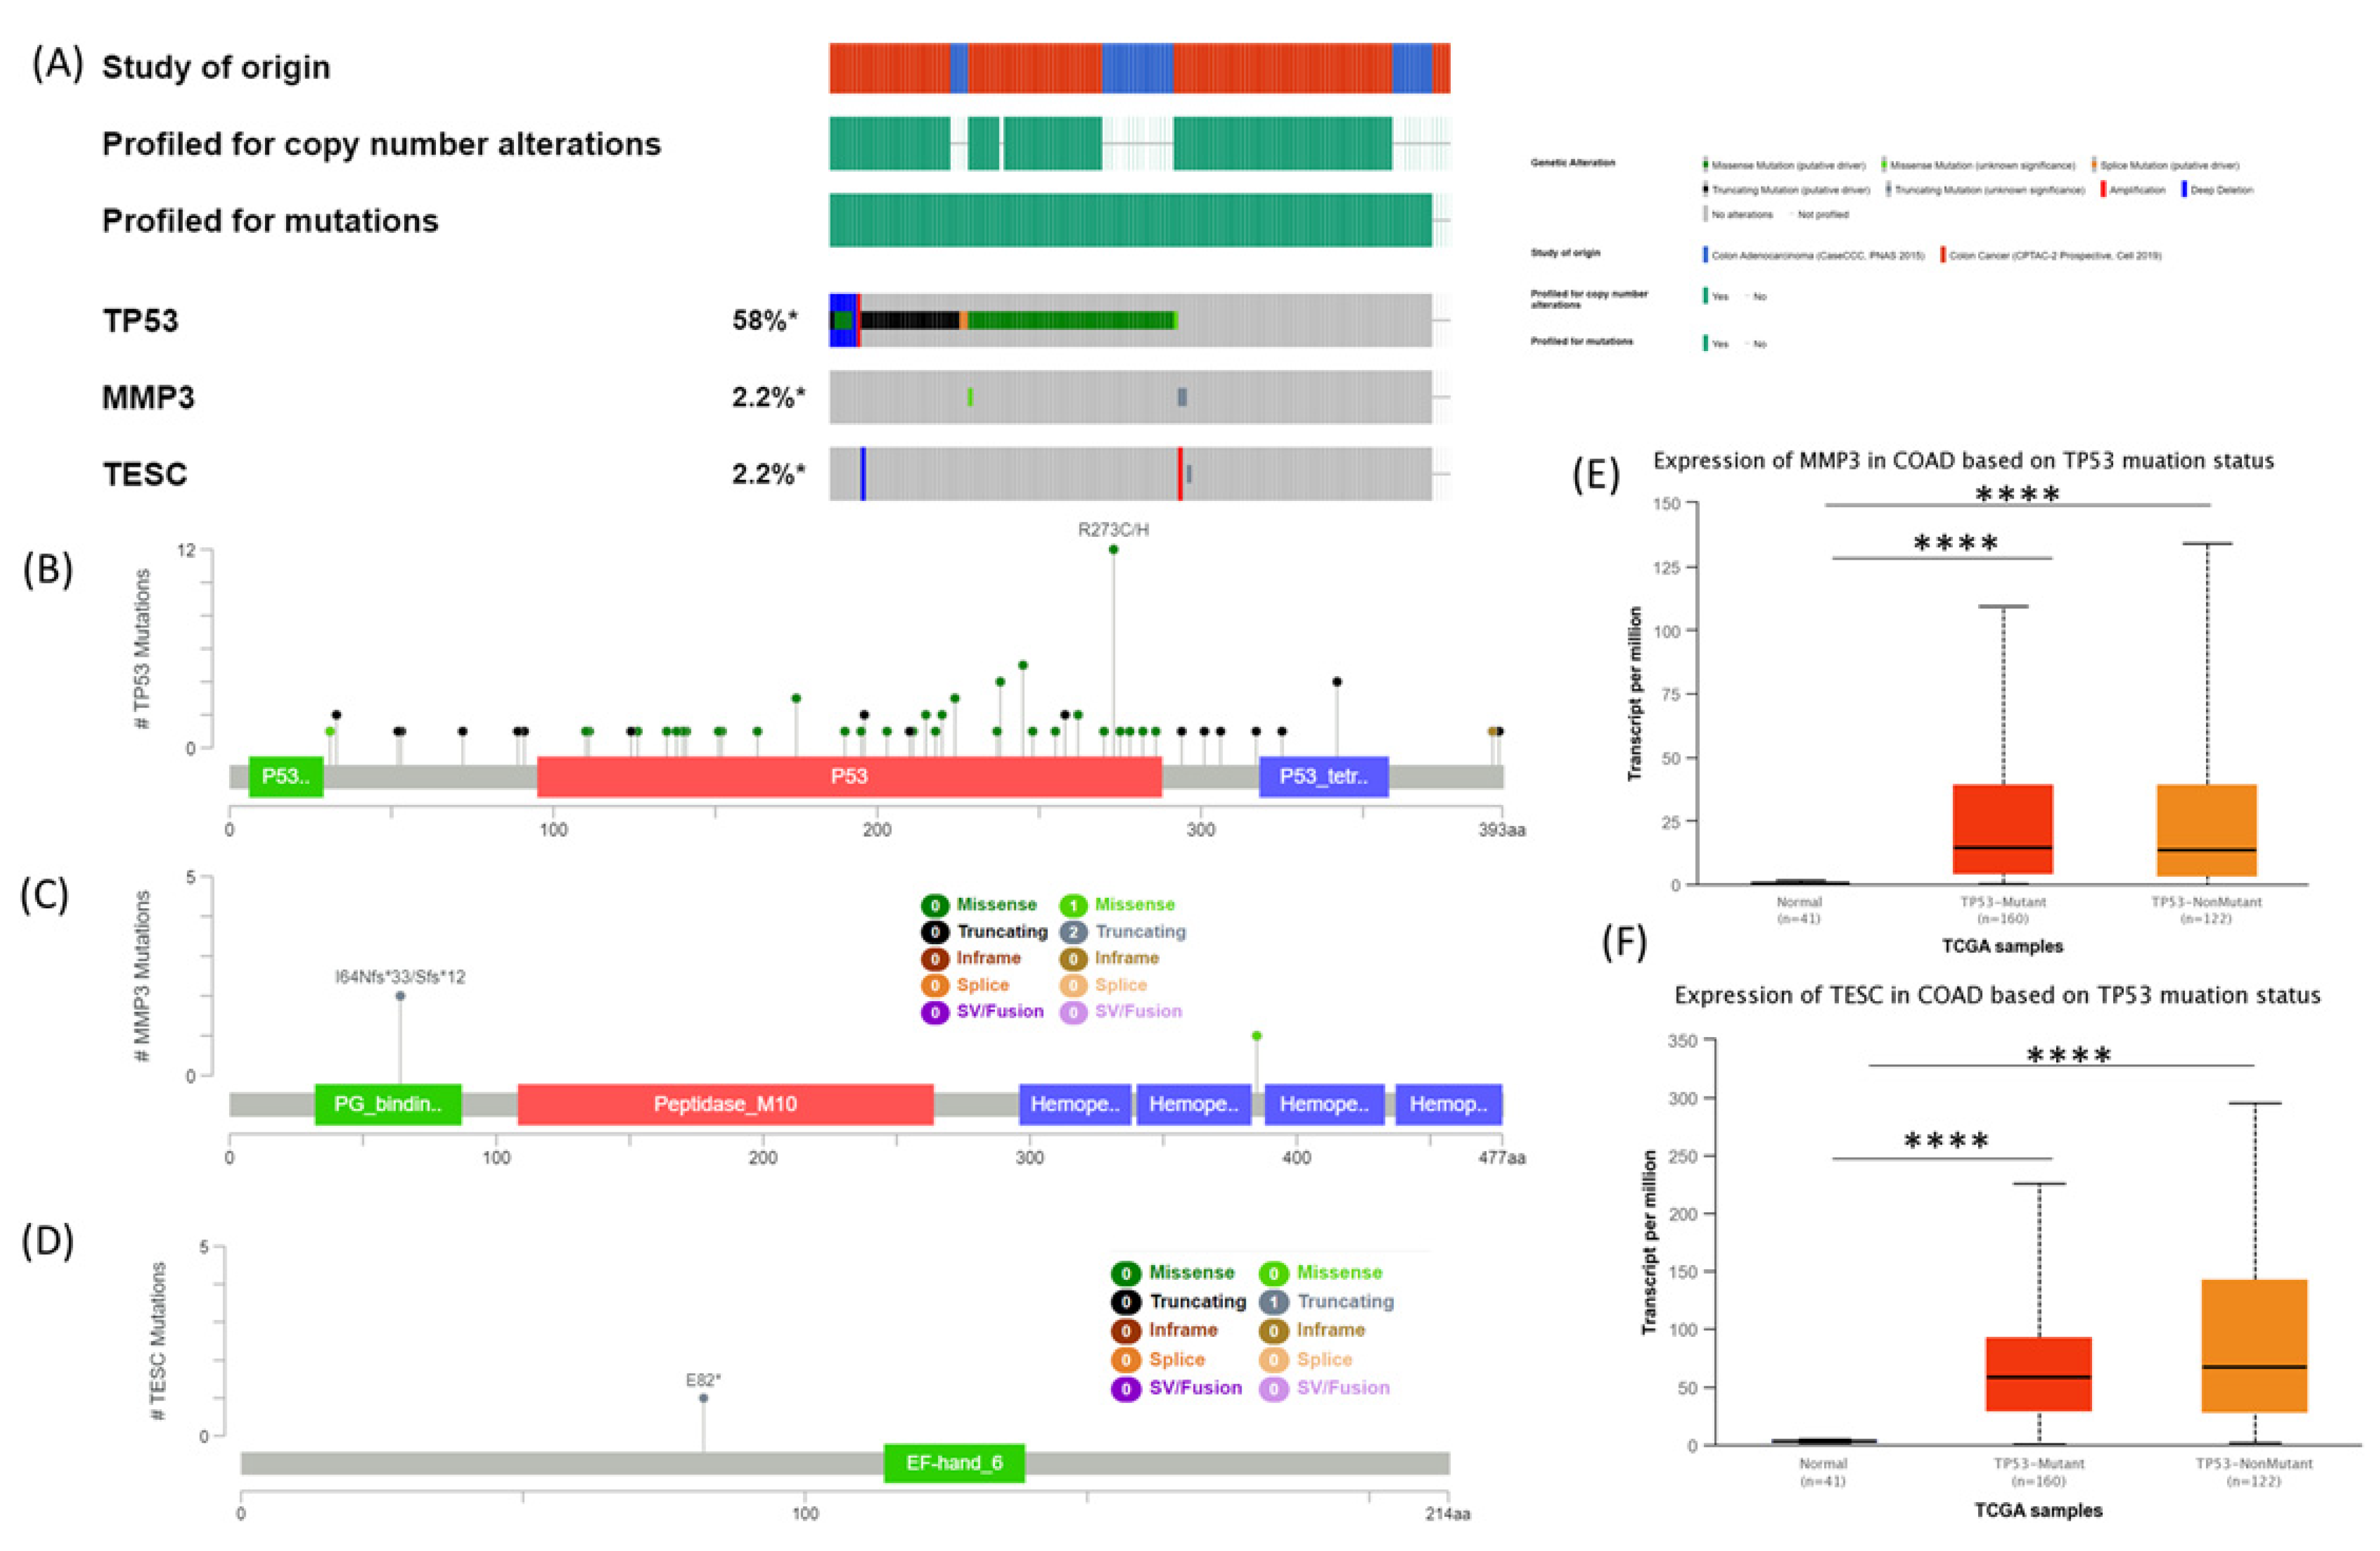
3.4. MMP3 and TESC Mutational Signature in COAD Evaluated Using cBioPortal

The application of cBioPortal was for the evaluated mutational signature to show the mutational frequency of the selected genes (MMP3, TESC compared with TP53, which was identified to be highly mutated in COAD [5]) in the COAD TCGA cohort. The data is presented in Figure 7.

3.5. Validation of MMP3 and TESC with the Colonomics Patient Cohort

As represented in Figure 8, expression levels of two genes, MMP3 and TESC, were validated in an additional transcriptomic dataset, consisting of 98 paired adjacent mucosa and tumor tissues from colorectal cancer patients and 50 colon mucosa from healthy donors. Compared with normal mucosa or normal adjacent tissue, expression levels of MMP3 and TESC were significantly increased in colon cancer.

3.6. MMP3 and TESC Protein Expression Levels

Additional analysis was performed to validate the mRNA expression levels for MMP3 and TESC at the protein level (Figure 9), revealing an overexpression at the protein level. The data is in agreement with those from the mRNA level.

3.7. IPA Network Analysis

The main canonical pathways generated using IPA based on the top 25 upregulated and downregulated genes in COAD are related to Granulocyte Adhesion and Diapedesis, Leukocyte Extravasation Signaling, Agranulocyte Adhesion, and Diapedesis or Inhibition of Matrix Metalloproteases (Figure 10A). Using the same data set for analysis, the top associated networks were generated, as displayed in Table 2. The network N1 (related to Post-Translational Modification, Protein Degradation, and Protein Synthesis) is displayed in Figure 10B, revealing the MMPs as a core element of this network. Additional graphical representation of the N4 network (related to Cell Cycle, Cancer, and Neurological Disease), revealing TESC’s direct relationship with HIT and HRAS, as displayed in Figure 10B. Additional valuable data related to the prognostic value and main target molecules for the altered genes are displayed in Table 2. Additional IPA regulator networks are presented in Figure 11, and the Top Molecular and Cellular Functions generated using IPA are displayed in Table S2.

4. Discussion

The initiation and progression of COAD involve important alterations at the transcriptomic level [18,31]. The TCGA cohort is an open-access database, comprising 34 types of cancer tissue and normal tissue. In our study, we extracted the top 25 upregulated and top 25 downregulated coding genes in COAD to assess their prediction of the overall survival rate. For further analysis, we selected two key genes involved in epithelial to mesenchymal transition and angiogenesis (MMP3) and a potential oncotarget (TESC), for which the previous data found in the literature correlated with our findings. Both genes, MMP3 and TESC, were correlated with overall survival rate according to the Starbase online tool. We compared the level of expression of these two genes with other cancers where they appear with a dysregulated expression compared to normal epithelial cells of the colon. A pan-cancer view of the expression levels for MMP3 and TESC downloaded from UALCAN displays interesting aspects related to these genes in solid cancer (Figure 12). MMP3 was found to have a prognostic role in pancreatic cancer and cervical cancer, while TESC showed no prognostic role in investigated cancers. TESC was also proposed as an oncotarget. Furthermore, TESC was investigated in a patient’s cohort by Kang et al., revealing that the cases with overexpression of TESC are related to reduced survival compared to the cases displaying high expression value; this study proposes TESC as a potential diagnostic marker in colorectal cancer, due to a high difference in the expression level between normal tissue and tumor tissue. The authors show inhibition of TESC decreases cell survival in vitro conditions [32].
The matrix metalloproteinases (MMPs) family consists of at least 24 calcium-dependent, zinc-containing endopeptidases. The pattern of these proteins in cancer is dependent on the MMP variant and the type of cancer [33,34]. MMPs belong to a large group of proteases capable of breaking all components of the extracellular matrix, being involved in all steps of tumorigenesis, cancer invasion, and metastasis [35,36,37,38,39,40,41,42]. MMP3, along with CXCL1, is considered an important stromal protein marker of the dysplasia–carcinoma transition in sporadic colorectal cancer [43]. Moreover, MMP3 is one of the colorectal cancer biomarkers related to the inflammatory microenvironment [44].
In several cancer types, MMP3 is considered a biomarker alone or in combination with other molecules [14,19,37,38,41,42,45,46,47,48]. Tumor cells typically express a high level of different MMPs [33,37,38]. As previously shown, MMP1, -3, -7, -9, -10, -11, -12, and -14 are upregulated in COAD samples [38,39]. Expression levels of MMP-1, -2, -7, -9, and -13 were observed to be related to worse outcomes; meanwhile, in the case of MMP-12, expression was observed to have a protective role [37].
MMP3, coding stromelysin-1, is upregulated in colon cancers [33] and its expression level affects the survival of patients with colon adenocarcinoma [14], also confirmed by the TCGA data presented in Figure 2. MMP3 has an important role in COAD tumor growth and metastasis [33]. Another study revealed that C/EBPβ upregulation was correlated with MMP3 expression and it is associated with metastatic status in colorectal cancer [49]. IPA data has revealed MMP3 to be involved in cellular movement along with other altered genes in COAD.
The prognostic value of MMP3 shows a divergence between different databases. This is possible because the cellular source of a specific MMP might have an impact on the biological outcome related to its expression [19,50].
TESC (Tescalcin) regulates the activities of the Na+/H+ exchanger and is related to the activation of the extracellular signal-regulated kinase (ERK) cascade to the expression of transcription factors that control cell growth and differentiation [51]. TESC is altered in several cancers [51]; TESC expression promotes the invasive and metastatic effects of colorectal cancer [52]. TESC was observed to be overexpressed in tumor tissue, as it was shown based on TCGA data, but also in serum from colorectal cancer patients, underlining its oncogenic role in this pathology [52], with prognostic significance in several other cancer types such as hepatocellular carcinoma [53] and gastric cancer [54]. TESC is overexpressed in colorectal cancer (CRC), but not in normal mucosa and premalignant dysplastic lesions, the high expression levels being related to an increased cell proliferation rate, invasiveness, and metastatic features [32,52,55]. TESC is presented as a potential oncotarget in colon adenocarcinoma, as revealed in data found by Kand et al., who indicated that depletion of TESC in this cancer type results in decreased tumor growth [32].
The genomic landscapes result from a combination of multiple overlapping mutational processes, making their deconvolution from genomic data a difficult challenge [56]. According to the analysis using cBioportal, based on TCGA data (Figure 7), we can observe that MMP3 and TESC have a low mutation rate, versus TP53, which has a higher mutation rate in COAD, as we observed in a previous study [5]. Additionally, in colorectal cancers, the presence of specific MMP3 polymorphisms was observed [57].
Alteration of genes involved in post-translational modification, protein degradation, and protein synthesis can lead to important structural alterations in existing proteins that participate in multiple biological processes [58]. Additionally, studies related to these alterations will have an important role in the immune recognition of tumor therapy [58].
The limitation of the present study is related to the type of analysis based on conclusions drawn from bioinformatics and analysis of previous experimental results. Even so, data generated by bioinformatics tools have an important advantage for cancer with a high number of cases, as all platforms collect a higher number of samples associated with clinical data and pathological data. In addition, analytical methods such as IPA applied in the present study revealed an important role in Post-Translational Modification, Protein Degradation, and Protein Synthesis in COAD, where an important element of this network is MMP3, a gene correlated with overall survival. Another important network was related to the cell cycle, with the TESC gene being a key component of this network. Our studies provide the clue that bioinformatics strategies could identify key genes associated with the pathogenesis of COAD, which can be exploited as biomarker candidates or therapeutic targets. However, these data alone do not provide sufficient insights into patient prognosis or treatment. Therefore, other molecular data should be considered in combination with our candidate genes for further understanding of COAD and to improve patient care.

5. Conclusions

An analysis of the top 25 upregulated and downregulated genes that were screened for the prediction of the overall survival rate in COAD was performed. Thus, we were able to identify two key genes (MMP3 and TESC) that may be associated with the prognosis of patients with COAD. Additional validation of the expression levels for MMP3 and TESC on the colonomics data set was subsequently performed. Additional validation studies in the large patient cohort will decipher the role of the two genes and will bring novel insights regarding stage correlation with expression level and hallmarks of cancer where these genes could serve as potential biomarkers and oncotargets. At the time when this study was performed, limited information about both genes was provided by studies done on patients with colon adenocarcinoma, leaving a lot of space for validation or discoveries about their potential value in different cancers.
IPA network analysis revealed further insights into the MMP3 and TESC profiles and provides a basis to investigate the regulatory mechanisms involved in COAD research, particularly in the context of the tumor microenvironment.

Supplementary Materials

The following supporting information can be downloaded at: https://www.mdpi.com/article/10.3390/biomedinformatics2030030/s1, Table S1: Top 25 upregulated and top 25 downregulated genes in COAD; Table S2. Main biomarkers application and target drugs, downloaded from IPA.

Author Contributions

Conceptualization, investigation, and writing—original draft preparation C.B. (Constantin Busuioc), A.N. and C.B. (Cornelia Braicu); O.Z., M.T. and I.B.-N., writing—review and editing. All authors have read and agreed to the published version of the manuscript.

Funding

Our work was part of the following projects: H2020-MSCA-RISE-2019- Grant Agreement no.: 872391—“DevelOpmeNt of Cancer RNA TherapEutic”—cONCReTE and H2020-MSCA-RISE-2018 No. 824036/2019‘Excellence in research and development of non-coding RNA DIAGnostics in Oncology’ (RNADIAGON).

Institutional Review Board Statement

Not applicable.

Informed Consent Statement

Not applicable.

Data Availability Statement

Not applicable.

Conflicts of Interest

The authors declare no conflict of interest.

References

  1. Yue, F.R.; Wei, Z.B.; Yan, R.Z.; Guo, Q.H.; Liu, B.; Zhang, J.H.; Li, Z. SMYD3 promotes colon adenocarcinoma (COAD) progression by mediating cell proliferation and apoptosis. Exp. Ther. Med. 2020, 20, 11. [Google Scholar] [CrossRef] [PubMed]
  2. Sung, H.; Ferlay, J.; Siegel, R.L.; Laversanne, M.; Soerjomataram, I.; Jemal, A.; Bray, F. Global Cancer Statistics 2020: GLOBOCAN Estimates of Incidence and Mortality Worldwide for 36 Cancers in 185 Countries. CA Cancer J. Clin. 2021, 71, 209–249. [Google Scholar] [CrossRef] [PubMed]
  3. Schliemann, D.; Ramanathan, K.; Matovu, N.; O’Neill, C.; Kee, F.; Su, T.T.; Donnelly, M. The implementation of colorectal cancer screening interventions in low-and middle-income countries: A scoping review. BMC Cancer 2021, 21, 1125. [Google Scholar] [CrossRef]
  4. Gurzu, S.; Silveanu, C.; Fetyko, A.; Butiurca, V.; Kovacs, Z.; Jung, I. Systematic review of the old and new concepts in the epithelial-mesenchymal transition of colorectal cancer. World J. Gastroenterol. 2016, 22, 6764–6775. [Google Scholar] [CrossRef]
  5. Busuioc, C.; Ciocan-Cartita, C.A.; Braicu, C.; Zanoaga, O.; Raduly, L.; Trif, M.; Muresan, M.S.; Ionescu, C.; Stefan, C.; Crivii, C.; et al. Epithelial-Mesenchymal Transition Gene Signature Related to Prognostic in Colon Adenocarcinoma. J. Pers. Med. 2021, 11, 476. [Google Scholar] [CrossRef]
  6. Nguyen, H.T.; Duong, H.Q. The molecular characteristics of colorectal cancer: Implications for diagnosis and therapy. Oncol. Lett. 2018, 16, 9–18. [Google Scholar] [CrossRef]
  7. Gurzu, S.; Banias, L.; Kovacs, Z.; Jung, I. Epithelial-mesenchymal transition of tumor budding in colorectal cancer: The mystery of CD44-positive stromal cells. Hum. Pathol. 2018, 71, 168–169. [Google Scholar] [CrossRef]
  8. Cojocneanu, R.; Braicu, C.; Raduly, L.; Jurj, A.; Zanoaga, O.; Magdo, L.; Irimie, A.; Muresan, M.S.; Ionescu, C.; Grigorescu, M.; et al. Plasma and Tissue Specific miRNA Expression Pattern and Functional Analysis Associated to Colorectal Cancer Patients. Cancers 2020, 12, 843. [Google Scholar] [CrossRef]
  9. Ionescu, C.; Braicu, C.; Chiorean, R.; Cojocneanu Petric, R.; Neagoe, E.; Pop, L.; Chira, S.; Berindan-Neagoe, I. TIMP-1 expression in human colorectal cancer is associated with SMAD3 gene expression levels: A pilot study. J. Gastrointestin. Liver Dis. 2014, 23, 413–418. [Google Scholar] [CrossRef]
  10. Tomuleasa, C.; Braicu, C.; Irimie, A.; Craciun, L.; Berindan-Neagoe, I. Nanopharmacology in translational hematology and oncology. Int. J. Nanomed. 2014, 9, 3465–3479. [Google Scholar] [CrossRef] [Green Version]
  11. Jurj, A.; Zanoaga, O.; Braicu, C.; Lazar, V.; Tomuleasa, C.; Irimie, A.; Berindan-Neagoe, I. A Comprehensive Picture of Extracellular Vesicles and Their Contents. Molecular Transfer to Cancer Cells. Cancers 2020, 12, 298. [Google Scholar] [CrossRef]
  12. Alajez, N.M. Large-Scale Analysis of Gene Expression Data Reveals a Novel Gene Expression Signature Associated with Colorectal Cancer Distant Recurrence. PLoS ONE 2016, 11, e0167455. [Google Scholar] [CrossRef]
  13. Bochis, O.V.; Irimie, A.; Pichler, M.; Berindan-Neagoe, I. The role of Skp2 and its substrate CDKN1B (p27) in colorectal cancer. J. Gastrointestin. Liver Dis. 2015, 24, 225–234. [Google Scholar] [CrossRef]
  14. Zeng, C.; Chen, Y. HTR1D, TIMP1, SERPINE1, MMP3 and CNR2 affect the survival of patients with colon adenocarcinoma. Oncol. Lett. 2019, 18, 2448–2454. [Google Scholar] [CrossRef]
  15. Weinstein, J.N.; Collisson, E.A.; Mills, G.B.; Shaw, K.R.; Ozenberger, B.A.; Ellrott, K.; Shmulevich, I.; Sander, C.; Stuart, J.M. The Cancer Genome Atlas Pan-Cancer analysis project. Nat. Genet. 2013, 45, 1113–1120. [Google Scholar] [CrossRef]
  16. Wang, Y.; Gao, X.; Ru, X.; Sun, P.; Wang, J. Identification of gene signatures for COAD using feature selection and Bayesian network approaches. Sci. Rep. 2022, 12, 8761. [Google Scholar] [CrossRef]
  17. Lin, J.; Cao, Z.; Yu, D.; Cai, W. Identification of Transcription Factor-Related Gene Signature and Risk Score Model for Colon Adenocarcinoma. Front. Genet. 2021, 12, 709133. [Google Scholar] [CrossRef]
  18. Sanz-Pamplona, R.; Berenguer, A.; Cordero, D.; Molleví, D.G.; Crous-Bou, M.; Sole, X.; Paré-Brunet, L.; Guino, E.; Salazar, R.; Santos, C.; et al. Aberrant gene expression in mucosa adjacent to tumor reveals a molecular crosstalk in colon cancer. Mol. Cancer 2014, 13, 46. [Google Scholar] [CrossRef]
  19. Buttacavoli, M.; Di Cara, G.; Roz, E.; Pucci-Minafra, I.; Feo, S.; Cancemi, P. Integrated Multi-Omics Investigations of Metalloproteinases in Colon Cancer: Focus on MMP2 and MMP9. Int. J. Mol. Sci. 2021, 22, 12389. [Google Scholar] [CrossRef]
  20. Available online: https://www.colonomics.org (accessed on 28 August 2022).
  21. Chandrashekar, D.S.; Bashel, B.; Balasubramanya, S.A.H.; Creighton, C.J.; Ponce-Rodriguez, I.; Chakravarthi, B.; Varambally, S. UALCAN: A Portal for Facilitating Tumor Subgroup Gene Expression and Survival Analyses. Neoplasia 2017, 19, 649–658. [Google Scholar] [CrossRef]
  22. Chandrashekar, D.S.; Karthikeyan, S.K.; Korla, P.K.; Patel, H.; Shovon, A.R.; Athar, M.; Netto, G.J.; Qin, Z.S.; Kumar, S.; Manne, U.; et al. UALCAN: An update to the integrated cancer data analysis platform. Neoplasia 2022, 25, 18–27. [Google Scholar] [CrossRef]
  23. Sun, Q.; Li, M.; Wang, X. The Cancer Omics Atlas: An integrative resource for cancer omics annotations. BMC Med. Genom. 2018, 11, 63. [Google Scholar] [CrossRef]
  24. Li, J.-H.; Liu, S.; Zhou, H.; Qu, L.-H.; Yang, J.-H. starBase v2.0: Decoding miRNA-ceRNA, miRNA-ncRNA and protein–RNA interaction networks from large-scale CLIP-Seq data. Nucleic Acids Res. 2014, 42, D92–D97. [Google Scholar] [CrossRef] [PubMed]
  25. Zhou, K.R.; Liu, S.; Cai, L.; Bin, L. ENCORI: The Encyclopedia of RNA Interactomes. Available online: http://starbase.sysu.edu.cn/index.php (accessed on 20 August 2022).
  26. Cerami, E.; Gao, J.; Dogrusoz, U.; Gross, B.E.; Sumer, S.O.; Aksoy, B.A.; Jacobsen, A.; Byrne, C.J.; Heuer, M.L.; Larsson, E.; et al. The cBio cancer genomics portal: An open platform for exploring multidimensional cancer genomics data. Cancer Discov. 2012, 2, 401–404. [Google Scholar] [CrossRef]
  27. Chen, F.; Chandrashekar, D.S.; Varambally, S.; Creighton, C.J. Pan-cancer molecular subtypes revealed by mass-spectrometry-based proteomic characterization of more than 500 human cancers. Nature Commun. 2019, 10, 5679. [Google Scholar] [CrossRef] [PubMed]
  28. Krämer, A.; Green, J.; Pollard, J., Jr.; Tugendreich, S. Causal analysis approaches in Ingenuity Pathway Analysis. Bioinformatics 2014, 30, 523–530. [Google Scholar] [CrossRef]
  29. Li, B.; Severson, E.; Pignon, J.C.; Zhao, H.; Li, T.; Novak, J.; Jiang, P.; Shen, H.; Aster, J.C.; Rodig, S.; et al. Comprehensive analyses of tumor immunity: Implications for cancer immunotherapy. Genome Biol. 2016, 17, 174. [Google Scholar] [CrossRef]
  30. Li, T.; Fu, J.; Zeng, Z.; Cohen, D.; Li, J.; Chen, Q.; Li, B.; Liu, X.S. TIMER2.0 for analysis of tumor-infiltrating immune cells. Nucleic Acids Res. 2020, 48, W509–W514. [Google Scholar] [CrossRef]
  31. Sharma, A.; Yadav, D.; Rao, P.; Sinha, S.; Goswami, D.; Rawal, R.M.; Shrivastava, N. Identification of potential therapeutic targets associated with diagnosis and prognosis of colorectal cancer patients based on integrated bioinformatics analysis. Comput. Biol. Med. 2022, 146, 105688. [Google Scholar] [CrossRef]
  32. Kang, Y.H.; Han, S.R.; Kim, J.T.; Lee, S.J.; Yeom, Y.I.; Min, J.K.; Lee, C.H.; Kim, J.W.; Yoon, S.R.; Yoon, D.Y.; et al. The EF-hand calcium-binding protein tescalcin is a potential oncotarget in colorectal cancer. Oncotarget 2014, 5, 2149–2160. [Google Scholar] [CrossRef] [Green Version]
  33. Liang, M.; Wang, J.; Wu, C.; Wu, M.; Hu, J.; Dai, J.; Ruan, H.; Xiong, S.; Dong, C. Targeting matrix metalloproteinase MMP3 greatly enhances oncolytic virus mediated tumor therapy. Transl. Oncol. 2021, 14, 101221. [Google Scholar] [CrossRef] [PubMed]
  34. Curran, S.; Murray, G.I. Matrix metalloproteinases: Molecular aspects of their roles in tumour invasion and metastasis. Eur. J. Cancer 2000, 36, 1621–1630. [Google Scholar] [CrossRef]
  35. Zinzindohoué, F.; Lecomte, T.; Ferraz, J.M.; Houllier, A.M.; Cugnenc, P.H.; Berger, A.; Blons, H.; Laurent-Puig, P. Prognostic significance of MMP-1 and MMP-3 functional promoter polymorphisms in colorectal cancer. Clin. Cancer Res. 2005, 11, 594–599. [Google Scholar] [CrossRef]
  36. Chen, H.; Ye, Y.; Yang, Y.; Zhong, M.; Gu, L.; Han, Z.; Qiu, J.; Liu, Z.; Qiu, X.; Zhuang, G. TIPE-mediated up-regulation of MMP-9 promotes colorectal cancer invasion and metastasis through MKK-3/p38/NF-κB pro-oncogenic signaling pathway. Signal Transduct. Target. Ther. 2020, 5, 163. [Google Scholar] [CrossRef]
  37. Pezeshkian, Z.; Nobili, S.; Peyravian, N.; Shojaee, B.; Nazari, H.; Soleimani, H.; Asadzadeh-Aghdaei, H.; Ashrafian Bonab, M.; Nazemalhosseini-Mojarad, E.; Mini, E. Insights into the Role of Matrix Metalloproteinases in Precancerous Conditions and in Colorectal Cancer. Cancers 2021, 13, 6226. [Google Scholar] [CrossRef] [PubMed]
  38. Yu, J.; He, Z.; He, X.; Luo, Z.; Lian, L.; Wu, B.; Lan, P.; Chen, H. Comprehensive Analysis of the Expression and Prognosis for MMPs in Human Colorectal Cancer. Front. Oncol. 2021, 11. [Google Scholar] [CrossRef]
  39. Baker, E.A.; Bergin, F.G.; Leaper, D.J. Matrix metalloproteinases, their tissue inhibitors and colorectal cancer staging. Br. J. Surg. 2000, 87, 1215–1221. [Google Scholar] [CrossRef]
  40. Coussens, L.M.; Fingleton, B.; Matrisian, L.M. Matrix metalloproteinase inhibitors and cancer: Trials and tribulations. Science 2002, 295, 2387–2392. [Google Scholar] [CrossRef]
  41. Honda, T.; Yamamoto, I.; Inagawa, H. Angiogenesis-, Metastasis- and Signaling Pathway-related Factor Dynamics in Human Colon Cancer Cells Following Interaction with Monocytes. Anticancer Res. 2013, 33, 2895–2900. [Google Scholar]
  42. Gobin, E.; Bagwell, K.; Wagner, J.; Mysona, D.; Sandirasegarane, S.; Smith, N.; Bai, S.; Sharma, A.; Schleifer, R.; She, J.-X. A pan-cancer perspective of matrix metalloproteases (MMP) gene expression profile and their diagnostic/prognostic potential. BMC Cancer 2019, 19, 581. [Google Scholar] [CrossRef]
  43. Sipos, F.; Germann, T.M.; Wichmann, B.; Galamb, O.; Spisák, S.; Krenács, T.; Tulassay, Z.; Molnár, B.; Műzes, G. MMP3 and CXCL1 are potent stromal protein markers of dysplasia-carcinoma transition in sporadic colorectal cancer. Eur. J. Cancer Prev. 2014, 23, 336–343. [Google Scholar] [CrossRef] [PubMed]
  44. Calu, V.; Ionescu, A.; Stanca, L.; Geicu, O.I.; Iordache, F.; Pisoschi, A.M.; Serban, A.I.; Bilteanu, L. Key biomarkers within the colorectal cancer related inflammatory microenvironment. Sci. Rep. 2021, 11, 7940. [Google Scholar] [CrossRef] [PubMed]
  45. Wen, Y.; Zhang, X.; Li, X.; Tian, L.; Shen, S.; Ma, J.; Ai, F. Histone deacetylase (HDAC) 11 inhibits matrix metalloproteinase (MMP) 3 expression to suppress colorectal cancer metastasis. J. Cancer 2022, 13, 1923–1932. [Google Scholar] [CrossRef]
  46. Mehner, C.; Miller, E.; Khauv, D.; Nassar, A.; Oberg, A.L.; Bamlet, W.R.; Zhang, L.; Waldmann, J.; Radisky, E.S.; Crawford, H.C.; et al. Tumor cell-derived MMP3 orchestrates Rac1b and tissue alterations that promote pancreatic adenocarcinoma. Mol. Cancer Res. 2014, 12, 1430–1439. [Google Scholar] [CrossRef] [PubMed]
  47. El-Sharkawi, F.; El Sabah, M.; Hassan, Z.; Khaled, H. The biochemical value of urinary metalloproteinases 3 and 9 in diagnosis and prognosis of bladder cancer in Egypt. J. Biomed. Sci. 2014, 21, 72. [Google Scholar] [CrossRef]
  48. Ligi, D.; Mannello, F. Do matrix metalloproteinases represent reliable circulating biomarkers in colorectal cancer? Br. J. Cancer 2016, 115, 633–634. [Google Scholar] [CrossRef]
  49. Ji, Y.; Li, J.; Li, P.; Wang, L.; Yang, H.; Jiang, G. C/EBPβ Promotion of MMP3-Dependent Tumor Cell Invasion and Association with Metastasis in Colorectal Cancer. Genet. Test Mol. Biomark. 2018, 22, 5–10. [Google Scholar] [CrossRef]
  50. Piskór, B.M.; Przylipiak, A.; Dąbrowska, E.; Niczyporuk, M.; Ławicki, S. Matrilysins and Stromelysins in Pathogenesis and Diagnostics of Cancers. Cancer Manag. Res. 2020, 12, 10949–10964. [Google Scholar] [CrossRef]
  51. Kolobynina, K.G.; Solovyova, V.V.; Levay, K.; Rizvanov, A.A.; Slepak, V.Z. Emerging roles of the single EF-hand Ca2+ sensor tescalcin in the regulation of gene expression, cell growth and differentiation. J. Cell Sci. 2016, 129, 3533–3540. [Google Scholar] [CrossRef]
  52. Kang, J.; Kang, Y.H.; Oh, B.M.; Uhm, T.G.; Park, S.Y.; Kim, T.W.; Han, S.R.; Lee, S.J.; Lee, Y.; Lee, H.G. Tescalcin expression contributes to invasive and metastatic activity in colorectal cancer. Tumour. Biol. 2016, 37, 13843–13853. [Google Scholar] [CrossRef]
  53. Zhou, Z.-G.; Chen, J.-B.; Zhang, R.-X.; Ye, L.; Wang, J.-C.; Pan, Y.-X.; Wang, X.-H.; Li, W.-X.; Zhang, Y.-J.; Xu, L.; et al. Tescalcin is an unfavorable prognosis factor that regulats cell proliferation and survival in hepatocellular carcinoma patients. Cancer Commun. 2020, 40, 355–369. [Google Scholar] [CrossRef] [PubMed]
  54. Kim, T.W.; Han, S.R.; Kim, J.T.; Yoo, S.M.; Lee, M.S.; Lee, S.H.; Kang, Y.H.; Lee, H.G. Differential expression of tescalcin by modification of promoter methylation controls cell survival in gastric cancer cells. Oncol. Rep. 2019, 41, 3464–3474. [Google Scholar] [CrossRef] [PubMed]
  55. Lee, J.H.; Choi, S.I.; Kim, R.K.; Cho, E.W.; Kim, I.G. Tescalcin/c-Src/IGF1Rβ-mediated STAT3 activation enhances cancer stemness and radioresistant properties through ALDH1. Sci. Rep. 2018, 8, 10711. [Google Scholar] [CrossRef]
  56. Karolak, A.; Levatić, J.; Supek, F. A framework for mutational signature analysis based on DNA shape parameters. PLoS ONE 2022, 17, e0262495. [Google Scholar] [CrossRef] [PubMed]
  57. Biondi, M.L.; Turri, O.; Leviti, S.; Seminati, R.; Cecchini, F.; Bernini, M.; Ghilardi, G.; Guagnellini, E. MMP1 and MMP3 Polymorphisms in Promoter Regions and Cancer. Clin. Chem. 2000, 46, 2023–2024. [Google Scholar] [CrossRef] [PubMed]
  58. Li, W.; Li, F.; Zhang, X.; Lin, H.-K.; Xu, C. Insights into the post-translational modification and its emerging role in shaping the tumor microenvironment. Signal Transduct. Target. Ther. 2021, 6, 422. [Google Scholar] [CrossRef]
Figure 1. Flow diagram of the study design. Initial data sets from TCGA colon adenocarcinoma patients were analyzed using the UALCAN portal (comprising data from 286 tumor samples and 41 adjacent tissue), then survival analyses were performed for the top 25 upregulated and downregulated genes using the STARBASE-TCGA data set (474 tumor samples and 41 adjacent tissue). The selected genes MMP3 and TESC (based on survival analysis-STARBASE) were validated on the Colonomics database, which contains a different set of patients than TCGA. Our data from two different patient cohorts showed that both genes can be found in all stages of colon adenocarcinoma patients, that their association with overall survival is significant, and that their protein profiling confirms the mRNA level of expression in UALCAN-CPTAC. These initial data suggest that they could be indicators of colon adenocarcinoma and, due to their link with overall survival, can become therapeutic targets. Further validation on patients’ needs to be performed for data consistency.
Biomedinformatics 02 00030 g001
Figure 2. Heatmap showing patterns of most altered genes in COAD. (A) Heatmap graphical representation of the top 25 overexpressed genes, (B) top 25 under expressed genes in COAD versus adjacent normal tissue, data available from the TCGA dataset, generated by web-portal UALCAN. The expression level of genes in COAD is represented as a log2(TPM+ 1) scale.
Biomedinformatics 02 00030 g002
Figure 3. Expression levels and prognostic value of MMP3 and TESC in COAD. (A) the expression level for MMP3, graphical representation using UALCAN based on COAD TGCA data set; statistical significance was evaluated using Welch’s t-test (UALCAN interface), **** p ≤ 0.0001. (B) expression level for TESC, graphical representation using UALCAN based on the COAD TGCA data set; statistical significance was evaluated using Welch’s t-test (UALCAN interface), **** p ≤ 0.0001. (C) High expression of MMP3 indicates a better OS in COAD, using Kaplan-Meier Plotter database); (D) High expression of TESC indicates a better OS. Graphical representation of Kaplan-Meier Plotter was done using the STARBASE database). This can be explained by a lower number of patients with lymph node-positive/metastasis in the entire cohort.
Biomedinformatics 02 00030 g003
Figure 4. Pearson correlation between MMP3 and TESC expression in COAD samples (n = 471) using the STARBASE database.
Biomedinformatics 02 00030 g004
Figure 5. The relationship between MMP3 and TESC mRNA expression and cancer stages (UALCAN). Cancer stages include COAD from stage 1 to stage 4. Statistical significance was evaluated using Welch’s t-test (UALCAN interface), **** p ≤ 0.0001.
Biomedinformatics 02 00030 g005
Figure 6. The relationship between MMP3 and TESC mRNA expression and status (UALCAN) in COAD. Statistical significance was evaluated using Welch’s t-test (UALCAN interface), **** p ≤ 0.0001.
Biomedinformatics 02 00030 g006
Figure 7. Analysis of genomic alterations in the identified hub genes and their correlations with survival prognosis in COAD using cBioPortal. (A) In the genomic alterations representation of the hub genes in the selected TCGA dataset of COAD, each column represents a patient. Localization and frequency of all mutations for (B) TP53, (C) MMP3, (D) TESC, (E) MMP3 expression level in COAD based on TP53 mutation status; statistical significance was evaluated using Welch’s t-test (UALCAN interface), **** p ≤ 0.0001, (F) TESC expression level in COAD based on TP53 mutation status; statistical significance was evaluated using Welch’s t-test (UALCAN interface), **** p ≤ 0.0001.
Biomedinformatics 02 00030 g007
Figure 8. Validation of the MMP3 and TESC with the Colonomics patient cohort, p < 0.05 was considered statistically significant.
Biomedinformatics 02 00030 g008
Figure 9. MMP3 and TESC protein expression in COAD samples (comprising data from 100 normal adjacent tissue and 97 primary COAD tumors) using the CPTAC-UALCAN platform. Statistical significance was evaluated using Welch’s t-test (UALCAN interface), *** p  <  0.001 and **** p  <  0.0001.
Biomedinformatics 02 00030 g009
Figure 10. Mechanistic insights in COAD were generated based on the top 25 upregulated and downregulated genes generated using IPA. (A) Canonical pathways identified by IPA (B) Top-ranked enriched network, related to Post-Translational Modification, Protein Degradation, Protein Synthesis. (C) Network related to Cell Cycle, Cancer, and Neurological Disease. Red: significantly increased expression level; green: significantly decreased expression level. The regulators are colored by their predicted activation state: activated (orange) or inhibited (blue). Darker colors indicate higher absolute Z-scores. MMP3 and TESC are highlighted with blue circles.
Biomedinformatics 02 00030 g010
Figure 11. IPA regulator effect networks analysis of the top 25 upregulated and top 25 downregulated genes in COAD. Upstream regulators are located at the top of the network, target genes are in the middle of the network (orange color), and predicted disease or function in the bottom of the network. (A) TNF target molecule, network related to invasion of tissue and growth of epithelial tissue; (B) ERBB2 target molecule, related to the migration of cells. The data are generated using the Regulator Effects module in IPA. The MMP3 gene is highlighted with a blue circle.
Biomedinformatics 02 00030 g011
Figure 12. Multi-cancer view of the expression levels and survival analysis for MMP3 and TESC downloaded from TIMER2.0. (A) Multi-cancer view of the expression levels of MMP3. (B) Multi-cancer view of the expression levels for TESC. (C) Multi-cancer view of the correlation between overall survival with MMP3 and TESC (* p ≤ 0.05, ** p ≤ 0.01, *** p ≤ 0.001).
Biomedinformatics 02 00030 g012
Table 1. UALCAN patient’s characteristics.
DemographicsCOAD
Tumor (n = 286) Normal (n = 41)
Age—Range (years)31–90
GenderF127
M156
Unknown3
Histological subtypeAdenocarcinoma243
Mucinous adenocarcinoma37
Unknown3
Tumor stageI45
II110
III80
IV39
Unknown2
Nodal metastasis statusN0166
N170
N247
Unknown3
Table 2. Top associated networks were generated using IPA, based on the altered signature on COAD.
IDAssociated NetworkScore
N1Post-Translational Modification, Protein Degradation, Protein Synthesis32
N2Developmental Disorder, Ophthalmic Disease, Organismal Injury and Abnormalities29
N3Hereditary Disorder, Ophthalmic Disease, Organismal Injury and Abnormalities29
N4Cell Cycle, Cancer, Neurological Disease18
Publisher’s Note: MDPI stays neutral with regard to jurisdictional claims in published maps and institutional affiliations.

