

Investigating the Effectiveness of an IMU Portable Gait Analysis Device: An Application for Parkinson’s Disease Management

 , , , , , ,
Abstract
:1. Introduction
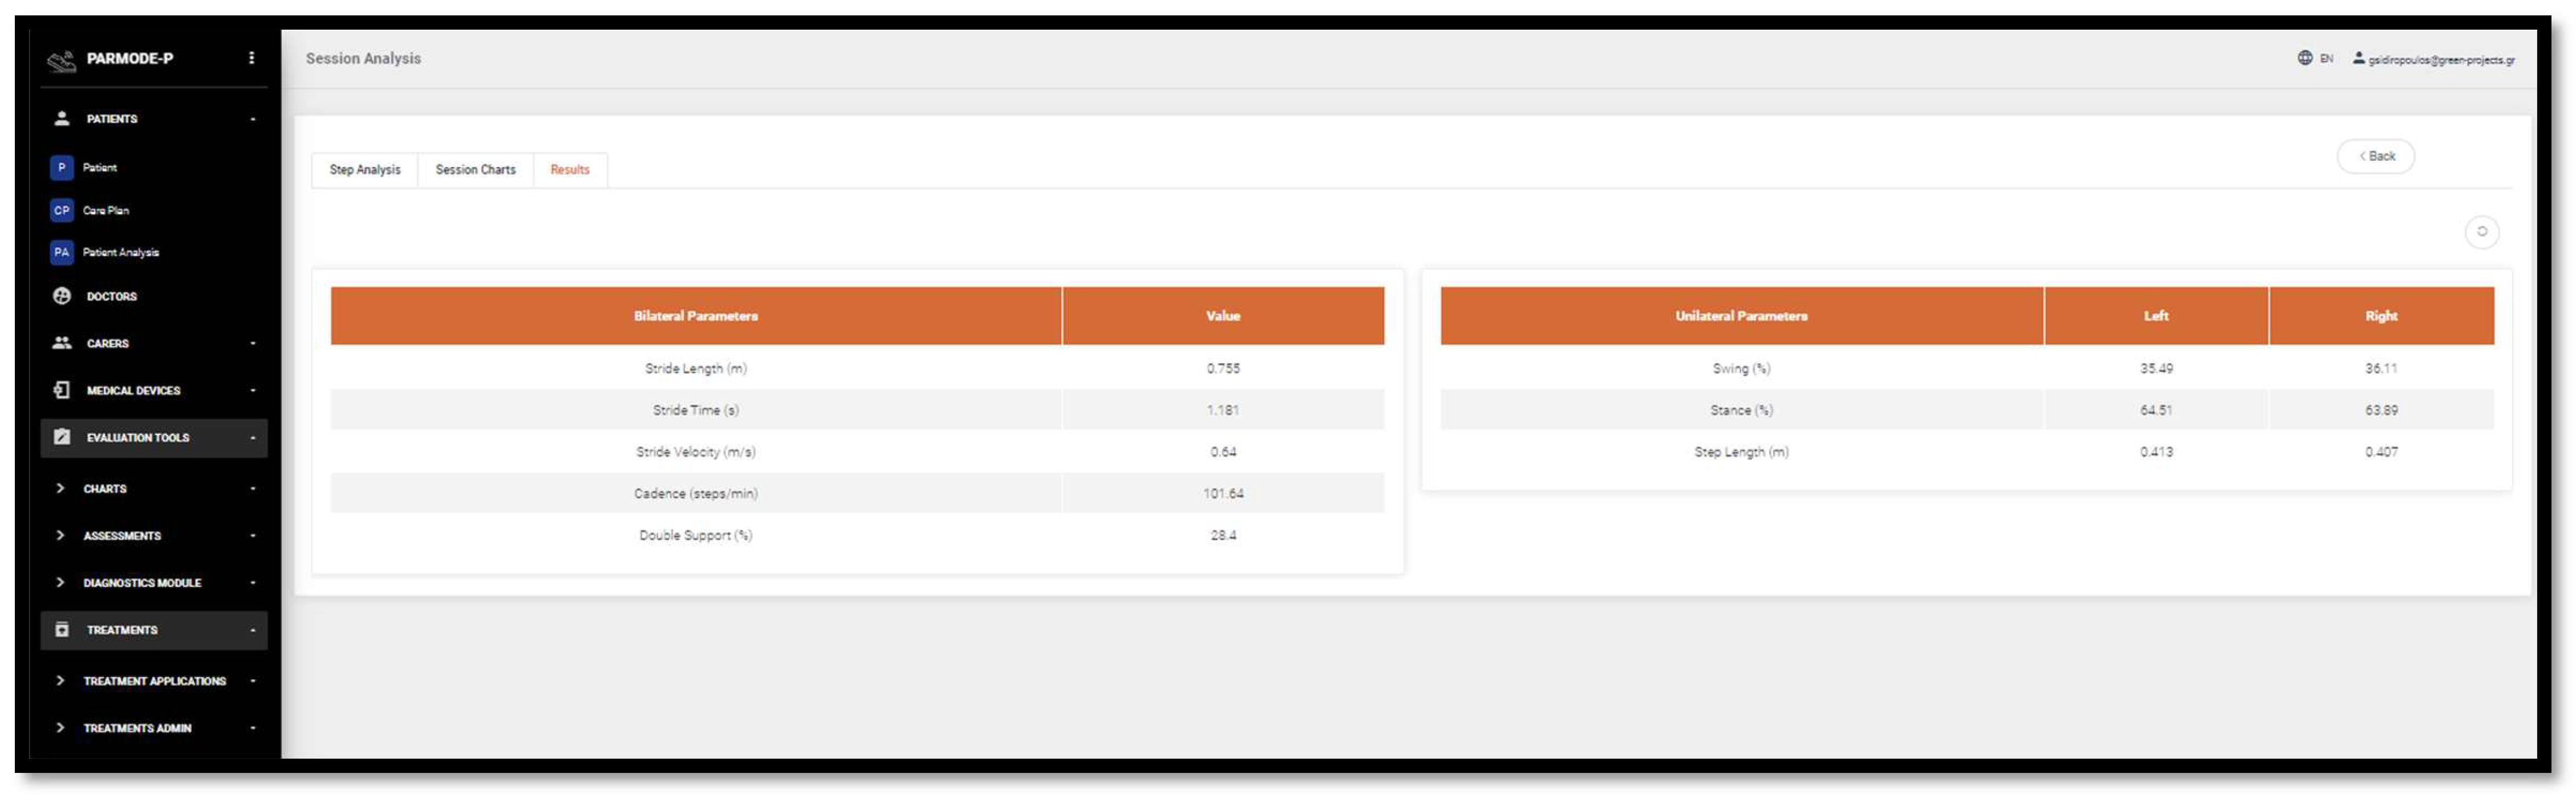
- Length of gait (m);
- Duration of gait (s);
- Speed of gait (m/s)
- Bilateral Parameters:
- Cadence (steps/min);
- Double Support (%)
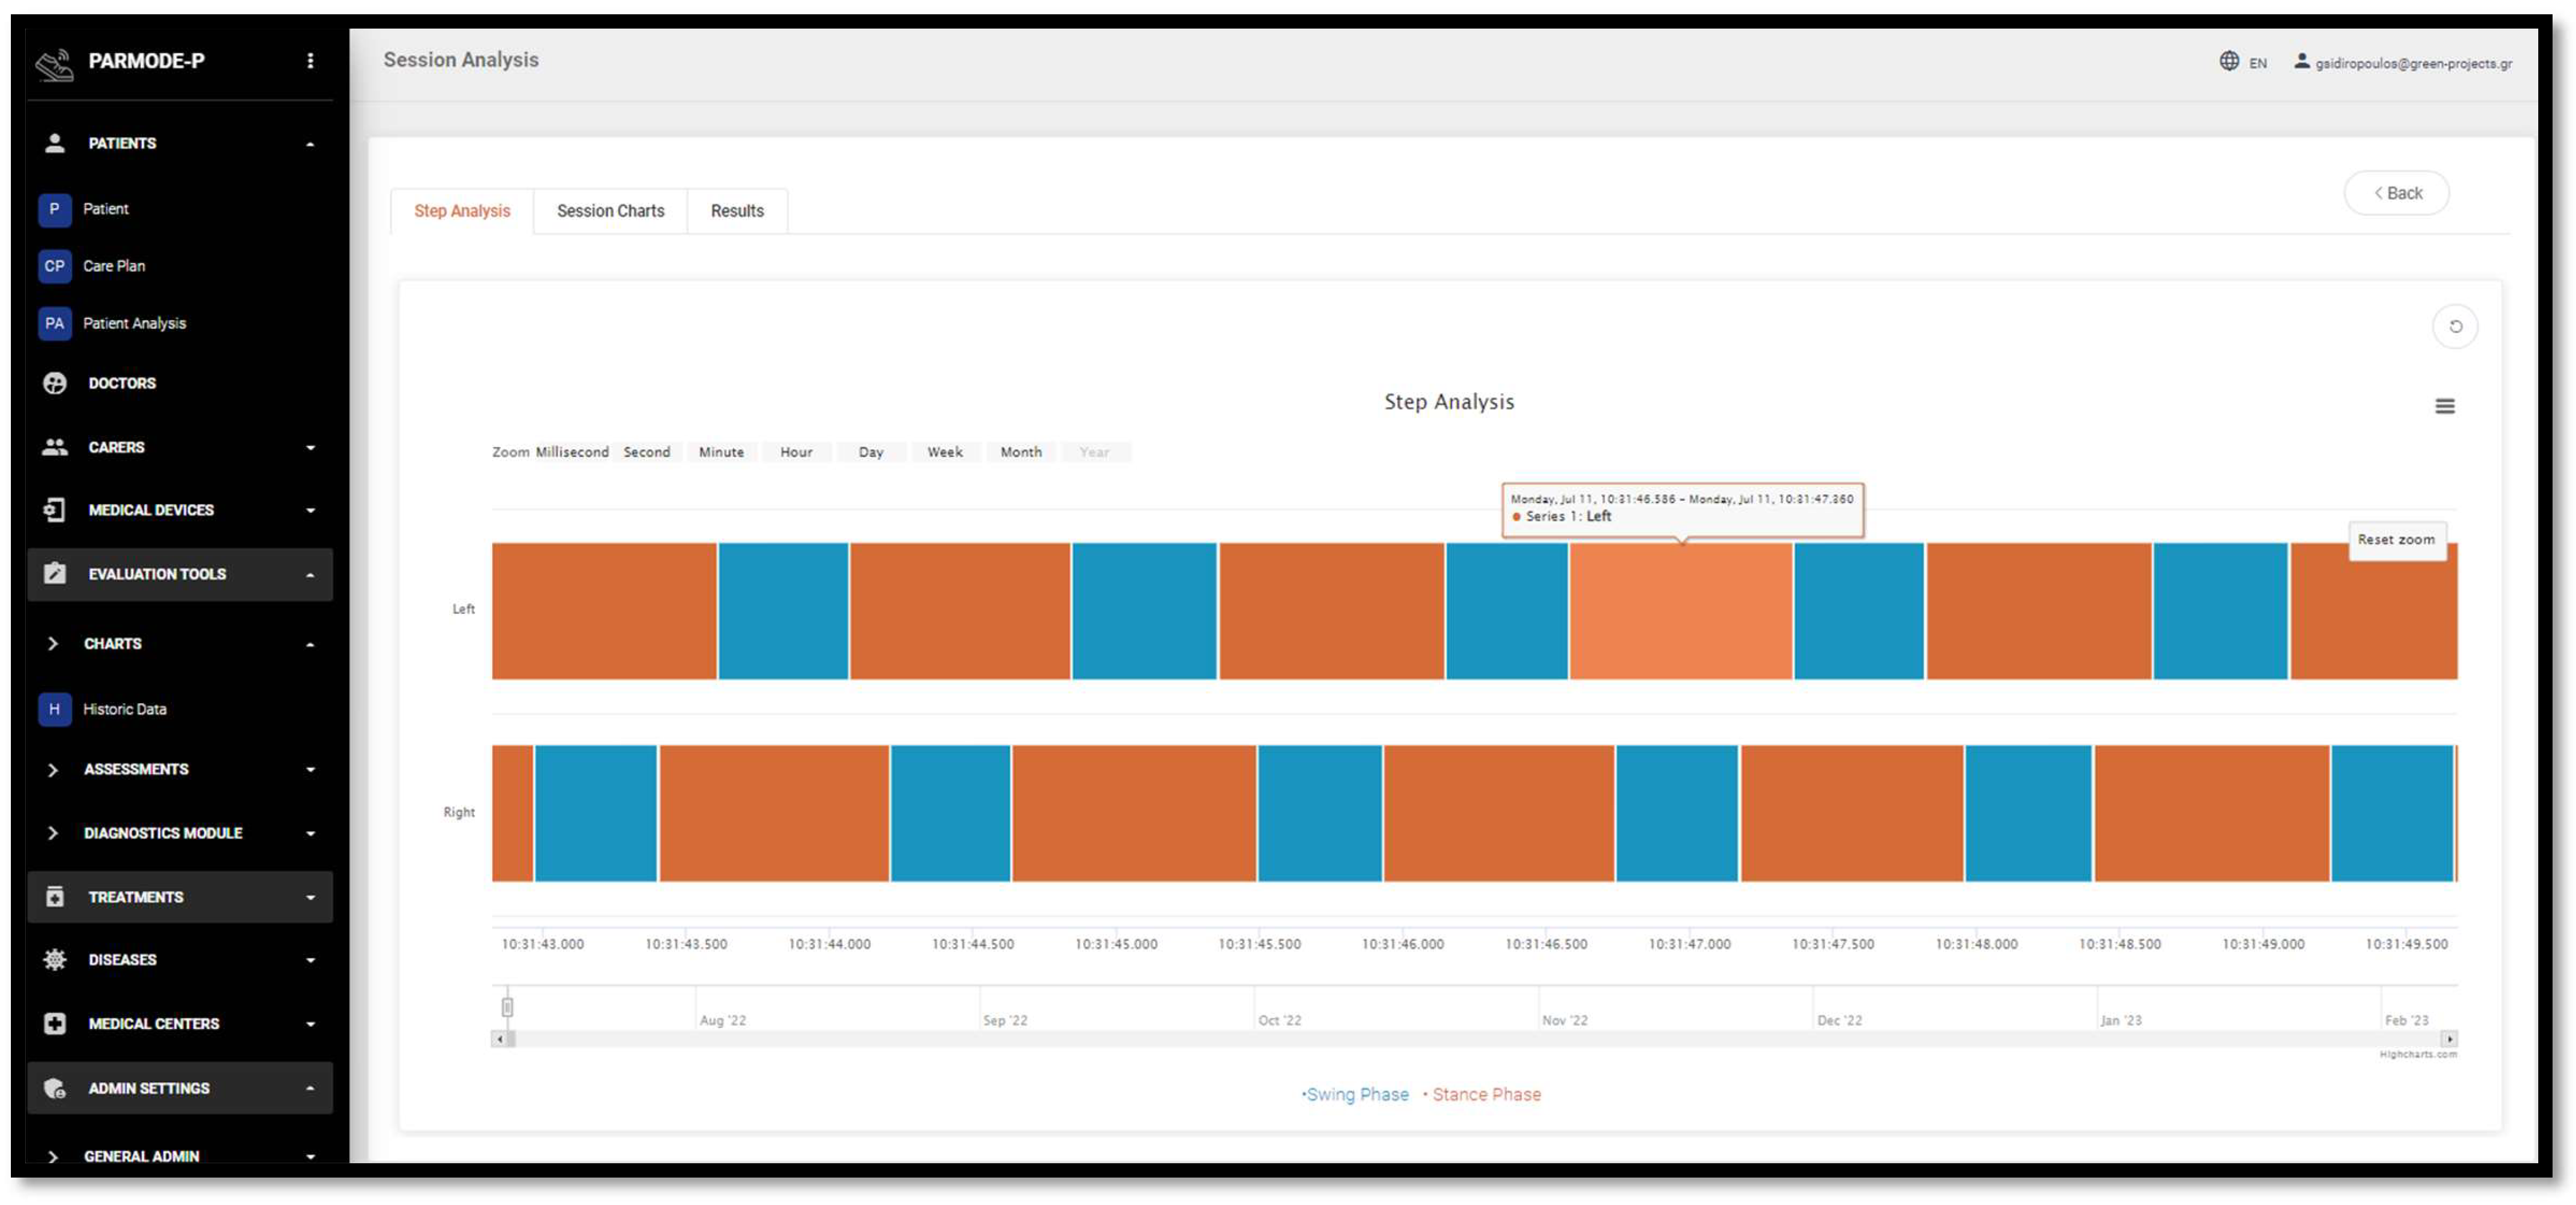
- Swing (%);
- Stance (%);
- Step Length (m)
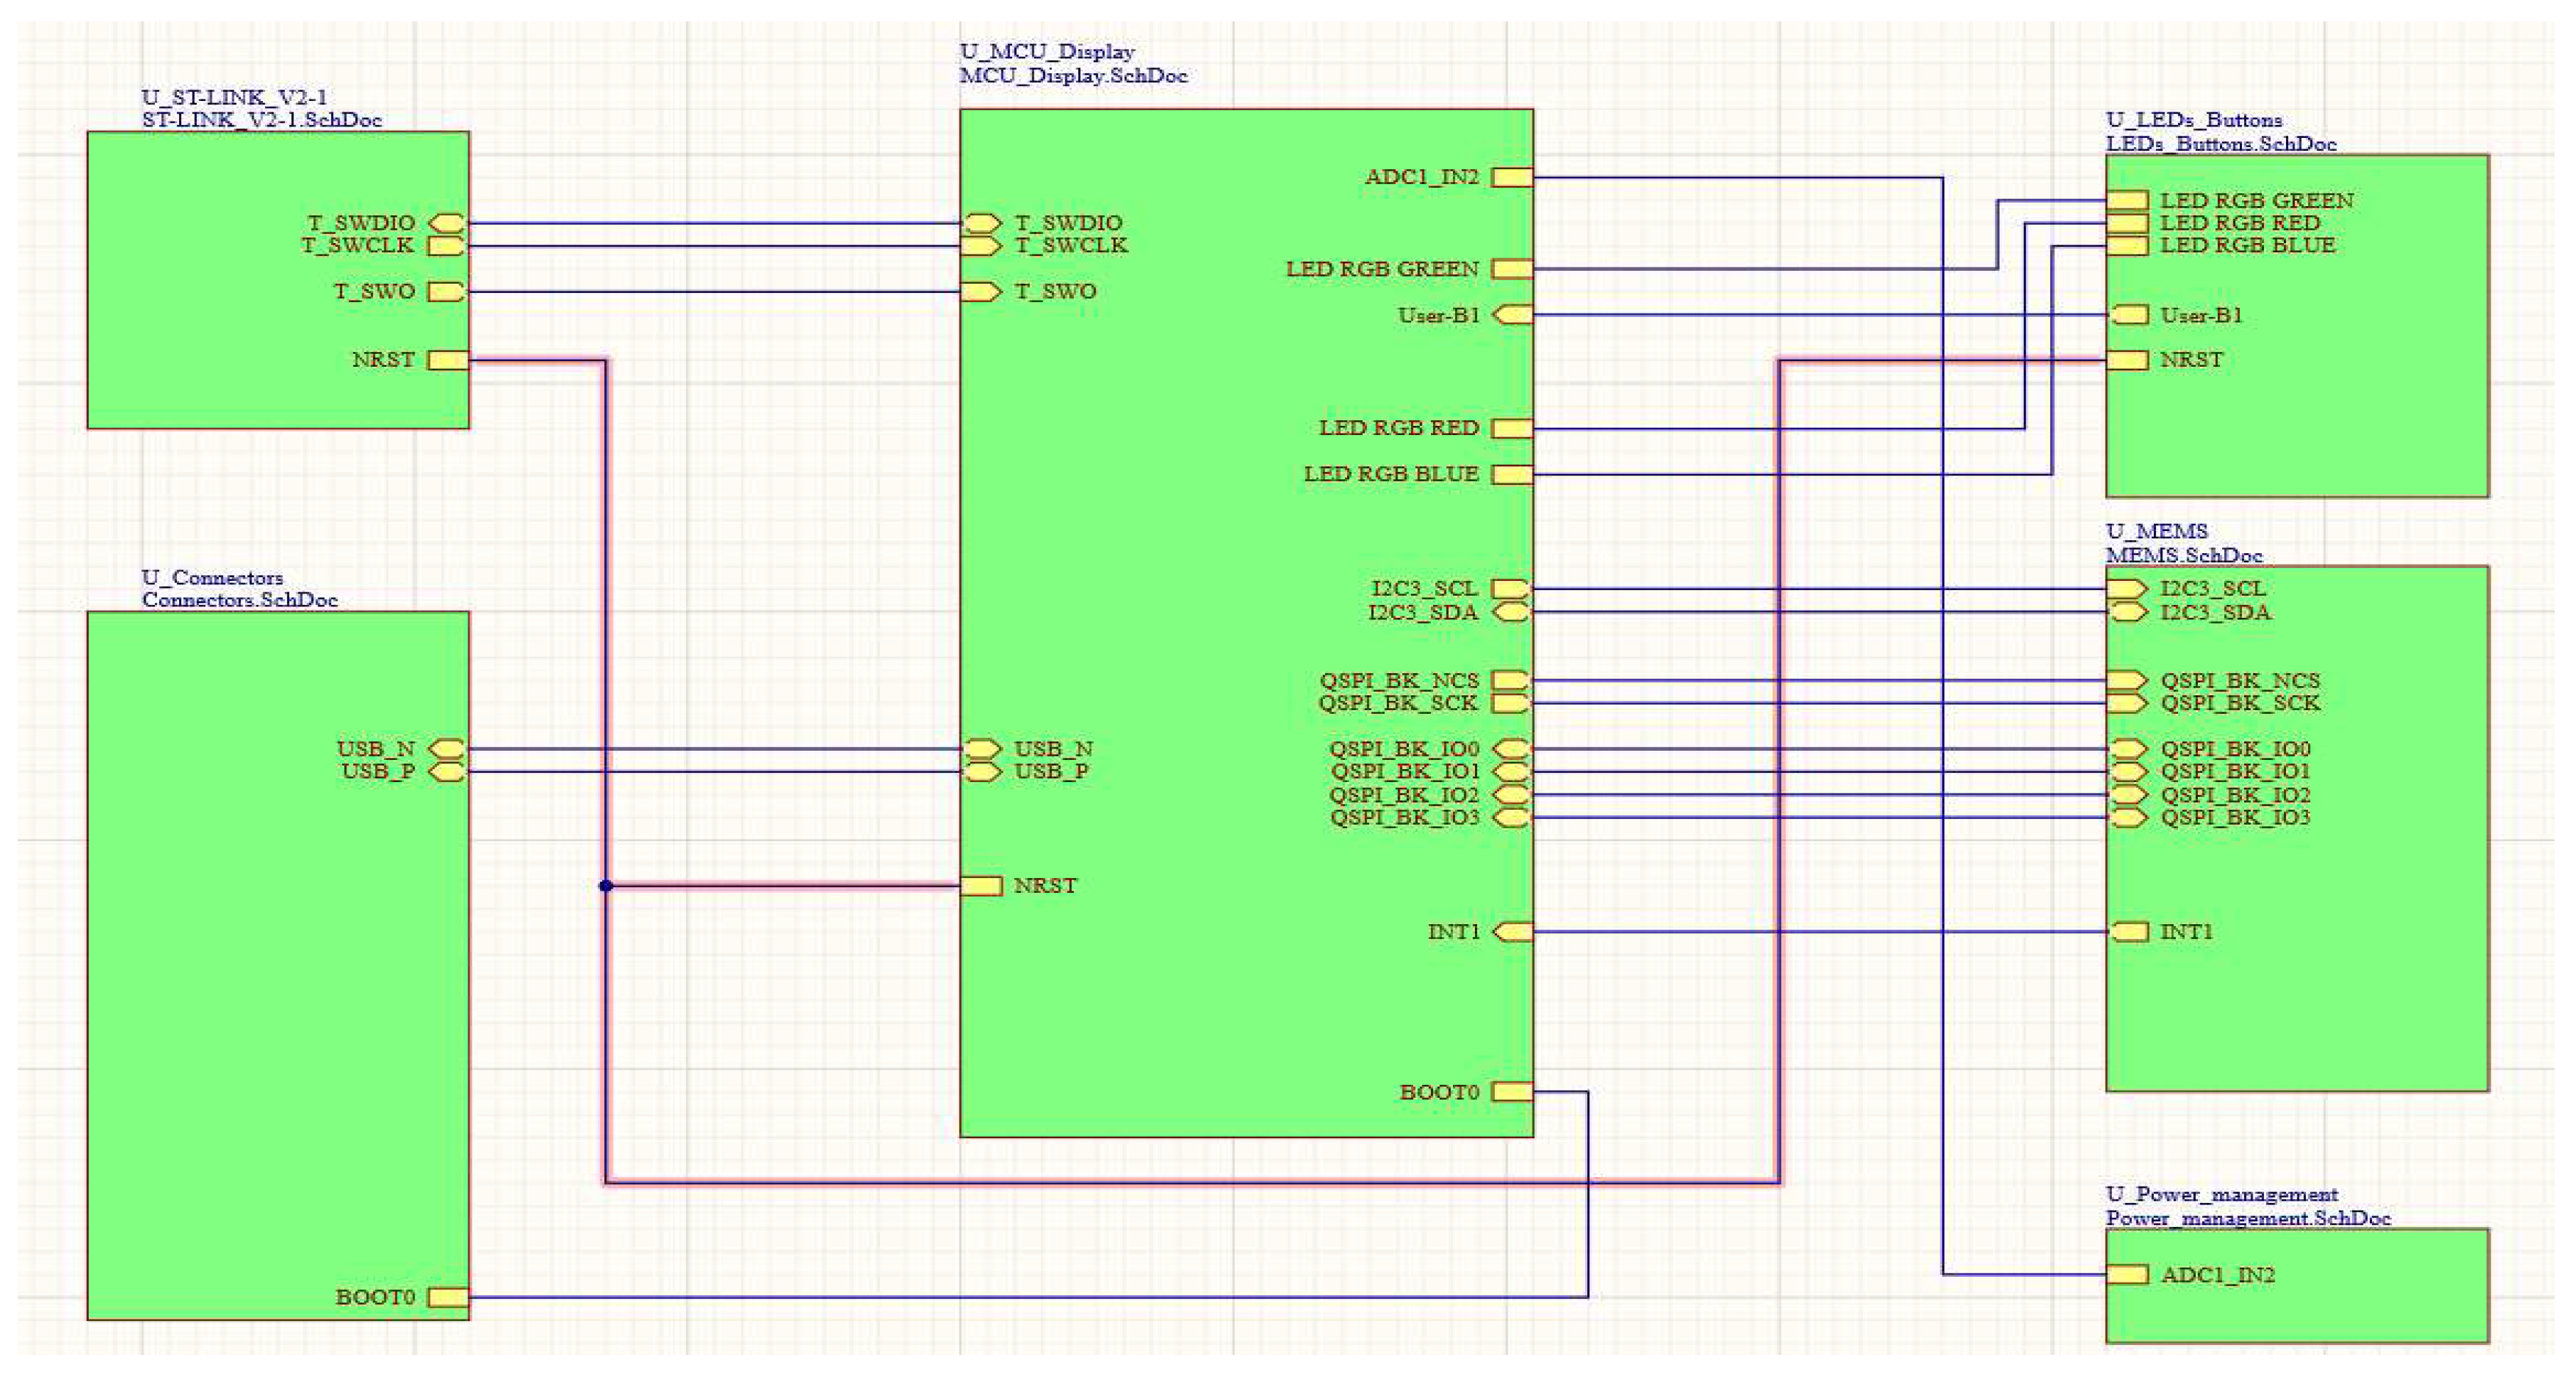
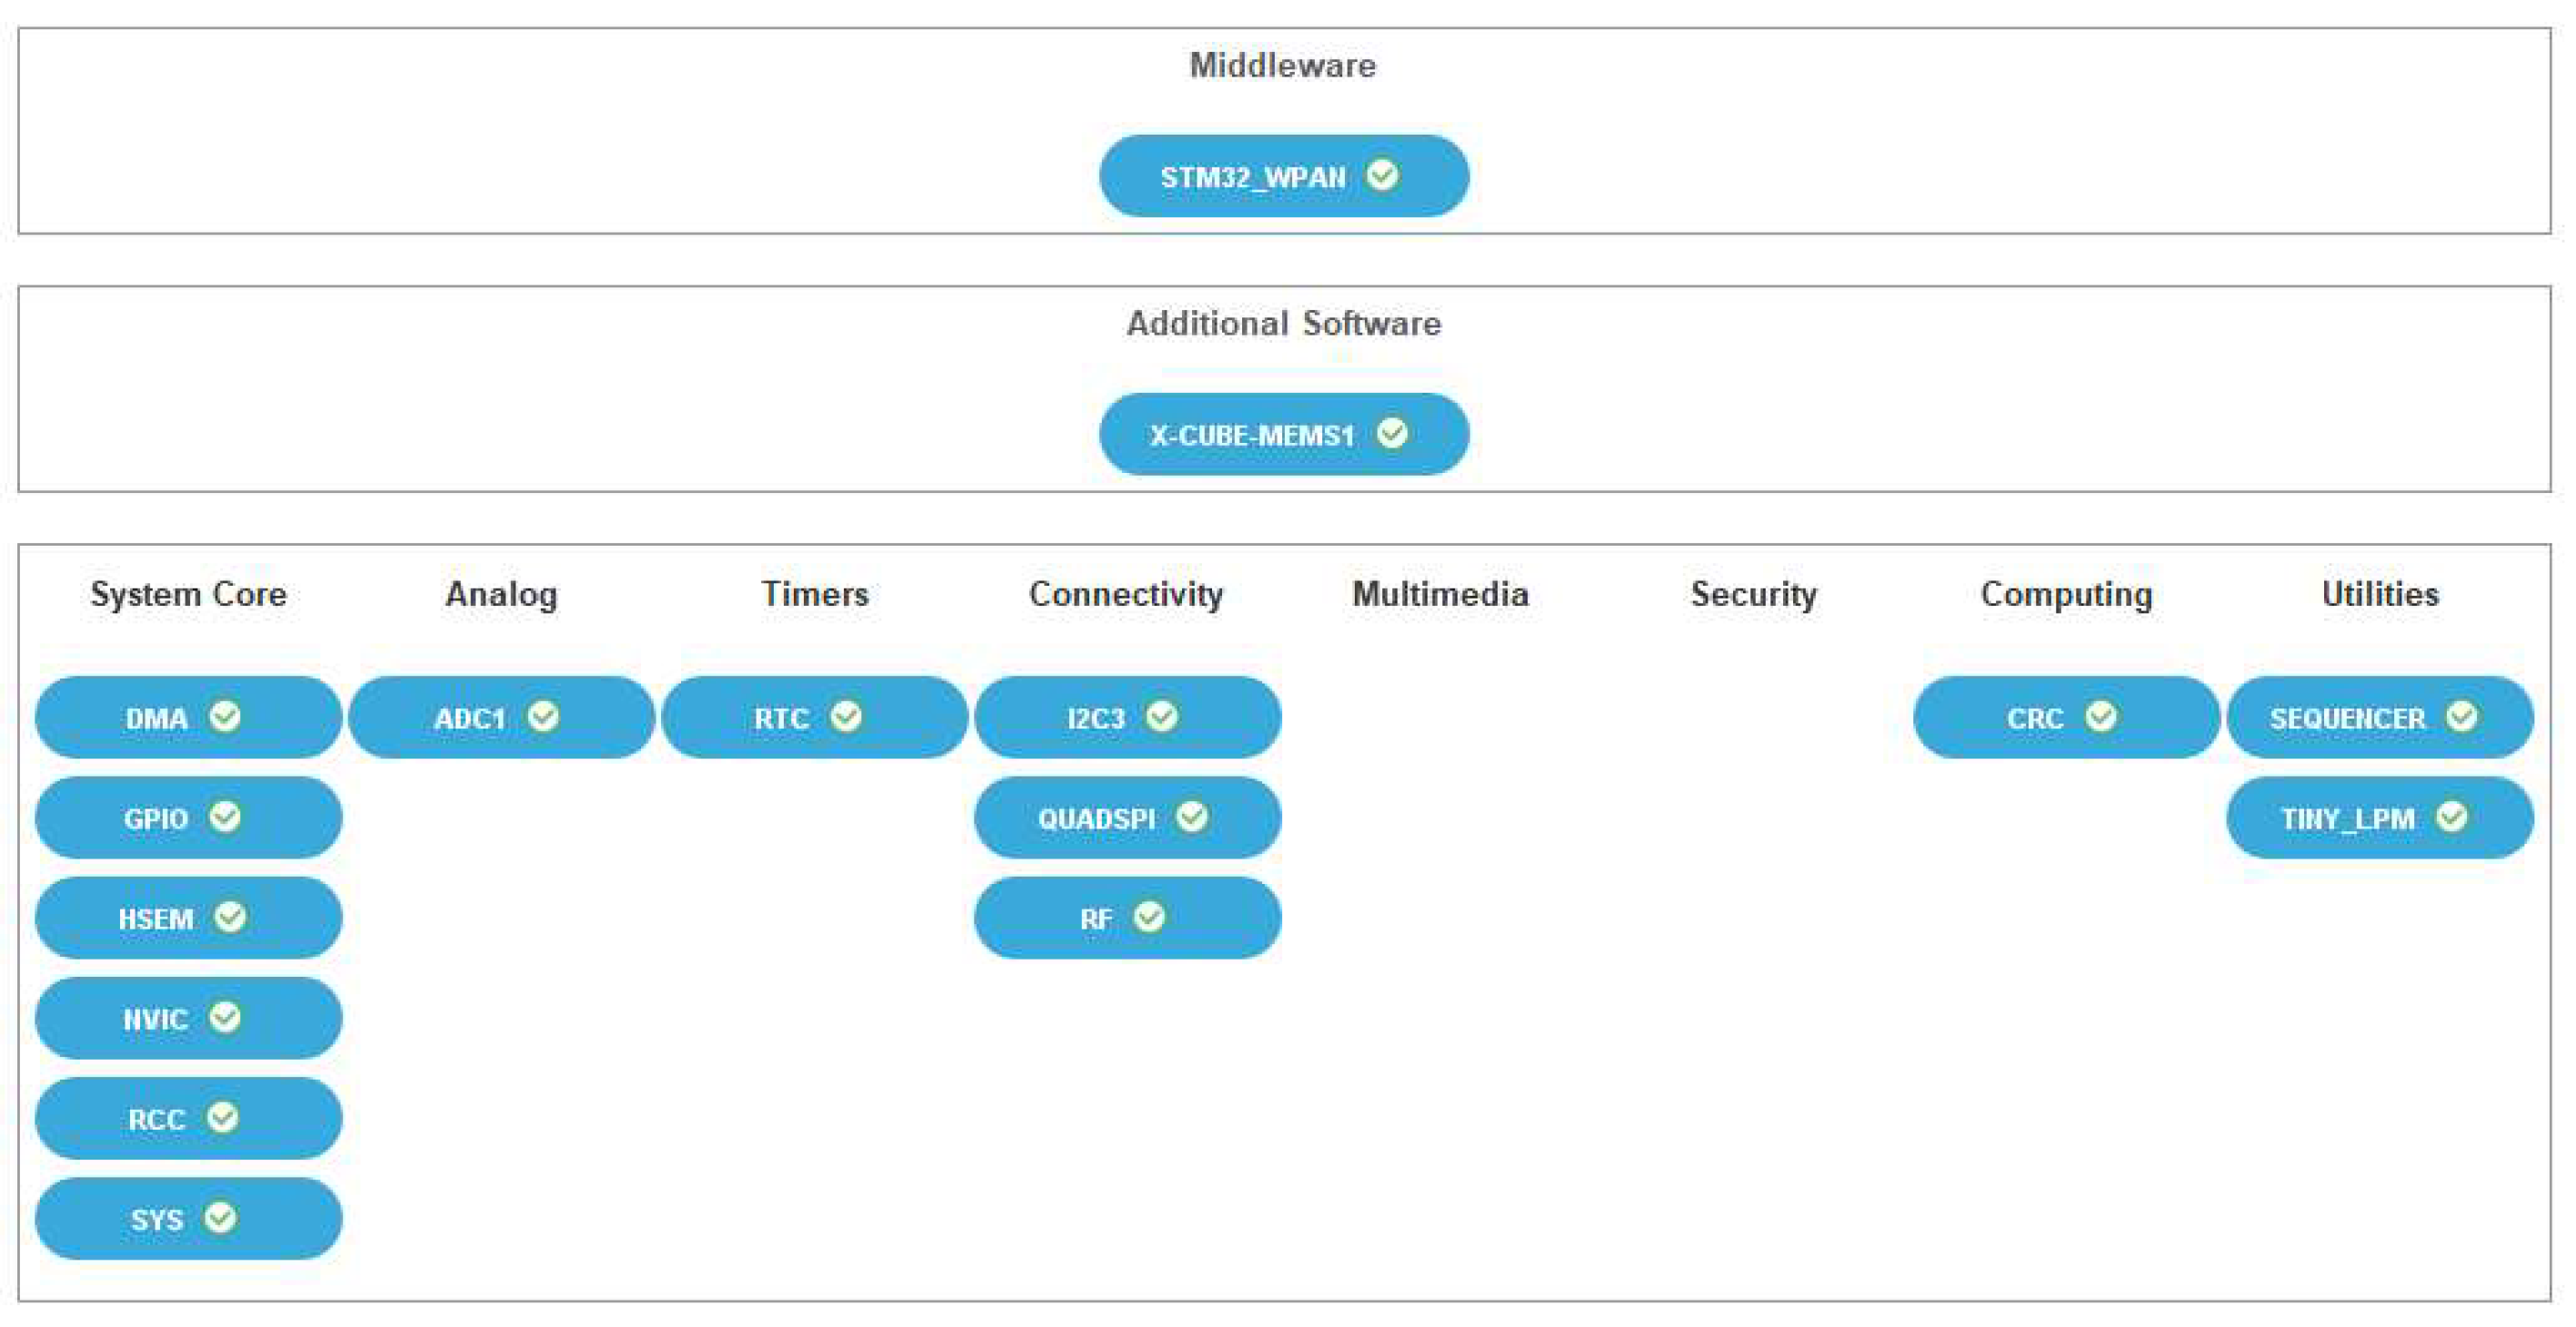
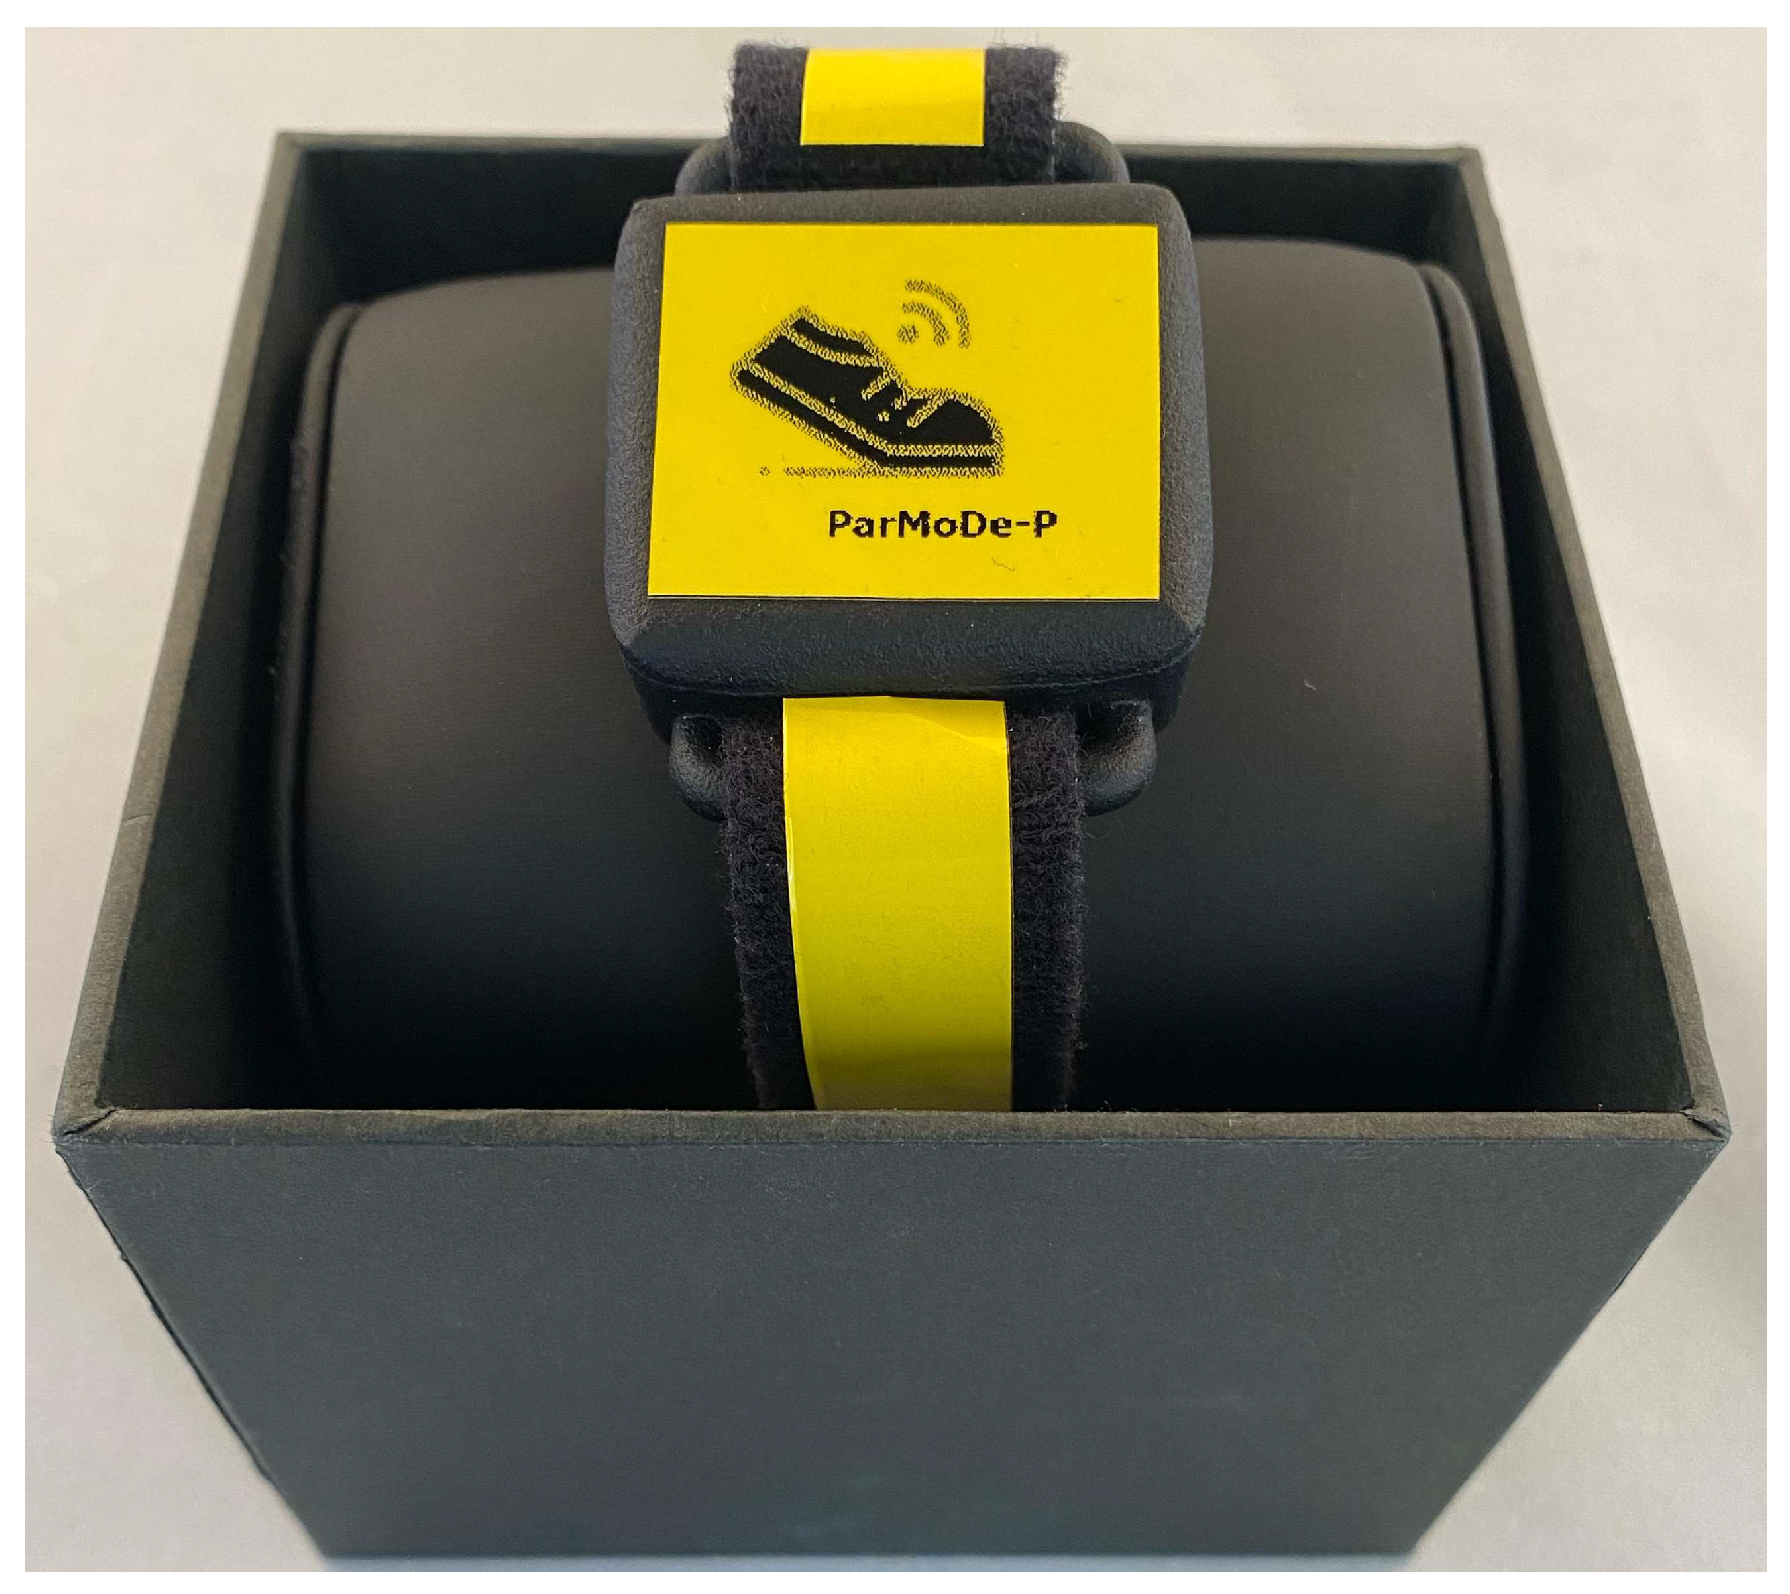
2. Gait Analysis Device
- Microcontroller/Bluetooth Low Energy;
- 2.
- QSPI Flash Memory;
- 3.
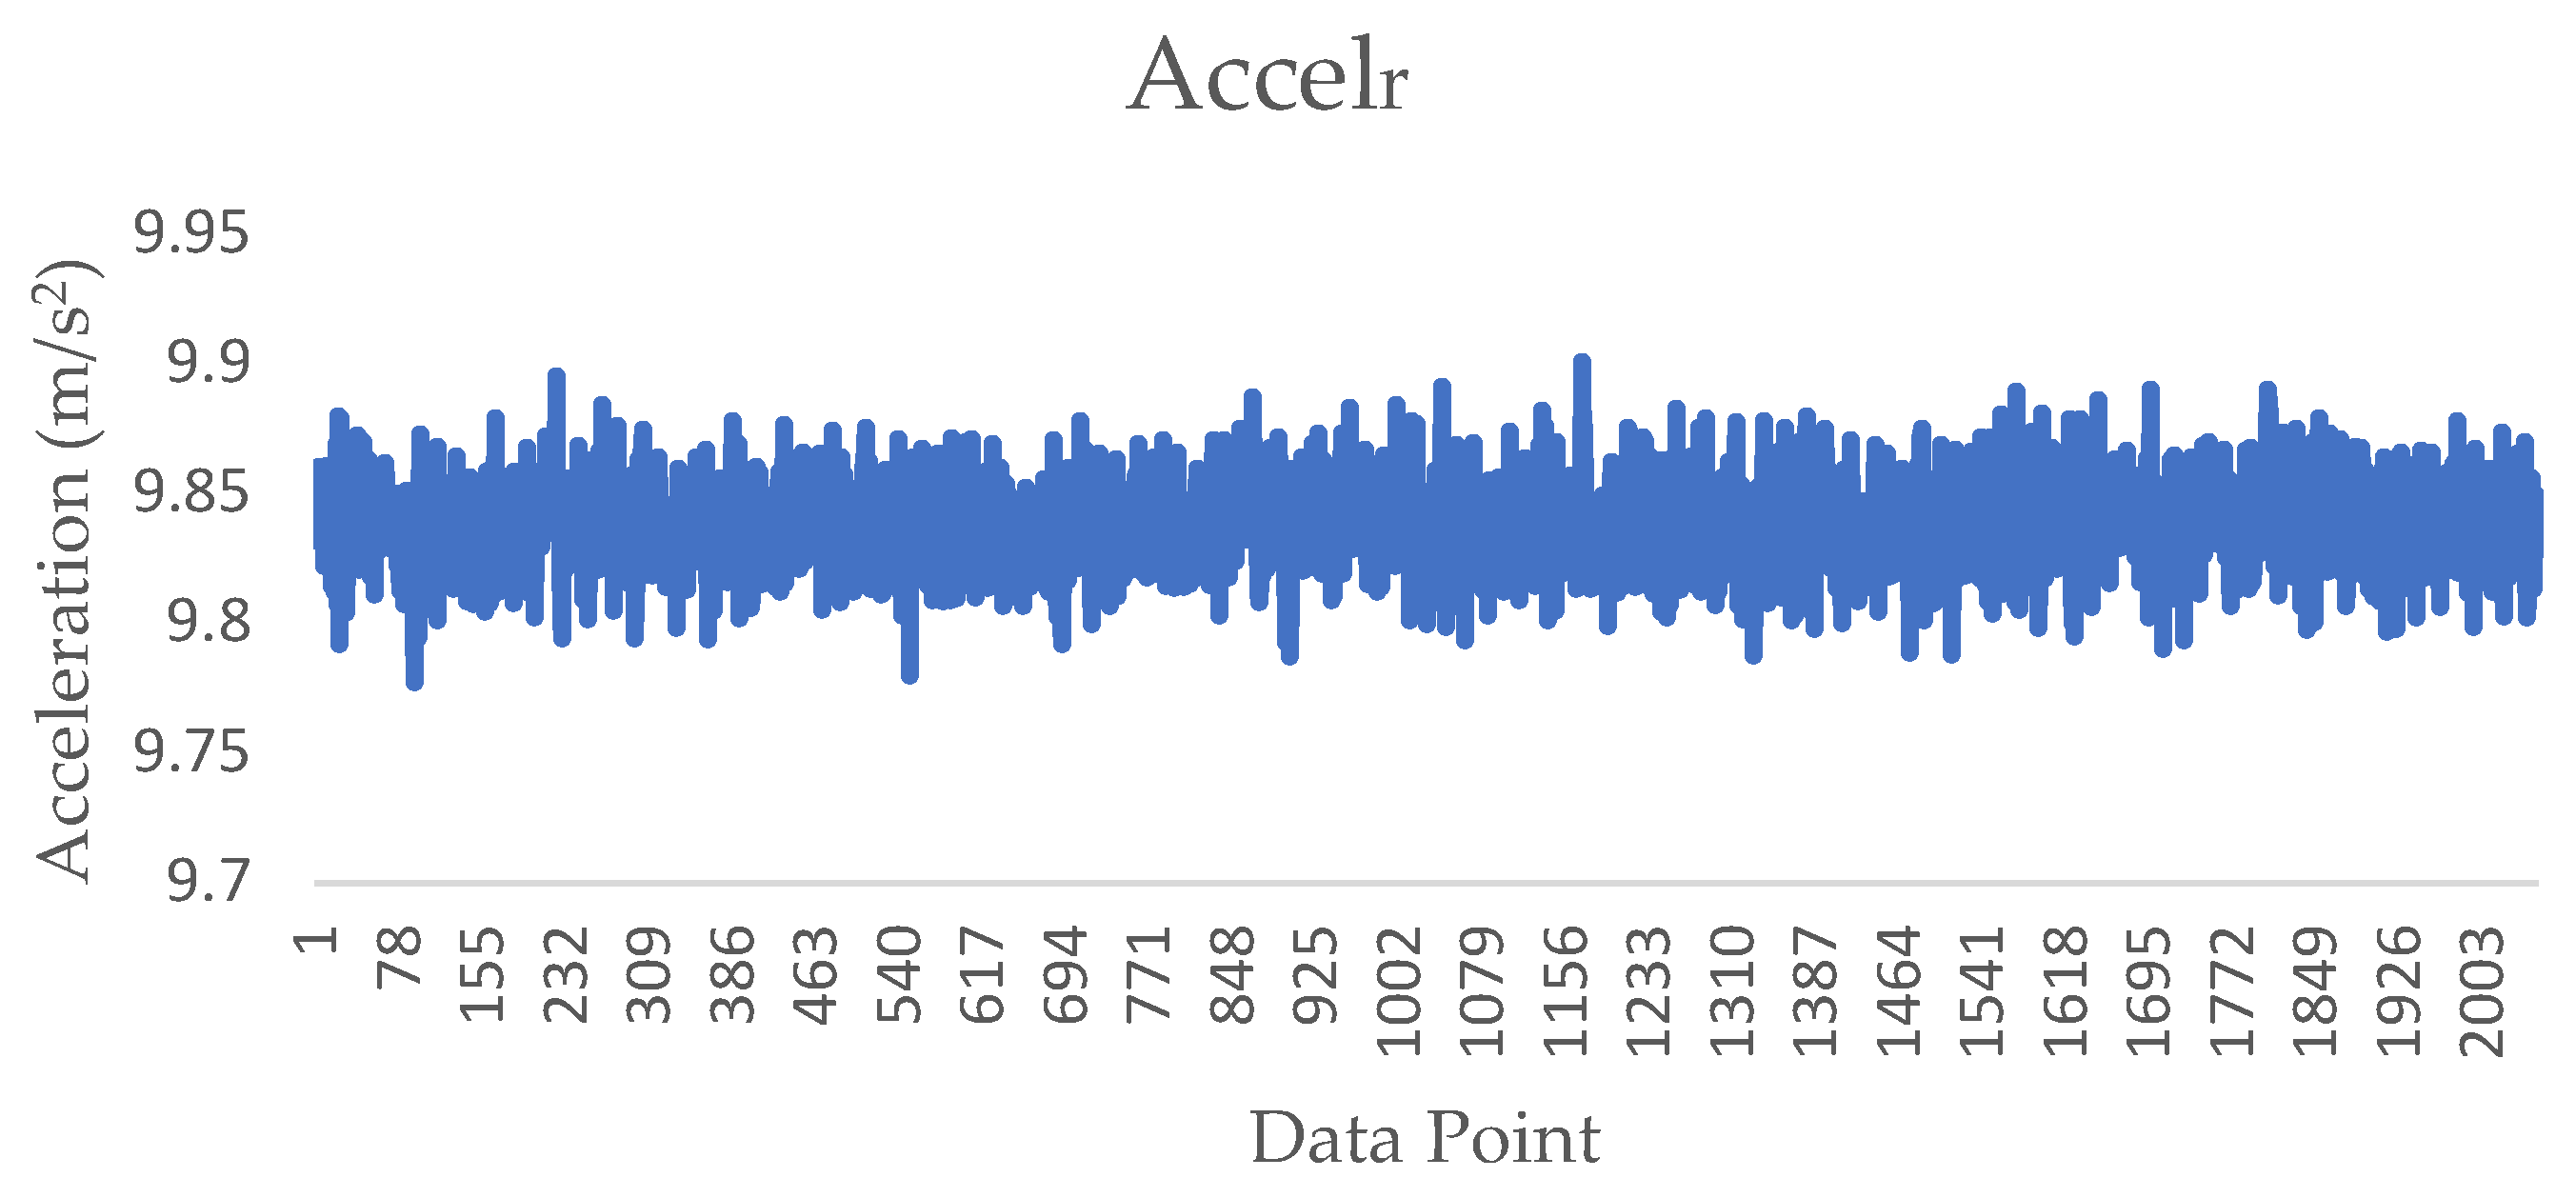
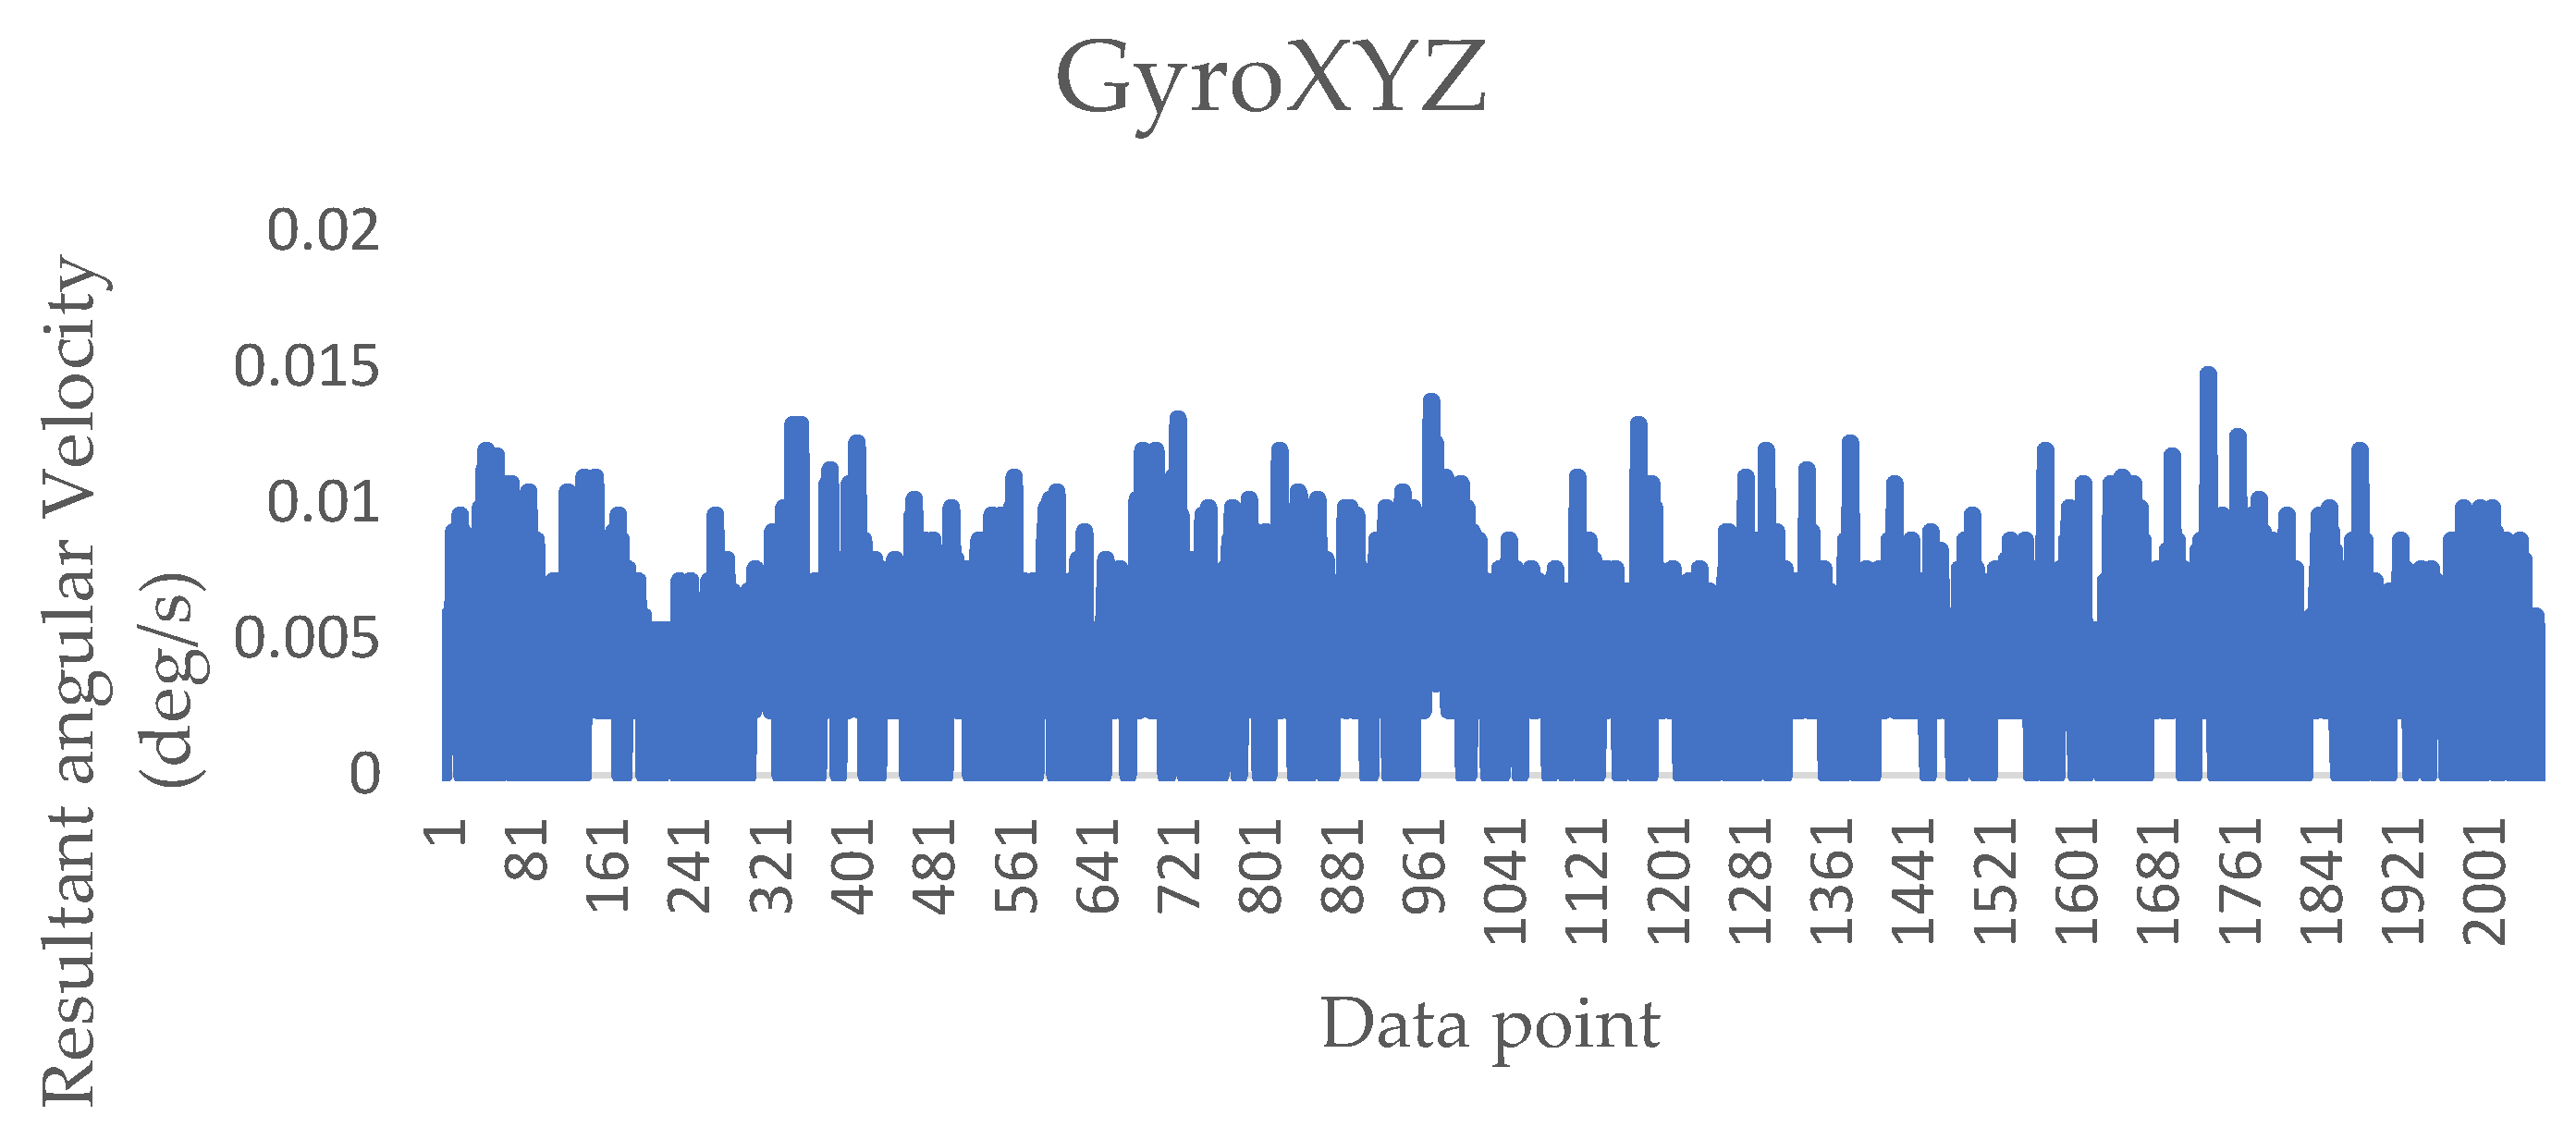
- 3D accelerometer and 3D gyroscope;
- 4.
- Hardware User Interface;
- 5.
- USB Port;
- 6.
- Battery power and charging;
- 7.
- Debug Port;
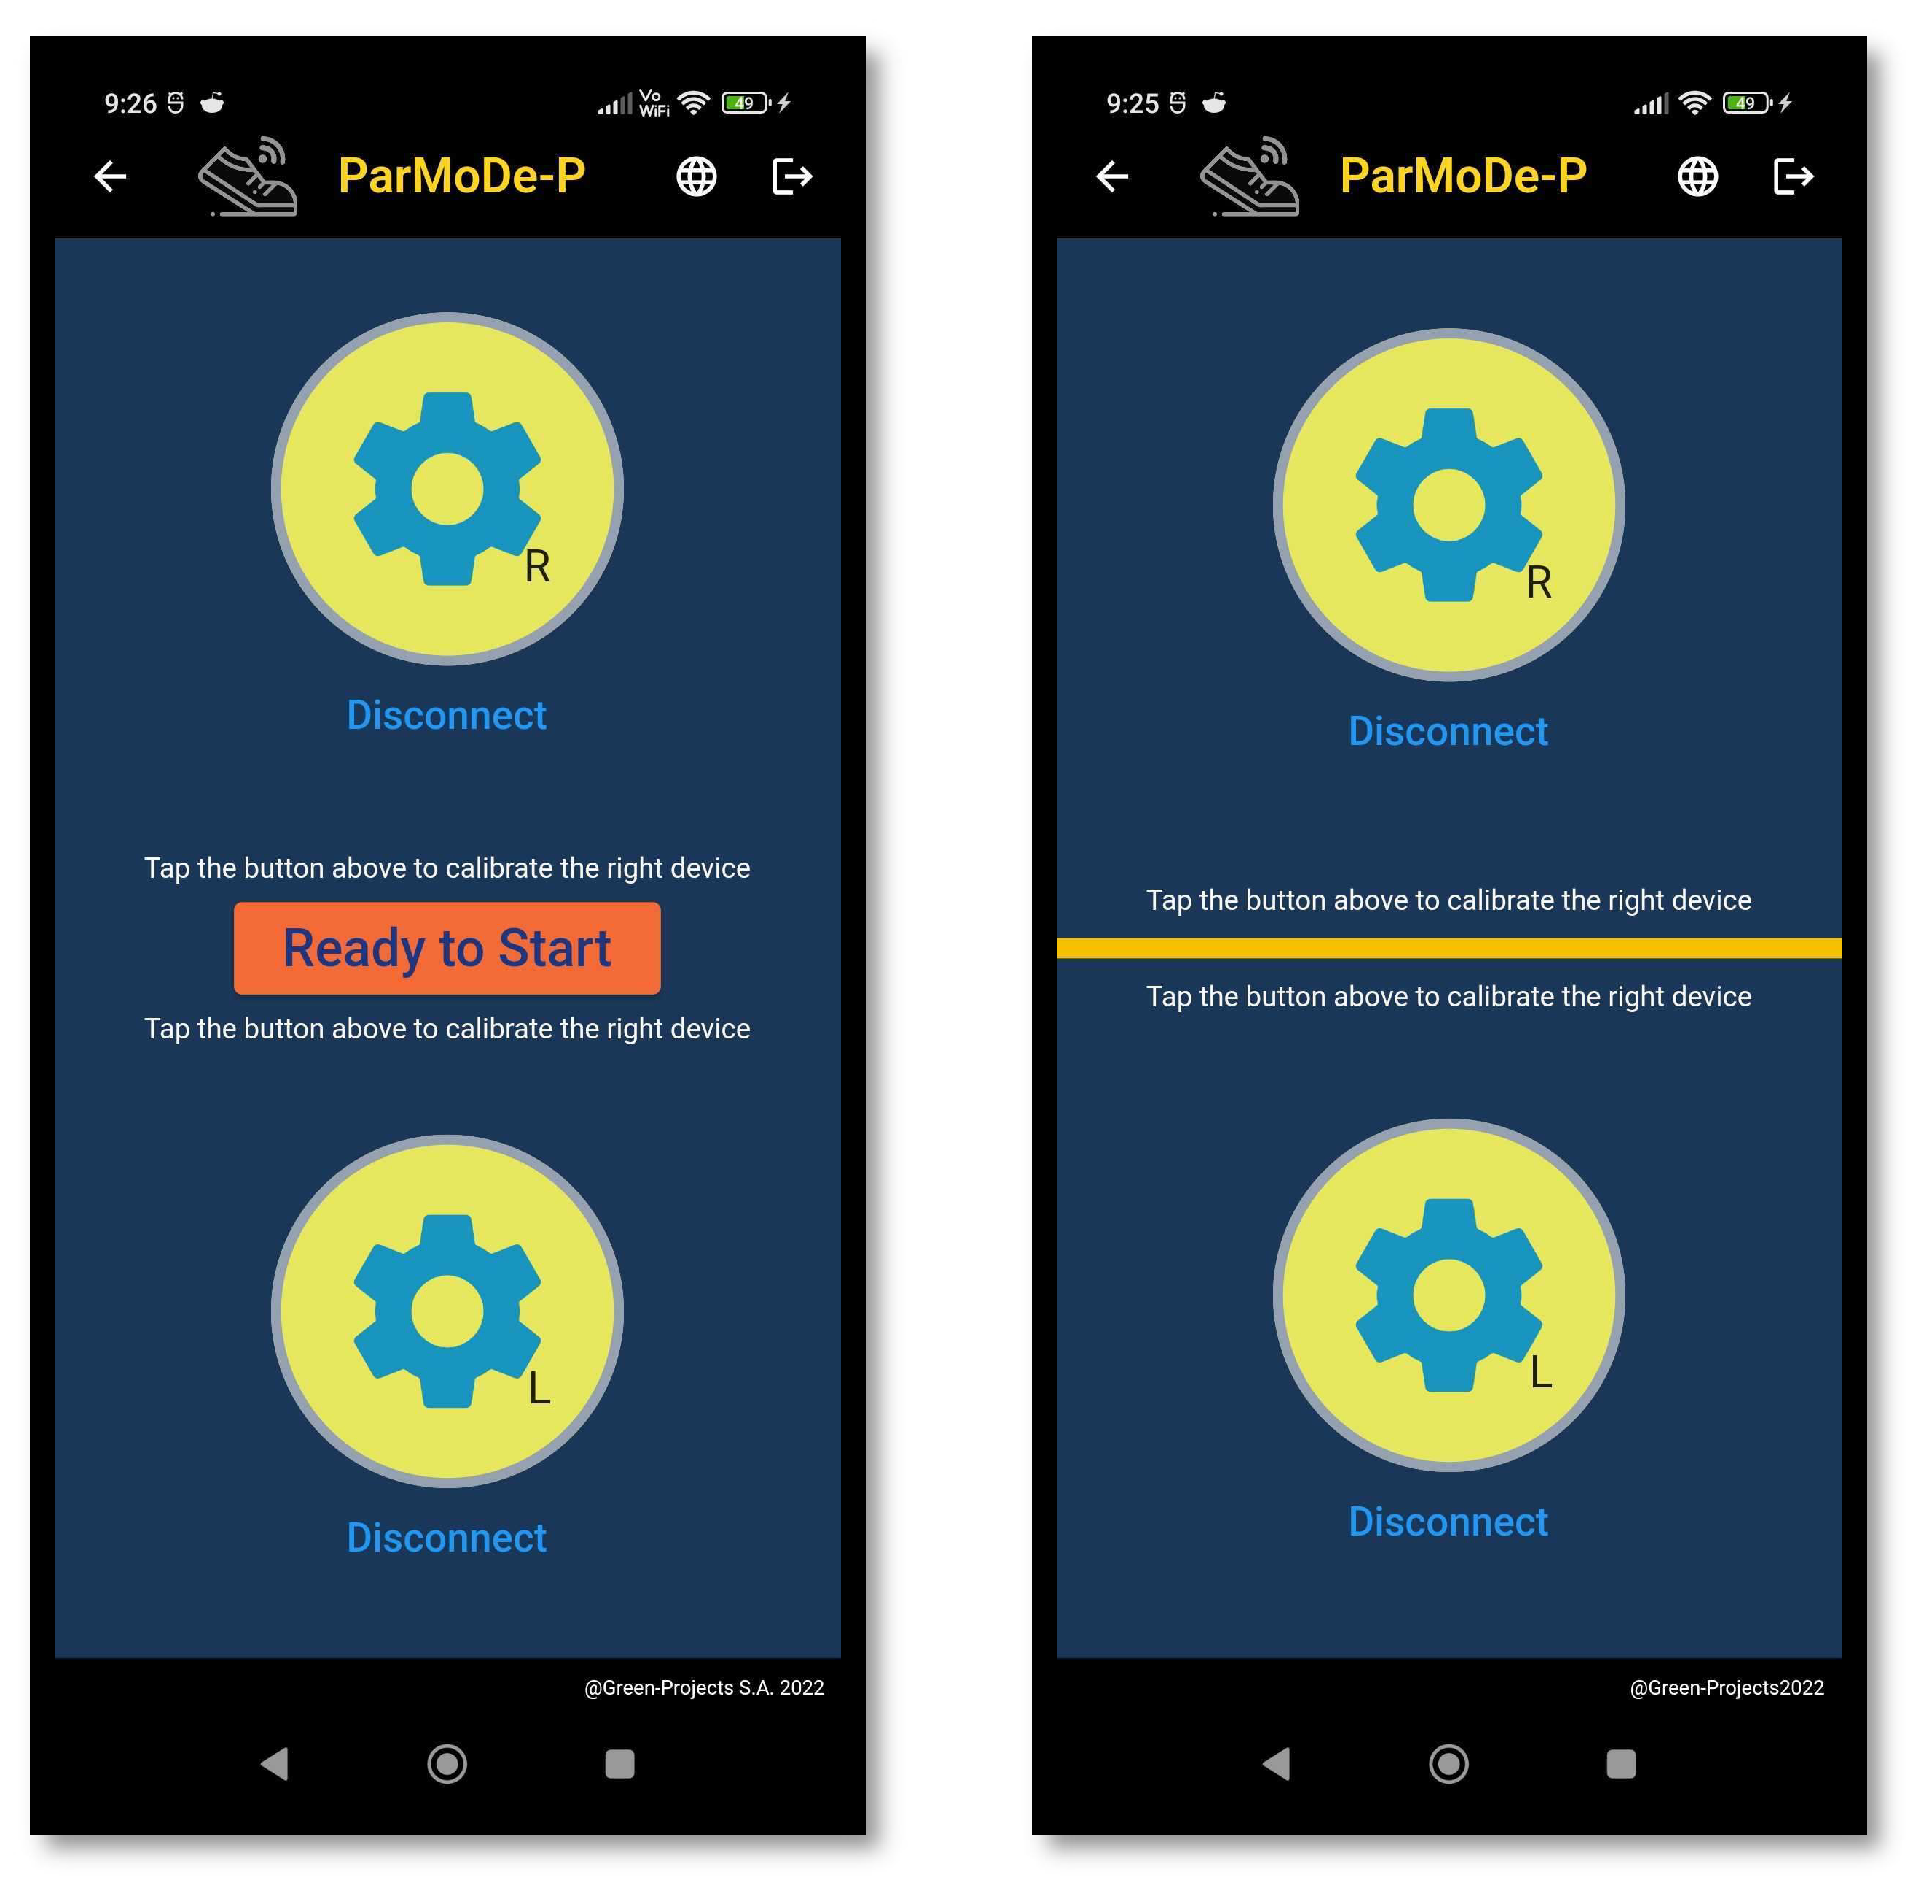
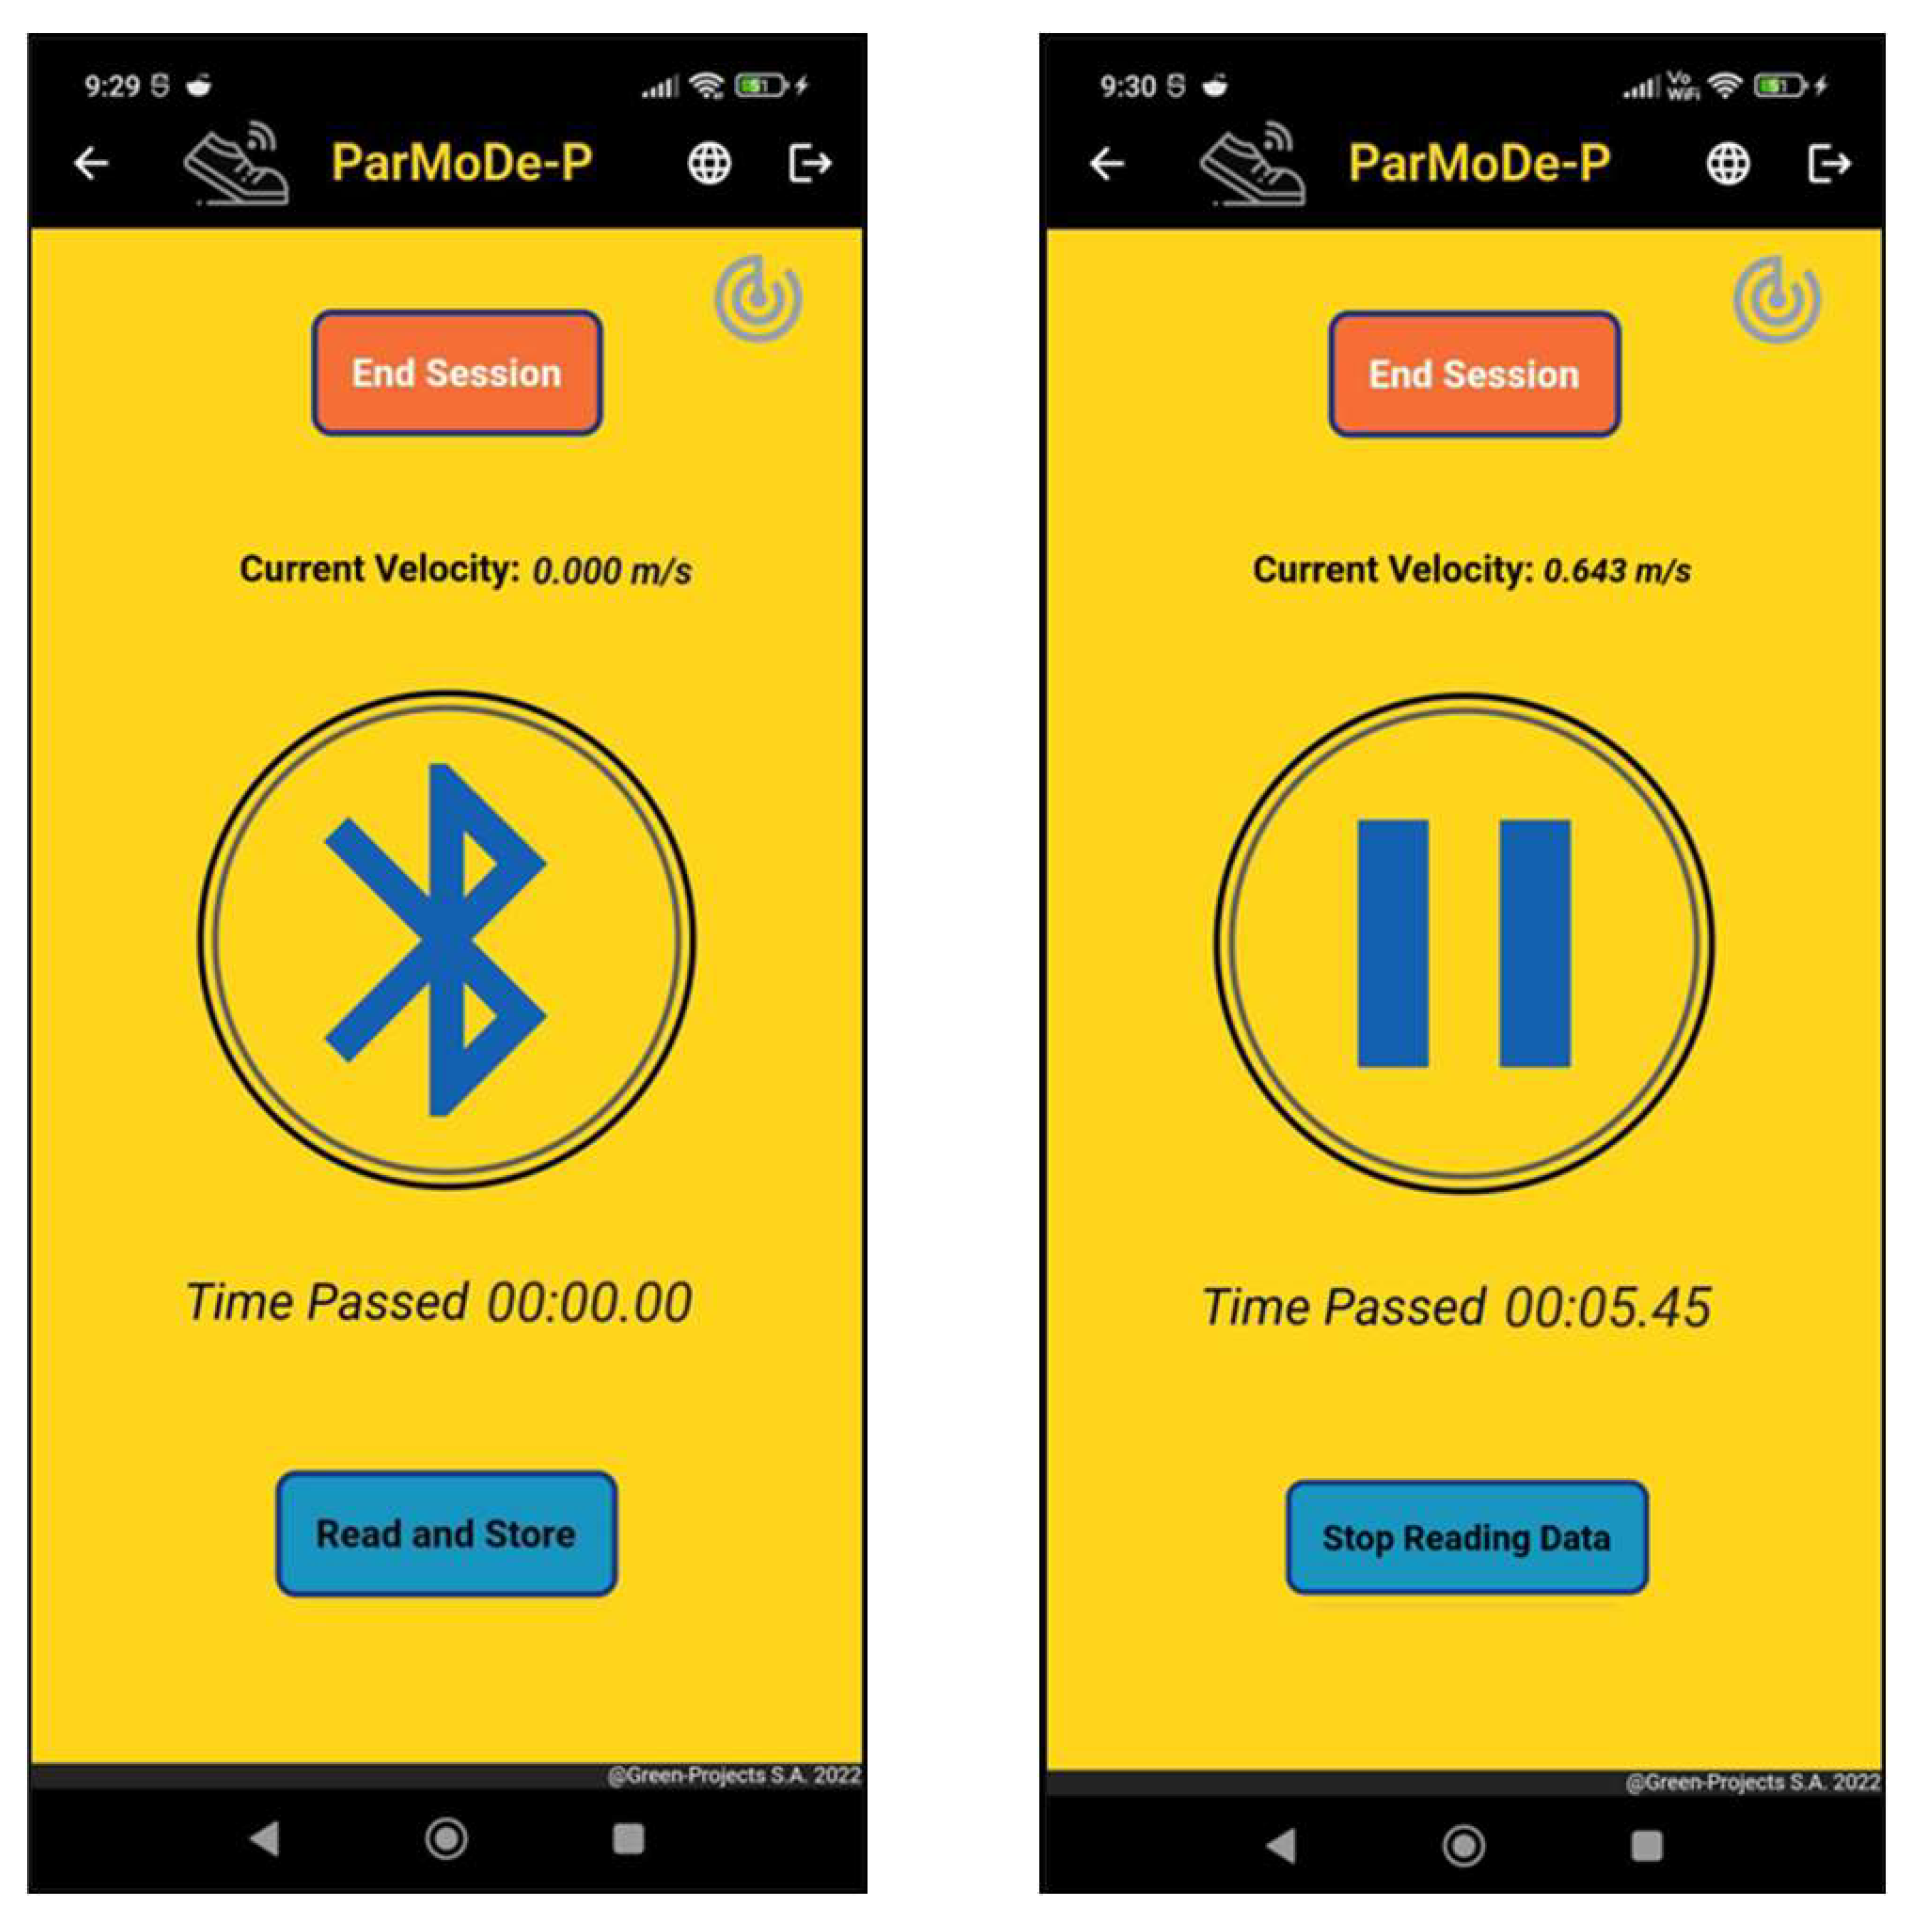
3. App
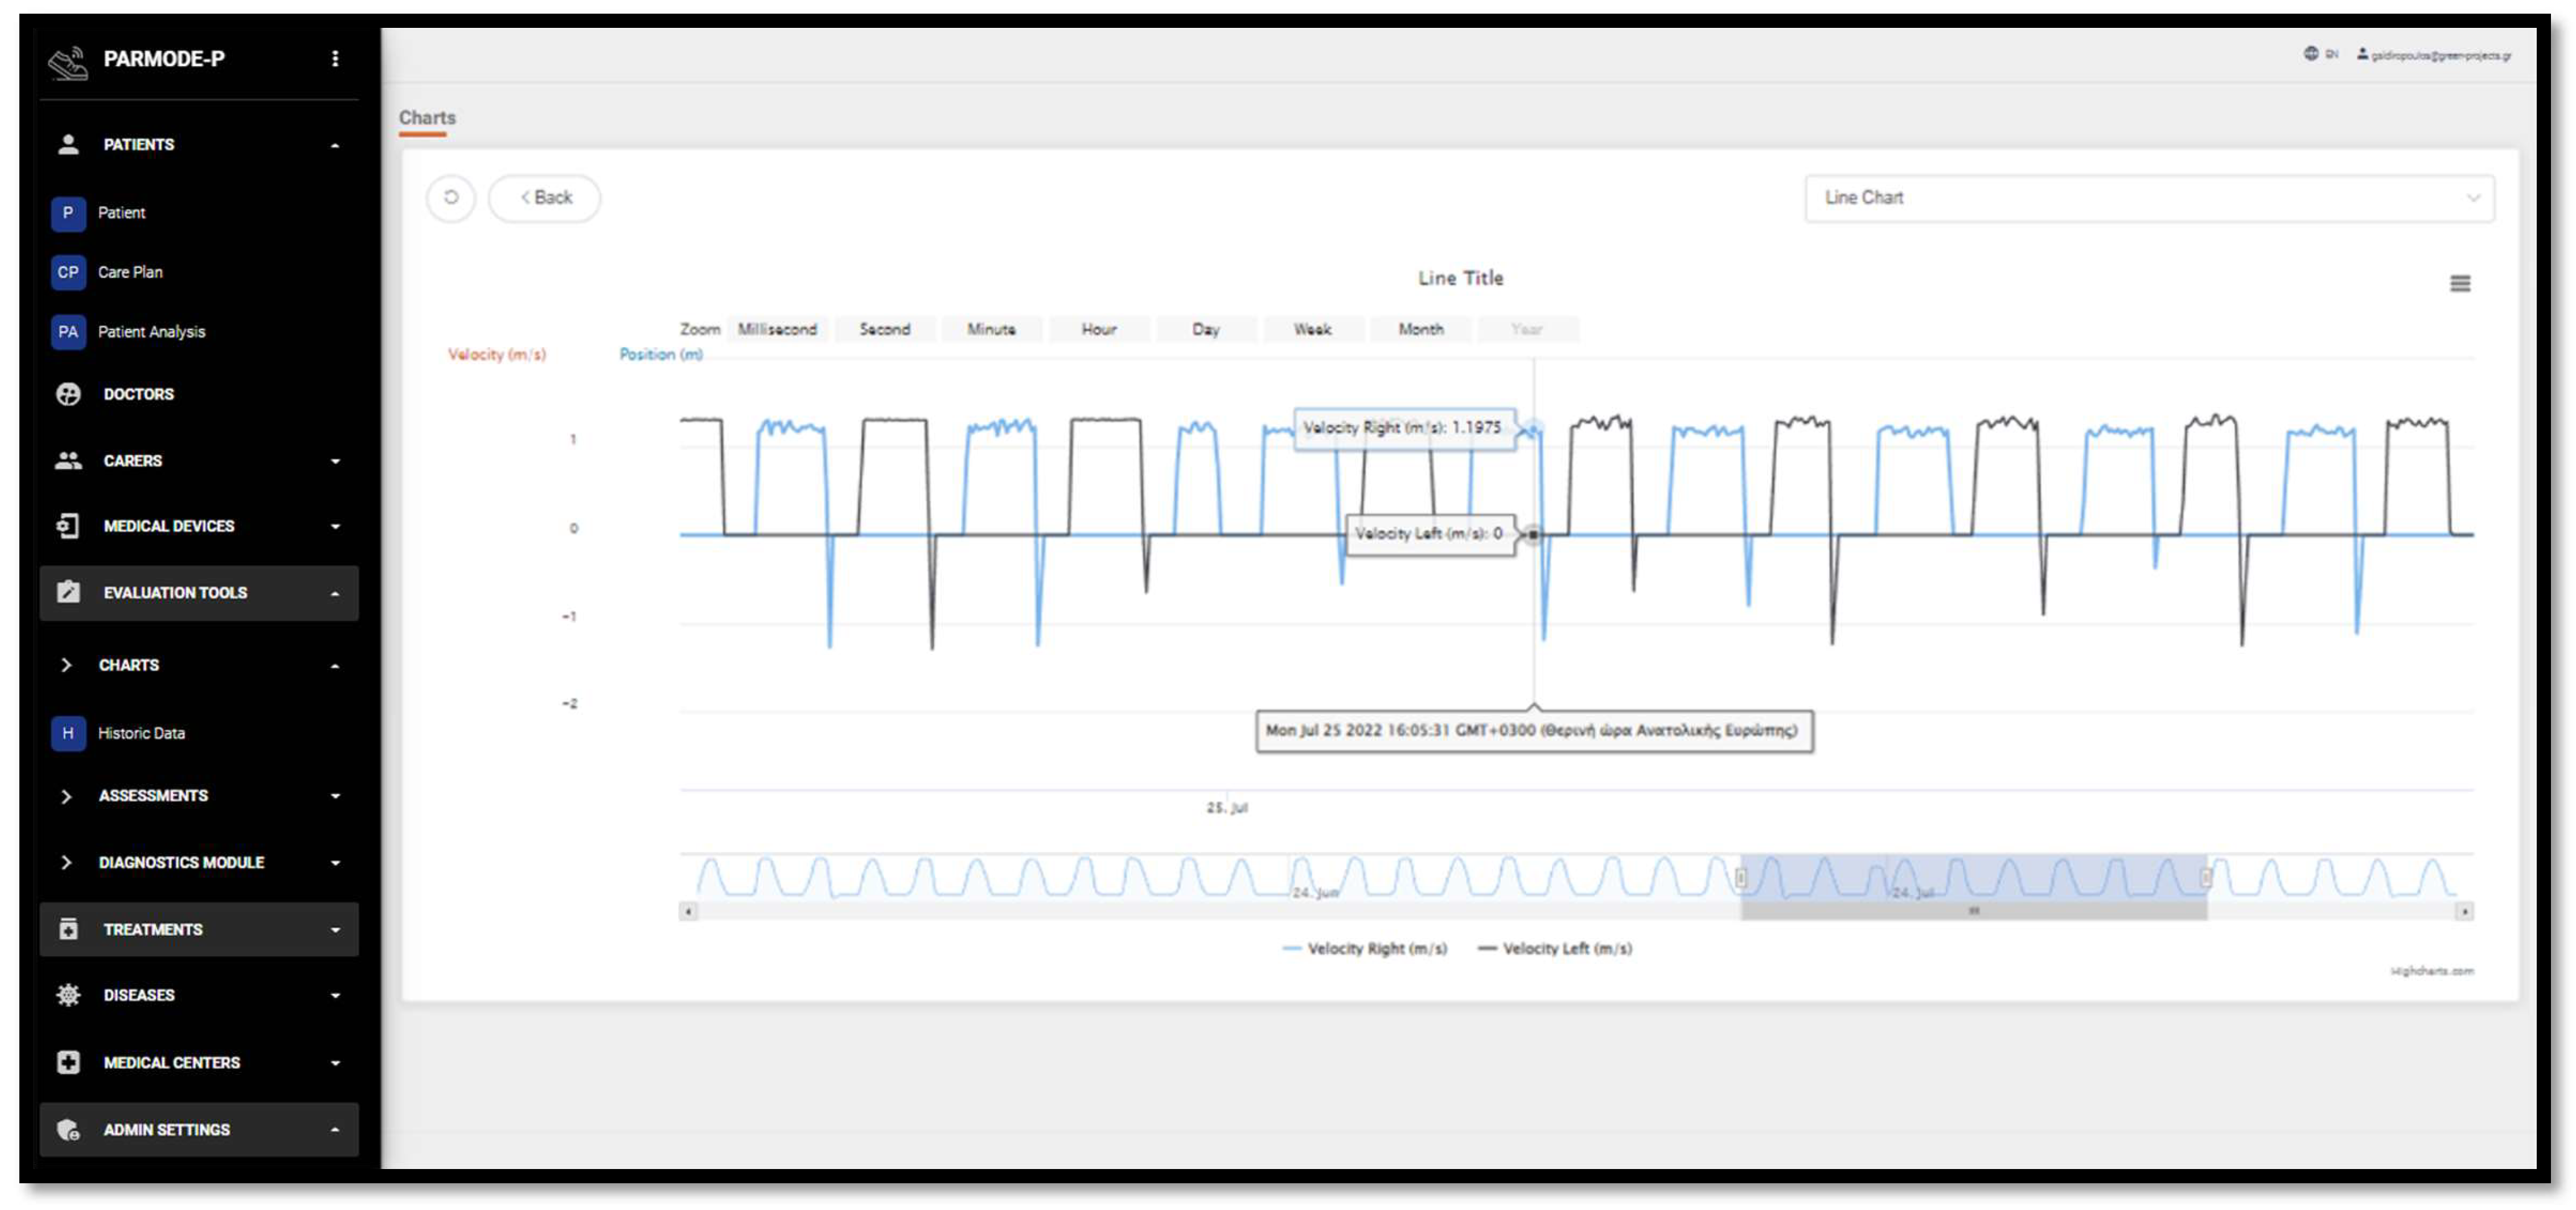
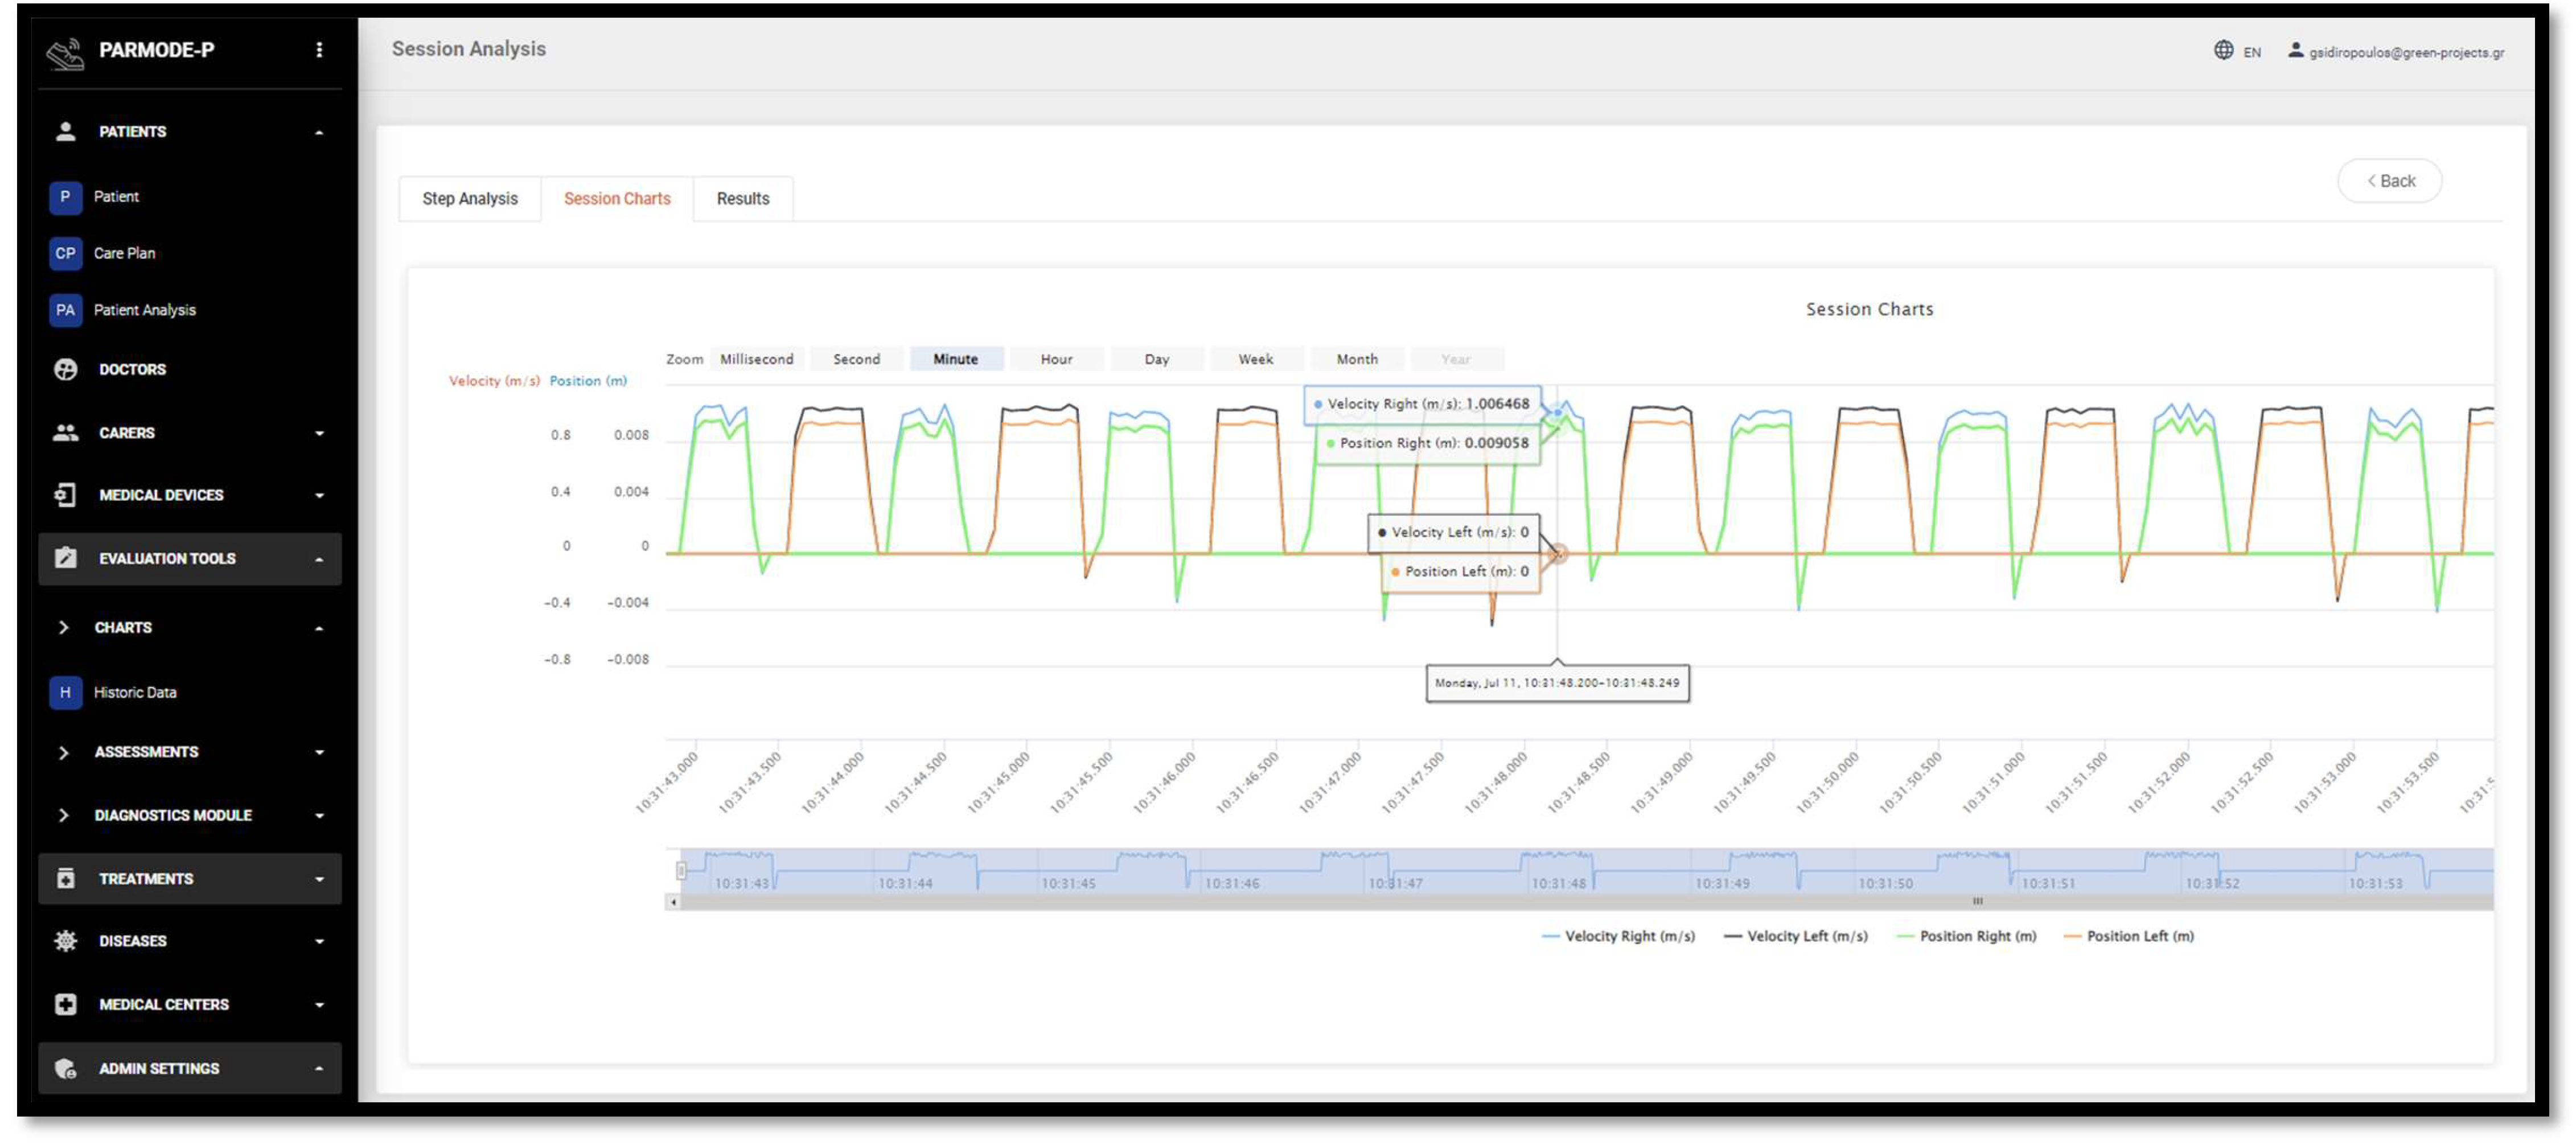
4. Web Platform
- Real-time (or almost real-time) data via a gait tracker;
- Current state of Parkinsonian quality of life as recorded using standardized tools, such as the PDQ-39 and PDQ-83;
- Current state of the patient’s clinical picture as recorded by the attending physician;
- Recording of the treatments to which the patient is subjected in hospitals and special care centers.
5. Evaluation of Device Accuracy
- 10 m walk test (straight line);
- 10 m time up and go test;
- 10 m walk test (freeway)
6. Conclusions
Author Contributions
Funding
Institutional Review Board Statement
Informed Consent Statement
Data Availability Statement
Conflicts of Interest
References
- Slavens, B.A.; Harris, G.F. The biomechanics of upper extremity kinematic and kinetic modeling: Applications to rehabilitation engineering. Crit. Rev. Biomed. Eng. 2008, 36, 93–125. [Google Scholar] [CrossRef] [PubMed]
- Poewe, W.; Seppi, K.; Tanner, C.M.; Halliday, G.M.; Brundin, P.; Volkmann, J.; Schrag, A.E.; Lang, A.E. Parkinson disease. Nat. Rev. Dis. Primers 2017, 3, 17013. [Google Scholar] [CrossRef] [PubMed]
- Radhakrishnan, D.M.; Goyal, V. Parkinson’s disease: A review. Neurol. India 2018, 66, S26–S35. [Google Scholar] [CrossRef] [PubMed]
- Barbosa, E.R.; Limongi, J.C.; Cummings, J.L. Parkinson’s disease. Psychiatr. Clin. N. Am. 1997, 20, 769–790. [Google Scholar] [CrossRef] [PubMed]
- Sabat, R.; Dayton, O.L.; Agarwal, A.; Vedam-Mai, V. Analyzing the effect of the COVID-19 vaccine on Parkinson’s disease symptoms. Front. Immunol. 2023, 14, 1158364. [Google Scholar] [CrossRef] [PubMed]
- Khodakarami, H.; Farzanehfar, P.; Horne, M. The Use of Data from the Parkinson’s KinetiGraph to Identify Potential Candidates for Device Assisted Therapies. Sensors 2019, 19, 2241. [Google Scholar] [CrossRef] [PubMed]
- Del Rey, N.L.; Quiroga-Varela, A.; Garbayo, E.; Carballo-Carbajal, I.; Fernández-Santiago, R.; Monje, M.H.G.; Trigo-Damas, I.; Blanco-Prieto, M.J.; Blesa, J. Advances in Parkinson’s Disease: 200 Years Later. Front. Neuroanat. 2018, 12, 113. [Google Scholar] [CrossRef] [PubMed]
- Gumber, A.; Ramaswamy, B.; Ibbotson, R.; Ismail, M.; Thongchundee, O.; Harrop, D.; Allmark, P.; Rauf, A. Economic, Social and Financial Cost of Parkinson’s on Individuals, Carers and Their Families in the UK; Centre for Health and Social Care Research, Sheffield Hallam University: Sheffield, UK; p. 2017.
- Piromalis, D.; Papoutsidakis, M.; Tsaramirsis, G. A study of keeping low cost in sensors and μcontroller implementations for daily activities. In Proceedings of the 2016 3rd International Conference on Computing for Sustainable Global Development (INDIACom), New Delhi, India, 16–18 March 2016; pp. 1403–1407. [Google Scholar]
- Tsaramirsis, G.; Buhari, S.M.; Basheri, M.; Stojmenovic, M. Navigating Virtual Environments Using Leg Poses and Smartphone Sensors. Sensors 2019, 19, 299. [Google Scholar] [CrossRef] [PubMed]
- Guk, K.; Han, G.; Lim, J.; Jeong, K.; Kang, T.; Lim, E.K.; Jung, J. Evolution of Wearable Devices with Real-Time Disease Monitoring for Personalized Healthcare. Nanomaterials 2019, 9, 813. [Google Scholar] [CrossRef] [PubMed]
- Silva de Lima, A.L.; Hahn, T.; Evers, L.J.W.; de Vries, N.M.; Cohen, E.; Afek, M.; Bataille, L.; Daeschler, M.; Claes, K.; Boroojerdi, B.; et al. Feasibility of large-scale deployment of multiple wearable sensors in Parkinson’s disease. PLoS ONE 2017, 12, e0189161. [Google Scholar] [CrossRef] [PubMed]
- Rovini, E.; Maremmani, C.; Cavallo, F. Automated Systems Based on Wearable Sensors for the Management of Parkinson’s Disease at Home: A Systematic Review. Telemed. e-Health 2019, 25, 167–183. [Google Scholar] [CrossRef] [PubMed]
- Ancona, S.; Faraci, F.D.; Khatab, E.; Fiorillo, L.; Gnarra, O.; Nef, T.; Bassetti, C.L.A.; Bargiotas, P. Wearables in the home-based assessment of abnormal movements in Parkinson’s disease: A systematic review of the literature. J. Neurol. 2022, 269, 100–110. [Google Scholar] [CrossRef] [PubMed]
- Banou, E. Kinesia paradoxa: A challenging Parkinson’s phenomenon for simulation. Adv. Exp. Med. Biol. 2015, 822, 165–177. [Google Scholar] [CrossRef] [PubMed]
- BioSensics. BioSensics. Available online: https://biosensics.com/ (accessed on 20 March 2024).
- Kim, T.K. T test as a parametric statistic. Korean J. Anesthesiol. 2015, 68, 540–546. [Google Scholar] [CrossRef] [PubMed]
- Kaufmann, J.; Schering, A. Analysis of Variance ANOVA. In Wiley StatsRef: Statistics Reference Online; John and Wiley and Sons: Hoboken, NJ, USA, 2014. [Google Scholar]
- Andy, F. Discovering Statistics Using IBM SPSS Statistics; SAGE Publications: Thousand Oaks, CA, USA, 2017. [Google Scholar]
- Nagasubramanian, G.; Sankayya, M.; Al-Turjman, F.; Tsaramirsis, G. Parkinson Data Analysis and Prediction System Using Multi-Variant Stacked Auto Encoder. IEEE Access 2020, 8, 127004–127013. [Google Scholar] [CrossRef]


| Significance One-Sided p | Significance Two-Sided p | |
|---|---|---|
| BP Stride Length (m)—BP Stride Length (m) (PL) | <0.001 | <0.001 |
| BP Stride Length (m)—BP Stride Length (m) (PL) | <0.001 | <0.001 |
| BP Stride Velocity (m/s)—BP Stride Velocity (m/s) (PL) | <0.001 | <0.001 |
| BP Cadence (steps/min)—BP Cadence (steps/min) (PL) | <0.001 | <0.001 |
| BP (Double Support (%)) and BP (Double Support (%)) (PL) | <0.001 | <0.001 |
| Swing (%) Left and Swing (%) Left (PL) | <0.001 | <0.001 |
| Stance (%) Left— Stance (%) Left (PL) | <0.001 | <0.001 |
| Step Length (m) Left— Step Length (m) Left (PL) | <0.001 | <0.001 |
| Swing (%) Right and Swing (%) Right (PL) | <0.001 | <0.001 |
| Stance (%) Right and Stance (%) Right (PL) | <0.001 | <0.001 |
| Stance (%) Right and Stance (%) Right (PL) | <0.001 | <0.001 |
| Sig. | |
|---|---|
| BP Stride Length (m) | 0.019 |
| BP Stride Time (s) | 0.0014 |
| BP Stride Velocity (m/s) | 0.002 |
| BP Cadence (steps/min) | 0.0012 |
| BP (Double Support (%)) | 0.002 |
| Swing (%) Left | 0.003 |
| Stance (%) Left | 0.003 |
| Step Length (m) Left | 0.003 |
| Swing (%) Right (PL) and Swing (%) Right | 0.002 |
| Stance (%) Right (PL) και Stance (%) Right | 0.005 |
| Step Length (m) Right | 0.002 |
Disclaimer/Publisher’s Note: The statements, opinions and data contained in all publications are solely those of the individual author(s) and contributor(s) and not of MDPI and/or the editor(s). MDPI and/or the editor(s) disclaim responsibility for any injury to people or property resulting from any ideas, methods, instructions or products referred to in the content. |
© 2024 by the authors. Licensee MDPI, Basel, Switzerland. This article is an open access article distributed under the terms and conditions of the Creative Commons Attribution (CC BY) license (https://creativecommons.org/licenses/by/4.0/).
Share and Cite
Tsotsolas, N.; Koutsouraki, E.; Antonakaki, A.; Pizanias, S.; Kounelis, M.; Piromalis, D.D.; Kolovos, D.P.; Kokkotis, C.; Tsatalas, T.; Bellis, G.; et al. Investigating the Effectiveness of an IMU Portable Gait Analysis Device: An Application for Parkinson’s Disease Management. BioMedInformatics 2024, 4, 1085-1096. https://doi.org/10.3390/biomedinformatics4020061
Tsotsolas N, Koutsouraki E, Antonakaki A, Pizanias S, Kounelis M, Piromalis DD, Kolovos DP, Kokkotis C, Tsatalas T, Bellis G, et al. Investigating the Effectiveness of an IMU Portable Gait Analysis Device: An Application for Parkinson’s Disease Management. BioMedInformatics. 2024; 4(2):1085-1096. https://doi.org/10.3390/biomedinformatics4020061
Chicago/Turabian StyleTsotsolas, Nikos, Eleni Koutsouraki, Aspasia Antonakaki, Stefanos Pizanias, Marios Kounelis, Dimitrios D. Piromalis, Dimitrios P. Kolovos, Christos Kokkotis, Themistoklis Tsatalas, George Bellis, and et al. 2024. "Investigating the Effectiveness of an IMU Portable Gait Analysis Device: An Application for Parkinson’s Disease Management" BioMedInformatics 4, no. 2: 1085-1096. https://doi.org/10.3390/biomedinformatics4020061