
Investigation of SARS-CoV-2 Contamination of Indoor Air and Highly Touched Surfaces On-Campus Buildings

 ,
,
Abstract
1. Introduction
2. Materials and Methods
2.1. Sampling Sites Description
2.2. Sample Collection
- Air sampling
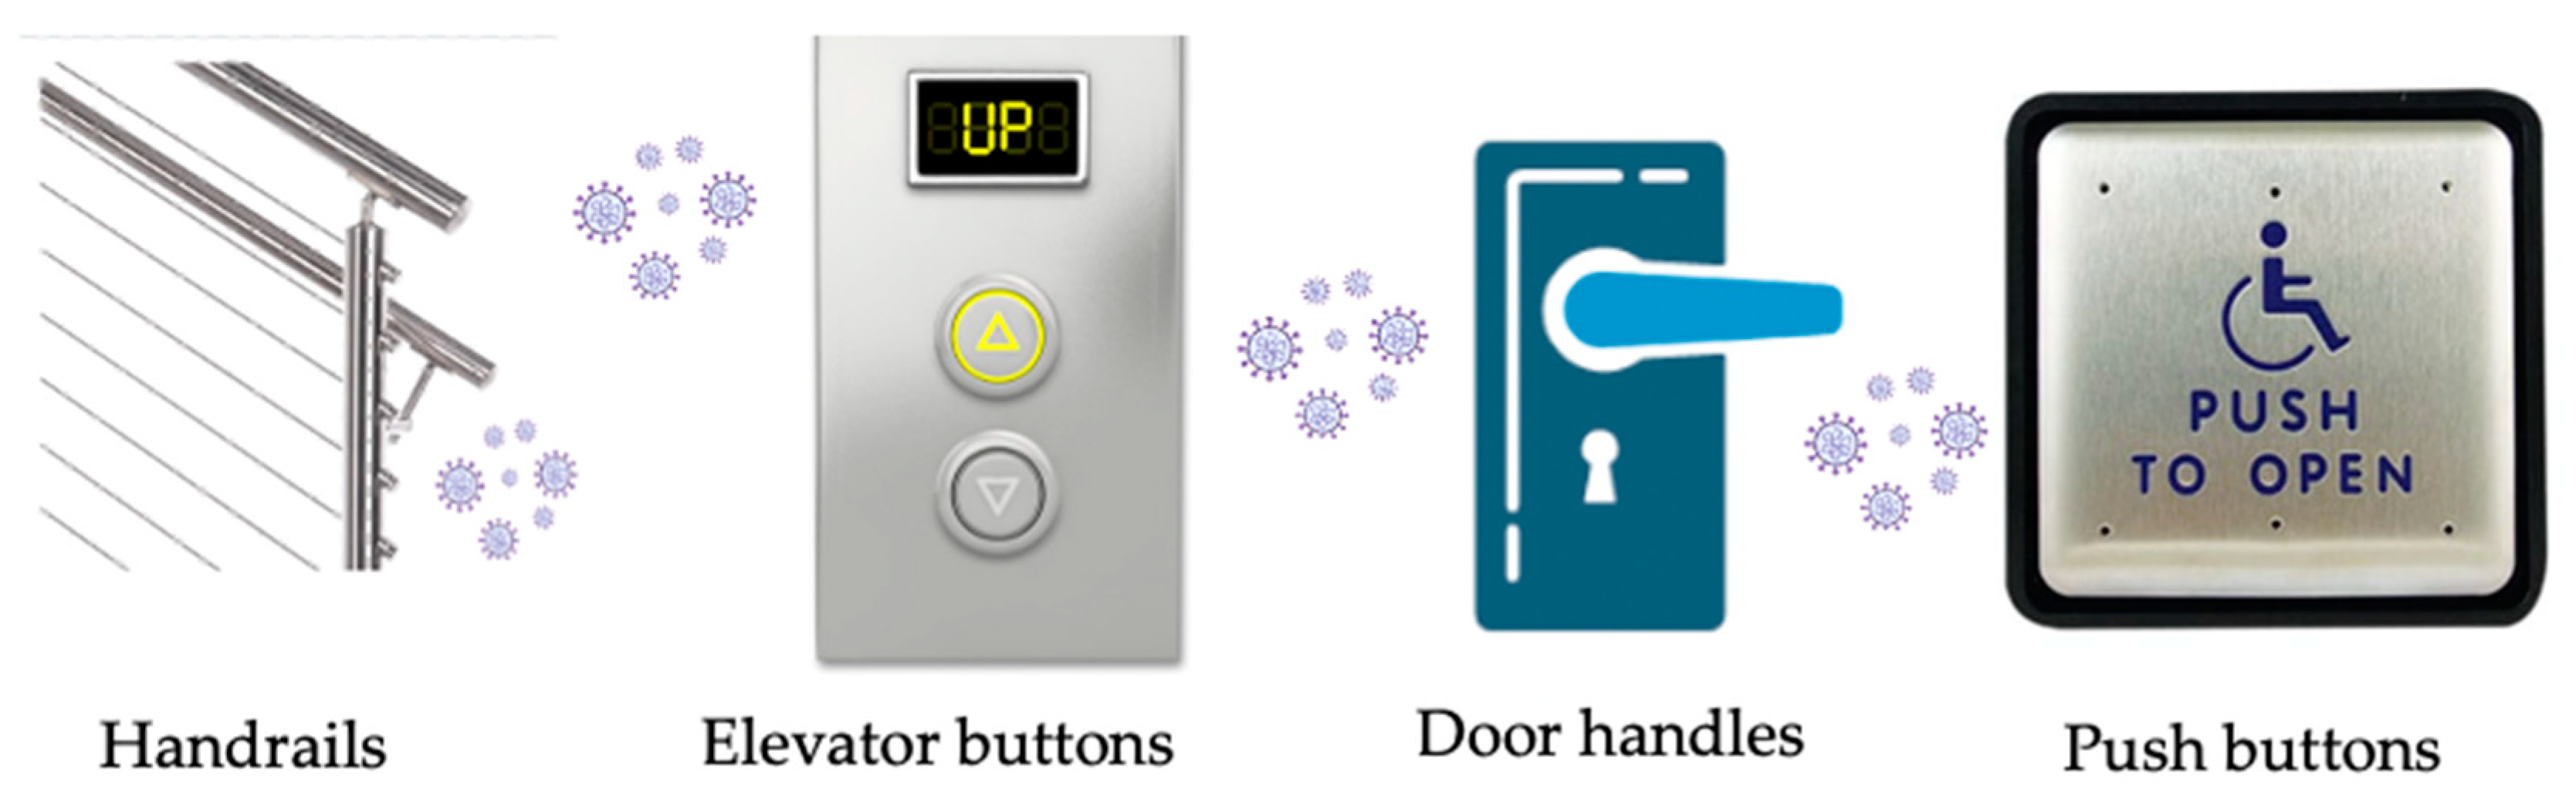
- Surface sampling
2.3. Virus Concentration and RNA Extraction
2.4. Virus Quantification
2.5. Quality Control, Limit of Detection and Statistical Analysis
3. Results
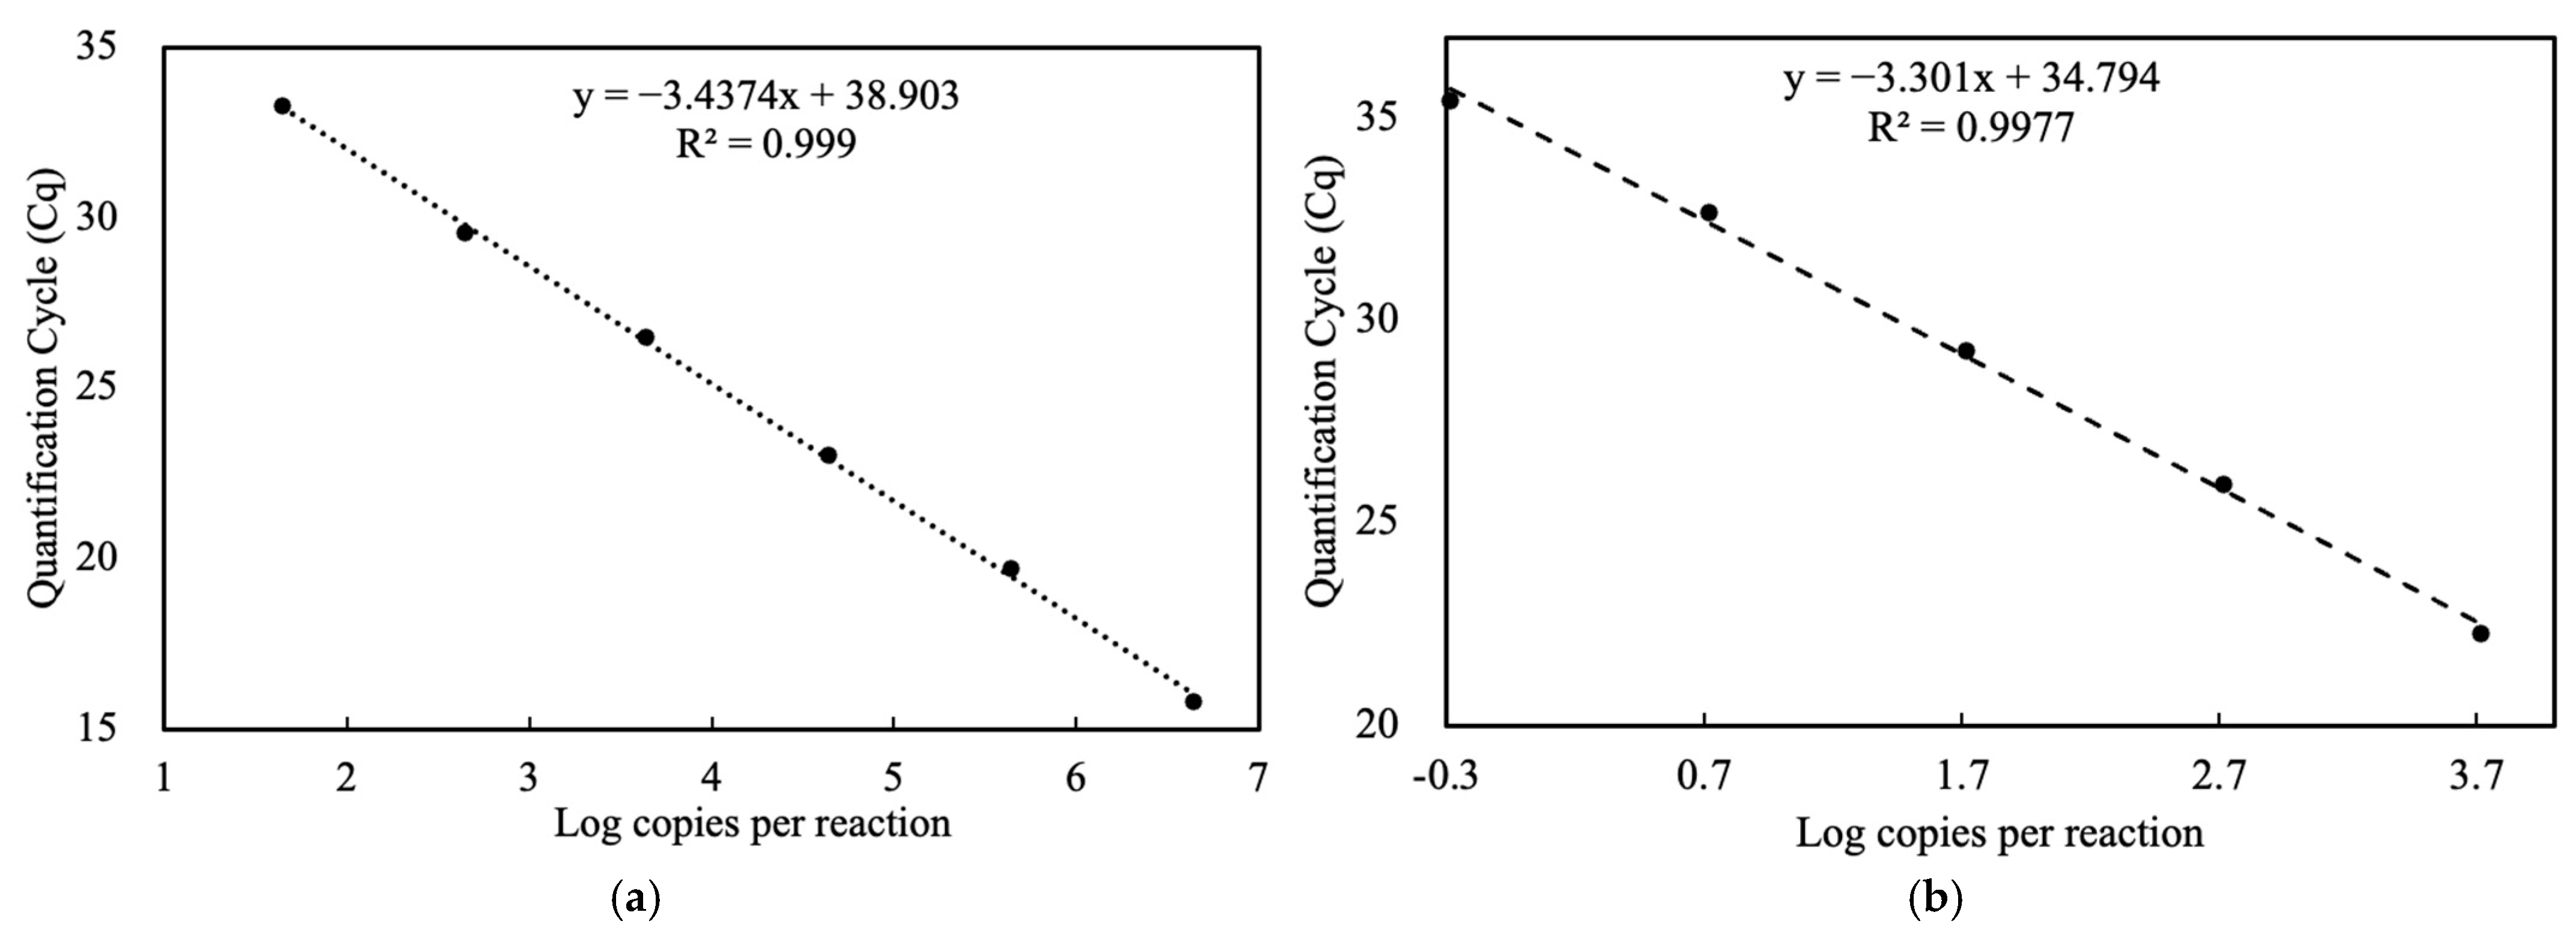
3.1. Standard Curve and Limit of Detection
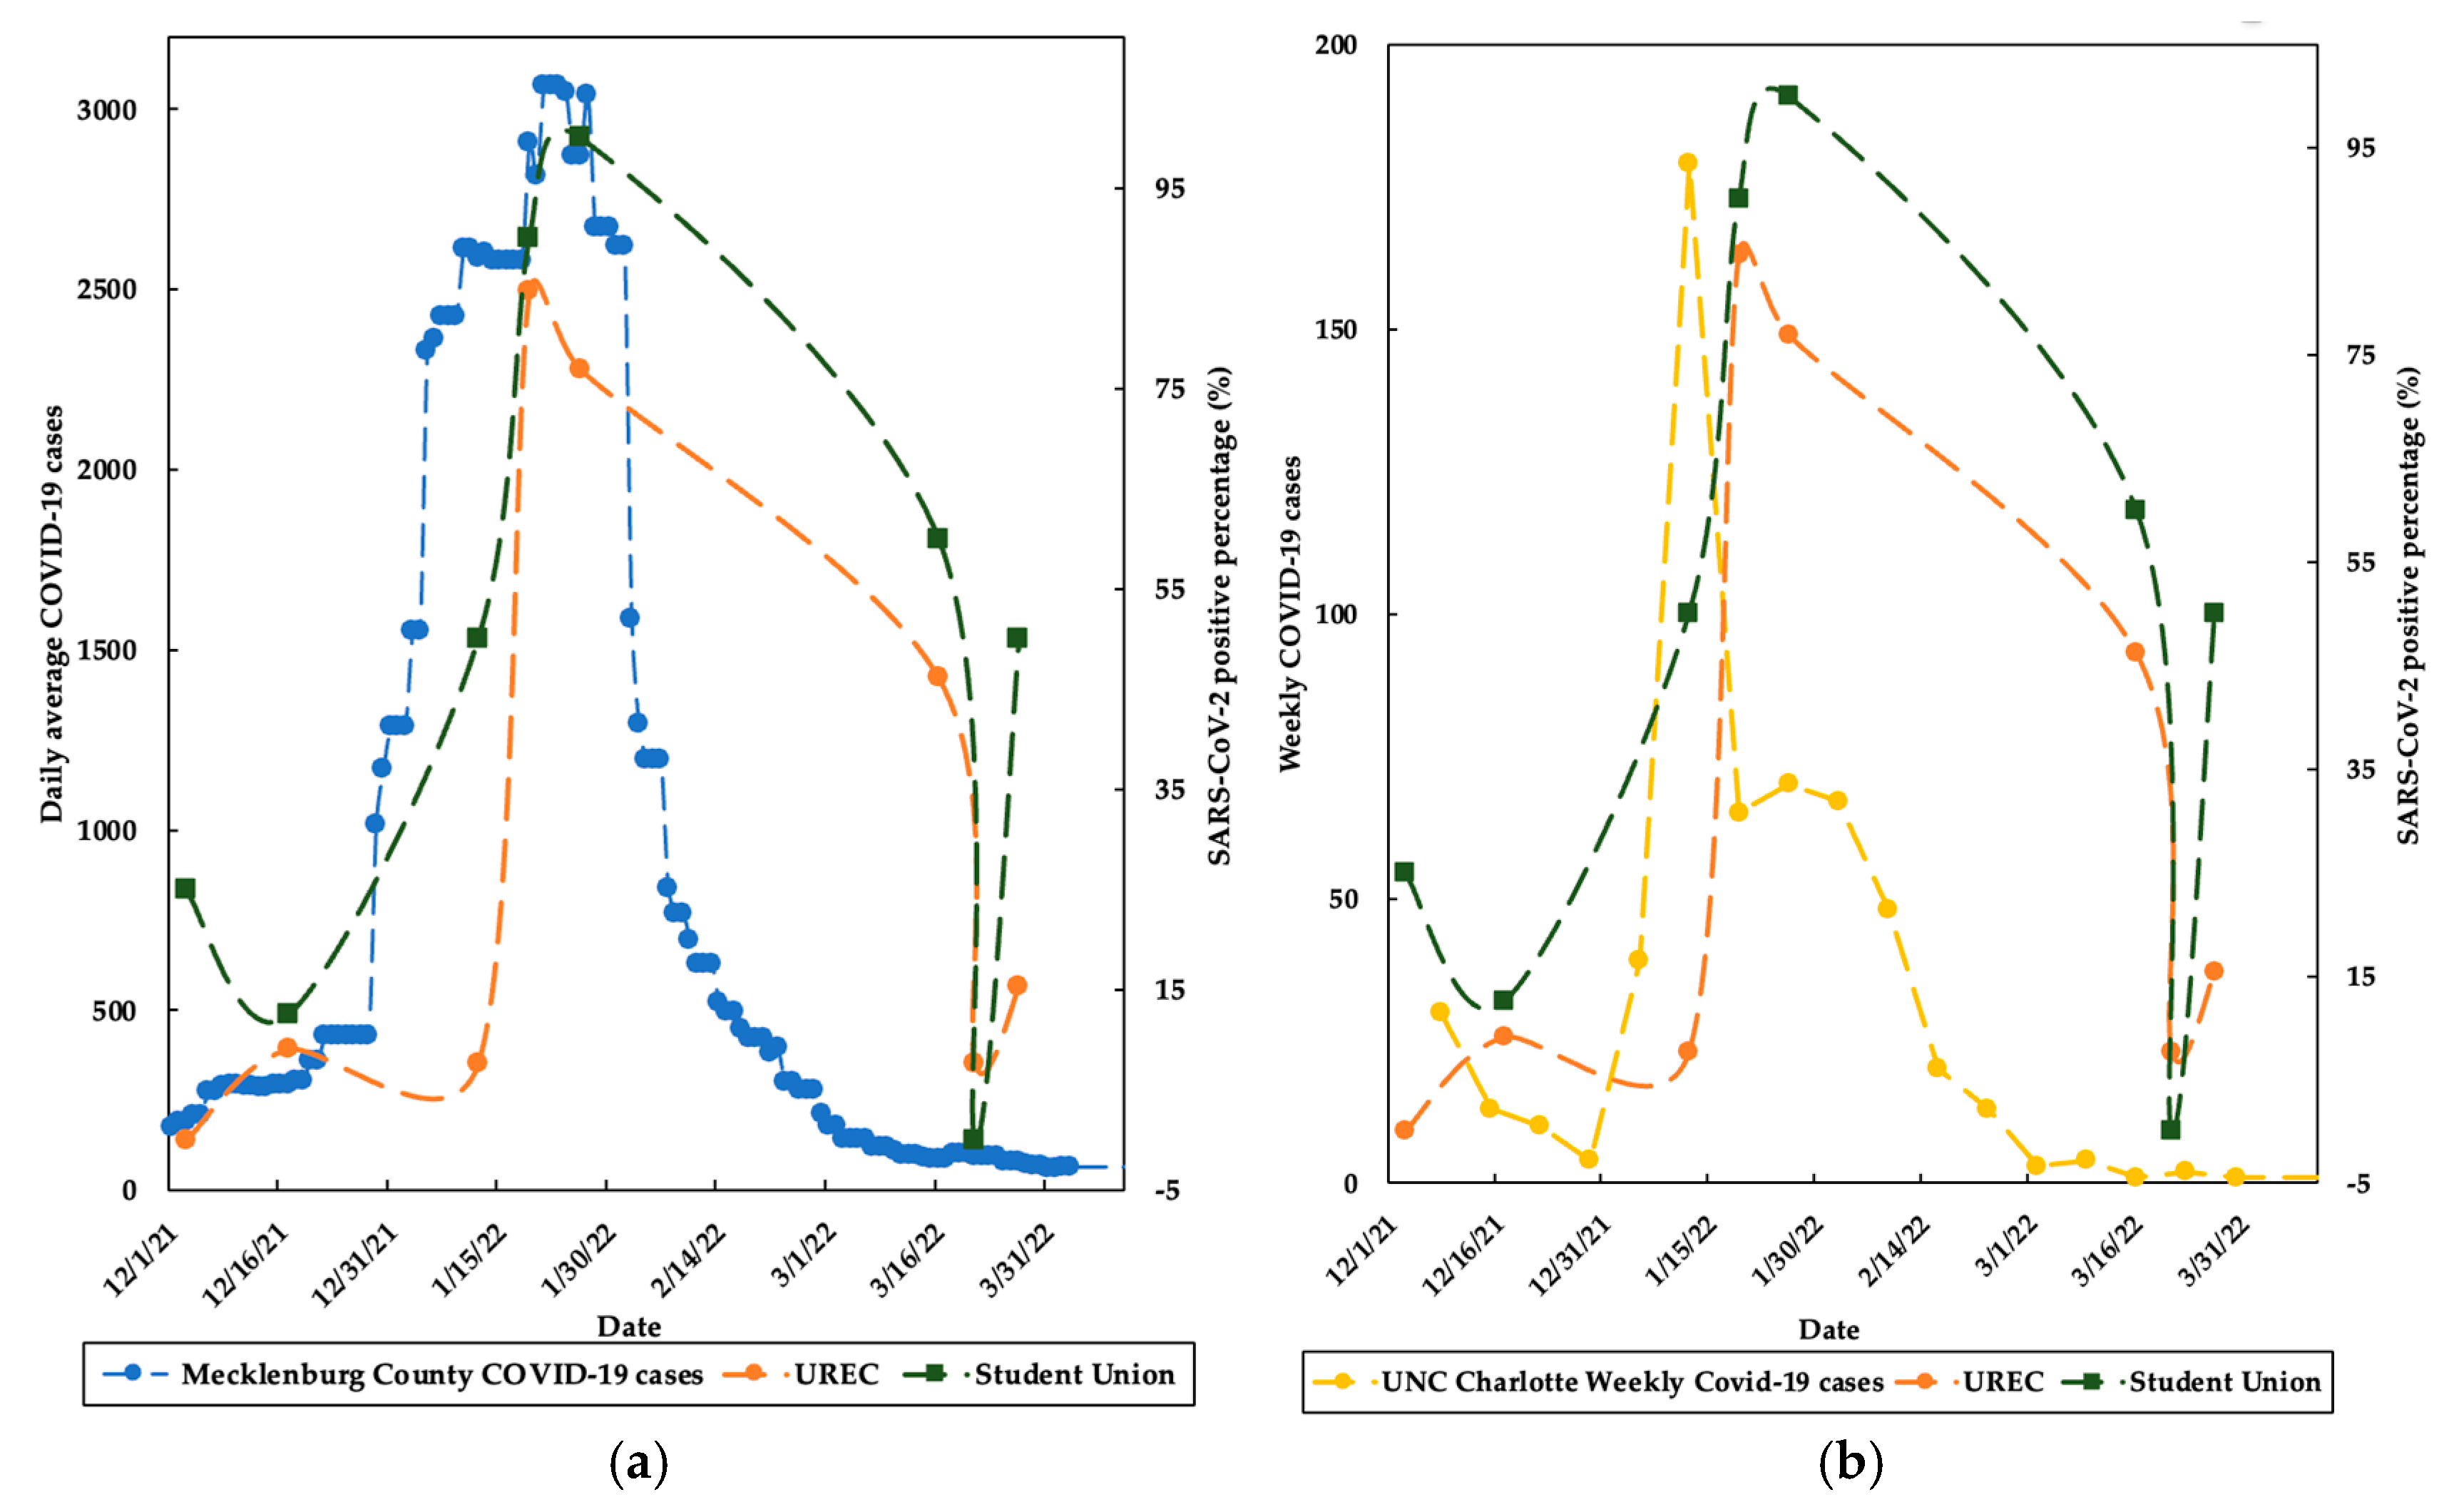
3.2. SARS-CoV-2 Detection in Air and High-Touched Surfaces
3.3. Copies Per Swabbing Area
4. Discussion
5. Conclusions
Author Contributions
Funding
Data Availability Statement
Acknowledgments
Conflicts of Interest
References
- Kampf, G.; Todt, D.; Pfaender, S.; Steinmann, E. Persistence of coronaviruses on inanimate surfaces and their inactivation with biocidal agents. J. Hosp. Infect. 2020, 104, 246–251. [Google Scholar] [CrossRef] [PubMed]
- World Health Organization. Coronavirus Disease 2019 (COVID-19): Situation Report, 73. 2020. Available online: https://www.who.int/docs/default-source/coronaviruse/situation-reports/20200402-sitrep-73-covid-19.pdf (accessed on 12 August 2022).
- World Health Organization. WHO Coronavirus Disease (COVID-19) Dashboard. Available online: https://data.who.int/dashboards/covid19/cases?n=c (accessed on 25 February 2024).
- Dargahi, A.; Jeddi, F.; Vosoughi, M.; Karami, C.; Hadisi, A.; Mokhtari, S.A.; Ghobadi, H.; Alighadri, M.; Haghighi, S.B.; Sadeghi, H. Investigation of SARS CoV-2 virus in environmental surface. Environ. Res. 2021, 195, 110765. [Google Scholar] [CrossRef] [PubMed]
- Ziarani, F.R.; Tahamtan, A.; Safari, H.; Tabarraei, A.; Shahamat, Y.D. Detection of SARS-CoV-2 genome in the air, surfaces, and wastewater of the referral hospitals, Gorgan, north of Iran. Iran. J. Microbiol. 2022, 14, 617. [Google Scholar]
- Aytoğan, H.; Ayintap, E.; Yılmaz, N.Ö. Detection of coronavirus disease 2019 viral material on environmental surfaces of an ophthalmology examination room. JAMA Ophthalmol. 2020, 138, 990–993. [Google Scholar] [CrossRef]
- Tan, K.S.; Ang, A.X.Y.; Tay, D.J.W.; Somani, J.; Ng, A.J.Y.; Peng, L.L.; Chu, J.J.H.; Tambyah, P.A.; Allen, D.M. Detection of hospital environmental contamination during SARS-CoV-2 Omicron predominance using a highly sensitive air sampling device. Front. Public Health 2023, 10, 1067575. [Google Scholar] [CrossRef] [PubMed]
- Morawska, L.; Cao, J. Airborne transmission of SARS-CoV-2: The world should face the reality. Environ. Int. 2020, 139, 105730. [Google Scholar] [CrossRef]
- Morawska, L.; Tang, J.W.; Bahnfleth, W.; Bluyssen, P.M.; Boerstra, A.; Buonanno, G.; Cao, J.; Dancer, S.; Floto, A.; Franchimon, F. How can airborne transmission of COVID-19 indoors be minimised? Environ. Int. 2020, 142, 105832. [Google Scholar] [CrossRef] [PubMed]
- Zhang, R.; Li, Y.; Zhang, A.L.; Wang, Y.; Molina, M.J. Identifying airborne transmission as the dominant route for the spread of COVID-19. Proc. Natl. Acad. Sci. USA 2020, 117, 14857–14863. [Google Scholar] [CrossRef]
- World Health Organization. Cleaning and Disinfection of Environmental Surfaces in the Context of COVID-19: Interim Guidance; WHO, Ed.; WHO: Geneva, Switzerland, 2020. [Google Scholar]
- Van Doremalen, N.; Bushmaker, T.; Morris, D.H.; Holbrook, M.G.; Gamble, A.; Williamson, B.N.; Tamin, A.; Harcourt, J.L.; Thornburg, N.J.; Gerber, S.I. Aerosol and surface stability of SARS-CoV-2 as compared with SARS-CoV-1. N. Engl. J. Med. 2020, 382, 1564–1567. [Google Scholar] [CrossRef]
- Miller, S.L.; Nazaroff, W.W.; Jimenez, J.L.; Boerstra, A.; Buonanno, G.; Dancer, S.J.; Kurnitski, J.; Marr, L.C.; Morawska, L.; Noakes, C. Transmission of SARS-CoV-2 by inhalation of respiratory aerosol in the Skagit Valley Chorale superspreading event. Indoor Air 2021, 31, 314–323. [Google Scholar] [CrossRef]
- Karia, R.; Gupta, I.; Khandait, H.; Yadav, A.; Yadav, A. COVID-19 and its Modes of Transmission. SN Compr. Clin. Med. 2020, 2, 1798–1801. [Google Scholar] [CrossRef] [PubMed]
- Banik, R.K.; Ulrich, A. Evidence of short-range aerosol transmission of SARS-CoV-2 and call for universal airborne precautions for anesthesiologists during the COVID-19 pandemic. Anesth. Analg. 2020, 131, e102–e104. [Google Scholar] [CrossRef] [PubMed]
- Bloise, I.; Gómez-Arroyo, B.; García-Rodríguez, J. Detection of SARS-CoV-2 on high-touch surfaces in a clinical microbiology laboratory. J. Hosp. Infect. 2020, 105, 784–786. [Google Scholar] [CrossRef] [PubMed]
- Razzini, K.; Castrica, M.; Menchetti, L.; Maggi, L.; Negroni, L.; Orfeo, N.V.; Pizzoccheri, A.; Stocco, M.; Muttini, S.; Balzaretti, C.M. SARS-CoV-2 RNA detection in the air and on surfaces in the COVID-19 ward of a hospital in Milan, Italy. Sci. Total Environ. 2020, 742, 140540. [Google Scholar] [CrossRef]
- Chia, P.Y.; Coleman, K.K.; Tan, Y.K.; Ong, S.W.X.; Gum, M.; Lau, S.K.; Lim, X.F.; Lim, A.S.; Sutjipto, S.; Lee, P.H. Detection of air and surface contamination by SARS-CoV-2 in hospital rooms of infected patients. Nat. Commun. 2020, 11, 2800. [Google Scholar] [CrossRef]
- Carraturo, F.; Del Giudice, C.; Morelli, M.; Cerullo, V.; Libralato, G.; Galdiero, E.; Guida, M. Persistence of SARS-CoV-2 in the environment and COVID-19 transmission risk from environmental matrices and surfaces. Environ. Pollut. 2020, 265, 115010. [Google Scholar] [CrossRef]
- Chin, A.; Chu, J.; Perera, M.; Hui, K.; Yen, H.; Chan, M.; Peiris, M.; Poon, L. Stability of SARS-CoV-2 in different environmental conditions. Lancet Microbe 2020, 1, e10. [Google Scholar] [CrossRef]
- Ren, S.-Y.; Wang, W.-B.; Hao, Y.-G.; Zhang, H.-R.; Wang, Z.-C.; Chen, Y.-L.; Gao, R.-D. Stability and infectivity of coronaviruses in inanimate environments. World J. Clin. Cases 2020, 8, 1391. [Google Scholar] [CrossRef]
- Correia, G.; Rodrigues, L.; Afonso, M.; Mota, M.; Oliveira, J.; Soares, R.; Tomás, A.L.; Reichel, A.; Silva, P.M.; Costa, J.J. SARS-CoV-2 air and surface contamination in residential settings. Sci. Rep. 2022, 12, 18058. [Google Scholar] [CrossRef]
- DeWitt, M.E.; Tjaden, A.H.; Herrington, D.; Schieffelin, J.; Gibbs, M.; Weintraub, W.S.; Sanders, J.W.; Edelstein, S.L. COVID-19 symptoms by variant period in the North Carolina COVID-19 community research partnership, North Carolina, USA. Emerg. Infect. Dis. 2023, 29, 207. [Google Scholar] [CrossRef]
- Wright, W.; Sessoms, B. First Reported Positive Case of COVID Omicron Variant in NC Is Tied to College Student. Available online: https://www.charlotteobserver.com/news/coronavirus/article256492116.html (accessed on 12 December 2021).
- InnovaPrep LLC. ACD-200 Bobcat Dry Filter Air Sampler User’s Guide. 2012. Available online: https://photos.labwrench.com/equipmentManuals/19439-6723.pdf (accessed on 23 May 2022).
- Cheng, V.C.-C.; Wong, S.-C.; Chan, V.W.-M.; So, S.Y.-C.; Chen, J.H.-K.; Yip, C.C.-Y.; Chan, K.-H.; Chu, H.; Chung, T.W.-H.; Sridhar, S. Air and environmental sampling for SARS-CoV-2 around hospitalized patients with coronavirus disease 2019 (COVID-19). Infect. Control Hosp. Epidemiol. 2020, 41, 1258–1265. [Google Scholar] [CrossRef] [PubMed]
- Zhou, J.; Otter, J.A.; Price, J.R.; Cimpeanu, C.; Meno Garcia, D.; Kinross, J.; Boshier, P.R.; Mason, S.; Bolt, F.; Holmes, A.H. Investigating severe acute respiratory syndrome coronavirus 2 (SARS-CoV-2) surface and air contamination in an acute healthcare setting during the peak of the coronavirus disease 2019 (COVID-19) pandemic in London. Clin. Infect. Dis. 2021, 73, e1870–e1877. [Google Scholar] [CrossRef] [PubMed]
- Corman, V.M.; Landt, O.; Kaiser, M.; Molenkamp, R.; Meijer, A.; Chu, D.K.; Bleicker, T.; Brünink, S.; Schneider, J.; Schmidt, M.L. Detection of 2019 novel coronavirus (2019-nCoV) by real-time RT-PCR. Eurosurveillance 2020, 25, 2000045. [Google Scholar] [CrossRef] [PubMed]
- CDC, C. Novel Coronavirus (2019-nCoV) Real-Time RT-PCR Diagnostic Panel: CDC-006-00019, Revision: 05 [Internet]; CDC/DDID/NCIRD/Division of Viral Disease: Atlanta, GA, USA, 2020. [Google Scholar]
- Gibas, C.; Lambirth, K.; Mittal, N.; Juel, M.A.I.; Barua, V.B.; Brazell, L.R.; Hinton, K.; Lontai, J.; Stark, N.; Young, I. Implementing building-level SARS-CoV-2 wastewater surveillance on a university campus. Sci. Total Environ. 2021, 782, 146749. [Google Scholar] [CrossRef]
- Juel, M.A.I.; Stark, N.; Nicolosi, B.; Lontai, J.; Lambirth, K.; Schlueter, J.; Gibas, C.; Munir, M. Performance evaluation of virus concentration methods for implementing SARS-CoV-2 wastewater based epidemiology emphasizing quick data turnaround. Sci. Total Environ. 2021, 801, 149656. [Google Scholar] [CrossRef]
- Gonzalez, R.; Curtis, K.; Bivins, A.; Bibby, K.; Weir, M.H.; Yetka, K.; Thompson, H.; Keeling, D.; Mitchell, J.; Gonzalez, D. COVID-19 surveillance in Southeastern Virginia using wastewater-based epidemiology. Water Res. 2020, 186, 116296. [Google Scholar] [CrossRef]
- Bio-Rad. Real-Time PCR Applications Guide. Available online: https://www.bio-rad.com/webroot/web/pdf/lsr/literature/Bulletin_5279.pdf (accessed on 6 December 2022).
- Loh, M.; Yaxley, N.; Moore, G.; Holmes, D.; Todd, S.; Smith, A.; Macdonald, E.; Semple, S.; Cherrie, M.; Patel, M. Measurement of SARS-CoV-2 in air and on surfaces in Scottish hospitals. J. Hosp. Infect. 2023, 133, 1–7. [Google Scholar] [CrossRef]
- Onakpoya, I.J.; Heneghan, C.J.; Spencer, E.A.; Brassey, J.; Plüddemann, A.; Evans, D.H.; Conly, J.M.; Jefferson, T. SARS-CoV-2 and the role of fomite transmission: A systematic review. F1000Research 2021, 10, 233. [Google Scholar] [CrossRef] [PubMed]
- LaTurner, Z.W.; Zong, D.M.; Kalvapalle, P.; Gamas, K.R.; Terwilliger, A.; Crosby, T.; Ali, P.; Avadhanula, V.; Santos, H.H.; Weesner, K. Evaluating recovery, cost, and throughput of different concentration methods for SARS-CoV-2 wastewater-based epidemiology. Water Res. 2021, 197, 117043. [Google Scholar] [CrossRef]
- Watanabe, M.; Ohnishi, T.; Arai, S.; Kawakami, T.; Hayashi, K.; Ohya, K.; Hirose, S.; Yoshinari, T.; Taharaguchi, S.; Mekata, H. Survival of SARS-CoV-2 and bovine coronavirus on common surfaces of living environments. Sci. Rep. 2022, 12, 10624. [Google Scholar] [CrossRef] [PubMed]
- Pecson, B.M.; Darby, E.; Haas, C.N.; Amha, Y.M.; Bartolo, M.; Danielson, R.; Dearborn, Y.; Di Giovanni, G.; Ferguson, C.; Fevig, S. Reproducibility and sensitivity of 36 methods to quantify the SARS-CoV-2 genetic signal in raw wastewater: Findings from an interlaboratory methods evaluation in the US. Environ. Sci. Water Res. Technol. 2021, 7, 504–520. [Google Scholar] [CrossRef] [PubMed]
- Harvey, A.P.; Fuhrmeister, E.R.; Cantrell, M.E.; Pitol, A.K.; Swarthout, J.M.; Powers, J.E.; Nadimpalli, M.L.; Julian, T.R.; Pickering, A.J. Longitudinal monitoring of SARS-CoV-2 RNA on high-touch surfaces in a community setting. Environ. Sci. Technol. Lett. 2020, 8, 168–175. [Google Scholar] [CrossRef] [PubMed]
- Castano, N.; Cordts, S.C.; Kurosu Jalil, M.; Zhang, K.S.; Koppaka, S.; Bick, A.D.; Paul, R.; Tang, S.K. Fomite transmission, physicochemical origin of virus–surface interactions, and disinfection strategies for enveloped viruses with applications to SARS-CoV-2. ACS Omega 2021, 6, 6509–6527. [Google Scholar] [CrossRef] [PubMed]
- Harrison, A.G.; Lin, T.; Wang, P. Mechanisms of SARS-CoV-2 transmission and pathogenesis. Trends Immunol. 2020, 41, 1100–1115. [Google Scholar] [CrossRef]
- Moreno, T.; Pintó, R.M.; Bosch, A.; Moreno, N.; Alastuey, A.; Minguillón, M.C.; Anfruns-Estrada, E.; Guix, S.; Fuentes, C.; Buonanno, G. Tracing surface and airborne SARS-CoV-2 RNA inside public buses and subway trains. Environ. Int. 2021, 147, 106326. [Google Scholar] [CrossRef] [PubMed]
- Ong, S.W.X.; Tan, Y.K.; Chia, P.Y.; Lee, T.H.; Ng, O.T.; Wong, M.S.Y.; Marimuthu, K. Air, surface environmental, and personal protective equipment contamination by severe acute respiratory syndrome coronavirus 2 (SARS-CoV-2) from a symptomatic patient. JAMA 2020, 323, 1610–1612. [Google Scholar] [CrossRef]
- Gharehchahi, E.; Dehghani, F.; Rafiee, A.; Jamalidoust, M.; Hoseini, M. Investigating the Presence of SARS-CoV-2 on the Surfaces, Fomites, and in Indoor Air of a Referral COVID-19 Hospital, Shiraz, Iran. J. Health Sci. Surveill. Syst. 2023, 11 (Suppl. S1), 241–251. [Google Scholar]
- AHA. CDC: Masks Are Now Optional for 90% of the Country. 2022. Available online: https://www.aha.org/news/news/2022-03-04-masks-are-now-optional-90-country (accessed on 17 July 2022).
- Times, T.N. Mecklenburg County, North Carolina COVID-19 Cases. Available online: https://www.nytimes.com/interactive/2021/us/mecklenburg-north-carolina-covid-cases.html (accessed on 12 December 2022).
- Bhattarai, T.; Ebong, A.; Raja, M.Y.A.; Munir, M. Advancements in 275 nm UV-LED Technology for Deactivation of Bacteriophages, Phi6 and MS2. In Proceedings of the 2023 IEEE 20th International Conference on Smart Communities: Improving Quality of Life Using AI, Robotics and IoT (HONET), Boca Raton, FL, USA, 4–6 December 2023; IEEE: New York, NY, USA, 2023. [Google Scholar]
- Delhalle, L.; Taminiau, B.; Fastrez, S.; Fall, A.; Ballesteros, M.; Burteau, S.; Daube, G. Evaluation of enzymatic cleaning on food processing installations and food products bacterial microflora. Front. Microbiol. 2020, 11, 1827. [Google Scholar] [CrossRef]
- Gibson, H.; Taylor, J.; Hall, K.; Holah, J. Effectiveness of cleaning techniques used in the food industry in terms of the removal of bacterial biofilms. J. Appl. Microbiol. 1999, 87, 41–48. [Google Scholar] [CrossRef]
- He, M.; Xiong, J.; Huang, S.; Bian, Y.; Yan, P.; Redding, S.R. Airborne precautions recommended in Wuhan, China for bedside fiberoptic bronchoscopy examination of patients with COVID-19. J. Infect. 2020, 81, e75. [Google Scholar] [CrossRef]
- Bhattarai, T.; Ebong, A.; Raja, M.Y.A. A Review of Light-Emitting Diodes and Ultraviolet Light-Emitting Diodes and Their Applications. Photonics 2024, 11, 491. [Google Scholar] [CrossRef]


| High Touched Surfaces | Level | Sampling Frequency (n) | Positive Frequency | ||
|---|---|---|---|---|---|
| UREC | Stduent Union | UREC | Student Union | ||
| Flooring-based handrails | 1st Flr | NA | 9 | NA | |
| 2nd Flr | 9 | NA | 3 (33.33%) | 5 (55.56%) | |
| 3rd Flr | 9 | NA | 3 (33.33%) | NA | |
| 4th Flr | 9 | NA | 3 (33.33%) | NA | |
| Flooring-based Elavator buttons | 1st Flr | 9 | 9 | 3 (33.33%) | 6 (66.67%) |
| 2nd Flr | 9 | 9 | 0 | 3 (33.33%) | |
| 3rd Flr | 9 | 9 | 3 (33.33%) | 3 (33.33%) | |
| 4th Flr | 9 | NA | 2 (22.22%) | NA | |
| Door handles | Exit 1 | 9 | 9 | 3 (33.33%) | 4 (44.44%) |
| Exit 2 | 9 | 9 | 3 (33.33%) | 3 (33.33%) | |
| Entry 1 | 9 | 9 | 2 (22.22%) | 4 (44.44%) | |
| Entry 2 | 9 | 9 | 2 (22.22%) | 3 (33.33%) | |
| Push Button | Exit | 7 | 8 | 4 (57.14%) | 5 (62.5%) |
| Entry | 7 | 8 | 1 (14.29%) | 4 (50%) | |
Disclaimer/Publisher’s Note: The statements, opinions and data contained in all publications are solely those of the individual author(s) and contributor(s) and not of MDPI and/or the editor(s). MDPI and/or the editor(s) disclaim responsibility for any injury to people or property resulting from any ideas, methods, instructions or products referred to in the content. |
© 2024 by the authors. Licensee MDPI, Basel, Switzerland. This article is an open access article distributed under the terms and conditions of the Creative Commons Attribution (CC BY) license (https://creativecommons.org/licenses/by/4.0/).
Share and Cite
Khanal, N.; Brazell, L.R.; Juel, M.A.I.; Gibas, C.; Schlueter, J.; Munir, M. Investigation of SARS-CoV-2 Contamination of Indoor Air and Highly Touched Surfaces On-Campus Buildings. Appl. Microbiol. 2024, 4, 1384-1395. https://doi.org/10.3390/applmicrobiol4030095
Khanal N, Brazell LR, Juel MAI, Gibas C, Schlueter J, Munir M. Investigation of SARS-CoV-2 Contamination of Indoor Air and Highly Touched Surfaces On-Campus Buildings. Applied Microbiology. 2024; 4(3):1384-1395. https://doi.org/10.3390/applmicrobiol4030095
Chicago/Turabian StyleKhanal, Nita, Lauren Roppolo Brazell, Md Ariful Islam Juel, Cynthia Gibas, Jessica Schlueter, and Mariya Munir. 2024. "Investigation of SARS-CoV-2 Contamination of Indoor Air and Highly Touched Surfaces On-Campus Buildings" Applied Microbiology 4, no. 3: 1384-1395. https://doi.org/10.3390/applmicrobiol4030095
APA StyleKhanal, N., Brazell, L. R., Juel, M. A. I., Gibas, C., Schlueter, J., & Munir, M. (2024). Investigation of SARS-CoV-2 Contamination of Indoor Air and Highly Touched Surfaces On-Campus Buildings. Applied Microbiology, 4(3), 1384-1395. https://doi.org/10.3390/applmicrobiol4030095