Article

Extending Polymer Opal Structural Color Properties into the Near-Infrared

1
Department of Physics, Prifysgol Aberystwyth University, Aberystwyth SY23 3BZ, UK
2
Varichem Co., Ltd., Brynmawr NP23 4BX, UK
3
Minton Treharne & Davies, Coryton, Cardiff CF14 7HY, UK
*
Author to whom correspondence should be addressed.
Micro 2024, 4(2), 387-400; https://doi.org/10.3390/micro4020024
Submission received: 24 April 2024 / Revised: 24 May 2024 / Accepted: 31 May 2024 / Published: 5 June 2024
(This article belongs to the Special Issue Advances in Micro- and Nanomaterials: Synthesis and Applications)

Abstract

:
We report the fabrication and characterisation of near-IR reflecting films and coatings based on shear-assembled crystalline ensembles of polymer composite microspheres, also known as “polymer opals”. Extension of the emulsion polymerisation techniques for synthesis of tractable larger core-interlayer-shell (CIS) particles, of up to half a micron diameter, facilitates the engineering and processing of thin-film synthetic opals, with a tunable photonic stopband spanning an extended spectral range of λ ≈ 700–1600 nm. Samples exhibit strong “scattering cone” interactions, with considerable angular dependence and angle tuning possible, as measured with a goniometric technique. These intense optical resonances in the near-IR, particularly within the important region around λ ~ 800 nm, combined with an appreciable translucency within the visible light spectrum, is indicative of the potential applications in coatings technologies and solar cells.

Graphical Abstract

1. Introduction

Polymer opals (POs) are photonic crystals based on the shear-assembly of polymer composite spheres, which form a viscoelastic quasi-medium [1,2,3,4,5,6]. POs have been reported on extensively in the literature, with very detailed analyses of structural color and the mechanisms of shear-ordering [7,8,9,10,11,12]. However, this has been almost exclusively with consideration of structures showing light scattering and structural color in the visible and near-UV—despite the potential applications and benefits to be garnered from stopband effects beyond the long wavelength end of the visible spectrum and beyond. As the lattice parameter (and thus {111} plane spacing, d111) of an ordered hexagonal close packed (hcp) crystal is expected to show a linear dependence on the diameter (a) of the packed constituent particles, the normal-incidence stopband wavelength (λ) in a medium of effective index n0 is given by-
λ = 2 d 111 n 0 = 2 · 3 a 2 n 0
Such a “stopband” effect will lead to increased diffractive reflection, and reduced sample optical transmittance, for wavelengths at or close to λ [13]. Hence, tuning towards the near-IR spectrum will involve the integration of larger particles; 330 nm and greater, in contrast to the range of 150–330 nm used in visible POs [14].
This article combines understanding of the synthesis techniques for core-interlayer-shell (CIS) nanoparticles (see Figure 1), with a thin-film fabrication and optical characterization pipeline, to engineer and analyze near-IR reflecting films, with potential applications in coatings technologies and solar cells. While the synthesis of infrared reflecting POs has previously been attempted, characterisation of these has not been reported on. In particular, the larger CIS particle sizes associated with longer wavelength resonances may produce PO films with a lower tractability, due to increased polydispersity and a less favourable rheology for shear-assembly, as the volume fraction of the softer shell medium is reduced. With an increased understanding of the “dial-in” synthesis process [15], efforts are here renewed in the fabrication of these target structures and materials. We also consider how the light scattering properties of these films vary from visible opals and identify the associated challenges, especially because of the larger particle sizes and other mechanisms of optical scattering possible.
A series of PO sample films, with tunable photonic stopband behaviors spanning the spectral range of λ ≈ 700–1600 nm, are demonstrated here. These are characterized by well-ordered opaline structures across films of 10–100 s of microns thickness. Optical extinction coefficients exceeding 10 mm−1 on resonance are measured, with an appreciable translucency of visible light above the stopband energy still in evidence. Further studies on opals compatible with the important near-IR region around λ ~ 800 nm illustrate the resonant “scattering cone” interactions, with considerable angle tuning possible, both inside and outside of the plane of incidence.
Infrared reduction coatings have potential application in, for example, silicon solar cells; because insolation is a key mechanism causing component and module heating, with a commensurate negative impact on stability and optoelectronic efficiency. Li et al. [16] detail this notion, applying a 1D ‘photonic cooler’ layer to an encapsulated solar cell, which reduced heating of the device by close to 6 °K. Elsewhere, there is interest in the integration of photonic crystals for light trapping in nano-crystalline silicon photovoltaic (PV) devices as a means of improving the efficiency of the devices at near-IR and IR wavelengths [17,18,19,20,21,22,23]. In most cases, this primarily works by increasing the path length of photons within the PV active layers to increase light absorption and thus device output. While many photonic crystals in the literature can operate with bandgaps above λ = 1 µm, the work reported here demonstrates a ‘proof of concept’ for the often under-reported “soft matter” approach. We highlight the clear benefits of POs as functional coatings, on account of their mechanical robustness, and the ability to retroactively apply the films to existing devices (as inexpensive laminates or “transfers”), as well as their inherent suitability for large-scale areas.

2. Materials and Methods

2.1. Opal Synthesis and Thin-Film Fabrication

The polymer opal core-interlayer-shell (CIS) nanoparticles are synthesized by a multi-stage emulsion polymerisation (EP). This technique has a number of benefits over other polymerisation methods, with a high yield, and allowing for good control of particle size, unlike suspension polymerisation for example [24]. Perhaps the most attractive property of the process for polymer opal synthesis is that EP results in a low polydispersity [25,26], controllable via several interconnected factors, including but not limited to: reaction temperature and thermal control, monomer purity, initiator selection and quantity, and agitation (stirring) rate [15]. In EP, the self-organization and formation of nanoparticles is the result of hydrolysis interactions; with particle sizes and dispersion thus strictly depending on the quantity of water in the system, and thus on the kinetics or diffusion of the hydrolysis regime.
The synthesis procedure is reported for ca. 1 kg solid polymer yield. Variations on this method have been documented in a number of reports [4,27,28,29].

2.1.1. Reagents

The materials (and suppliers) used are as follows; styrene (Sigma Aldrich, Burlington, MA, USA, stabilized), 1,4-butanediol diacrylate (BDDA, Sigma Aldrich, technical grade ~75 ppm inhibited), sodium bisulphate (Acros Organics, Geel, Belgium), Dowfax 2A1 (Dow Chemical Company, 50% in water), ethyl acrylate (Acros Organics), allyl methacrylate (Acros Organics, 98% stabilized), iso-butyl methacrylate (Acros Organics, 99% stabilized), 2-hydroxyl methacrylate (Sigma Aldrich), 2-hydroxyl methacrylate (Sigma Aldrich), methanol (VWR), acetone (VWR), industrial methylated spirit (IMS, VWR).

2.1.2. Procedure

The reaction vessel was nitrogen-flushed with a reflux-condenser. The vessel was heated to and held at a temperature of 65 °C, stirred at 200–250 rpm. Charged in to the reaction vessel was 1120 g demineralized water, 14.4 g styrene, 1.6 g 1,4-butanediol diacrylate, 1.17 g emulsifier, 12 g demineralized water, 2.07 g initiator, and 0.29 g sodium bisulphate were added to the reaction vessel immediately following. The vessel was stirred for 10 min. This stage created the polystyrene particle nucleation loci and free radicals.
Charged into the secondary vessel was 360 g demineralized water, 280 g styrene, 28 g 1,4-butanediol diacrylate, 0.97 g emulsifier, 1.6 g potassium hydroxide, and 0.88 g Dowfax 2A1. This was stirred, and simultaneously added dropwise to the primary vessel at a rate of 10 g of solution per minute. Following completion of the addition, the reaction vessel was stirred for 10 min. This stage synthesized cross-linked polystyrene cores.
Charged into the reaction vessel was 2 g demineralized water and 0.1 g initiator. This was stirred for 10 min. This stage re-initiated the reaction of the polystyrene particles. Charged to the secondary vessel was 128 g demineralized water, 100 g ethyl acrylate, 12 g allyl methacrylate, 0.21 g emulsifier, and 0.84 g Dowfax 2A1. This was added dropwise to the main vessel at a rate of 10 g of solution per minute. Following completion of the addition, the vessel was stirred for 30 min. This served to grow the poly(methyl-methacrylate) interlayer onto the polystyrene particles, which acted as seeds.
To the secondary vessel 640 g demineralized water, 402.4 g ethyl acrylate, 140 g iso-butyl methacrylate, 16.8 g 2-hydroxyl methacrylate, 1.7 g emulsifier, and 0.8 g potassium hydroxide was added. This was then added dropwise to the primary vessel at a rate of 10 g of solution per minute and stirred for 30 min. This stage grafts the poly(ethyl-acrylate) shell onto the polystyrene/poly(methyl-methacrylate) core-interlayer particles which act as seeds.
The solution was cooled. Solids were filtered using a 100 µm sieve and removed. Added to the filtered solution was 2 L methanol, plus 20 mL of concentrated brine solution, and stirred for 30 min. The ionic strength within the brine results in sedimentation of the suspended particles. Solutions were added to an equal volume of demineralized water and filtered using a 100 µm sieve. After rinsing with acetone and industrial methylated spirit, the resultant solids were dried in warm air by vacuum oven at 45 °C for 3 days.
The quantity of emulsifier can be tailored to control the desired particle size [30]; hence, EP can be used to obtain different particle sizes and thus a broad range of structural color effects in polymer opals. In previous work, the standard range of PO particle diameters are typically around 150–350 nm [15,31] and, as reported here, particles of ≈ 330–480 nm displaying near-infrared structural color.
The synthesis of large CIS polymer opal nanoparticles (>300 nm) can be challenging, both on account of the difficulty in maintaining the stable growth of polymer particles in suspension (particles have been seen to fall out of suspension in many preliminary investigations), and also the slow growth rates associated with the requirement for longer polymer chains. With the latter concern, one consideration is that the established volume fraction of core:interlayer:shell is highly important for adequate chemical binding of the shell material to the core. The associated preference for higher process temperatures (and thus reaction rates) leads to increased evaporation of water from the system, fueling concentration increases and lowering the suspension stability. A workable compromise can be found by limiting the process temperature to 70–75 °C.
The end material is then homogenized in quantities of 3–6 g in a Haake Minilab II co-rotating twin-screw extruder at 150 °C. This allows for internal pressure and extrusion rate to be monitored, thus there is some control of the melt during the process. Material is compacted within the extruder until pressures of around 100 bar are achieved, and then melt-extruded at a screw rate of 60 rpm into 1 mm thick, 5 mm wide ribbons. These ribbons are re-inserted into the extruder twice further to ensure full homogenization. For lab-scale synthesis, the ribbons are then cut into strips around 1 cm in length before being roll-laminated between polyethylene terephthalate (PET) tapes by a bespoke press laminator. This is usually performed by placing 2–4 strips together through the laminator to ensure adequate sample width. The custom laminator allows for tuning of both thin film thickness and roller temperature—allowing for versatility in material processing, for example CIS particles with a higher glass transition temperature. The laminator compresses the PET coated ribbons into a characteristic ‘tear drop’ shape (Figure 1b). The rheological properties of the material has some impact on the resultant PO film thickness, which the larger-core samples having a distinctively less gum-like character than those with smaller cores. As the larger CIS particles are generated primarily by the extension of the core radii, within a more fixed thickness of the soft-shell growth, this leads to samples with a slightly increased core:shell volume ratio, and therefore some changes in the rheology and material tractability, as also noted in earlier work on POs covering the UV-visible ranges [32]. Workable thicknesses for visible POs might be in the range of 80–120 μm (so 280–320 μm including the PET tapes), whereas 30–50 μm is more typical for an infrared PO film
Table 1 lists the full array of samples prepared for this study. CIS diameters, as confirmed by Dynamic Light Scattering (DLS) analysis range from 335 to 510 nm. Thin film samples were then generated using the shear-ordering method according to previously reported protocols [33,34]. In brief summary, Bending-Induced Oscillatory Shear (BIOS) process is considered the optimal method for PO fabrication at present due to its speed, effectiveness, and potential for scalability. For consistency, all samples (1 through 5) were prepared with the optimized 40 cycles of shear-ordering; however, Sample 2 with the expected around λ ~ 800 nm (later confirmed empirically) was prepared as a series of films with 0, 5, 10, 20, and 40 applied BIOS cycles.
During BIOS as reported by Zhao et al. [7], the films are passed through a bending angle of 180° over rollers heated to 120 °C for shear strains of 300% at a shear rate of 1.5 s−1. This shear is transferred through the PET by the difference in path length across the ‘sandwich’ structure, resulting in particle displacement. Beginning at the outer edges, order permeates the film with successive shearing [35,36]. This method is performed iteratively for 40 passes, to give the most intense color appearance. Zhao et al. describe both a uni-axial and bi-axial shear method; however, only samples generated from uni-axial shear ordering are discussed here. A simplified diagram of the BIOS process is given in Figure 1 (the processing direction is defined as the ‘shear direction’, p ^ ), with photographic images of a pre-BIOS opal and 40-BIOS opal shown for comparison. Li et al. [28] have since demonstrated the tuneability and scalability of the BIOS process for industrial photonic crystal fabrication.

2.2. Structural Characterisation

In order to image the particle packing of POs with Scanning Electron Microscopy (SEM), care had to be taken with the sample preparation in order to prevent inadvertent sample damage. Simple cutting would be insufficient to examine the true film packing because a knife would shear the particles and hence likely induce ordering. For this reason, films were cryogenically cooled with liquid nitrogen below the glass transition temperature of the PEA matrix (around −15 °C). This made the films brittle and allowed for them to be fractured into slices while preserving structural integrity. The slices were then cut to shape for placement on carbon tape, which was placed on an aluminium stub, with the fractured face facing upwards. For SEM, samples were pre-coated with around 4 nm of Pt/Pd, to reduce charging effects. Measurements were taken with the JEOL 840A cryo-SEM instrument (Akishima, Japan) at room temperature, operating in secondary electron detection (SED) mode at 10 kV accelerating voltage.

2.3. Optical Spectroscopy

2.3.1. Thin-Film Transmittance

The films were examined with the FOIS-1 integrating sphere to preliminarily measure both the photonic bandgap as well as the transmissivity of the films either side. This was carried out with the Stellarnet Silver Nova CCD spectrometer as previously [37], and the light source used was a broadband fibre-coupled tungsten light source (chosen because of the high content of 700 nm+ light) and fiber collimator. The opal is mounted at the entrance to the sphere, and the fibre collimator supplying light is fixed on a goniometer arm with movement centered on the integrating sphere port. This allowed the film transmission to be examined as a function of incident angle, given as displacement from the surface normal. For measurements beyond λ = 1120 nm, an Ocean Optics InGaAs spectrometer was used to extend normal incidence measurements out to 1600 nm.

2.3.2. Goniometric Reflectometry

Goniometric study of these films was undertaken with the Stellarnet Silver Nova CCD spectrometer in conjunction with a fibre-coupled tungsten light source, within a bespoke goniometer instrument. The experimental set up and geometry is illustrated in the Appendix A, with measurements collected as a function of angle of incidence ( θ I ), detector angle ( θ m ) from the zenith, and detector azimuth ( φ m ) relative to the plane of incidence. Individual spectra taken at each measured angle are normalized to a Lambertian white-light scattering standard (Spectralon 99%), and are spliced together into an intensity/contour plot to allow quantitative determination of scattering cone width and angle tuning phenomena. Specular and obscuration effects are removed as far as is practicable for these resolutions—although some of the former is seen to remain in the form of broadband scattering.

3. Results

3.1. Structures

Imaging of thin film slices in Figure 2 shows the typical ordering expected of BIOS-processed POs, focusing on Sample 2 as an exemplar. Figure 2a illustrates a pre-BIOS laminated film, with the characteristic surface ordering of around 5 particle layers (film depth of around 2 µm) before a more amorphous phase prevails. The surface of the same film is shown in Figure 2b, where the lamination procedure has induced regions of hexagonal close packing, with this verified by autocorrelation function (ACF) analysis (inset). Figure 2c shows a micrograph of a cleaved 40 BIOS opal, with the hcp ordering having permeated into the film over many particle layers. The surface of this film continues to display hexagonal close packing as expected in Figure 2d, with the auto-correlation function inset having intensified as compared to the pre-BIOS opal. This means that there is greater spatial overlap of the z-axis greyscale intensity, and thus an improved level of ordering. As compared to the same analysis of the pre-BIOS opal in Figure 2b, it can also be seen from the ACF that the length scale between intensity peaks has slightly decreased, showing a change in packing density in this plane. This is the result of additional shear having the effect of further melting and thus deformation of the PEA matrix driving the PS cores closer [7,38]. This same area of examination is transformed by 2D Fast Fourier Transform (FFT) with the Hann windowing type; radial distribution analysis of this transform gives one dominant spatial frequency peaking at approximately 2.8 µm−1, which converted to real space distance gives a length scale of approximately 350nm. This is in good agreement with particle sizing as obtained for Sample 2 from DLS, which gives a final CIS particle size of around 350–360 nm, shown in Figure 2f. Correlation function analysis resulted in a polydispersity index (PDI) of 0.089, as calculated from averages of three runs, giving an acceptably monodisperse distribution for shear-assembly to be uninhibited [31]. While the PDI for these large particles was higher than that achieved than for UV-Vis opals [32,37], it is nevertheless reflects general trends in higher degrees of polydispersity seen for the shell growth stage than that of the cores [15]. One can additionally infer from the microscopy, particularly in Figure 2b,d, the high degree of monodispersity of the PS cores, and this is reflected in the DLS data by the marked sharpness of the core-particle peak.

3.2. Optical Characterisation

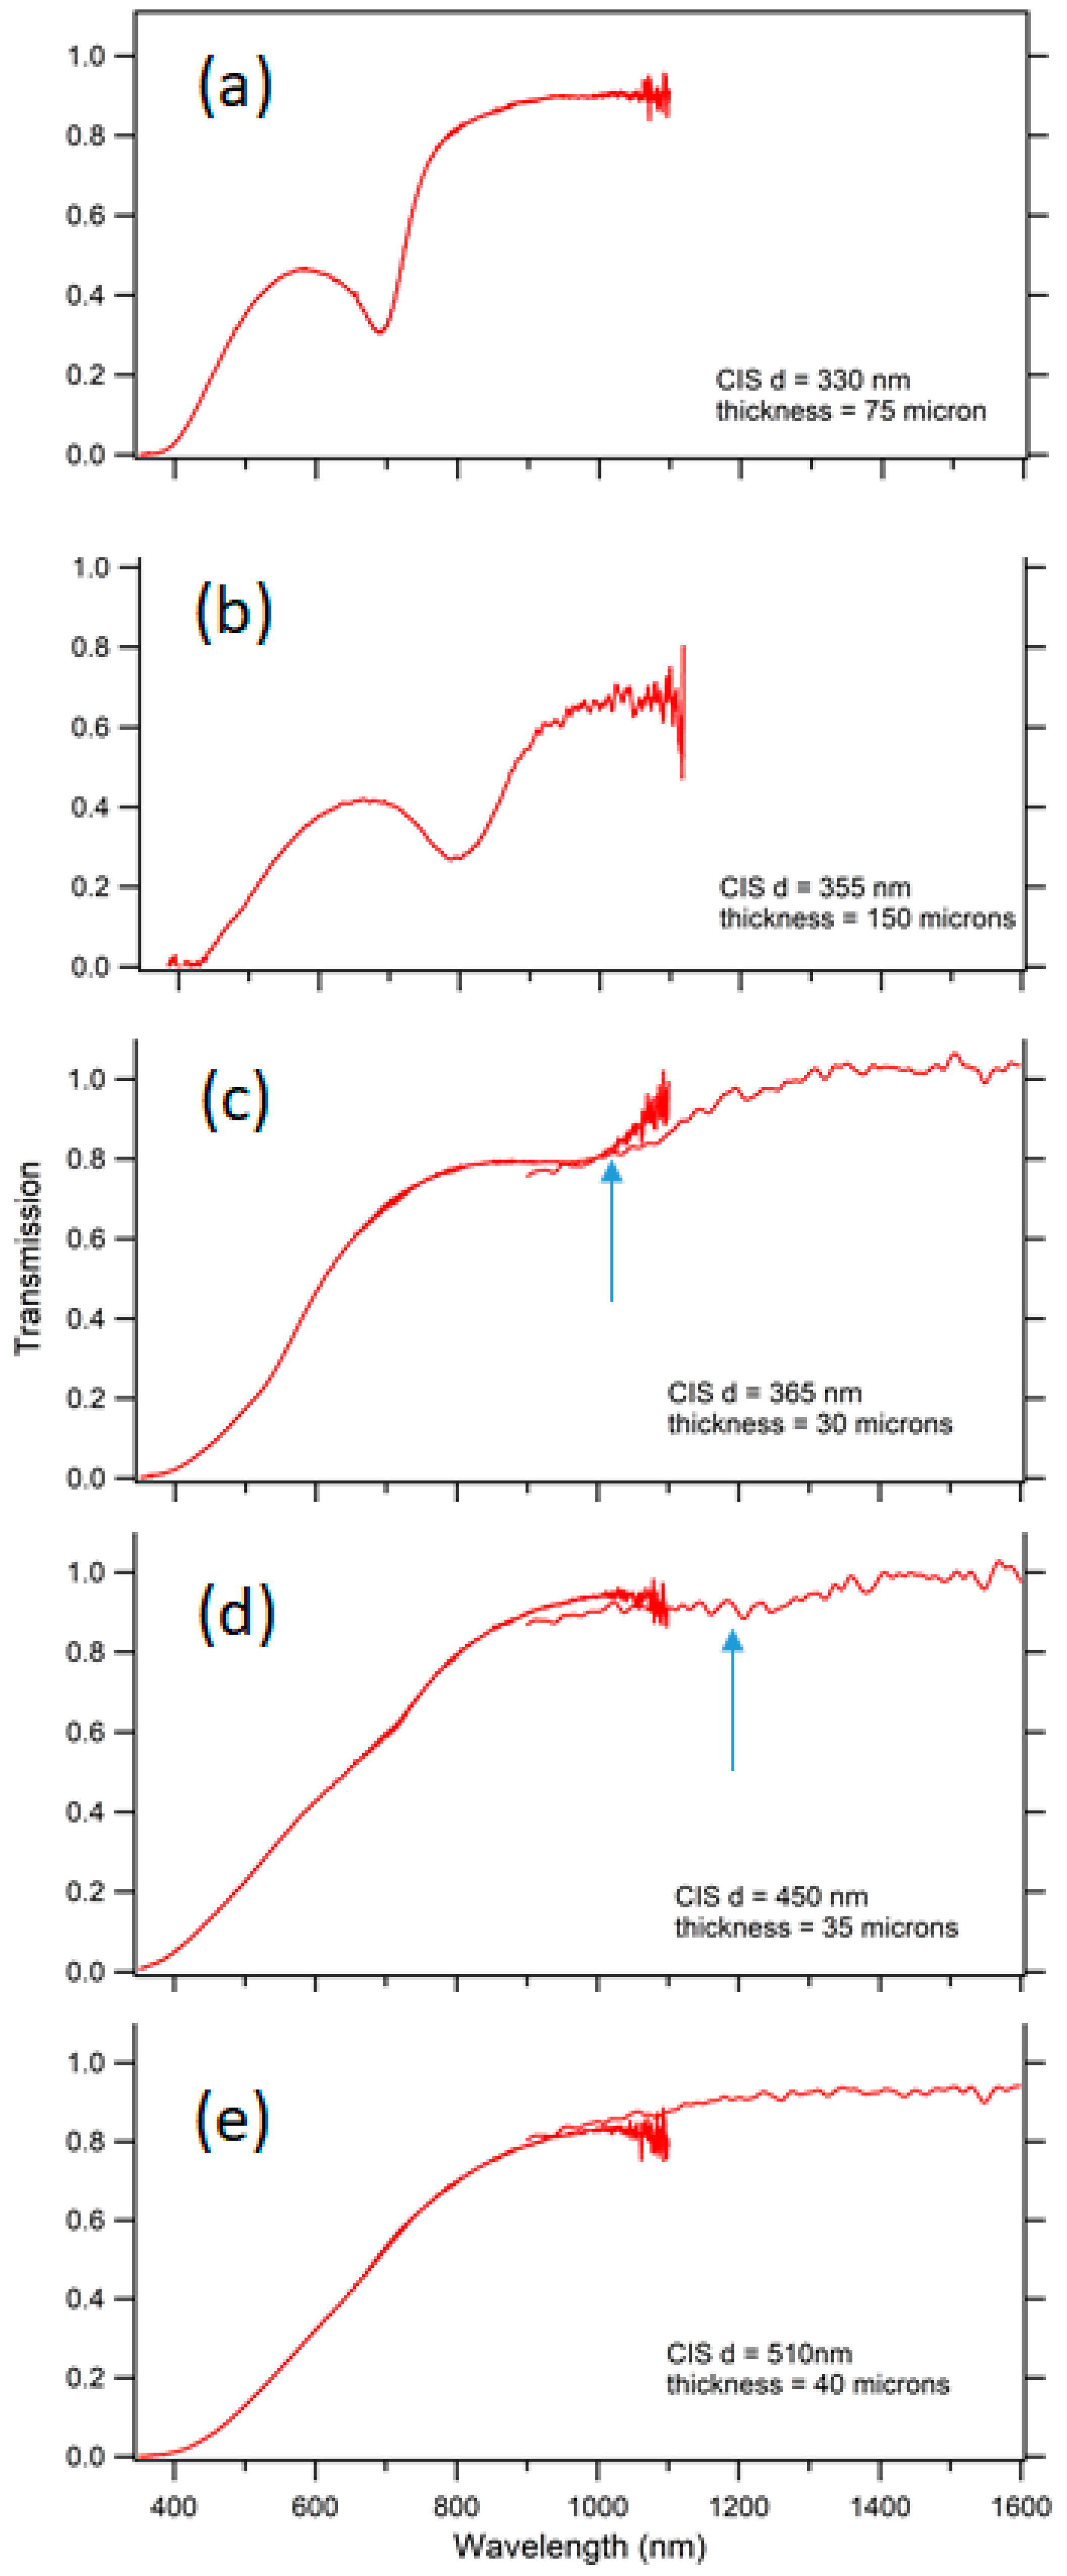
3.2.1. Visible/NIR Spectroscopy

In Figure 3, the full visible to near-IR optical transmission spectra for thin opaline films of Samples 1 to 5 are shown. Samples 1 to 4 all show significant near-IR stopband features close to the expected resonant λ, as tabulated in Table 1 assuming an hcp packing model. In the case of Sample 5, the lack of (primary) stopband is simply due to the larger CIS particle size (diameter of >500 nm), which we expect to take the corresponding λ111 scattering peak beyond the measurable spectroscopic range. The on-resonance transmission values may be combined with the measured film thickness to determine the optical extinction coefficients (α), as listed in Table 1 as an intensive measure of the stopband effect. Values exceeding 10 mm−1 are found for Samples 1 and 2, which are comparable with earlier reports on high-quality visible POs [8]. For Samples 3 and 4, with stopbands moving further into the IR at λ > 1000 nm, the value of α decreases to the range of 3-8 mm−1, offering some initial evidence of the reduced efficacy of shear-ordering in this regime of larger CIS diameters, higher core-shell volume ratio, and less favourable overall rheology. It is recognised that films with stopband properties in the 1.3–1.5 μm telecommunications window are a putative area of interest, and future research may focus on the improved tractability of samples, via glass transition engineering or use of thiolised additives [35], for example.
As a further consequence of the different rheology, the resultant brittle (and less viscoelastic) properties of the films made removal from the PET lamina without causing film damage challenging, and this was especially the case for Samples 4 and 5. As such, all characterization of these films is carried out with a single layer of PET substrate, leading to the sharp decrease in transmission at 400 nm [39]. However, PET is known to have particularly high transmissivity across the remainder of the spectrum of interest and, as such, should not interfere with the pertinent optical characterizations. In all cases, Samples 1–5, transmissivity for energies immediately above the infrared stopband is seen to improve markedly; and the transmission peak in the mid-visible band is in the 40–50% range for Samples 1 and 2, rising to 60–70% for Samples 3, 4, and 5. Fabrication of thinner films had the added benefit of increased discernibility between the optical properties of the film as the incident angle is varied, due to the reduced optical attenuation; this is in addition to facile tuning of the photonic bandgap wavelength.
In Figure 4, a more detailed analysis of the tunable optical properties (around λ ≈ 800–900 nm) of 40-BIOS opals based on Sample 2 is presented. The angle tuning of the transmission stopband exhibits a blue-shift Δλ of 52 nm occurs in tuning from normal incidence to 40°. In Figure 4b, the commensurate intense optical reflectivity of films (greater than 40% relative to the Lambertian standard) shows a similar blue-shift tuning effect with increasing incident angle. The overall intensity increases for angles closer to normal incidence, as may be expected from a simple geometric principle.

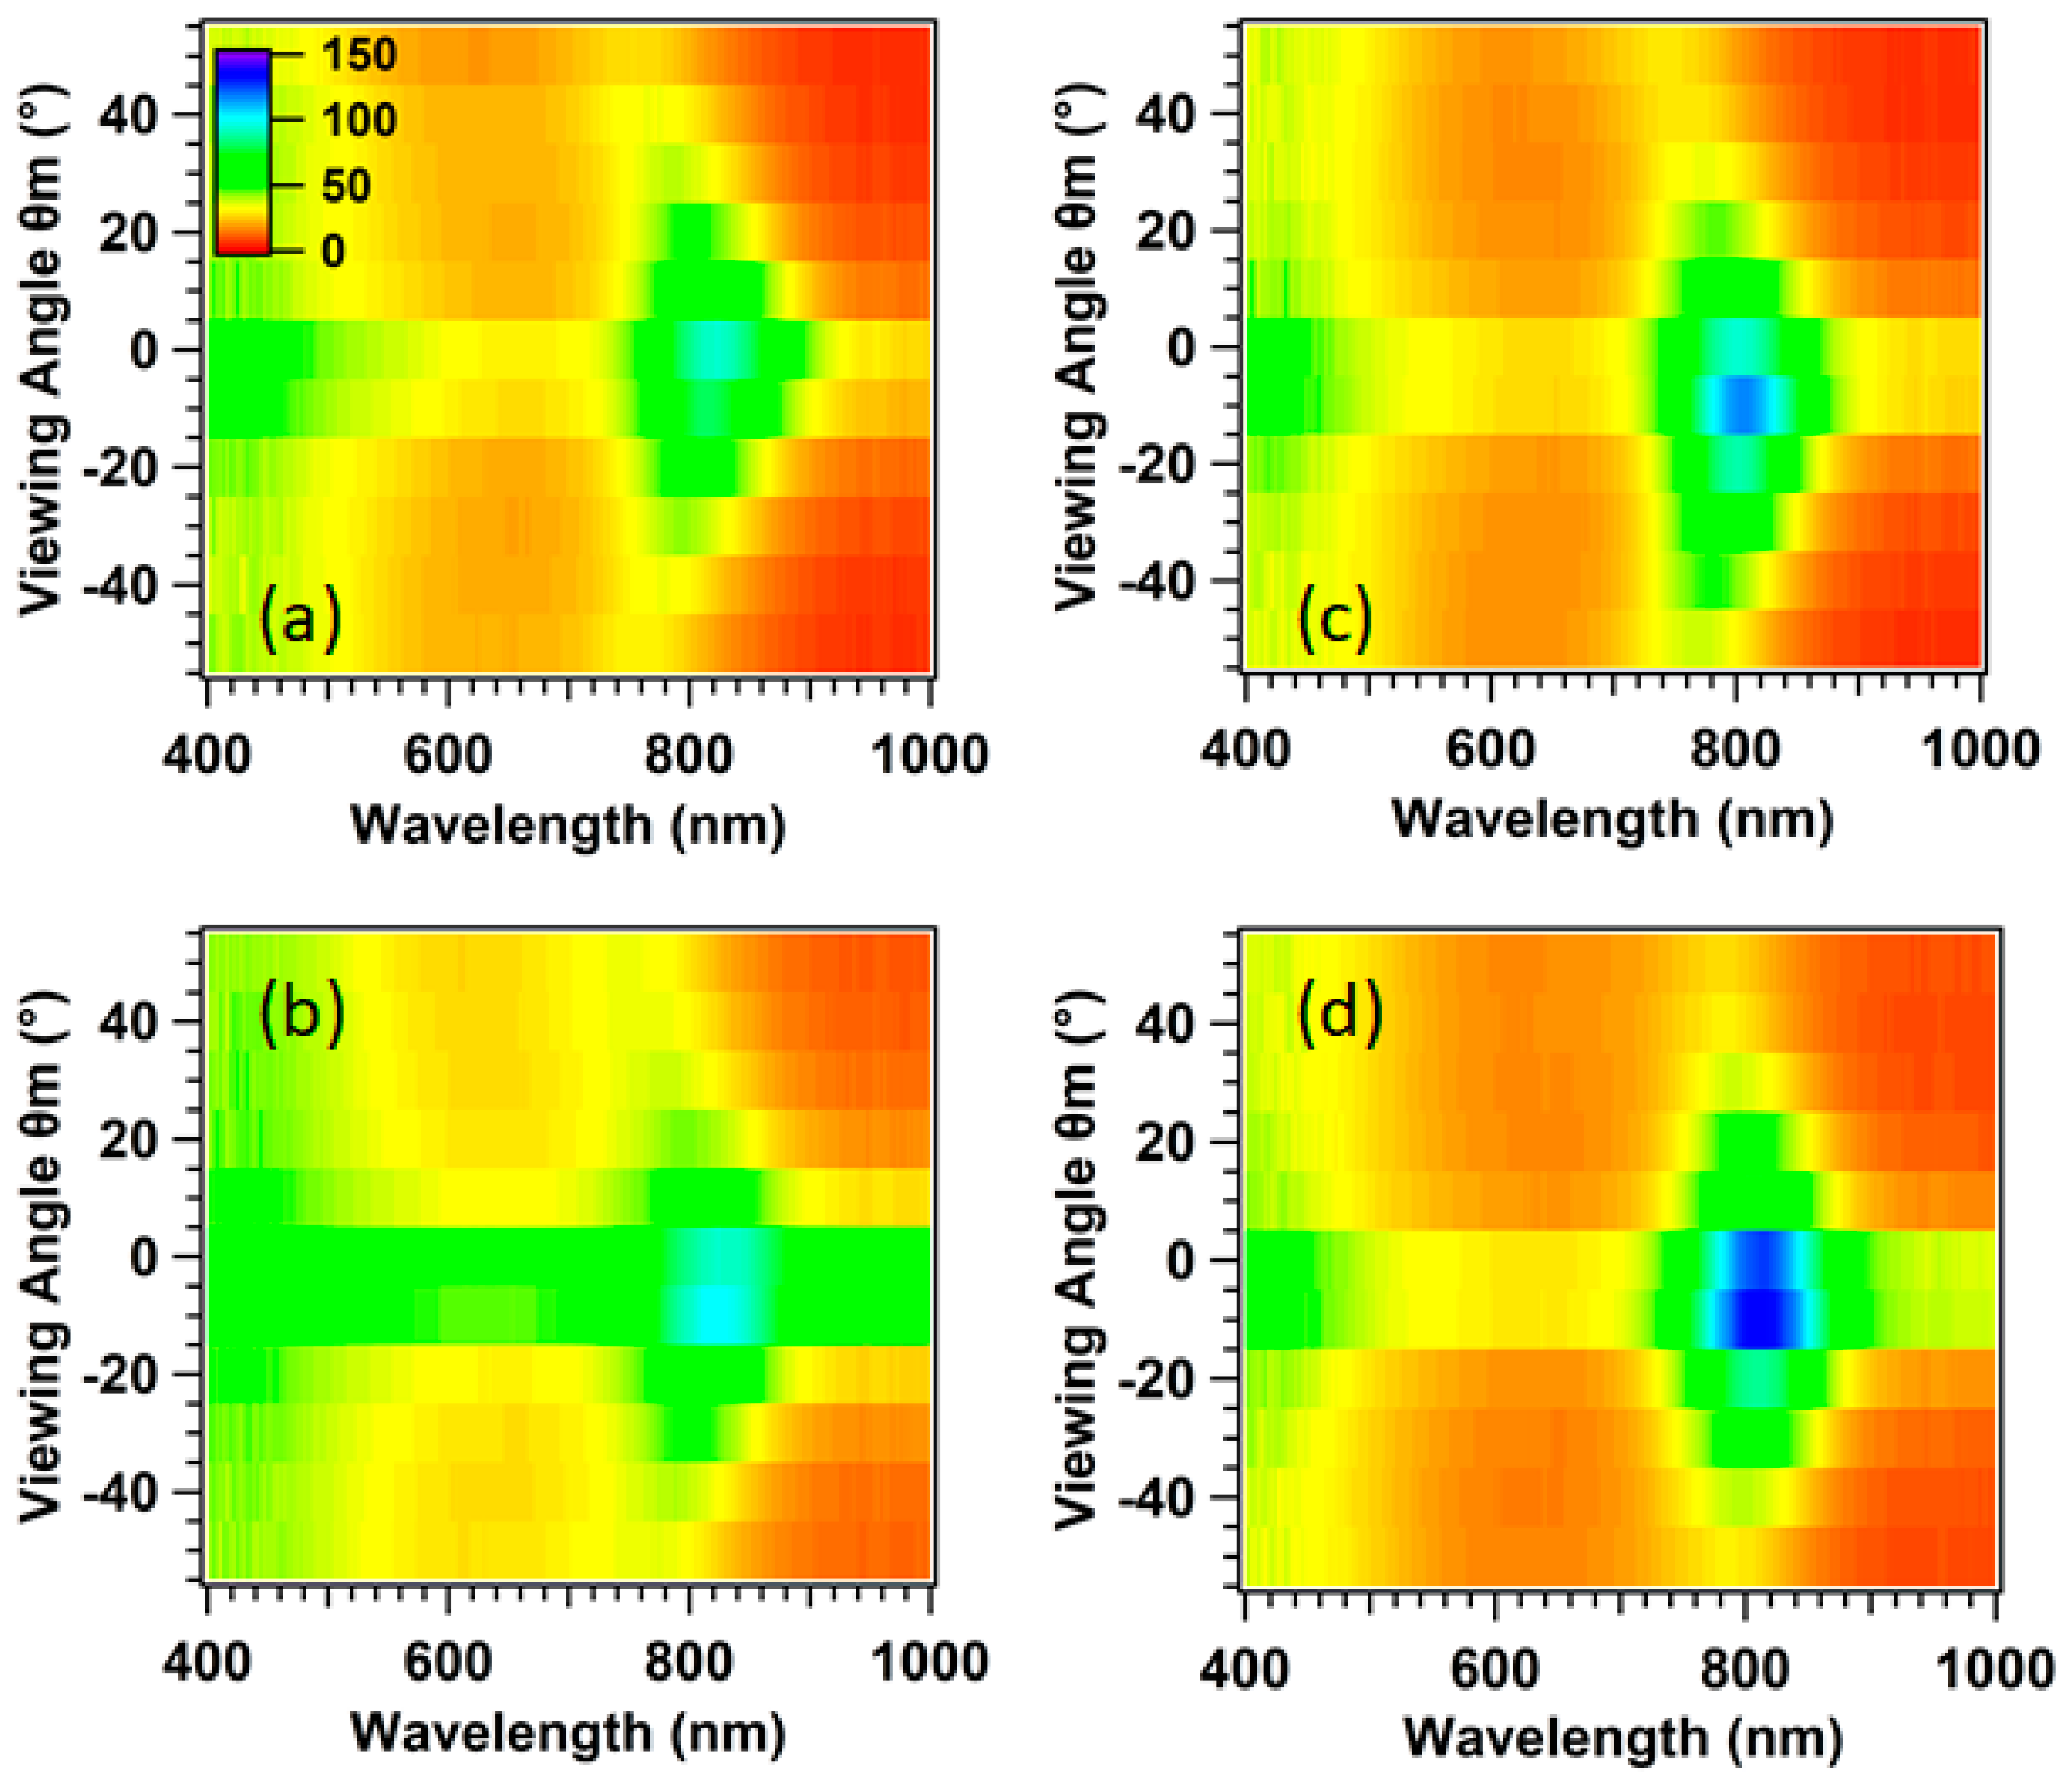
3.2.2. Scattering Cones

This was carried out for a measurement step of 10° in each of the viewing angle planes θ m for values of ±80° < | θ m |, for illumination at normal incidence, as shown in Figure 5 for 5, 10, 20 and 40 BIOS pass opals of Sample 2, viewed in the plane φ m = 0° (perpendicular to the plane of incidence and to ĝ). Intensity is given on the z-axis for a common scale inset in Figure 5a.
The typical fluctuating peak intensities of the scattering cone are present, as listed in Table 2; with structural color appearing at around λ = 810 nm for 5 BIOS, which intensifies with further shear up to 10, 20, and 40 BIOS, where optimal ordering has been reached. Peak reflectance in the resonant scattering cone typically exceeds 100% relative to the Lambertian standard scatterer, which is, by contrast, unidirectional. Background reflectance from wavelengths above the bandgap (>850 nm) is generally seen to gradually increase as a function of shear, however this pattern is less clear for wavelengths below the bandgap (<750 nm). In this section of the spectrum, reflectance is seen to remain relatively consistent as a function of structural ordering. One additional point of note as observed from these plots is how the symmetry in wavelength tuning either side of the stopband wavelength changes as a function of shear, with a steeper band edge seen for the 5 BIOS film than for the 40 BIOS opal, where the scattering cone implies a more Gaussian relationship between wavelength and reflectance based on the angular and wavelength symmetry of the cone seen in Figure 5d.
The tuning of the bandgap is also examined more generally as a function of azimuthal viewing angle in 10° increments of φ m , beginning in the illumination plane ( φ m = 90°) and moving to a displacement of 30° ( φ m = 60°); this data is shown in the Appendix A. The wavelength tuning occurring in these azimuthal planes is Δλ = 50 nm for 90° and Δλ = 41 nm for 60°. As established previously in the case of UV-reflecting POs [37], the ranges of scattered wavelengths tuned over between the values of 90° ≤ φ m ≤ 60° are similar, as is the degree of structural color tuning across φ m for each angle of illumination. On average, there is slightly less wavelength tuning over each hemisphere for θ I = 30° than θ I = 15°, but this is due to the spatial position of the scattering cone rather than any structural cause.

4. Discussion and Conclusions

Robust near-IR reflecting films and coatings based on the polymer opals paradigm are demonstrated in this report. Polymer synthesis techniques for tractable larger core-interlayer-shell (CIS) microsphere particles facilitates development of well-ordered opaline structures within films of 10–100 s of microns thickness. Commensurate with this size-adjustability is the tuneability of an intense resonant photonic stopband (with extinction coefficients exceeding 10 mm−1), spanning a spectral range across the near-IR region, with a significant residual translucency for visible light. Scattering cone metrics such as stopband position and structural color tuning bands are characterized for a range of angular and azimuthal orientations, further elucidating the role of shear processing in the changing properties as the induced ordering of photonic crystals proceeds.
In comparison with many other thin film systems in the literature [40,41,42], particularly those applied to optoelectronic devices and solar cells, POs have a range of advantages in that they are low-cost, recyclable, non-photobleaching, and fabricated without the need for harmful organic solvents. It is envisioned that the techniques applied here will in the future allow for fully tunable, polymeric photonic thin-films, engineered for near-IR applications. Solar cell technology in particular may benefit from near-IR POs as tools in enhancing and stabilizing the efficiency of silicon-based photovoltaic devices. The demonstrated directionality of photonic effects may be of additional interest for use in modules within concentrator photovoltaic (CPV) technologies [43,44].
In addition, as freestanding films with good adhesive properties, POs are compatible with simple retroactive installation to a range of surfaces [45,46], removing the need for conventionally expensive and time-consuming deposition methods, and thus potentially bringing Building Integrated Photovoltaics (BIPVs) [47,48] and thermal budget coatings for windows into scope.

Author Contributions

Conceptualization, G.R., M.B. and C.E.F.; methodology, G.R., M.G., J.J.T. and M.B.; analysis, G.R. and M.G.; data curation, G.R. and C.E.F.; writing—original draft preparation, G.R. and C.E.F.; writing—review and editing, C.E.F.; supervision, M.G., M.B. and C.E.F.; funding acquisition, C.E.F. All authors have read and agreed to the published version of the manuscript.

Funding

This research was funded in part by SPARC-II (European Regional Development Fund), Llywodraeth Cymru (KESS-2, Knowledge Economy Skills Scholarship), and Varichem Co., Ltd.

Institutional Review Board Statement

Not applicable.

Informed Consent Statement

Not applicable.

Data Availability Statement

Data can be accessed from the Aberystwyth University PURE repository. http://doi.org/10.20391/d12394df-3a1f-4a30-ba05-fb2ba21371b0.

Acknowledgments

The authors thank Jeremy Baumberg, University of Cambridge (UK), and Malvern Panalytical Ltd. for access to equipment. C.E.F. thanks colleagues Peter Spahn and Peter Hellmann of the former Deutsches Kunststoff-Institut (Darmstadt, Germany), and David Snoswell of University of Cambridge, for historical supply of samples. G.R. thanks Neil Racz (Varichem Ltd.) for supervision.

Conflicts of Interest

There is no conflict of interest relevant to this article. Author Giselle Rosetta was employed by the company Varichem Co., Ltd. and Mike Butters was employed by the company Minton Treharne & Davies. The remaining authors declare that the research was conducted in the absence of any commercial or financial relationships that could be construed as a potential conflict of interest.

Appendix A

Figure A1. A schematic diagram of the bespoke goniometric set-up, with key components indicated. The shaded detectors illustrate potential placements, with full 360° capabilities. The shear-processing direction is indicated by the vector p ^ . Inset: the spherical co-ordinate system, defining illumination angle from the normal in the plane of incidence ( θ I ), detection azimuth relative the plane of incidence ( φ m ) and detection angle from the normal ( θ m ).
Micro 04 00024 g0a1
Figure A2. The scattering cones of 40 BIOS shear pass polymer opals with a normal incidence stopband at approximately 800 nm. This is seen to tune for illumination ( θ I ) at 15° (ad) and 30° (eh) displaced from the zenith, for a range of azimuthal viewing planes ( φ m ) close to the forward scattering cone centred on φ m = 90°.
Micro 04 00024 g0a2

References

  1. Pursiainen, O.L.J.; Baumberg, J.J.; Winkler, H.; Viel, B.; Spahn, P.; Ruhl, T. Shear-Induced Organization in Flexible Polymer Opals. Adv. Mater. 2008, 20, 1484–1487. [Google Scholar] [CrossRef]
  2. Finlayson, C.E.; Baumberg, J.J. Polymer opals as novel photonic materials. Polym. Int. 2013, 62, 1403–1407. [Google Scholar] [CrossRef]
  3. Gallei, M. Functional Polymer Opals and Porous Materials by Shear-Induced Assembly of Tailor-Made Particles. Macromol. Rapid Commun. 2018, 39, 16. [Google Scholar] [CrossRef]
  4. Ruhl, T.; Hellmann, G.P. Colloidal Crystals in Latex Films: Rubbery Opals. Macromol. Chem. Phys. 2001, 202, 3502–3505. [Google Scholar] [CrossRef]
  5. Ding, T.; Cao, G.; Schäfer, C.G.; Zhao, Q.; Gallei, M.; Smoukov, S.K.; Baumberg, J.J. Revealing Invisible Photonic Inscriptions: Images from Strain. ACS Appl. Mater. Interfaces 2015, 7, 13497–13502. [Google Scholar] [CrossRef] [PubMed]
  6. Braun, P. MATERIALS SCIENCE Colour without colourants. Nature 2011, 472, 423–424. [Google Scholar] [CrossRef]
  7. Zhao, Q.; Finlayson, C.E.; Snoswell, D.R.E.; Haines, A.; Schäfer, C.; Spahn, P.; Hellmann, G.P.; Petukhov, A.V.; Herrmann, L.; Burdet, P.; et al. Large-scale ordering of nanoparticles using viscoelastic shear processing. Nat. Commun. 2016, 7, 11661. [Google Scholar] [CrossRef]
  8. Finlayson, C.E.; Rosetta, G.; Baumberg, J.J. An Experimental and Theoretical Determination of Oscillatory Shear-Induced Crystallization Processes in Viscoelastic Photonic Crystal Media. Materials 2021, 14, 5298. [Google Scholar] [CrossRef] [PubMed]
  9. Haines, A.I.; Finlayson, C.E.; Snoswell, D.R.E.; Spahn, P.; Hellmann, G.P.; Baumberg, J.J. Anisotropic Resonant Scattering from Polymer Photonic Crystals. Adv. Mater. 2012, 24, OP305–OP308. [Google Scholar] [CrossRef]
  10. Schäfer, C.G.; Gallei, M.; Zahn, J.T.; Engelhardt, J.; Hellmann, G.P.; Rehahn, M. Reversible Light-, Thermo-, and Mechano-Responsive Elastomeric Polymer Opal Films. Chem. Mater. 2013, 25, 2309–2318. [Google Scholar] [CrossRef]
  11. Snoswell, D.R.E.; Kontogeorgos, A.; Baumberg, J.J.; Lord, T.D.; Mackley, M.R.; Spahn, P.; Hellmann, G.P. Shear ordering in polymer photonic crystals. Phys. Rev. E 2010, 81, 020401. [Google Scholar] [CrossRef] [PubMed]
  12. Lange, B.; Metz, N.; Tahir, M.N.; Fleischhaker, F.; Theato, P.; Schröder, H.; Müller, W.E.G.; Tremel, W.; Zentel, R. Functional Polymer-Opals from Core–Shell Colloids. Macromol. Rapid Commun. 2007, 28, 1987–1994. [Google Scholar] [CrossRef]
  13. Joannopoulos, J.D.; Johnson, S.G.; Winn, J.N.; Meade, R.D. Photonic Crystals Molding the Flow of Light, 2nd ed.; Princeton University Press: Princeton, NJ, USA, 2008. [Google Scholar]
  14. Rosetta, G. Towards the Realisation of Polymer Opals as Next Generation Functional Materials. Ph.D. Thesis, Aberystwyth University, Aberystwyth, UK, 2023. [Google Scholar]
  15. Rosetta, G.; Macaire, L.; Butters, M.; Finlayson, C.E. Dial-In Synthesis of ‘Polymer Opal’ Core–Interlayer–Shell Composite Nanoparticles. Polymers 2023, 15, 3507. [Google Scholar] [CrossRef] [PubMed]
  16. Li, W.; Shi, Y.; Chen, K.; Zhu, L.; Fan, S. A Comprehensive Photonic Approach for Solar Cell Cooling. ACS Photonics 2017, 4, 774–782. [Google Scholar] [CrossRef]
  17. Bermel, P.; Luo, C.; Zeng, L.; Kimerling, L.C.; Joannopoulos, J.D. Improving thin-film crystalline silicon solar cell efficiencies with photonic crystals. Opt. Express 2007, 15, 16986–17000. [Google Scholar] [CrossRef] [PubMed]
  18. Bhattacharya, J.; Chakravarty, N.; Pattnaik, S.; Slafer, W.D.; Biswas, R.; Dalal, V.L. A photonic-plasmonic structure for enhancing light absorption in thin film solar cells. Appl. Phys. Lett. 2011, 99, 3. [Google Scholar] [CrossRef]
  19. Wehrspohn, R.B.; Üpping, J. 3D photonic crystals for photon management in solar cells. J. Opt. 2012, 14, 9. [Google Scholar] [CrossRef]
  20. Üpping, J.; Biclawny, A.; Miclea, P.T.; Wehrspohn, R.B. 3D photonic crystals for ultra-light trapping in solar cells. In Proceedings of the Conference on Photonics for Solar Energy Systems II, Strasbourg, France, 7–8 April 2008. [Google Scholar]
  21. Liu, W.; Ma, H.; Walsh, A. Advance in photonic crystal solar cells. Renew. Sustain. Energy Rev. 2019, 116, 109436. [Google Scholar] [CrossRef]
  22. Broderick, K.A.; Zeng, L.; Alamariu, B.A.; Duan, X.; Zou, Z.; Zhou, J.; Sun, X.; Yi, Y. Enhanced Absorption in Thin Film Si Solar Cells with Textured Photonic Back Reflector. In Proceedings of the Conference on Lasers and Electro-Optics (CLEO)/Quantum Electronics and Laser Science Conference (QELS), IEEE, San Jose, CA, USA, 16–21 May 2010. [Google Scholar]
  23. Wang, J.L.; Xuan, Y.M.; Da, Y.; Xu, Y.P.; Zheng, L.K. Benefits of photonic management strategy for highly efficient bifacial solar cells. Opt. Commun. 2020, 462, 125358. [Google Scholar] [CrossRef]
  24. Nicholson, J. The Chemistry of Polymers; Royal Society of Chemistry: London, UK, 2017. [Google Scholar]
  25. Ottewill, R.H.; Shaw, J.N. Studies on the preparation and characterization of monodisperse polystyrene latices. Kolloid-Z. Z. Polym. 1967, 215, 161–166. [Google Scholar] [CrossRef]
  26. Chern, C.S. Principles and Applications of Emulsion Polymerization; Wiley: New York, NY, USA, 2008. [Google Scholar]
  27. Ruhl, T.; Spahn, P.; Hellmann, G. Artificial opals prepared by melt compression. Polymer 2003, 44, 7625–7634. [Google Scholar] [CrossRef]
  28. Li, H.T.; Wu, P.; Zhao, G.W.; Guo, J.; Wang, C.C. Fabrication of industrial-level polymer photonic crystal films at ambient temperature Based on uniform core/shell colloidal particles. J. Colloid Interface Sci. 2021, 584, 145–153. [Google Scholar] [CrossRef] [PubMed]
  29. Ruhl, T.; Spahn, P.; Winkler, H.; Hellmann, G.P. Large Area Monodomain Order in Colloidal Crystals. Macromol. Chem. Phys. 2004, 205, 1385–1393. [Google Scholar] [CrossRef]
  30. Chern, C.-S.; Lin, S.-Y.; Hsu, T.J. Effects of Temperature on Styrene Emulsion Polymerization Kinetics. Polym. J. 1999, 31, 516–523. [Google Scholar] [CrossRef]
  31. Zhao, Q.; Finlayson, C.E.; Schaefer, C.G.; Spahn, P.; Gallei, M.; Herrmann, L.; Petukhov, A.V.; Baumberg, J.J. Nanoassembly of Polydisperse Photonic Crystals Based on Binary and Ternary Polymer Opal Alloys. Adv. Opt. Mater. 2016, 4, 1494–1500. [Google Scholar] [CrossRef]
  32. Spahn, P.; Finlayson, C.E.; Etah, W.M.; Snoswell, D.R.E.; Baumberg, J.J.; Hellmann, G.P. Modification of the refractive-index contrast in polymer opal films. J. Mater. Chem. 2011, 21, 8893–8897. [Google Scholar] [CrossRef]
  33. Finlayson, C.E.; Spahn, P.; Snoswell, D.R.E.; Yates, G.; Kontogeorgos, A.; Haines, A.I.; Hellmann, G.P.; Baumberg, J.J. 3D Bulk Ordering in Macroscopic Solid Opaline Films by Edge-Induced Rotational Shearing. Adv. Mater. 2011, 23, 1540–1544. [Google Scholar] [CrossRef] [PubMed]
  34. Rosetta, G.; An, T.; Zhao, Q.B.; Baumberg, J.J.; Tomes, J.J.; Gunn, M.D.; Finlayson, C.E. Chromaticity of structural color in polymer thin film photonic crystals. Opt. Express 2020, 28, 36219–36228. [Google Scholar] [CrossRef]
  35. Snoswell, D.R.E.; Finlayson, C.E.; Zhao, Q.; Baumberg, J.J. Real-time measurements of crystallization processes in viscoelastic polymeric photonic crystals. Phys. Rev. E 2015, 92, 052315. [Google Scholar] [CrossRef]
  36. Finlayson, C.E.; Baumberg, J.J. Generating Bulk-Scale Ordered Optical Materials Using Shear-Assembly in Viscoelastic Media. Materials 2017, 10, 688. [Google Scholar] [CrossRef]
  37. Rosetta, G.; Gunn, M.; Tomes, J.J.; Butters, M.; Pieschel, J.; Hartmann, F.; Gallei, M.; Finlayson, C.E. Transparent Polymer Opal Thin Films with Intense UV Structural Color. Molecules 2022, 27, 3774. [Google Scholar] [CrossRef]
  38. Baumberg, J.J.; Pursiainen, O.L.; Spahn, P. Resonant optical scattering in nanoparticle-doped polymer photonic crystals. Phys. Rev. B 2009, 80, 201103. [Google Scholar] [CrossRef]
  39. Wang, Z.Z.; Zhang, C.F.; Chen, D.Z.; Tang, S.; Zhang, J.C.; Wang, Y.; Han, G.Q.; Xu, S.R.; Hao, Y. Flexible ITO-Free Organic Solar Cells Based on MoO3Ag Anodes. IEEE Photonics J. 2015, 7, 9. [Google Scholar] [CrossRef]
  40. Pattnaik, S.; Biswas, R.; Dalal, V.L.; Slafer, D.; Ji, J. Amorphous Silicon Solar Cells on Plastic Based Photonic Structures. In Proceedings of the 35th IEEE Photovoltaic Specialists Conference, IEEE, Honolulu, HI, USA, 20–25 June 2010; pp. 1483–1486. [Google Scholar]
  41. Krebs, F.C.; Jørgensen, M.; Norrman, K.; Hagemann, O.; Alstrup, J.; Nielsen, T.D.; Fyenbo, J.; Larsen, K.; Kristensen, J. A complete process for production of flexible large area polymer solar cells entirely using screen printing—First public demonstration. Sol. Energy Mater. Sol. Cells 2009, 93, 422–441. [Google Scholar] [CrossRef]
  42. Parchine, M.; Kohoutek, T.; Bardosova, M.; Pemble, M.E. Large area colloidal photonic crystals for light trapping in flexible organic photovoltaic modules applied using a roll-to-roll Langmuir-Blodgett method. Sol. Energy Mater. Sol. Cells 2018, 185, 158–165. [Google Scholar] [CrossRef]
  43. Tang, X.S.; Ma, Z.G.; Wang, W.Q.; Deng, Z.; Jiang, Y.; Wang, W.X.; Chen, H.; Zhang, N.; Huang, K.Y.; Du, C.H.; et al. Improving the Performance of Solar Cells under Non-Perpendicular Incidence by Photonic Crystal. IEEE Photon-J. 2021, 13, 8400204. [Google Scholar] [CrossRef]
  44. Tayagaki, T.; Kishimoto, Y.; Hoshi, Y.; Usami, N. Light trapping by direction-dependent light transmission in front-surface photonic nanostructures. Appl. Phys. Express 2014, 7, 122301. [Google Scholar] [CrossRef]
  45. Snoswell, D.R.E.; Baumberg, J.J. Stretching the Imagination. Textiles 2009, 4, 8–10. [Google Scholar]
  46. Schäfer, C.G.; Biesalski, M.; Hellmann, G.P.; Rehahn, M.; Gallei, M. Paper-supported elastomeric opal films for enhanced and reversible solvatochromic response. J. Nanophotonics 2013, 7, 070599. [Google Scholar] [CrossRef]
  47. Jhumka, H.; Yang, S.; Gorse, C.; Wilkinson, S.; Yang, R.; He, B.-J.; Prasad, D.; Fiorito, F. Assessing heat transfer characteristics of building envelope deployed BIPV and resultant building energy consumption in a tropical climate. Energy Build. 2023, 298, 24. [Google Scholar] [CrossRef]
  48. Martín-Chivelet, N.; Kapsis, K.; Wilson, H.R.; Delisle, V.; Yang, R.B.C.; Olivieri, L.; Polo, J.; Eisenlohr, J.; Roy, B.; Maturi, L.; et al. Building-Integrated Photovoltaic (BIPV) products and systems: A review of energy-related behavior. Energy Build. 2022, 262, 111998. [Google Scholar] [CrossRef]
Figure 1. (a) The core-interlayer-shell structure of polymer opal nanoparticles, with particle diameters scaling from around 330 to 510 nm in this study. (b) The Bending-Induced Oscillatory Shear (BIOS) pipeline, where the disordered base material is laminated between rigid PET sheets and shear is applied across heated rollers; the vector p ^ shows the film processing direction. The inset illustrates how errant particles are arranged into ordered structures by the melt-shearing technique. The photographic images, compare films before (left) and following (right) BIOS viewed under room lights; common scale bar (left) is 2 cm.
Micro 04 00024 g001
Figure 2. (a) Scanning Electron Microscopy of the edge/slice of a 0-BIOS opal from Sample 2. (b) the surface of the 0-BIOS opal with the {111} direction out of the page, with random hcp, showing multiple distinct domains of order with auto-correlation function (inset). (c) a cleaved section of a 40 BIOS opal slice, and (d) the surface of the corresponding 40 BIOS opal from Sample 2, with auto-correlation analysis (inset). (e) radial distribution function analysis of the Fast-Fourier Transform of (d) which shows a single extracted peak in spatial frequency at around 2.8 μm−1. (f) shows a layer-by-layer dynamic light scattering (DLS) analysis of the growth of core-interlayer-shell particles, giving a final diameter of ≈350nm.
Micro 04 00024 g002
Figure 3. Broadband normal incidence Vis-NIR spectra for PO thin-film samples spanning the core-interlayer-shell (CIS) diameter range of 330 to 510 nm, with increasing size from top (Sample 1) to bottom (Sample 5). The positions of the transmission-dip features are indicated by arrow in (c,d) for clarity. The film thicknesses, as measured with a Vernier external micro-meter, are indicated in the insets.
Micro 04 00024 g003
Figure 4. (a) The transmission spectra across the visible and NIR of an 80 µm thick infrared polymer opal on 100 µm PET substrate with a normal incidence ( θ I = 0) bandgap around 800 nm (Sample 2). This is seen to blue-shift with increasing incidence angle from the normal, as shown by the legend. (b) The commensurate reflectivity spectra of samples processed 40-BIOS cycles are, illustrating the angular tuning and anisotropy with ± θ I (see legend).
Micro 04 00024 g004
Figure 5. The scattering cones of reflectance for (a) 5, (b) 10, (c) 20, and (d) 40 BIOS shear pass polymer opals (Sample 2). Light is incident normal to the surface ( θ I = 0), with the BIOS direction vector p ^ aligned parallel to the illumination plane. Viewing is in the plane φ m = 0°, which lies perpendicular to the illumination and ĝ direction. Measurements of viewing angle spectra ( θ m ) are given in 10° increments. Reflectance is given on the z-axis as a percentage for a common scale, inset in (a).
Micro 04 00024 g005
Table 1. Key characteristics and metrics for the range of IR opals reported; particle sizes, inferred resonant peaks based on {111} plane spacing, sample film thickness, measured stopband transmittance (T), extinction coefficient (α).
Sample No.CIS Diameter (nm) λ 111 (nm) 1Thickness
(μm)
T (%)α (mm−1) 2
1330690750.3414.4
2355790800.3513.1
3365970300.797.86
4450≈1200350.883.20
5510>160040--
1 Assuming—   d 111 = a / 3 in hcp lattice. 2 Using the conversion— α = ln T / d .
Table 2. Full width at half maxima of scattering cones as a function of shearing-ordering BIOS passes, as determined from Gaussian fits of the maximum intensities at each measured angle for each film. It was not possible to determine this value for 0 BIOS with accuracy because of the low reflectance values and thus lack of distinct peak. Peak reflectance intensity (%) is also inferred for these fits, and is seen to track with improving structural order as expected.
No. of BIOS Cycles05102040
FWHM (°)-20 ± 417 ± 323 ± 220 ± 1
Peak Reflectance (%)-54 ± 861 ± 875 ± 5100 ± 6
Peak λ (nm) 1≈831823820805806
1 measurement error of ±2 nm.
Disclaimer/Publisher’s Note: The statements, opinions and data contained in all publications are solely those of the individual author(s) and contributor(s) and not of MDPI and/or the editor(s). MDPI and/or the editor(s) disclaim responsibility for any injury to people or property resulting from any ideas, methods, instructions or products referred to in the content.

