Abstract
Distributed energy resources and the number of relays are expected to rise in modern electrical grids; consequently, relay misoperations are also expected to grow. Relays can detect electrical fault types using an internal algorithm and can display the result using light indicators on the front of the relay. However, some relays’ internal algorithms for predicting types of electrical faults could be improved. This study assesses a relay’s external and internal algorithms with an Advanced Synchronized Time Digital Grid Twin (ASTDGT) testbed with paired relays. A misoperation relay analysis focused on measuring the accuracy of using the boundary admittance (the external algorithm) versus the set-default (the internal algorithm) relay method to determine the electrical fault types was performed. In this study, the internal and external relay algorithms were assessed with a synchronized time digital grid twin testbed using a real-time simulator. This testbed evaluated two sets of logic at the same time with the digital grid twin and paired relays in the loop. Different types of electrical faults were simulated, and the relays’ recorded events and electrical fault light indicator states were collected from the human–machine interfaces. This ASTDGT testbed with paired relays successfully evaluated the relay algorithm misoperations. The boundary admittance method had an accuracy of 100% for line-to-line, line-to-ground, and line-to-line ground faults.
1. Introduction
Modern electrical networks are equipped with a higher number of relays [1,2,3,4], driven by the rapid expansion of distributed energy resources (DERs). This is because the integration of DERs requires the addition of more relays, which can increase the misoperations of relays. The North American Electric Reliability Corporation’s PRC-004.6 [5] standard analyzes relay data to identify patterns in system protection operations that could adversely affect grid reliability. Misoperations in relays are primarily attributed to errors in settings, logic, or design, equipment malfunctions, and issues in communication networks [6,7]. Relays play a critical role as digital devices capable of identifying circuit breaker statuses [8,9], classifying types of electrical faults [10,11], identifying fault locations [12,13,14], and conveying this information rapidly through light indicators and/or digital displays.
Various types of relay protection logic are in place to execute essential functions [15], like presenting applications to clear faults [16], localizing electrical faults within the grid in power lines [17], and identifying electrical faulted phases [18]. The accuracy of relays in detecting phase faults using the sequence method is not completely accurate for detecting the fault type [10]. The sequence method is used to identify the electrical fault type in relays, which is achieved utilizing visual indicators such as lights and digital displays. This approach calculates the variation of angles between negative and zero sequence currents at the relay’s location when a fault occurs [10].
The initial step for engineers in assessing fault events involves the rapid examination of the illuminated indicators on relays, which serves as a preliminary gauge for detecting the types of electrical faults [18]. However, the sequence technique’s reliance on the zero and negative sequence angle of currents to identify the electrical fault types is not completely accurate because it produces identical angles for diverse fault scenarios [10]. Consequently, protection engineers are required to analyze the electrical fault state relay’s behavior using the recorded events to accurately identify the nature of the disturbances, and this task is notably time-intensive [19,20].
To detect the specific faulted phase, a simple method is to measure the surge in current levels across each phase, as electrical faults typically induce an increase in the current magnitude [21]. In scenarios involving microgrids, whether connected to hydroelectric power sources (characterized by high inertia) or not, overcurrent relays can identify the faulted phases [22]. However, this method could be imprecise in electrical grids powered by inverter-based DERs with a lack of inertia [22]. The most usual faults in electrical grids are phase-to-ground faults. These faults can be identified by monitoring voltages, which drop in the faulted phase [23]. Considering that during a fault state the current increases while the voltage decreases, the ratio of voltage to current along power lines could serve as a reliable indicator for finding electrical fault types. Alternatively, a data-driven strategy leveraging phasor measurement unit data has been proposed, which does not need previous knowledge of the electrical grid configuration [24].
The impedance technique, which assesses both current and voltage magnitudes, offers another alternative for the identification of electrical fault types [11]. The phase-to-ground fault apparent (PGFA) impedance is based on the distance elements for mho relays [25,26], using a resistance–reactance (R-X) diagram. This is a plot that indicates the impedance variation of the power line over time (apparent impedance) [27]. Based on this, the impedance is captured within an R-X plane circle [14]. In this study, the PGFA admittance algorithm with phase and ground boundaries was used, and it was implemented using an external algorithm with a real-time simulator (RTS) and a relay in the loop. This algorithm presented by Dr. Piesciorovsky [28] computes the admittance magnitudes to identify electrical fault types. The PGFA admittance algorithm [28] was named boundary admittance in this article, and it was assessed against a set-default (internal algorithm) relay method for the first time.
The inaccuracy of the PGFA admittance algorithm is related to computation and sensor errors. For the computation error, the PGFA admittance algorithm [28] is based on using an inverse distance protection element, and then it can be presented using a complex current/voltage ratio [28]. Consequently, the current/voltage ratio error can be presented as the percentage current error minus the percentage voltage error [28]. If the percentage current and voltage errors have the same sign, the percentage voltage and current errors are mutually canceled, demonstrating good accuracy in the calculated admittance. However, the worst-case scenario could be when the percentage current error and the percentage voltage error have opposite signs [28] because these percentage errors are added, causing possible inaccuracy in the calculated admittance. For sensor errors, the admittance is calculated by measuring the phase currents and voltages. While the phase currents are measured with current transformers, they could be saturated during electrical fault states. This situation could affect the measurement of the phase currents and consequently the calculated admittance (admittance = current/voltage). However, phase voltages measured with potential transformers are usually not affected by the effect of saturation.
Digital twins have received significant attention in various industry domains, replicating physical systems of the real world as digital systems in the digital world [29]. In power system applications, digital twins have been used to monitor power system operations. In robot applications, digital twins have provided the framework for establishing interfaces for various manipulator systems [30]. In metrology applications, digital twins have been used to investigate the impact of misalignment on individual optical elements [31], with the development of digital twins for optical measurement systems, creating an algorithm for a laser line scanner [32]. Another digital twin system has been used for meteorological applications, considering the essential requirements of simulating meteorological uncertainties [33]. Digital twins are created through simulations and off-line programs [34]; then, digital twin prototypes can be used for monitoring and testing applications to allow the verification of a process [35]. In this study, an Advanced Synchronized Time Digital Grid Twin (ASTDGT) testbed with paired relays is presented to assess the detection of different electrical fault types in a power grid, comparing the boundary admittance (external algorithm) method with a set-default (internal algorithm) relay method.
In electrical utility substations, electrical engineers normally use commercial relay test systems [36,37,38] to commission relays. These commercial relay test systems usually test one relay in the loop, and they are operated using a three-phase current/voltage power source that feeds the relay’s analog signals. The relay test systems generate the states before, during, and after the fault states with breaker pole state sequences and trip/close signals to assess the relay settings and programmed logic (algorithms) during electrical fault tests. A proposed ASTDGT testbed with an RTS and paired relays was presented in this study. The ASTDGT testbed with paired relays allowed us to assess two different electrical fault detection algorithms with a synchronized time source and evaluate the event behavior for both relays with the same time stamp. The misoperation analysis between the boundary admittance method and the set-default (internal algorithm) relay method was carried out one using an RTS configured with two identical relays in the loop and simulating two similar digital power grids with the same electrical characteristics. The relay’s front lighting signals (for detecting electrical fault types) and the recorded data from the relays were evaluated for the boundary admittance (external algorithm) method and the set-default (internal algorithm) relay approach. This study revealed the importance of integrating external algorithms with electrical grid boundaries, which could significantly enhance the accuracy of electrical fault type detection, and the use of the ASTDGT testbed with paired relays to assess the internal and external relay’s logic to minimize possible relay misoperations.
The organization of this article describes the set-default (internal algorithm) relay method and the boundary admittance (external algorithm) method for detecting the types of electrical faults with relays. The ASTDGT testbed with paired relays and a synchronized time source system is described in detail. The relay results based on running different types of electrical faults are presented, and the relays’ recorded events and the electrical fault light indicator states are analyzed. Then, the accuracy of the set-default (internal algorithm) relay method and the boundary admittance (external algorithm) method is assessed by plotting the results of the A, B, and C phases and the ground light indicators for the electrical fault tests. Then, using the ASTDGT testbed with the set-default (internal algorithm) relay method and the boundary admittance (external algorithm) method is discussed, and the conclusions of this study are presented.
2. The Set-Default Relay Method vs. the Boundary Admittance Method
2.1. The Set-Default Relay Method
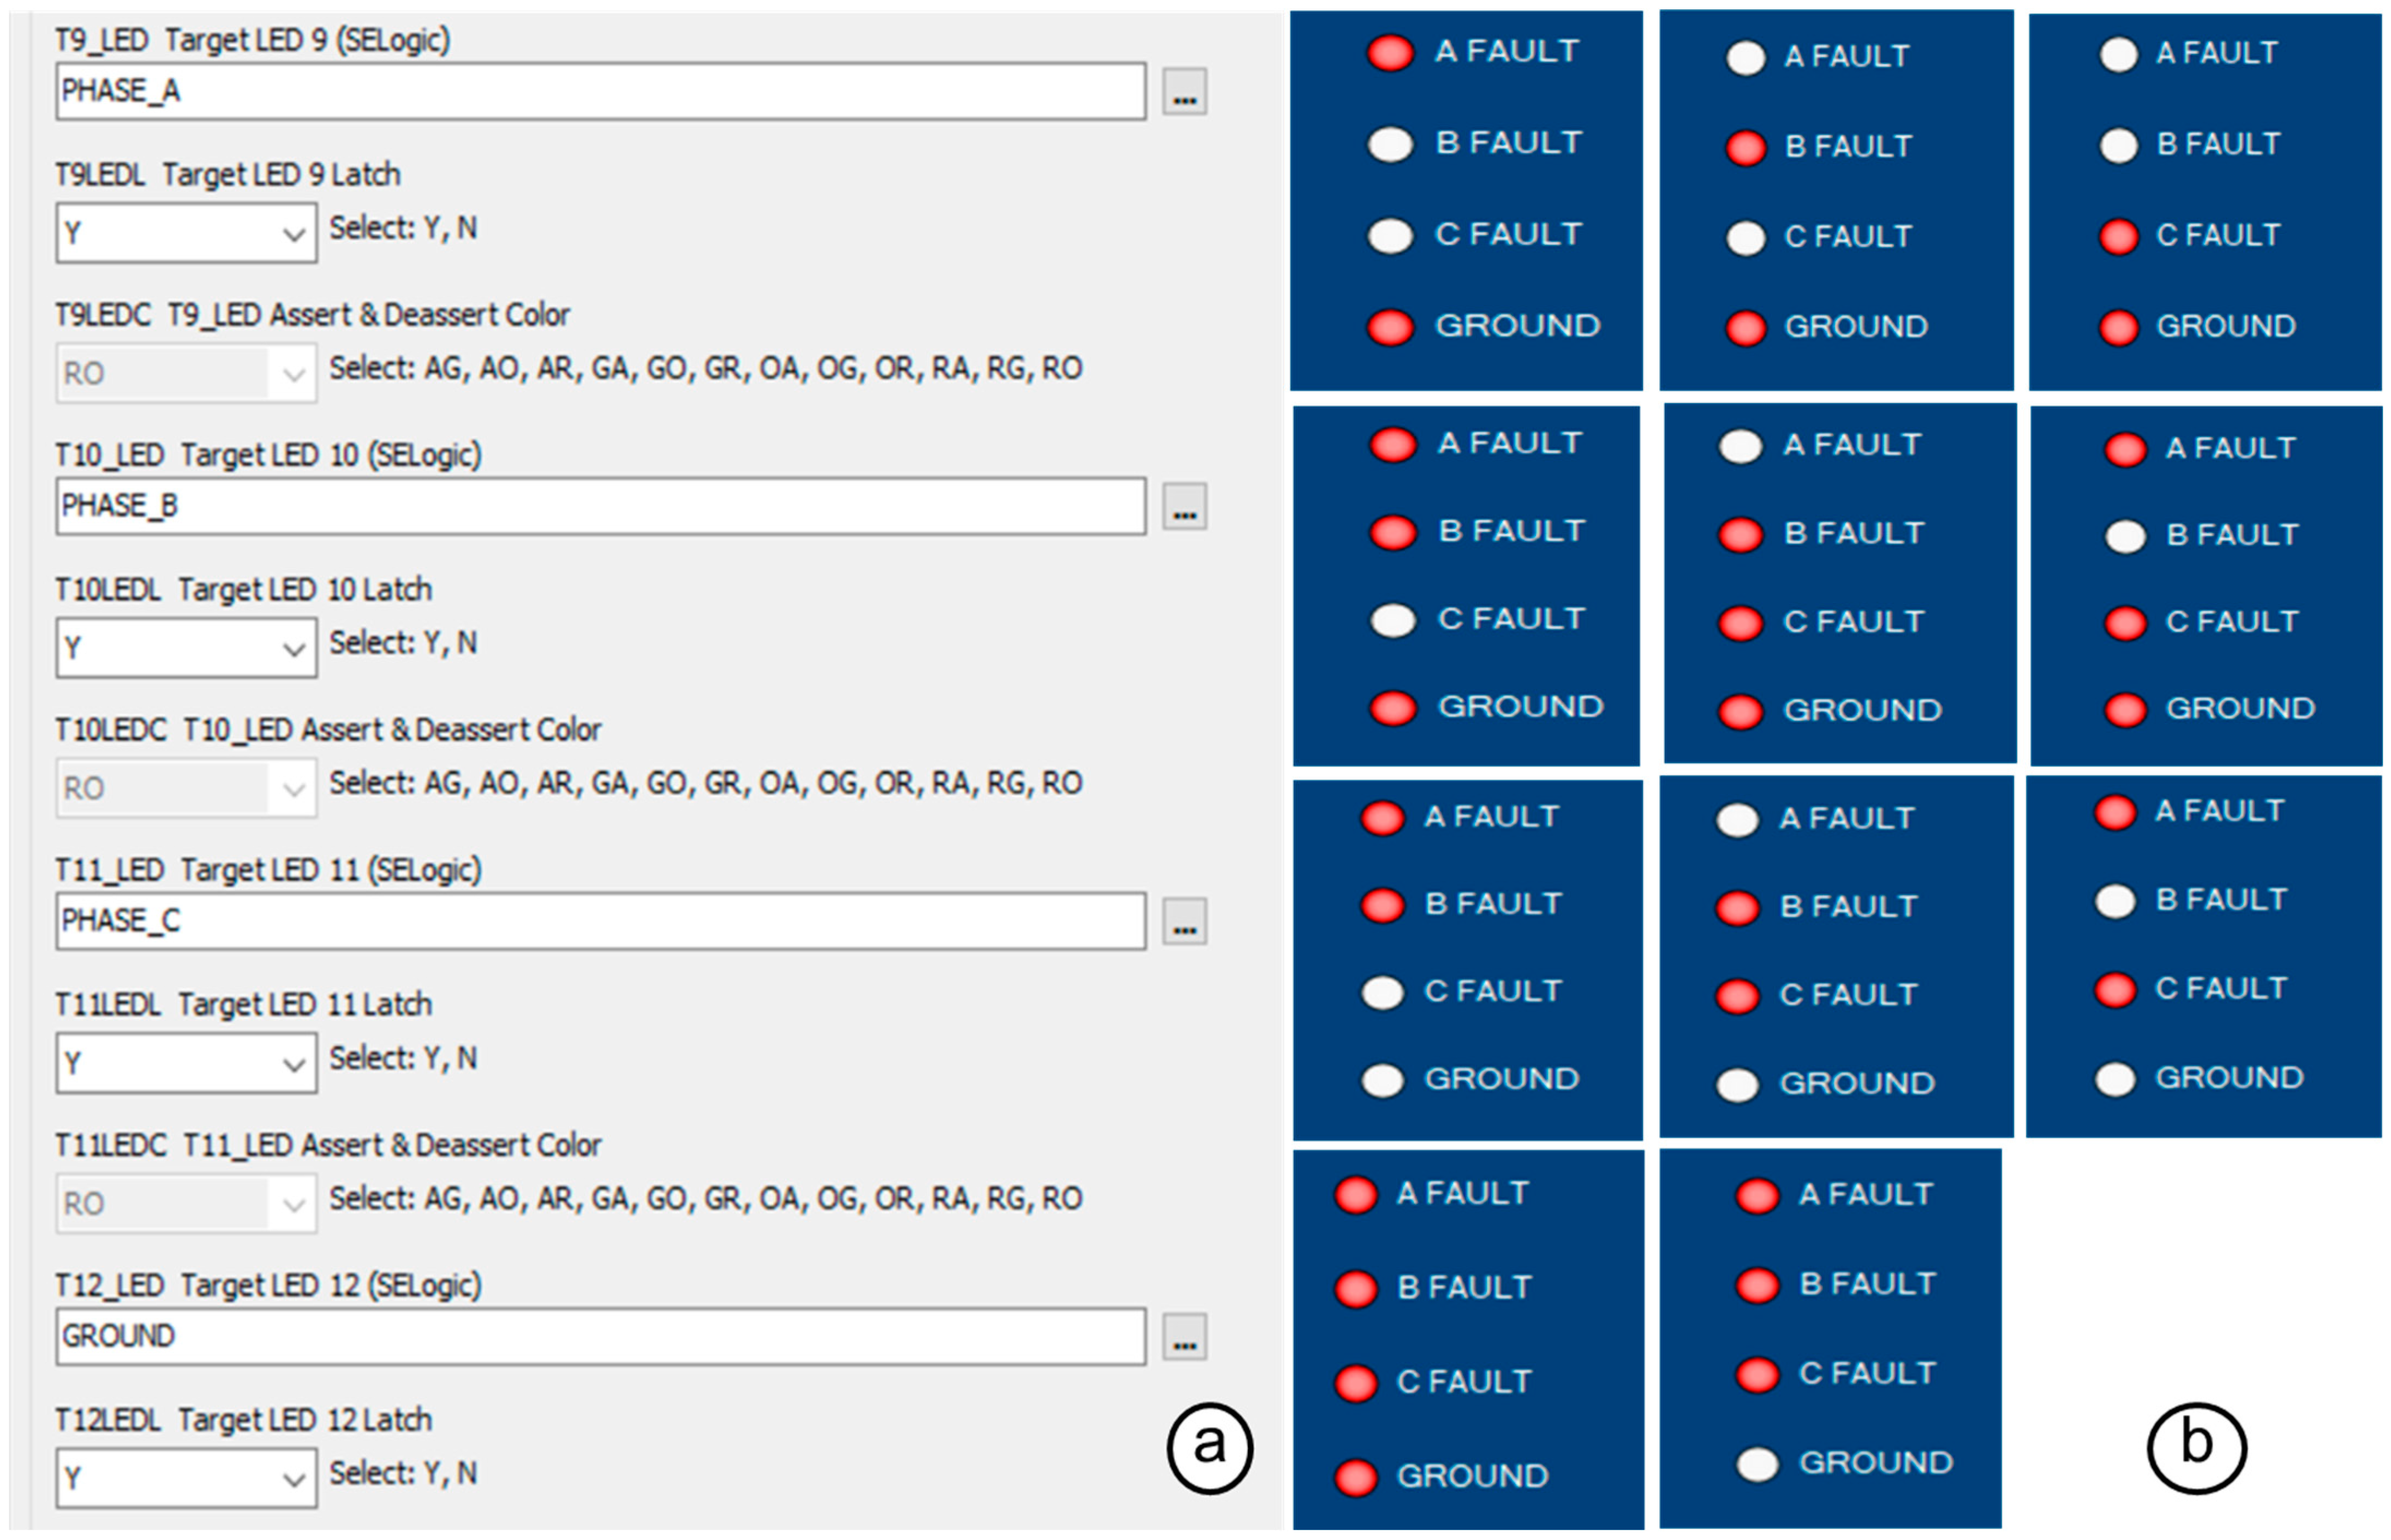
A misoperation analysis of the set-default relay method and the boundary admittance method for the detection of electrical fault types in relays was performed with two identical SEL 451 relays [18]. While the set-default relay method was based on an internal algorithm applied to the protection device by itself, the boundary admittance method was implemented using an external algorithm applied in an RTS. The set-default relay method uses A, B, and C phases and ground targets that are based on illuminating the relay targets. This method defines which phases and/or grounds are involved in an electrical fault. The relay logic target words for the phases (A, B, and C) and ground (GND) status are included in the default relay settings for the T9_LED to T12_LED settings, as shown in Figure 1a. The fault types were defined as line-to-ground (LG), line-to-line (LL), three-line (3L), line-to-line ground (LLG), and three-line-to-ground (3LG) electrical faults and were detected based on the electrical fault target lighting in Figure 1b. The acSELerator QuickSet SEL-5030 software (version 7.2.2.4) was used to set the SEL 451 relays and collect the plots in Figure 1.
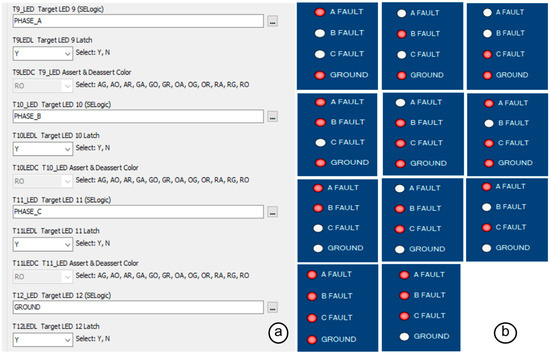
Figure 1.
Target LED settings (a) and types of electrical faults (b) for the set-default relay method.
In this method, an LG electrical fault between the A phase and the ground illuminates both the A FAULT and GROUND targets. An LL electrical fault between the A and B phases illuminates the A FAULT and B FAULT targets. This set-default relay method does not require the pre-calculation of settings, and it is used at any site where a relay is installed in an electrical grid. The logic circuit of the LED target settings for the A, B, and C phases and ground is based on internal logic that cannot be modified. However, the target LEDs from the T9_LED to T12_LED settings can be set with other relay targeting logic, different from the factory target LED settings, to study the results of using new methods to detect electrical fault types. In Figure 1b, the red circles represent the phase and ground faulted states for the different types of electrical faults.
2.2. The Boundary Admittance Method
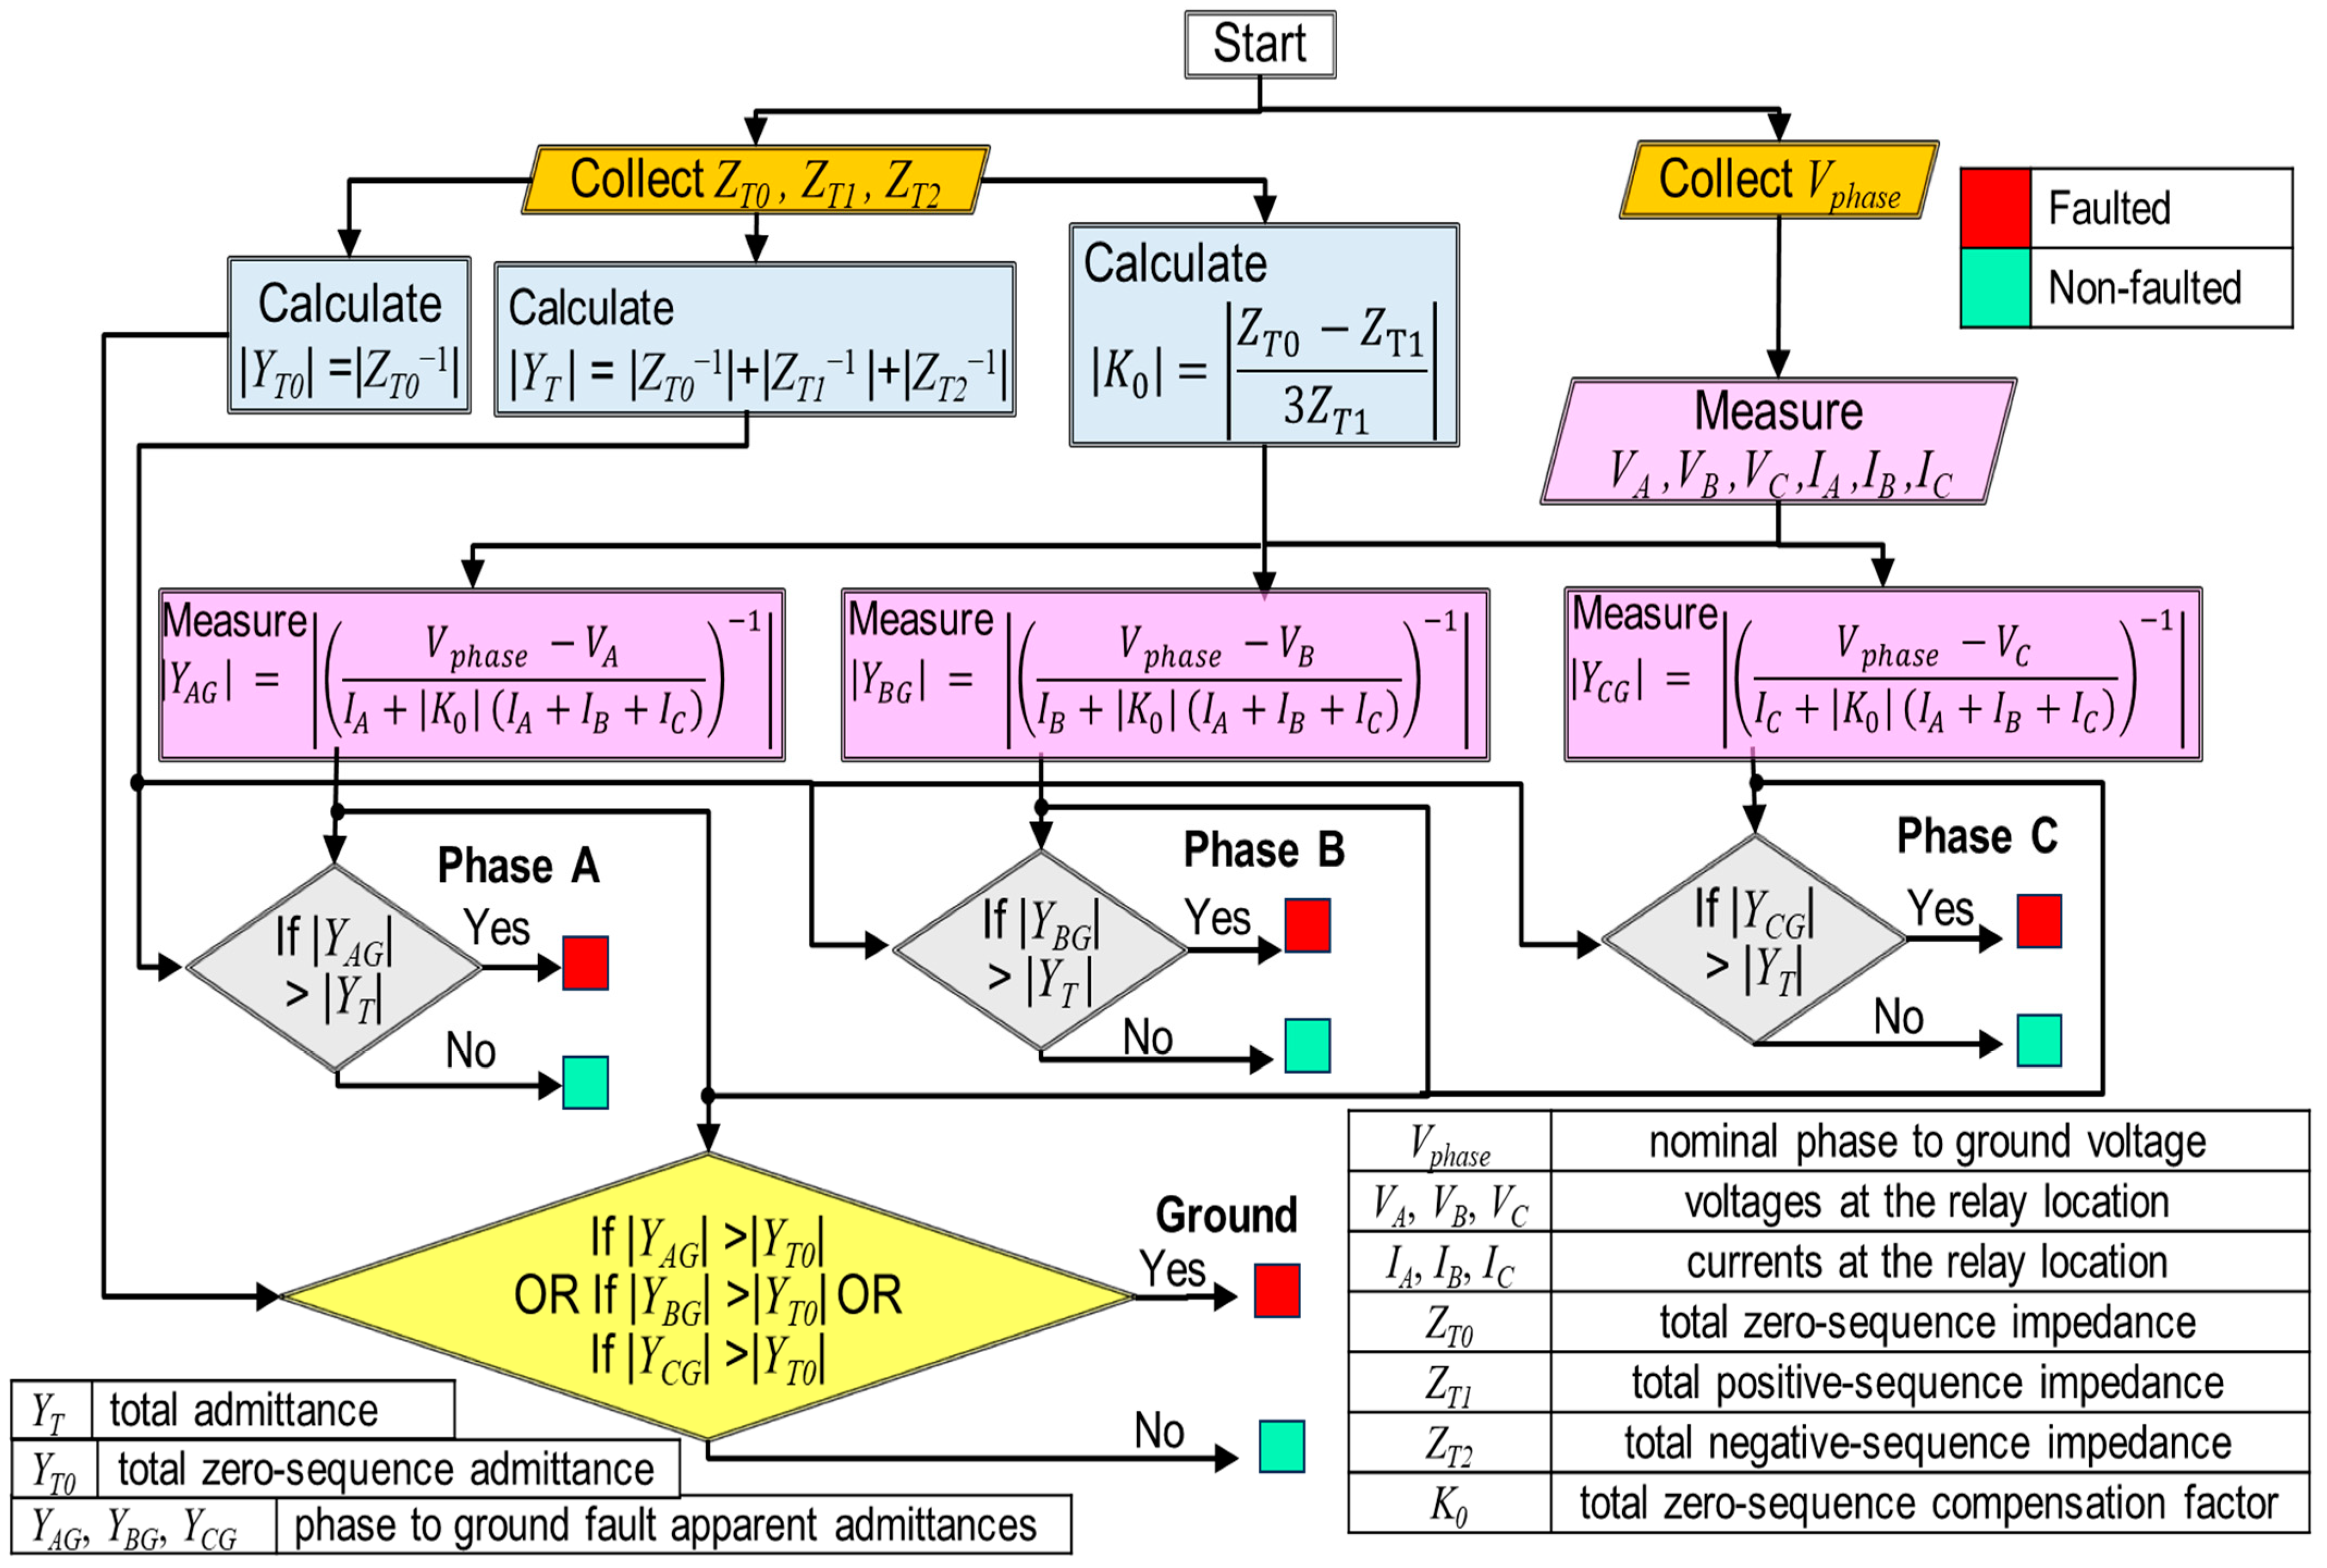
The boundary admittance method was based on implementing an external logic circuit using the algorithm in Figure 2, based on a previous algorithm presented by Dr. Piesciorovsky [28]; it was validated with a software simulation without relays in the loop. It needs to calculate the total admittance (YT), the total zero sequence admittance (YT0), and the zero sequence compensation factor (K0) for the electrical grid circuit. The phase currents and voltages are measured at the relay location to calculate the PGFA admittance for phases A, B, and C. The phase and ground boundaries define the phase and ground faults based on identifying the desired conditions of the phases (A, B, C) and ground light indicators (Figure 2) for faulted and non-faulted states.
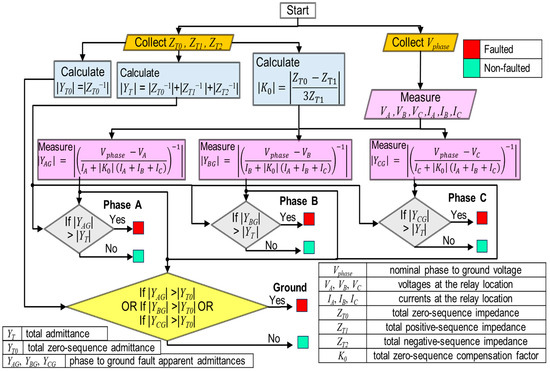
Figure 2.
Phase-to-ground fault apparent admittance algorithm [28].
The boundary admittance method is based on measuring the inverse impedance magnitude to identify electrical fault types. In Figure 2, the voltages (VA, VB, VC), and currents (IA, IB, IC) at the location of the breaker were recorded to calculate the PGFA admittance magnitude during faulted and non-faulted states. From Figure 2 [28], the PGFA admittance magnitude for a generic phase p is given by Equation (1),
where Ypg is the PGFA admittance magnitude for a p generic phase in siemens, Vphase is the nominal phase-to-ground voltage in volts, Vp is the measured line-to-ground voltage for a p generic phase in volts, Ip is the measured current for a p generic phase in amps, IA, IB, IC are the measured phase currents in amps, and K0 is the total zero sequence current compensation factor calculated by Equation (2),
where ZT0 and ZT1 are the total zero and positive sequence impedance in ohms.
In Equation (2), the zero sequence current compensation factor magnitude (|K0|) and the angle (K0<) of the power line sections were implemented to define the boundary admittance algorithm. Then, |K0| and K0< were calculated using Equations (3) and (4), respectively.
where K0 imag and K0 real are the imaginary and real parts of the zero sequence current compensation factor magnitude, respectively.
In Figure 2, the phase and ground conditions represent the admittance boundaries for detecting the fault types. Then, the faulted phase and ground zones were defined by |YT| and |YT0|, respectively. The phase faulted zones for the admittance were given by Equation (5) in siemens,
and the ground faulted zone for the measured admittance magnitudes was given by Equation (6) in siemens,
where Ypg is the PGFA admittance magnitude for a p generic phase in siemens, YT is the phase faulted zone limit in siemens, YT0 is the ground faulted zone limit in siemens, RT is the total resistance of the power line sections in ohms, and XT is the total reactance of the power line sections in ohms.
With the boundary admittance method (external algorithm), from the A, B, and C phase and ground conditions (Figure 2) in Equations (5) and (6), the phases (A, B, C) and ground states are defined using a well-established algorithm that shows how green (non-faulted states) or red (faulted states) light indicator sequences define the electrical fault types.
3. Materials and Methods
3.1. The Advanced Synchronized Time Digital Grid Twin Testbed with Paired Relays
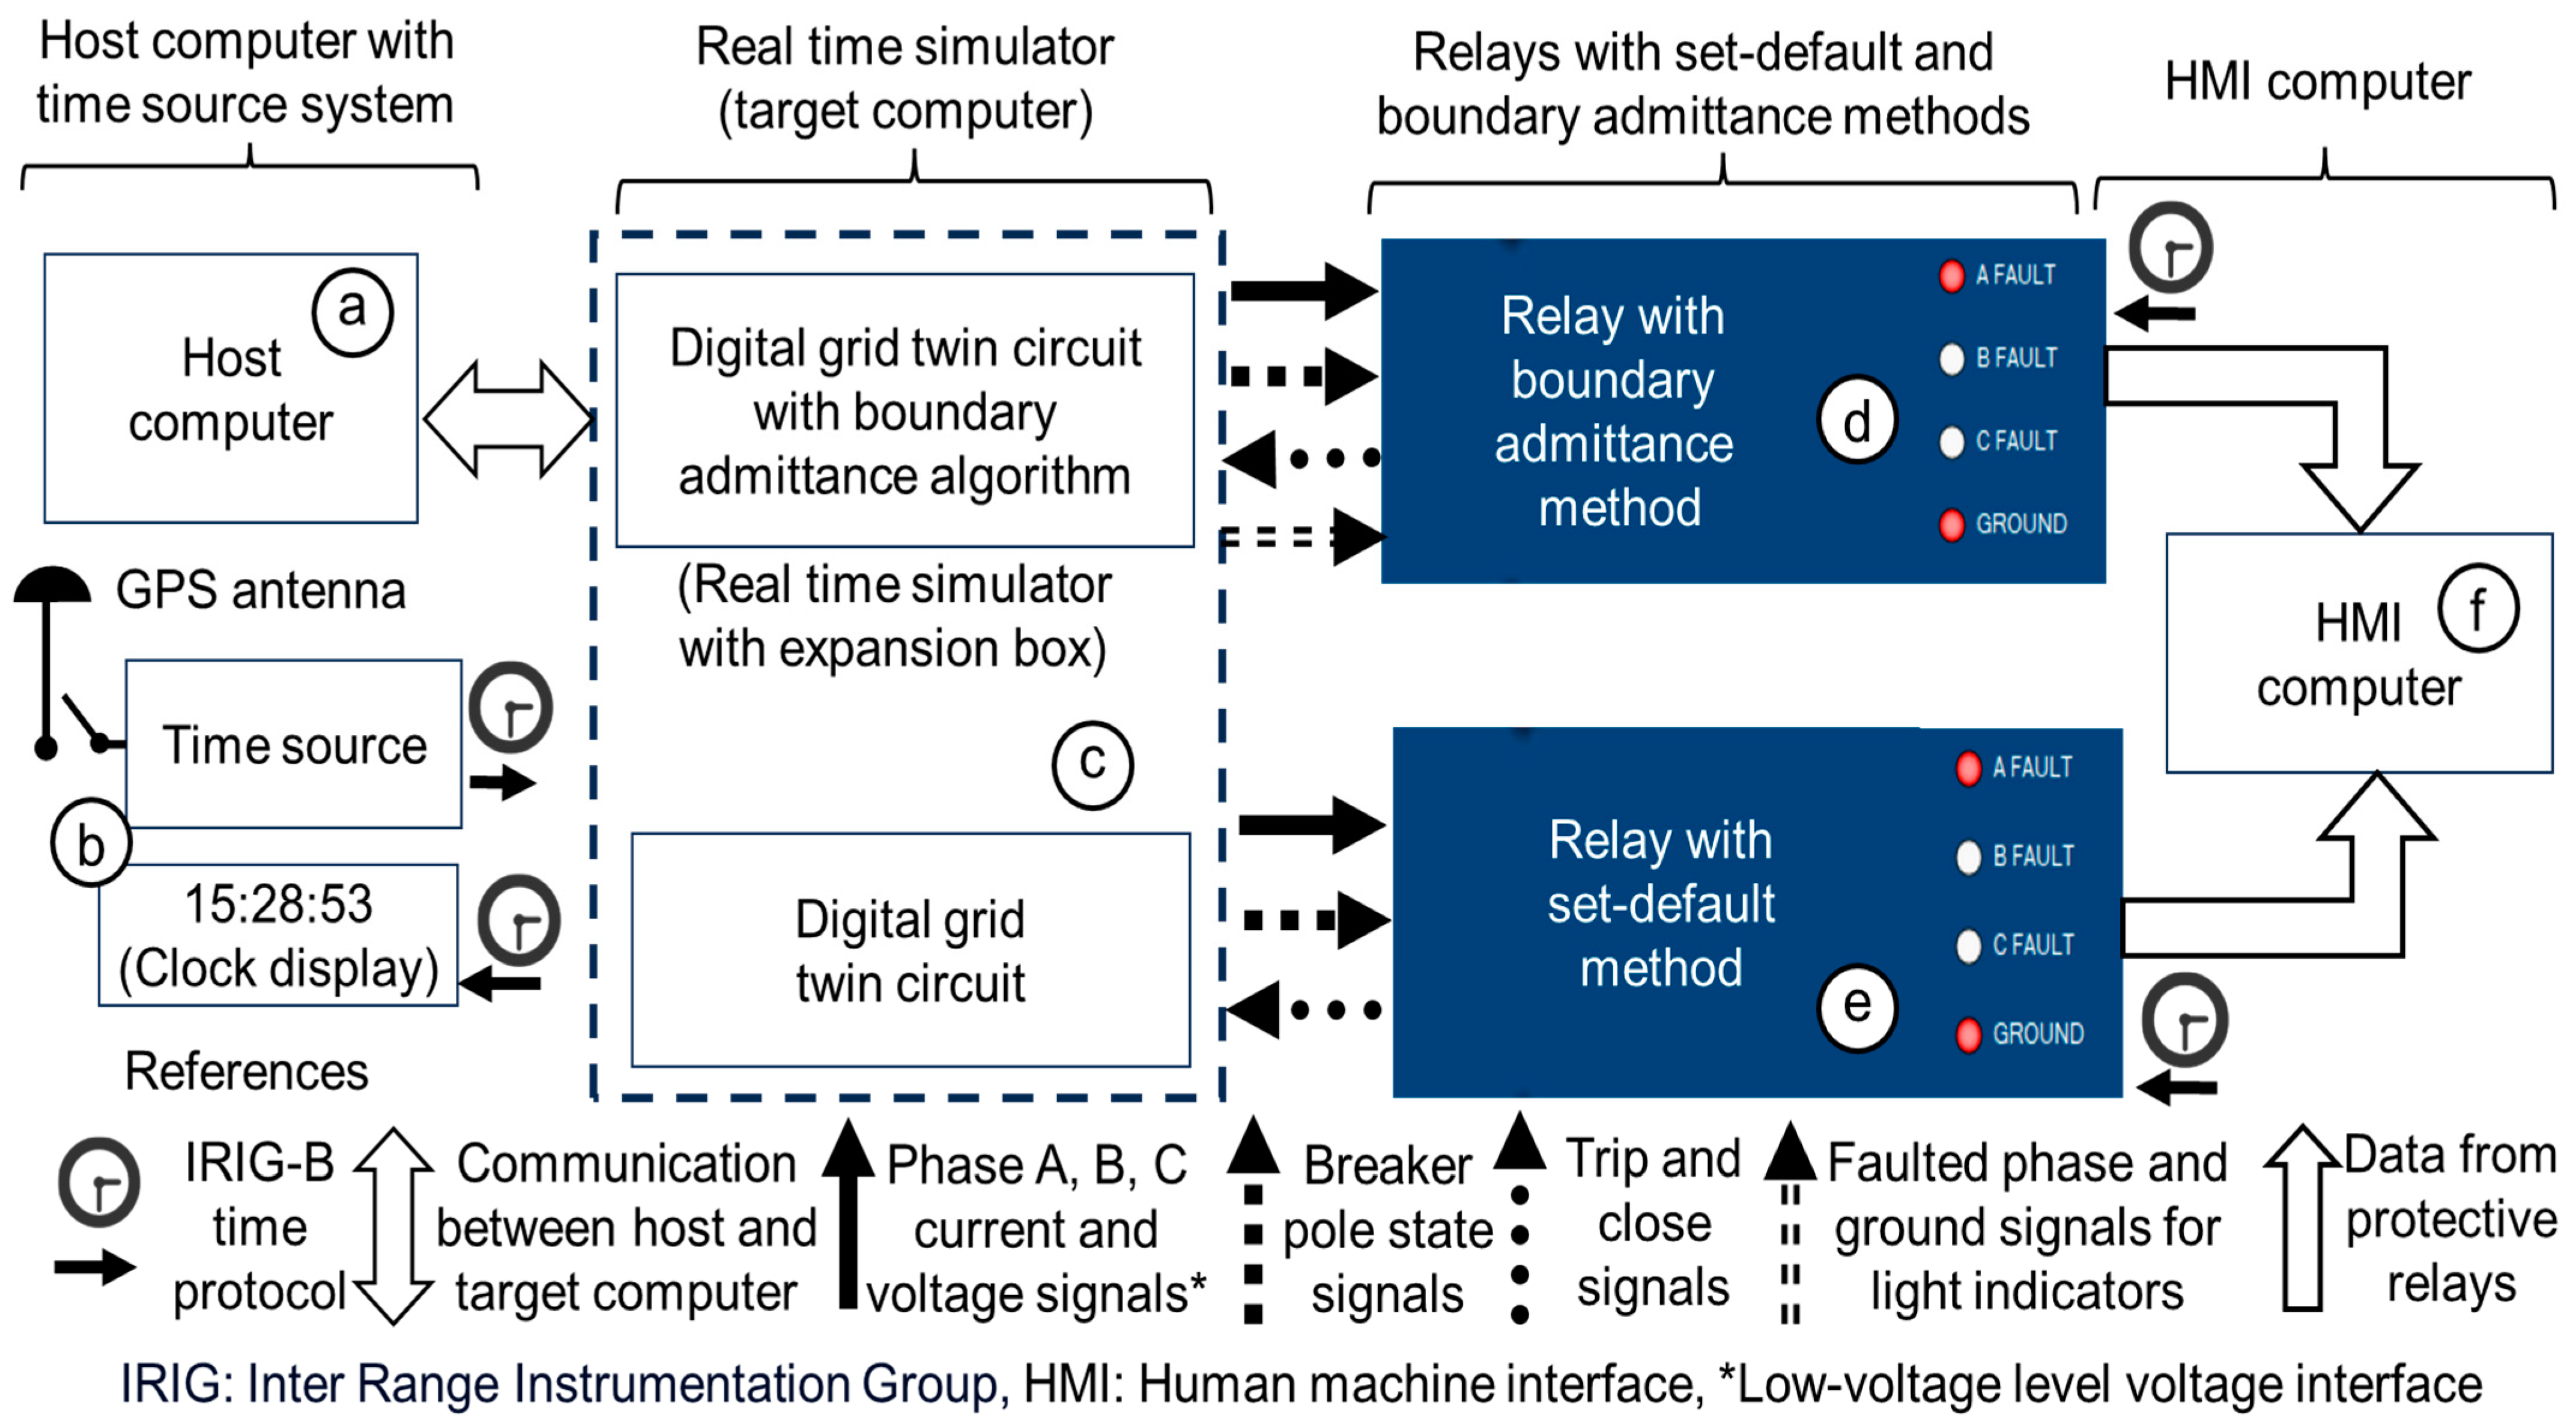
In the ASTDGT testbed, the set-default relay method (internal algorithm) and boundary admittance method (external algorithm) were evaluated. The set-default relay method was defined by internal relay logic, and it only depended on setting the A, B, and C phase and ground target LEDs (Figure 1) without the need to modify the setting values. However, the boundary admittance method used an external algorithm that was run with an RTS and the relay in the loop. In this external algorithm, the phase-to-ground fault apparent admittance application (Figure 2) required the sequence impedance of the power line sections to be collected to calculate the total admittance (YT), total zero sequence admittance (YT0), and zero sequence compensation factor (K0) for the electrical grid circuit. These setting values (YT, YT0, K0) were set directly in the external algorithm implemented by the RTS (target computer) using the Windows command station (host computer) as an interface (Figure 3) via Transmission Control Protocol/Internet Protocol (TCP/IP). However, the RTS can be connected either directly to the host computer (direct connection), like in Figure 3, or via a local area network (a local area network configuration). In the ASTDGT testbed, the algorithm of the boundary admittance method was implemented with the RTS. Then, the algorithm signal outputs of the RTS were connected directly to the relay control inputs, which allows relays from different manufacturers with control inputs to be used for future applications. The ASTDGT testbed with paired relays was implemented to analyze the misoperations of the boundary admittance method (external algorithm) and the set-default relay method (internal algorithm) to determine the electrical fault types based on the light indicators of the relays (Figure 3). The testbed diagram includes a host computer (Figure 3a) with a time source system (Figure 3b) and an RTS (Figure 3c), which were connected to the relays (Figure 3c,d) with a human–machine interface (HMI) computer (Figure 3a).
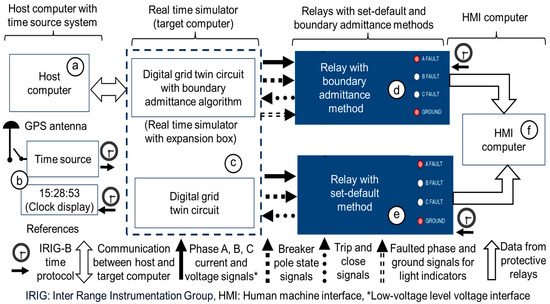
Figure 3.
Host computer with time source system (a,b), real-time simulator (c), relays (d,e), and human–machine interface (HMI) computer (f).
Inside the RTS (target computer), the digital grid twin circuits were set with the boundary admittance algorithm (Figure 3c). One digital grid twin circuit with the boundary admittance algorithm (Figure 3c) was connected to a relay (Figure 3d), and another identical relay with the set-default algorithm (Figure 3e) was connected to the second digital grid twin circuit (Figure 3c). The HMI computer (Figure 3f) collected the data from the relays. The host computer (Figure 3a) downloaded and ran the RT-LAB project to execute and supervise the tests. The RTS (Figure 3c) generated the phase current and voltage signals (solid arrows), which were injected into the relays and generated the breaker pole state signals (square arrows) that were collected from the relays. The relays generated the trip/close signals (dotted arrows) that controlled the breakers inside of the digital grid twin circuits. The phases (A, B, C) and ground light indicator signals (double-dashed arrows) were generated from the boundary admittance algorithm in the RTS and collected by the relay (Figure 3d). The time source (Figure 3b) could be synchronized using a GPS antenna (or an internal clock of the time source), which set the same time stamp for all relays with the Inter Range Instrumentation Group-B protocol. This protocol is an important tool for assessing the time stamps from the recorded events for both relays by observing whether a delay time is present in the implemented boundary admittance method. Figure 4a shows the relay front side with the clock display (CD) and the relays. Figure 4b shows the relay rear side with the faulted phase and ground signals for the light indicators connected to the control input IN202-03-04-05 of the relay with the boundary admittance method (RWBAM). Figure 4c shows the RTS with an expansion box that simulates the digital grid twin circuits for the relays and the boundary admittance algorithm.
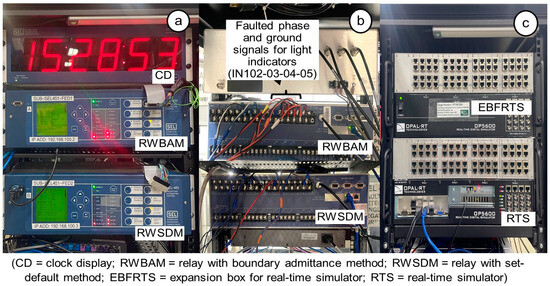
Figure 4.
Testbed relay’s front (a) and rear (b) sides with the real-time simulator (c).
In Figure 4, the RTS interacts with the relay using the boundary admittance method (RWBAM) and the relay with the set-default method (RWSDM). The RTS analog output signals for the phase current/voltage signals were wired to the low-voltage level interface of the SEL 451 relays’ front sides (Figure 4a). In the relays, the current and voltage gains for the RTS were calculated at the low-voltage level interface using the current and voltage scaling factors from the relay’s instruction manual [18]. The analog signals for the relays were scaled using simulated phase currents and voltages with gain blocks. These current and voltage gains were calculated by Equations (7) and (8), respectively.
where CGR is the current gain in the RTS for the relay, CTRR is the current transformer ratio of the relay (80), and CSF is the SEL 451 relay’s current scaling factor (75 A/V) in amperes per volt.
In the RTS, the analog inputs for the trip/close signals of the breakers were connected to the control outputs of the relay’s rear sides (Figure 4b). The RTS digital outputs for the breaker pole state and the faulted phases and ground signals for the light indicators were wired to the control inputs of the relay’s rear sides (Figure 4b).
3.2. A Single-Line Diagram of the Digital Grid Twin
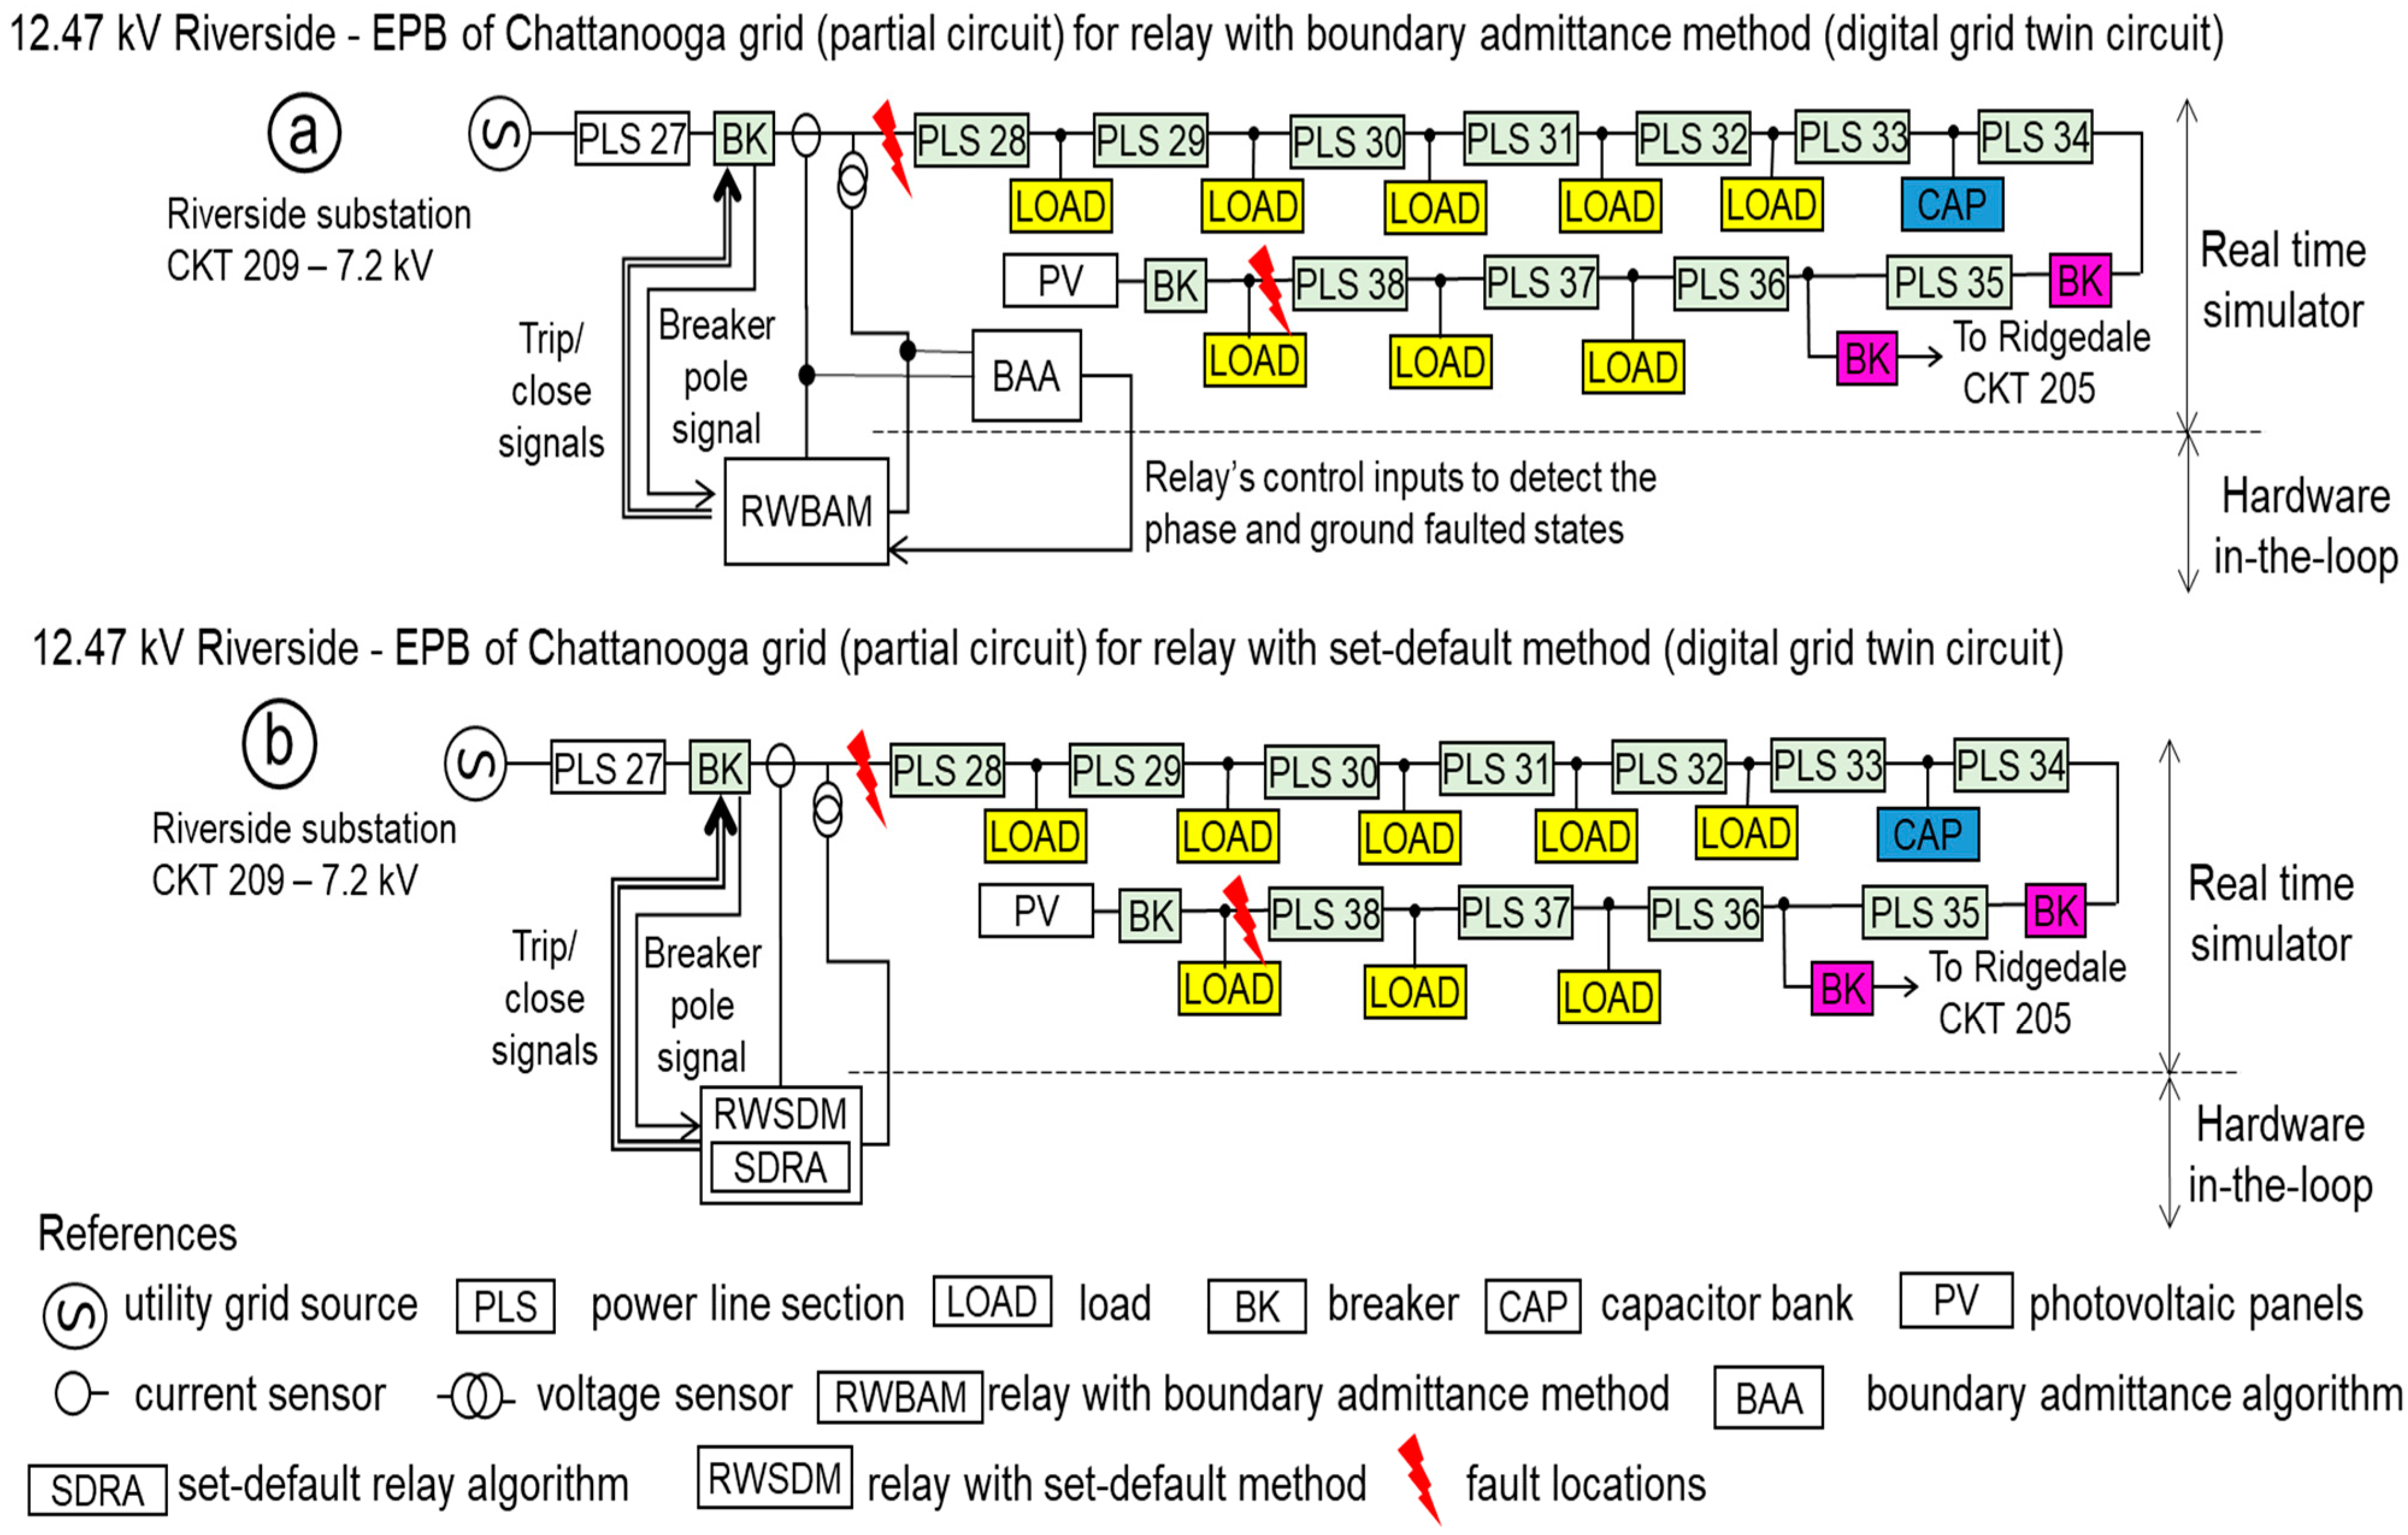
In this experimental model, the digital grid twin was created in an RT-LAB project using part of the Electric Power Board (EPB) Riverside substation [22]. Single-line diagrams of the electrical grid for the digital grid twin are shown in Figure 5. This electrical configuration was a radial system with a 7.2 kV phase-to-ground voltage. The digital grid twin grid circuits were set into the RTS (Figure 5a,b), and the relays were the hardware-in-the-loop. In Figure 5a, the boundary admittance algorithm was run inside the RTS, and the outputs of the algorithm were wired to the relay’s control inputs. However, the set-default relay algorithm was run inside the relay (Figure 5b). The boundary admittance algorithm (Figure 5a) and the set-default relay (Figure 5b) algorithm were applied between power line sections 27 and 38. The purpose was to assess both algorithms for different electrical faults near the relay’s breaker and at the end of power line section 38.
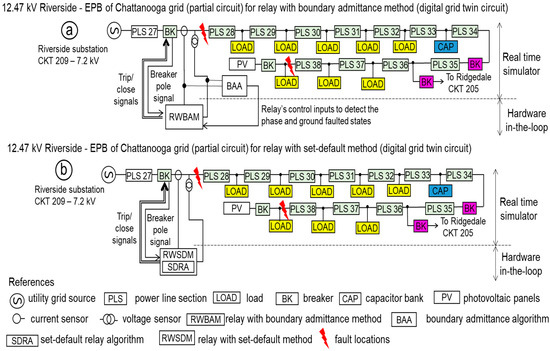
Figure 5.
Single-line diagram of digital grid twin for relay with boundary admittance (a) and set-default (b) methods.
3.3. A Three-Line Diagram of the Digital Grid Twin
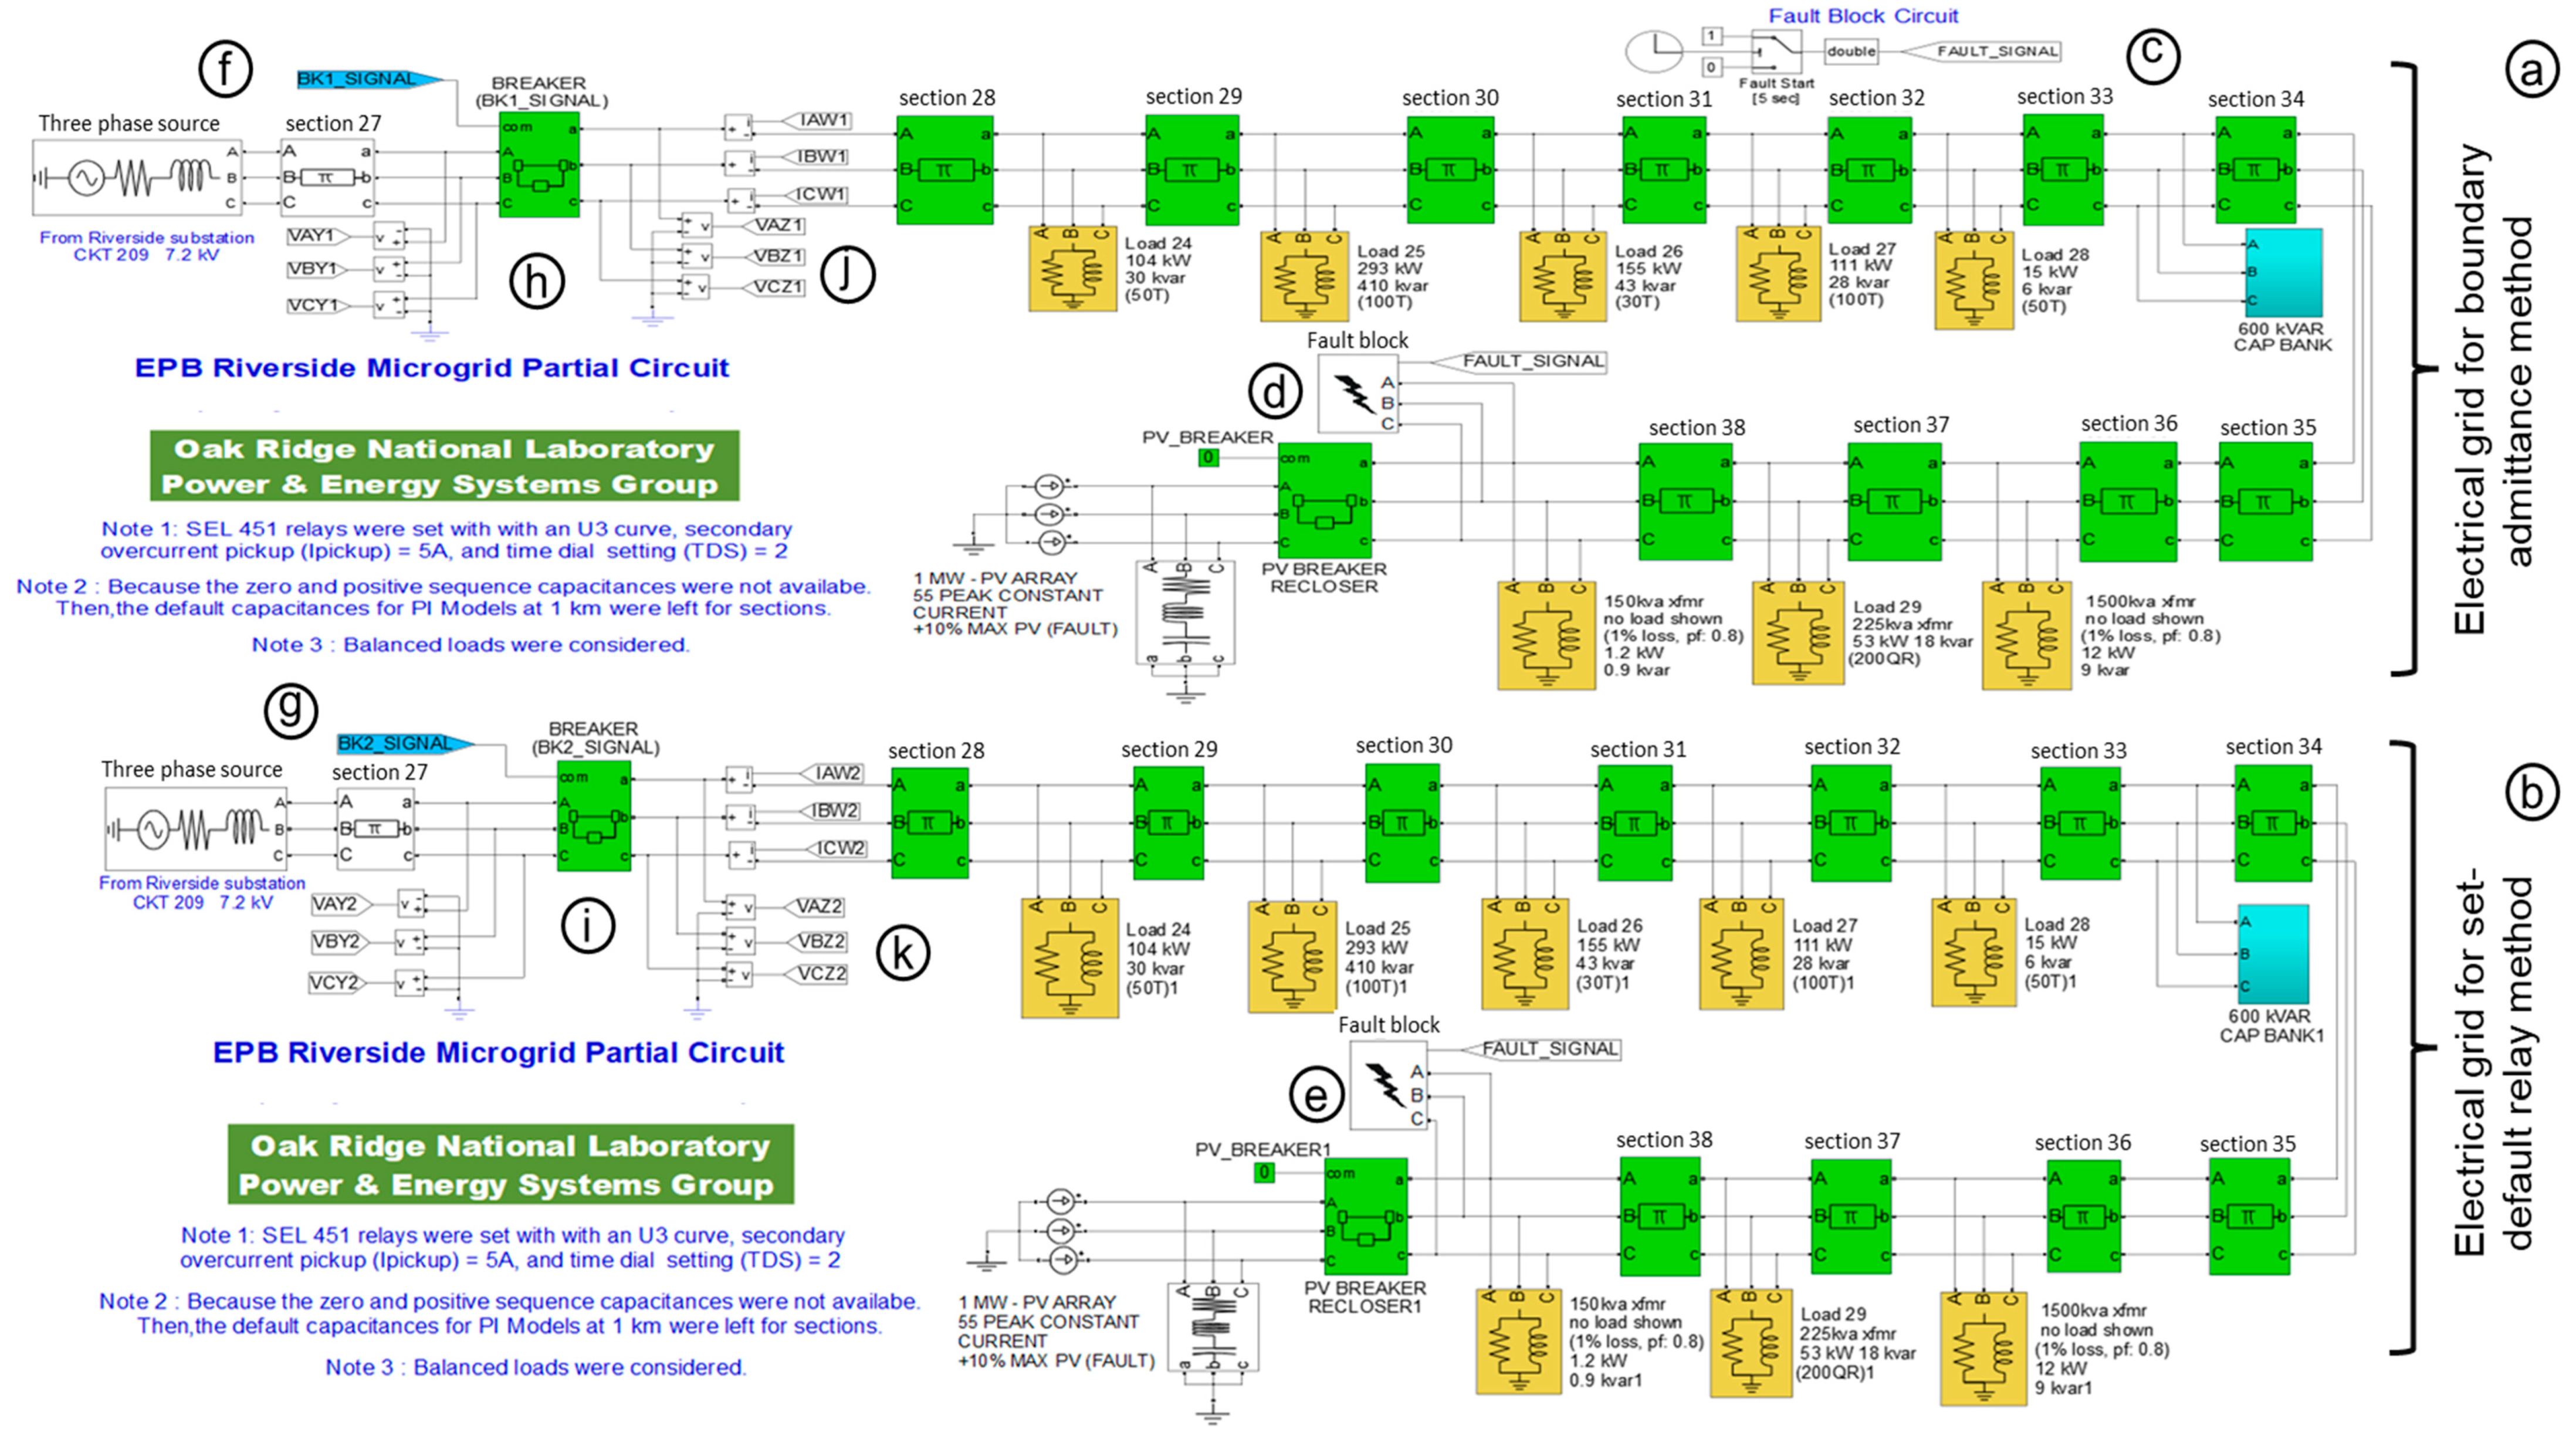
The RT-LAB project was built to run the use case tests. Figure 6 shows three-line diagrams of the digital grid twin that were created with MATLAB/Simulink models, based on Figure 5. The electrical grid circuits for the relays with the boundary admittance method and the set-default relay method are shown in Figure 6a and Figure 6b, respectively. The three-line diagrams of the EPB Riverside microgrid partial circuit (Figure 6a,b) show the fault block circuit (Figure 6c), fault blocks (Figure 6d,e), breaker signals (Figure 6f,g), three phase breakers (Figure 6h,i), and analog signals (Figure 6j,k).
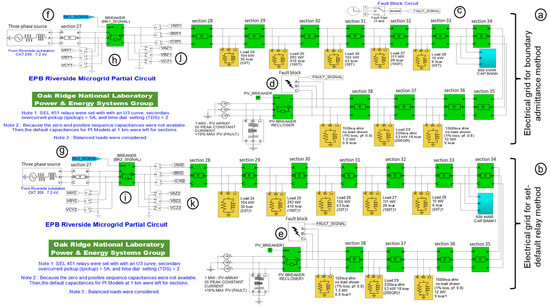
Figure 6.
Three-line diagram of digital grid twin of EPB Riverside microgrid partial circuit (a,b), fault block circuit (c), fault block (d,e), breaker signals (f,g), three phase breakers (h,i), and analog signals (j,k).
The digital grid twin three-line diagrams (Figure 6a,b) include the source, capacitor banks, power lines, loads, and breakers. In this study, the tests were run for 10 s, and the faults were created by fault blocks (Figure 6d,e) controlled by the fault block circuit (Figure 6c) that triggered fault states at 5 s. The fault tests were based on generating different electrical faults located near the breaker site and at the end of power line section 38. IntelliRupters were used in the power grid circuit of the EPB in Chattanooga [22]. However, two identical SEL 451 relays were used in the digital grid twin circuits (Figure 6a,b). The sensor blocks (Figure 6j,k) collected the currents and voltages at the three phase breaker locations (Figure 6h,i). Tests for the same types of electrical faults and locations were run in synchronized time using these two identical electrical grid circuits and the recorded events from the relays collected with the same time stamp.
3.4. Twin Relay Settings
In the ASTDGT testbed, the paired SEL 451 relays [18] were set with an inverse time overcurrent protection scheme because SEL 451 relays [18] are mainly overcurrent relays and they were located near feeder loads (Figure 5). However, different protection schemes could be applied in the relays of the ASTDGT testbed depending on the power grid topology for the RT-LAB project, the types of relays (overcurrent, distance, differential, etc.), and the relay locations (feeders, transformers, generators, etc.) in the power grid. In this study, the paired relays were set with the same inverse time current (ITC) curve settings. The U3 Very ITC curve was given by Equation (9), and the relays had a time dial setting (TDS) of 2 s, a current transformer ratio (CTR) of 80, and a relay current pickup (IP) of 5 A.
where TR is the relay time in cycles, Iprimary is the primary current in amperes, and K1 (0.0963), K2 (3.88), and K3 (2) are the constants of the ITC curve (U3).
The inverse time current curves of the relays allowed us to trip the breakers (Figure 6h,i) at the fault currents. In the ASTDGT testbed (Figure 3), selectivity coordination between the primary and backup relays was not performed because one relay was set for each digital grid twin (Figure 5), and the boundary admittance (external algorithm) method and set-default (internal algorithm) relay method determined the electrical fault types without the necessity of studying the selectivity coordination.
The electrical fault tests were performed for 10 s. In the relays, the target LEDs for identifying the electrical fault types were set based on Table 1. The LEDs for the phases (A, B, C) and the ground were given by the T9_LED, T10_LED, T11_LED, and T12_LED settings, respectively. However, the LED settings for the relay using the boundary admittance (external algorithm) method were given by the control inputs IN102, IN103, IN104, and IN105 (Figure 4b) for the T9_LED–T12_LED settings, respectively.

Table 1.
Target LED settings of relays to identify types of electrical faults.
3.5. The Algorithm, Logic Circuit, and Boundaries
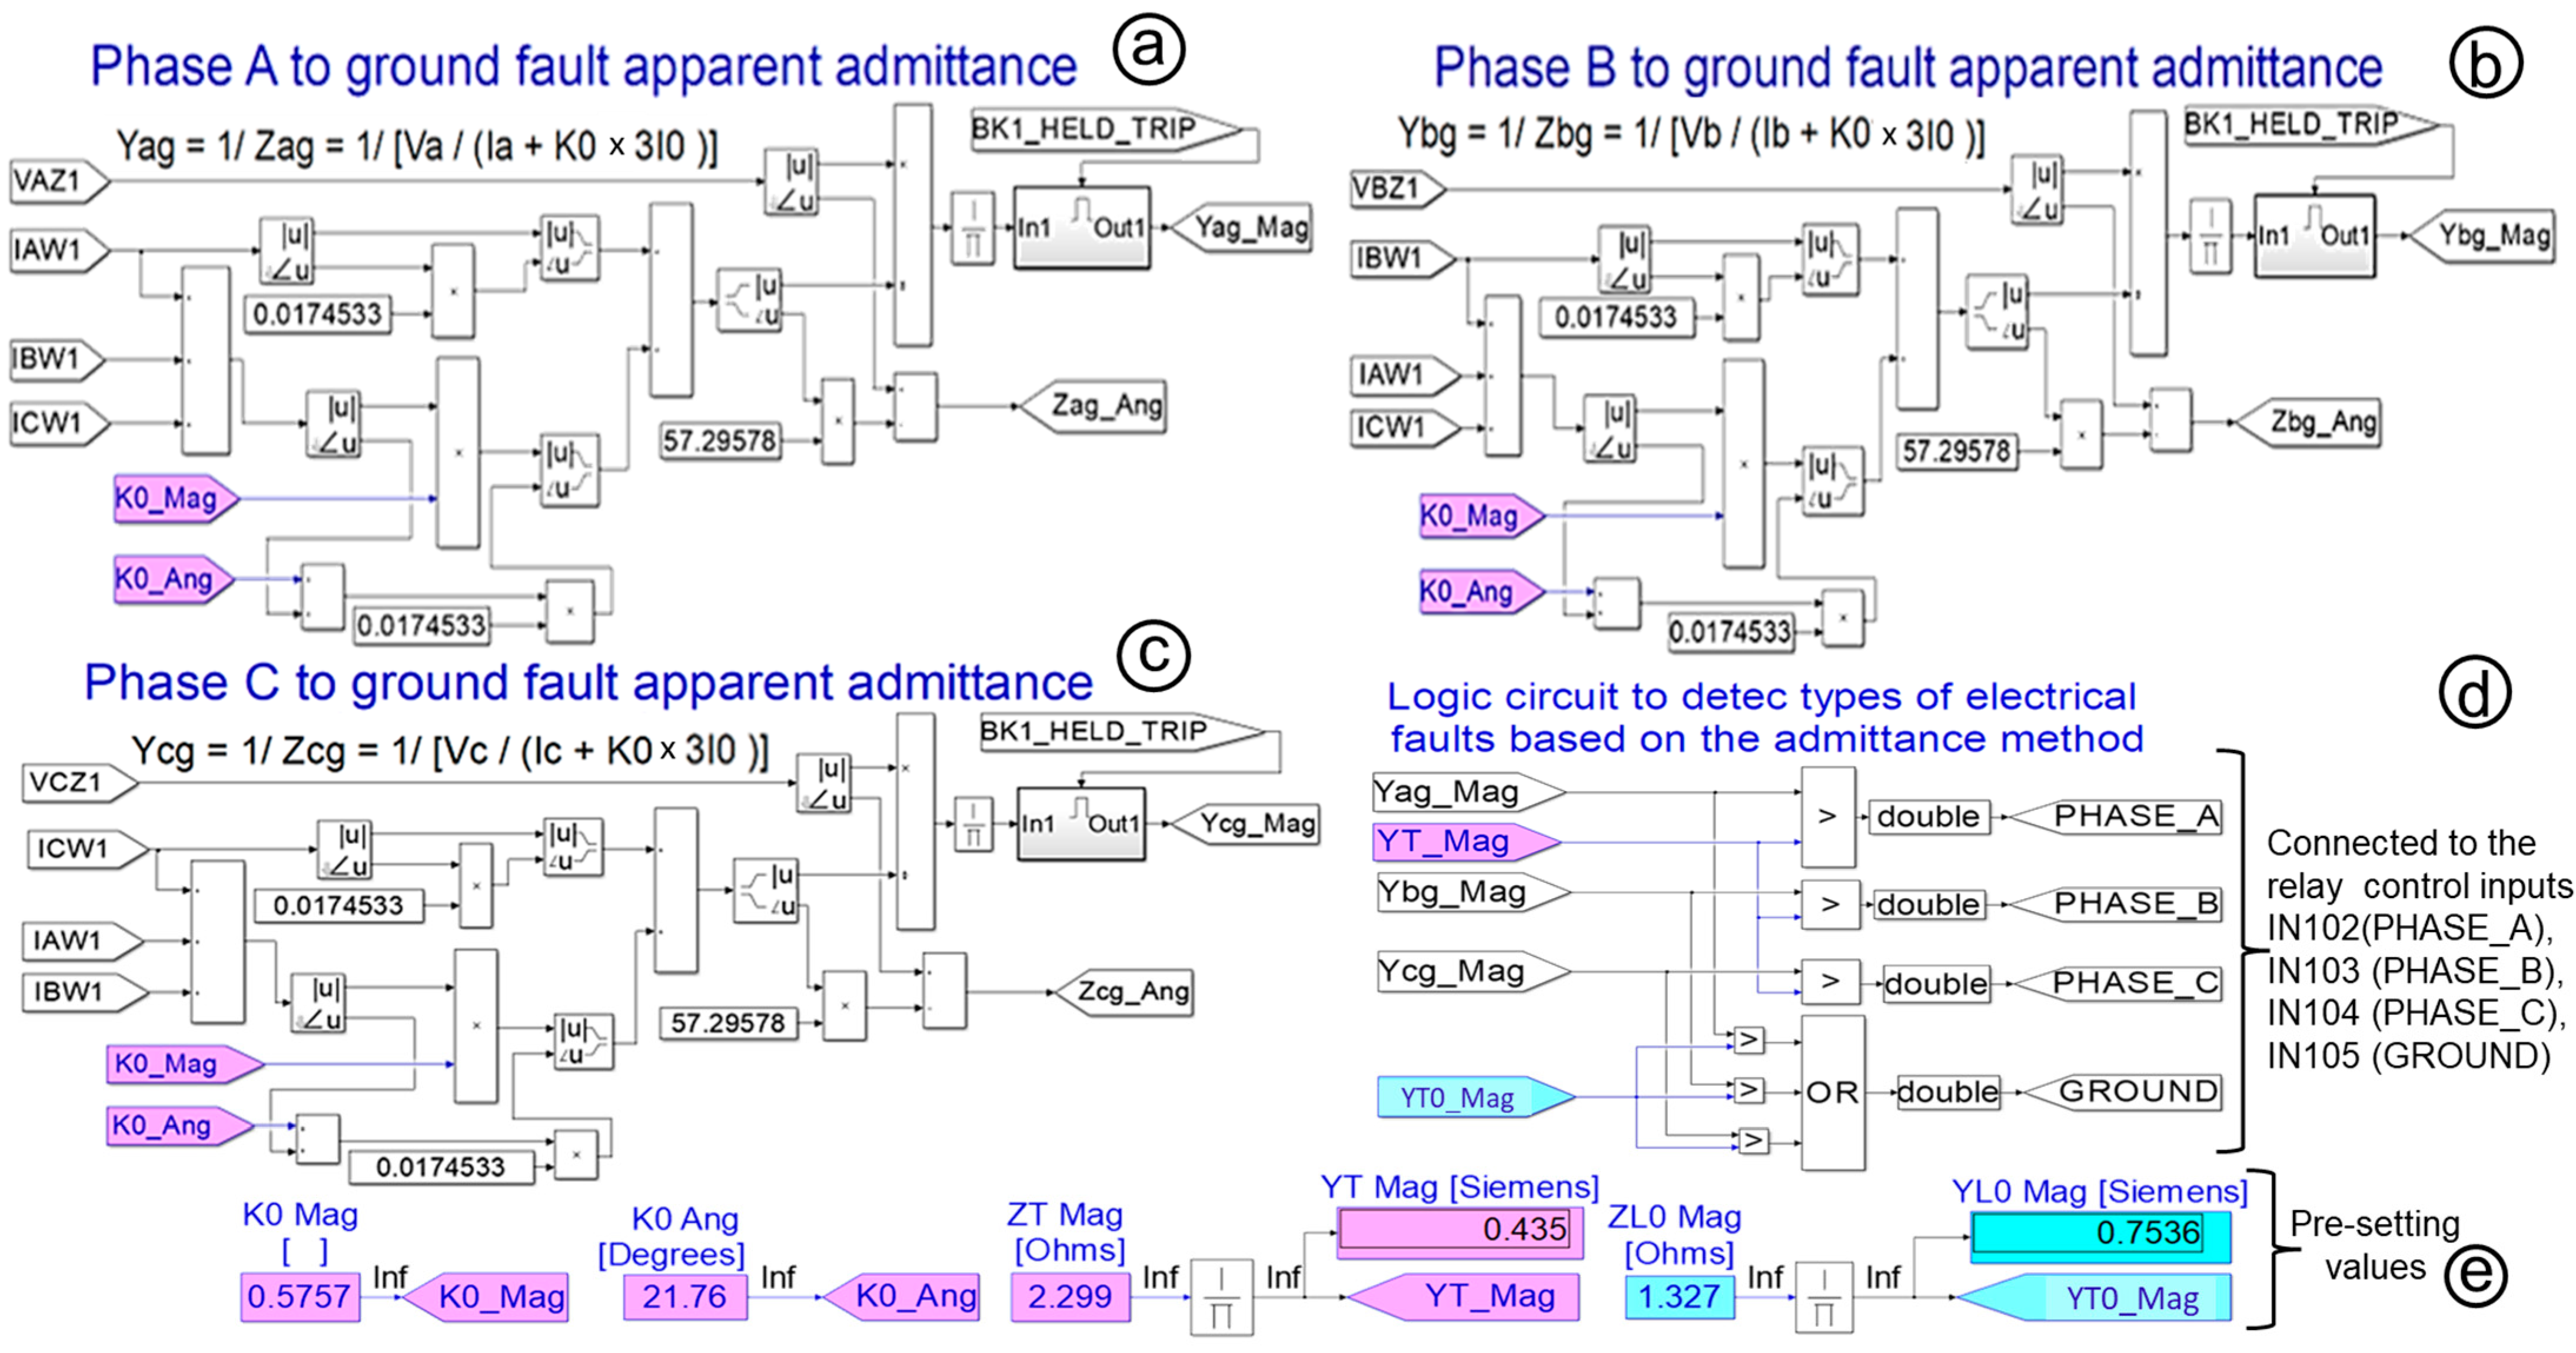
The algorithm and logic circuit for the boundary admittance method (Figure 7) were built in the RT-LAB project. In the relay, the signals of the IN102, IN103, IN104, and IN105 control inputs were generated by the boundary admittance algorithm for phases A, B, and C (Figure 7a–c) with the logic circuit (Figure 7d). In Figure 7, the boundary admittance algorithm for phases A, B, and C with the logic circuit was designed based on measuring the admittance with phase and ground boundaries to determine the electrical fault types, as shown in Figure 2.
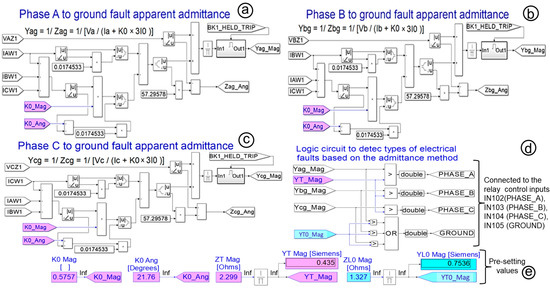
Figure 7.
Phase-to-ground fault apparent admittance algorithm for phases A (a), B (b), and C (c) with the logic circuit (d) and pre-setting values (e) to find out the electrical fault types.
In the circuits in Figure 7a–c, the phase-to-neutral voltages (VAZ1, VBZ1, VCZ1) and phase currents (IAW1, IBW1, ICW1) were recorded from the voltage/current sensors (Figure 6j). The zero sequence current compensation factors (K0_Mag, K0_Ang) in Figure 7e were calculated with Equations (3) and (4), respectively, from power line sections 28 to 38 (Figure 6a). Figure 7 shows the logic circuit that recorded the phase-to-ground apparent admittance magnitude (Yag_Mag, Ybg_Mag, Yc_Mag) in Figure 7a–c. In Figure 7e, the total admittance magnitude (YT_Mag) and total zero sequence admittance (YT0_Mag) were calculated with Equations (5) and (6), respectively. Finally, the PHASE_A, PHASE_B, PHASE_C, and GROUND label signals (Figure 7d) were connected to control inputs IN102–IN105, respectively, for the relay using the boundary admittance method. Table 2 shows the steps used to calculate the limits of the boundary admittance method for the phase and ground faulted zones for the electrical grid circuit in Figure 6a, set as “YT_Mag” and “YT0_Mag” in Figure 7e. In Table 2, the total resistance (RT) and reactance (XT) and the total zero sequence resistance (RT0) and zero reactance (XT0) from power line sections 28 to 38 (Figure 6a) were calculated. Then, the magnitudes of the total admittance (|YT|) and the total zero sequence admittance (|YT0|) were calculated with Equation (5) and (6), respectively. These admittances define the phase and ground faulted zone limits for the boundary admittance method to detect the fault type with the relay’s light indicators. The limit of the boundary admittance method for the phase faulted zone was |Ypg| > |YT| = 0.435 siemens, and for the ground faulted zone, it was |Ypg| > |YT0| = 0.7536 siemens (Table 2).
Table 2.
Calculation steps.
4. Results
4.1. Events and Tests
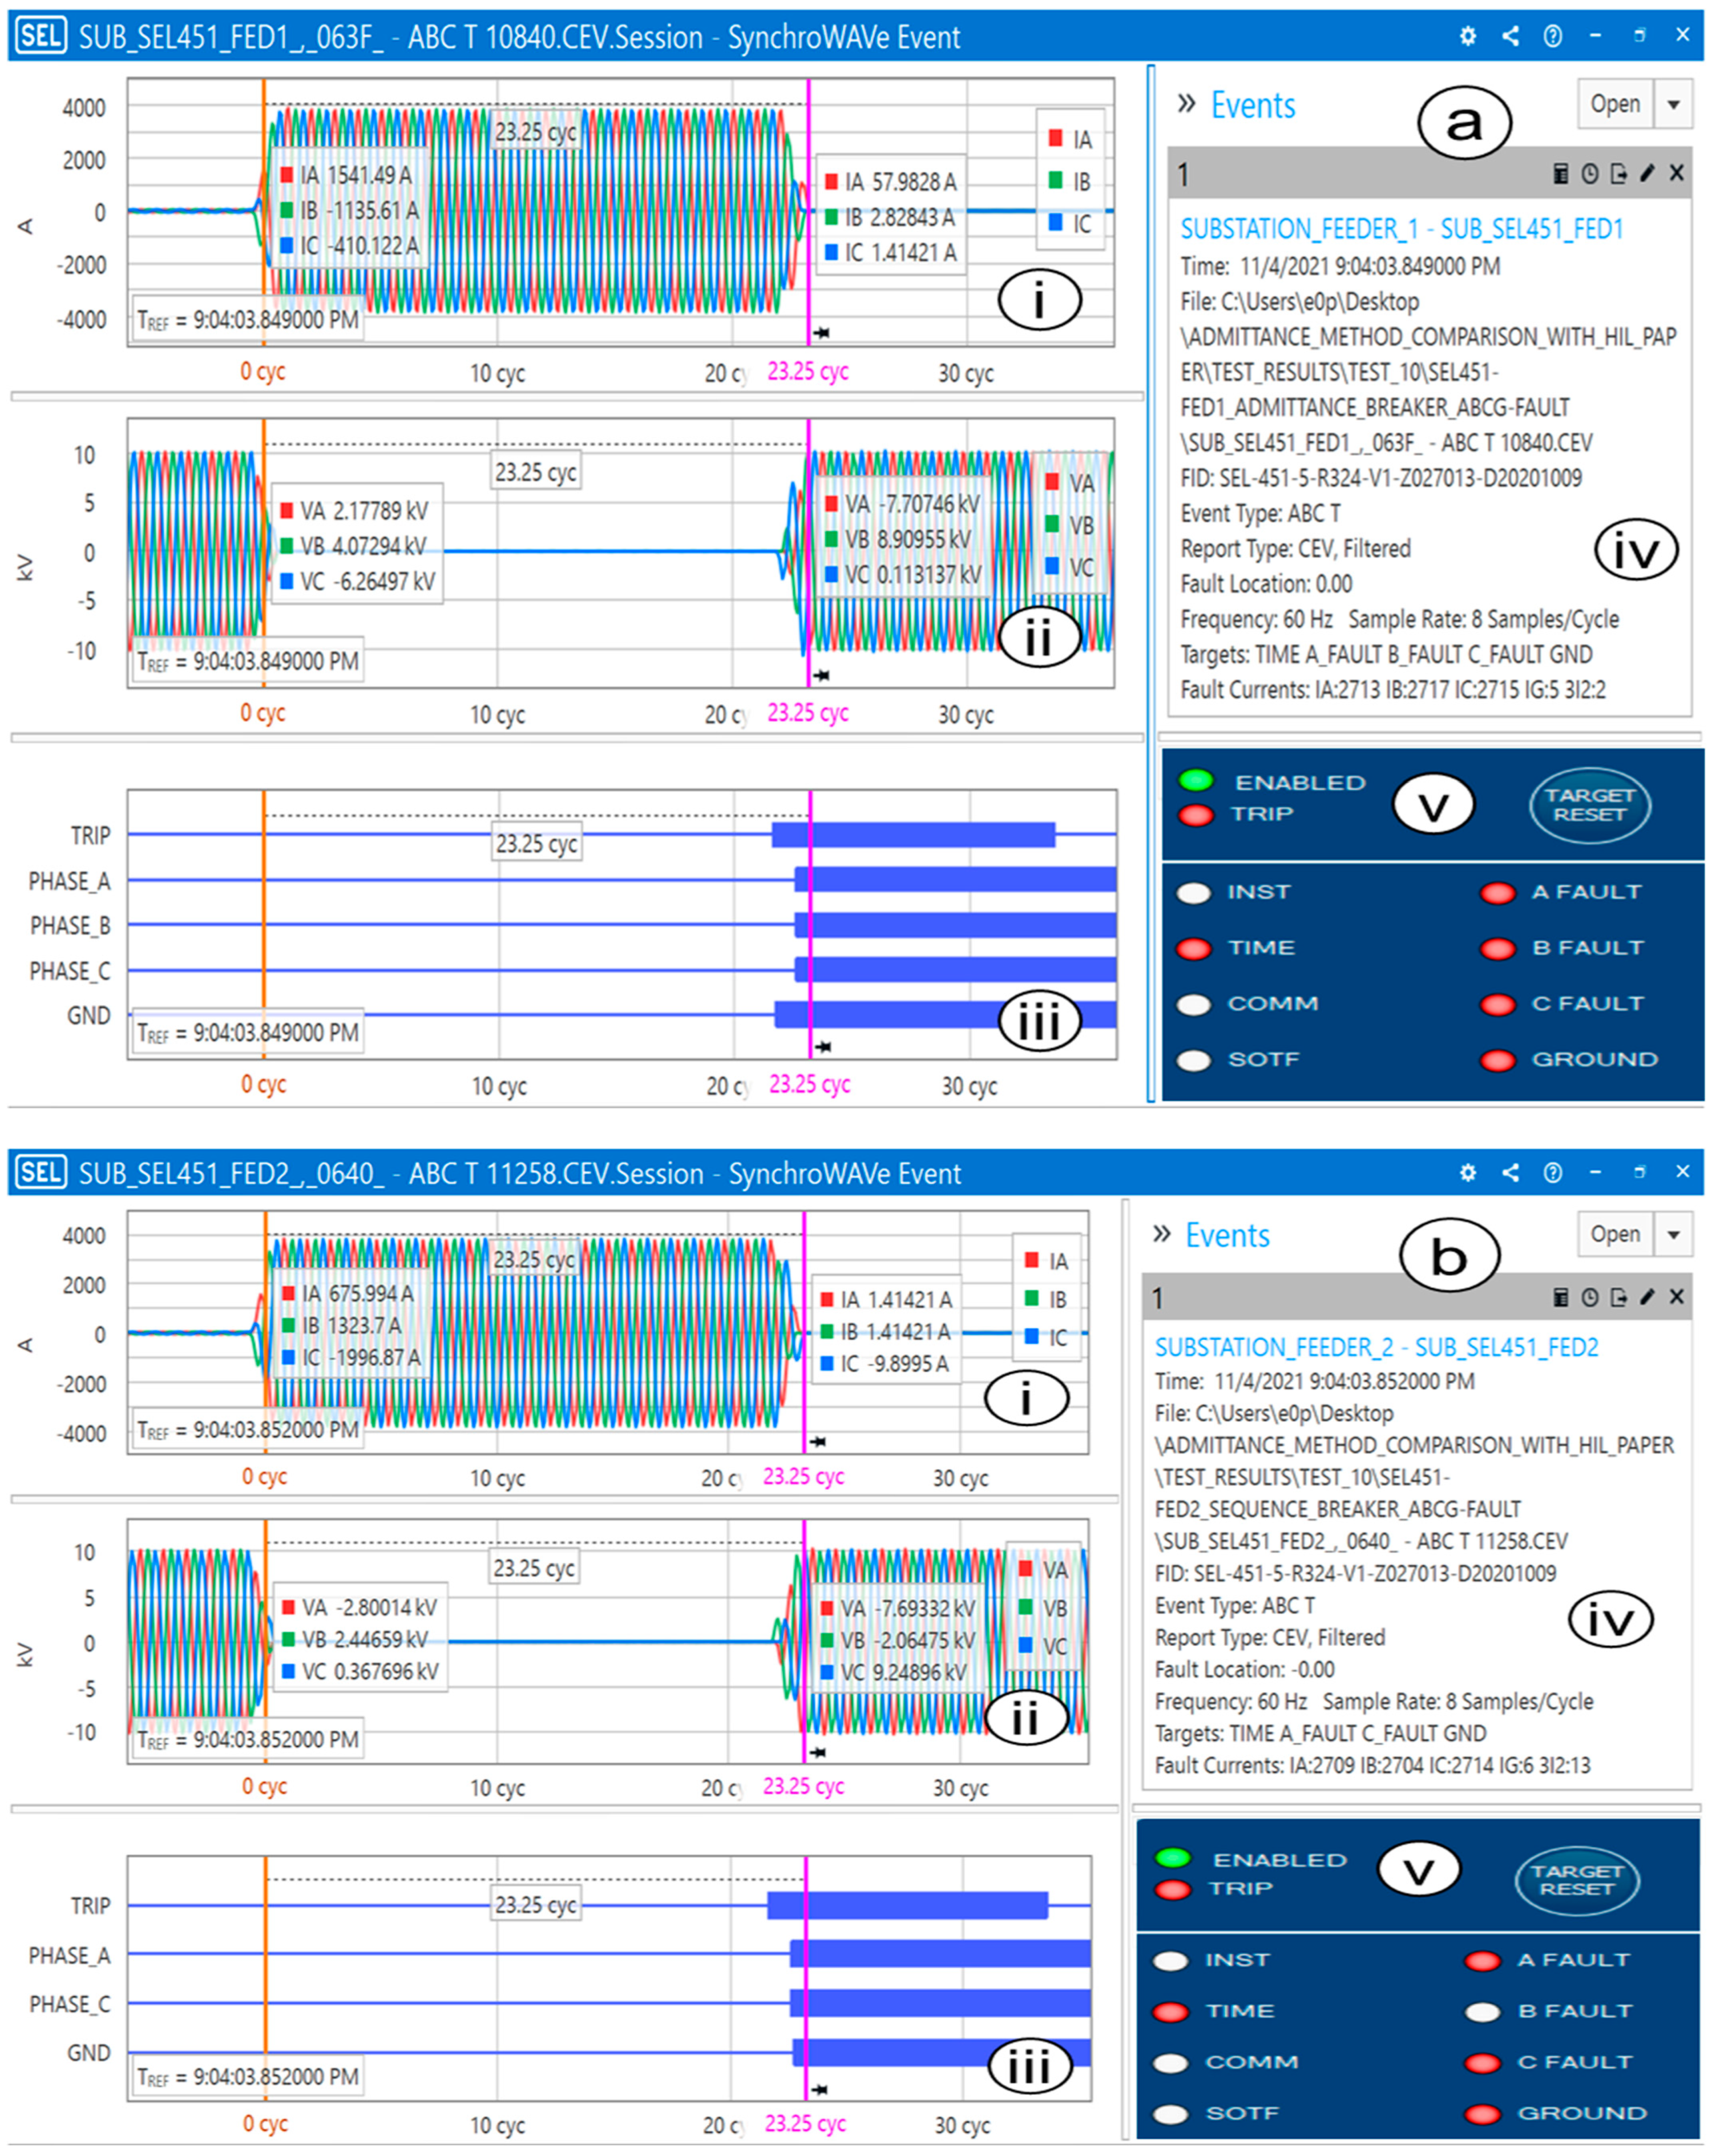
In this study, the analog signals (voltages and currents) and digital signals (trip phases and ground variables) were generated in the pre-fault, fault, and post-fault states. These recorded events were collected by the relays using the set-default relay method and the boundary admittance method to identify the electrical fault types using the phase (A, B, C) and ground light indicators on the relays. The boundary admittance method uses PGFA admittance with phase and ground boundaries [28], and the set-default relay method uses an internal algorithm. Figure 8a,b show the relay events recorded during this study. These figures compare the phase currents (i), phase-to-neutral voltages (ii), digital signals (iii), event data (iv), and phase/ground LED (v) results from the relays using the boundary admittance (Figure 8a) and set-default (Figure 8b) relay methods. The relays used a time source system (Figure 3b), and the same time stamps (hh:mm:ss:mmm = 9:04:03:849 and 9:04:03:852) were used for the same two algorithm events (Figure 8a,b). The boundary admittance method did not show a delay time compared to the set-default relay method. Then, the application of the relay’s control inputs was validated with the external algorithm implemented in the RTS (Figure 3c). The tests were run for electrical faults located at the breaker site and the power line section 38 site. The events were recorded and compared for each test with the boundary admittance and set-default relay methods. Although the actual electrical fault type was an ABC electrical fault, the relay with the boundary admittance method detected an ABCG electrical fault (Figure 8a), and the relay with the set-default method detected an ACG electrical fault (Figure 8c). The measured values were considered the types of electrical faults collected from the relays, and the true values were considered the types of electrical faults set on the MATLAB/Simulink fault blocks (Figure 6d,e) before initiating the tests. Table 3 shows the measured values compared with the true values for the electrical fault tests using the boundary admittance method and the set-default relay method with the ASTDGT testbed (Figure 3 and Figure 4). The synchroWAVe Event software (version 1.9.0.89) was used to plot and analyze the data stored in the relays, as shown in Figure 8.
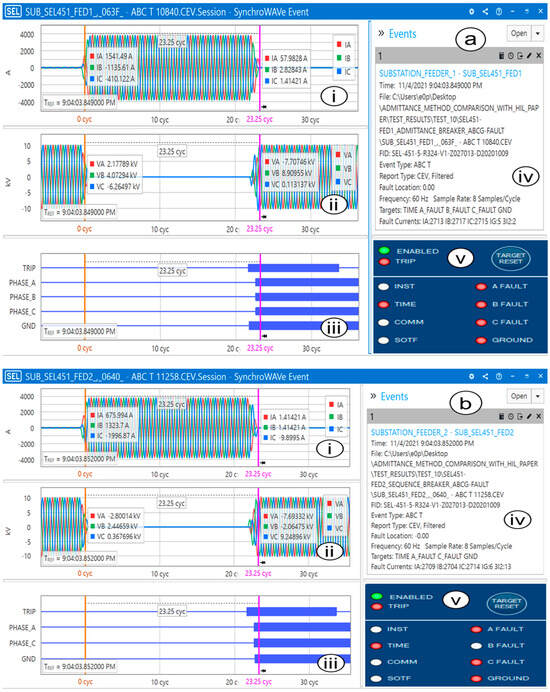
Figure 8.
Phase currents (i), phase-to-neutral voltages (ii), digital signals (iii), event data (iv), and phase/ground LED (v) results from the relays with the boundary admittance (a) and set-default (b) relay methods.
Table 3.
Results for electrical fault tests using the boundary admittance and set-default relay methods.
Table 3 shows the measured values for the electrical fault tests using the boundary admittance method and the set-default relay method alongside the true values. The measured values are the results from the target values of the phase (A, B, C) and ground (GND) LEDs that were collected from the relay events. The true values are the types of electrical faults that were set in the fault blocks (Figure 6d,e) in the RT-LAB project for each test before running the simulations. The same type of electrical fault was set in both fault blocks for each test, and the tests for the boundary admittance method and the set-default relay method were run together using the digital grid twin three-line diagram of the EPB Riverside microgrid partial circuit (Figure 6a,b). In Table 3, the test name column specifies the type of electrical fault and its location on the power grid. The electrical fault tests were conducted near the relay’s breaker site and at the end of the power line section 38 site (Figure 5). From Table 3, the columns with the results and the true values were compared to assess whether the types of electrical faults detected by the boundary admittance method and the set-default relay method matched the types of electrical faults indicated in the column of the true values.
4.2. Analysis of the Measured Phase and Ground LED States
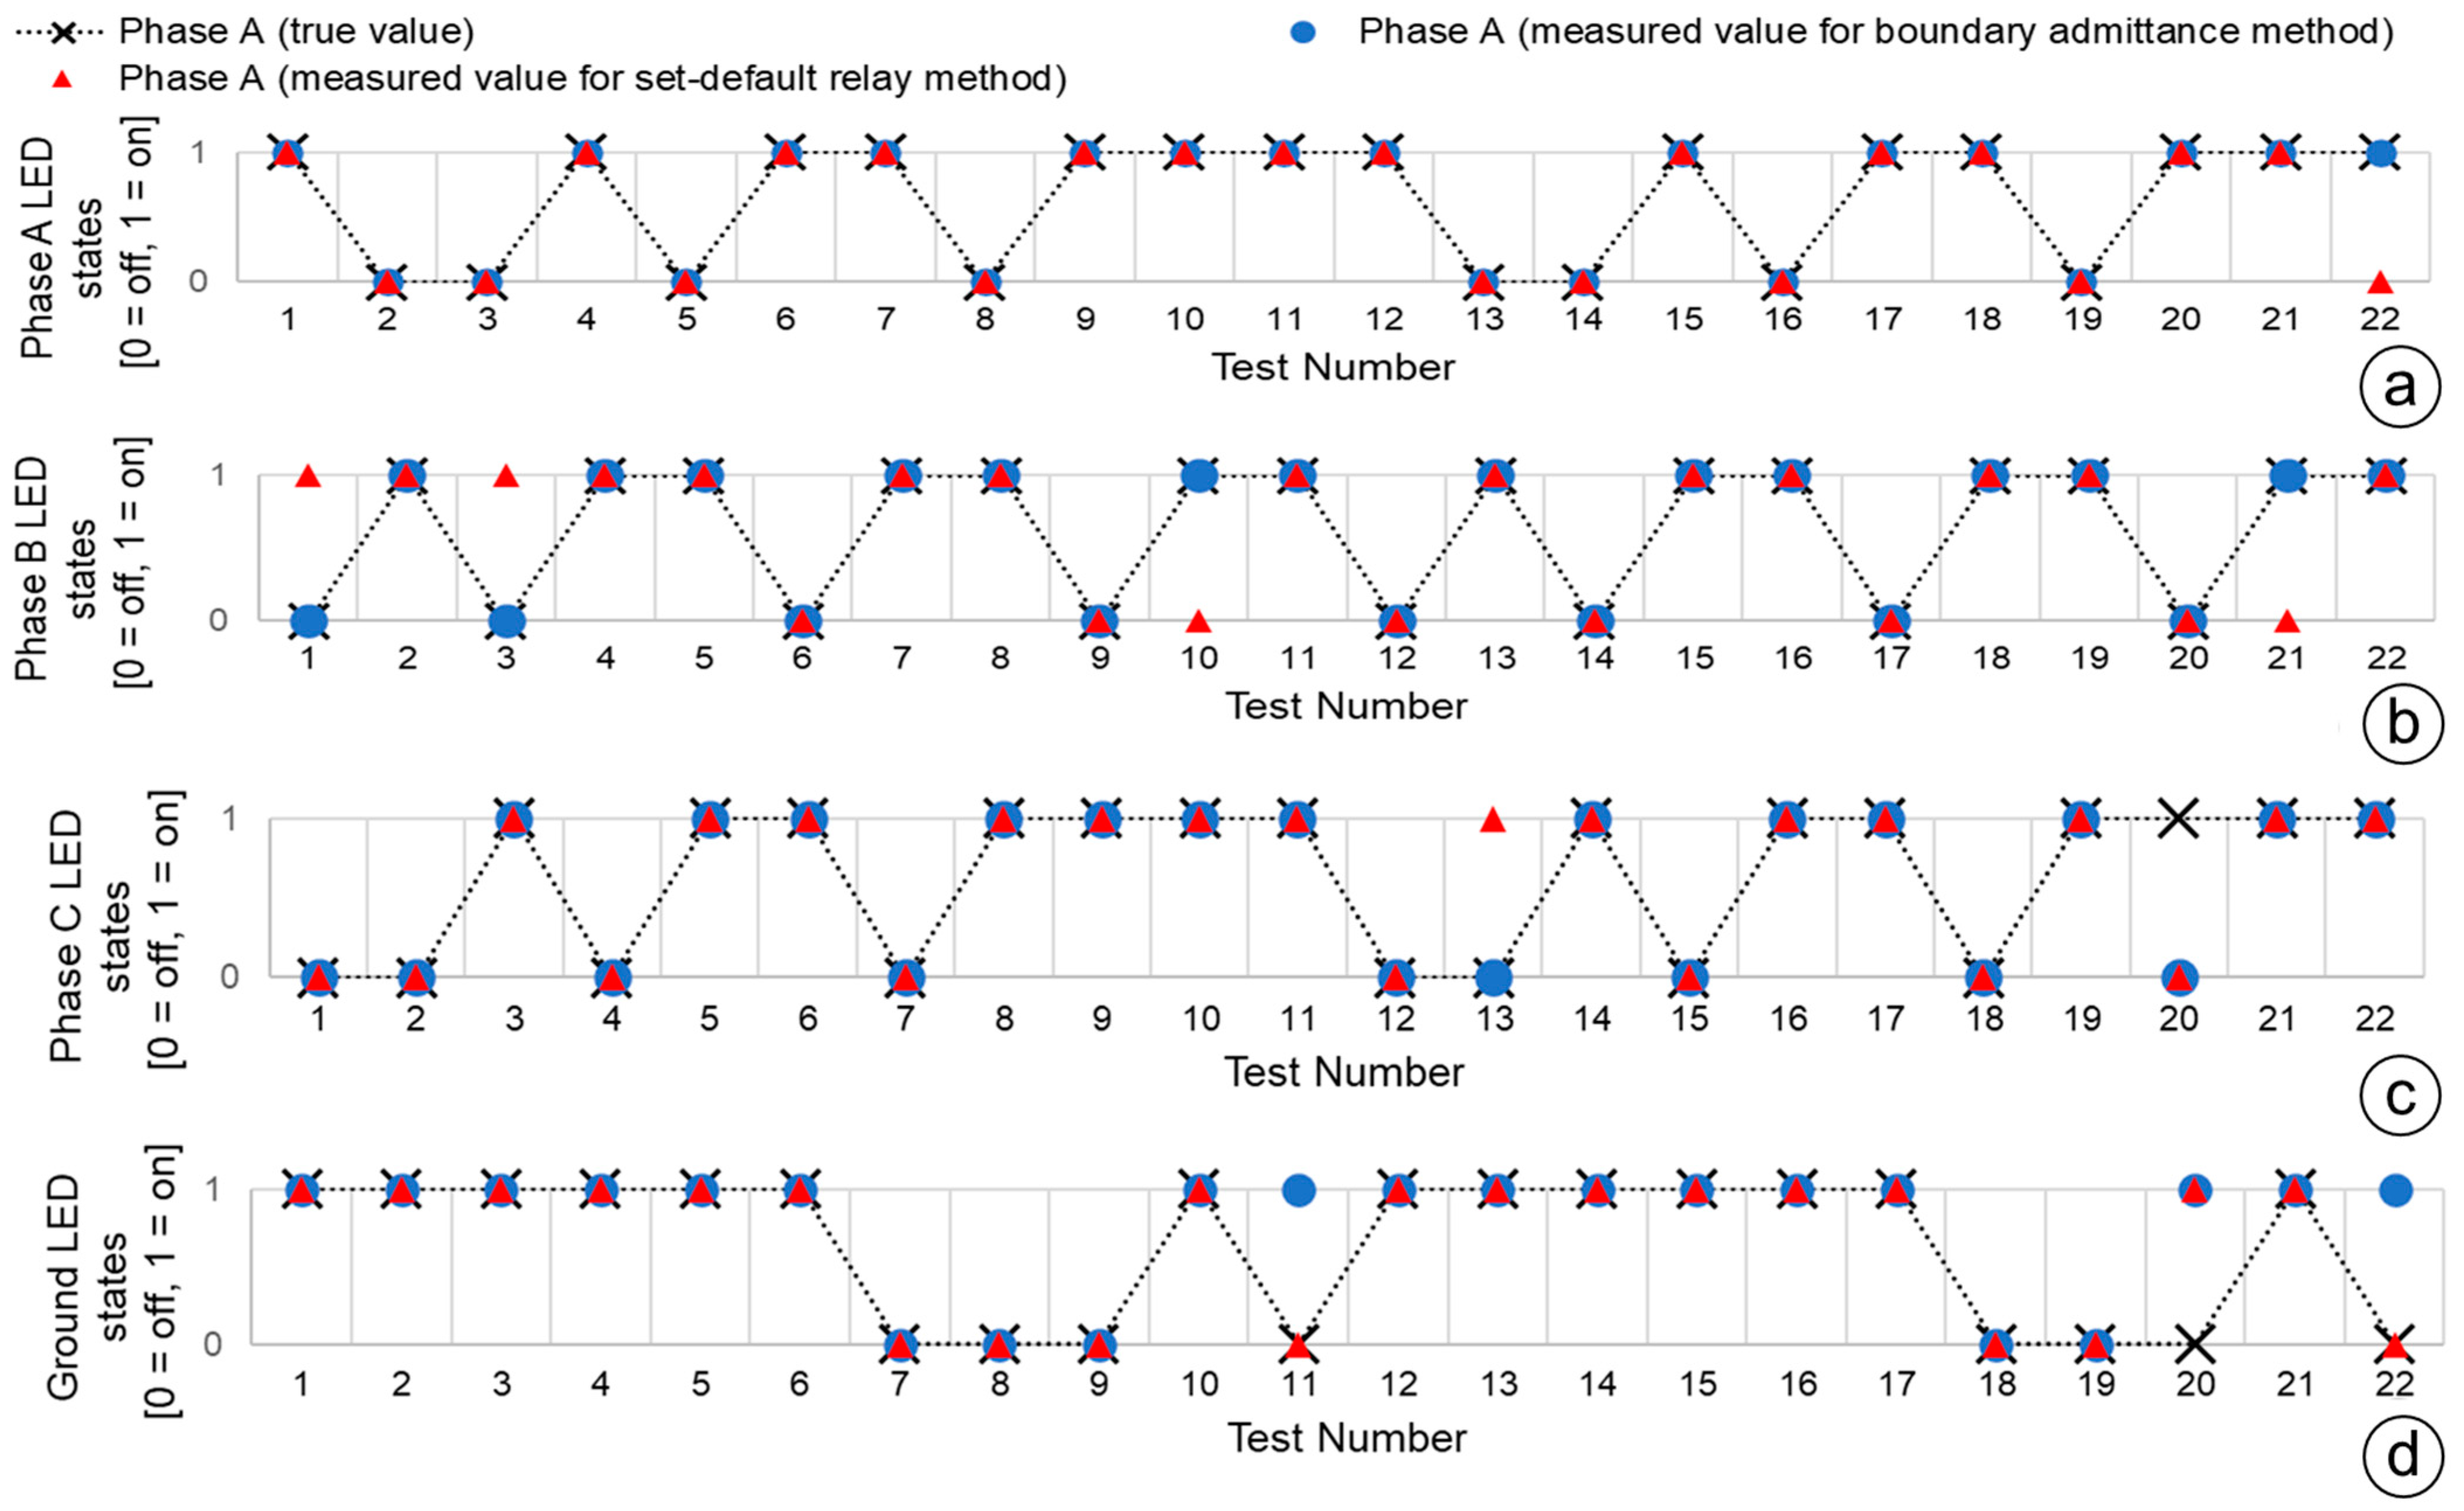
The results for the phase (A, B, C) and ground LEDs from Table 3 are plotted in Figure 9. The true and measured values for the phase and ground LEDs were compared to see how they matched for both the set-default relay method and boundary admittance method. Black cross dots represent the true values, and blue and red dots represent the measured values for the boundary admittance and set-default relay methods, respectively. The phase (A, B, C) and ground true values versus the measured values are shown in Figure 9a, Figure 9b, Figure 9c, and Figure 9d, respectively.
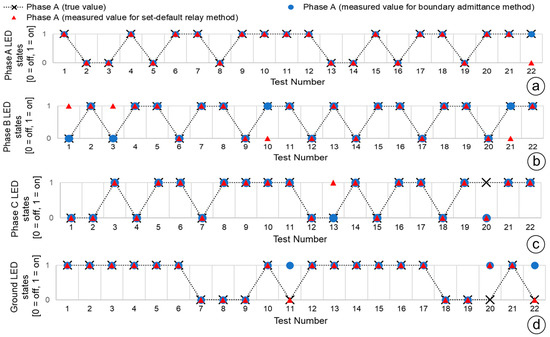
Figure 9.
Phases A (a), B (b), and C (c) and ground (d) true values versus measured values.
The accuracy of each test result shows how close a measured value is to the true value based on percentage accuracy calculation; therefore, the percentage accuracy can be defined as the ratio of the difference between the true and measured value to the true value [39]. The percentage accuracy of the phase (A, B, C) and ground LED states for the boundary admittance method and the set-default relay method can be calculated with Equations (10) and (11), respectively.
where Accuracy% BAM LEDn is the percentage accuracy of the boundary admittance method for the phase and ground LEDs, TVLEDn is the number of true values for the phase and ground LEDs, MV BAM LEDn is the number of measured values matching with the true values of the boundary admittance method for the phase and ground LEDs, and nth is the phase (A, B, C) and ground LEDs.
where Accuracy% SDRMLEDn is the percentage accuracy of the set-default relay method for the phase and ground LEDs, TVLEDn is the number of true values for the phase and ground LEDs, MV SDRMLEDn is the number of measured values matching with the true values of the set-default relay method for the phase and ground LEDs, and nth is the phase (A, B, C) and ground LEDs.
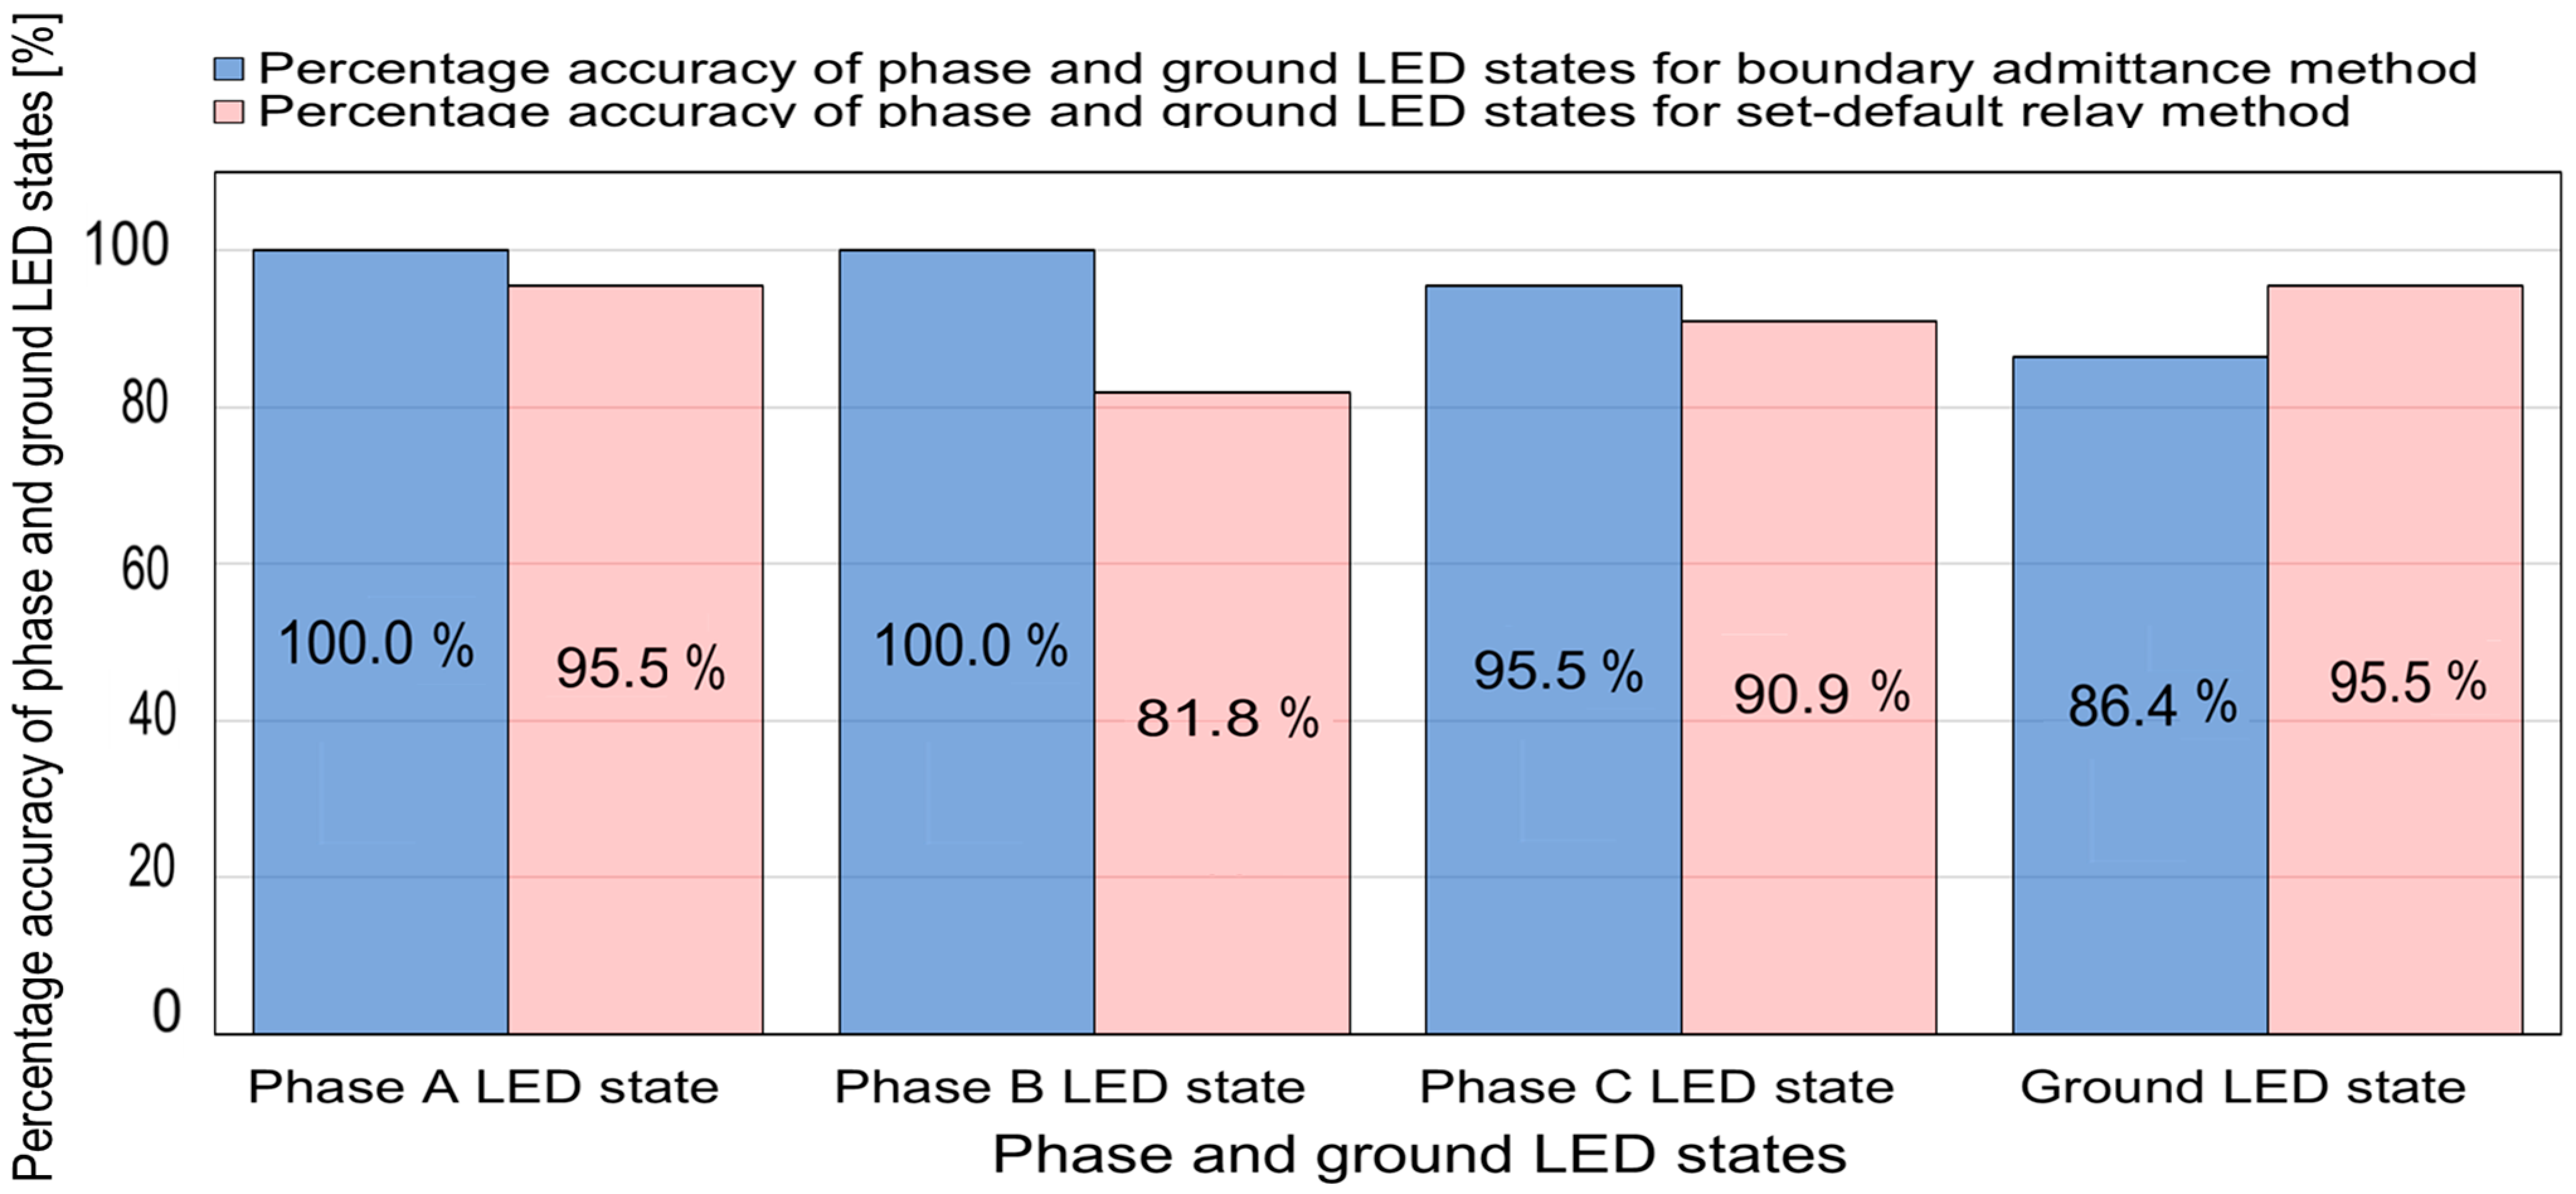
Based on Figure 9a,d, the number of measured values matching the true values for the boundary admittance method and the set-default relay method in the phase (A, B, C) and ground states are shown in Table 4. The percentage accuracy of the boundary admittance method and the set-default relay method for the phase and ground LEDs states was calculated with Equations (10) and (11), respectively, using the results from Table 4. Figure 10 shows the percentage accuracy of the phase (A, B, C) and ground states for the boundary admittance method and the set-default relay method.
Table 4.
True and measured phase and ground states for the electrical fault tests.
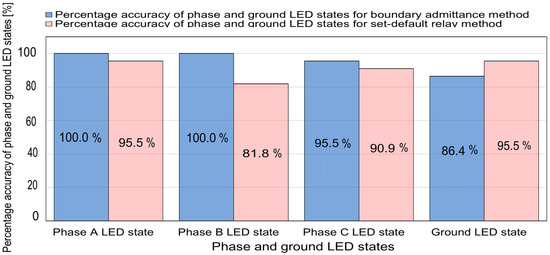
Figure 10.
Percentage accuracy of the phase (A, B, C) and ground states for the boundary admittance method and the set-default relay method.
4.3. Analysis of the Measured Electrical Fault Types
The measured and true electrical fault type states presented in Table 3 allowed us to build Table 5. The number of electrical fault types for which the measured values matched the true values with the boundary admittance method and the set-default relay method is shown in Table 5.
Table 5.
True and measured values for the types of electrical fault tests (from Table 3).
LG: line-to-ground; LLG: line-to-line ground; LL: line-to-line; 3L/3LG: three-line/three-line-to-ground.
From Table 5, the percentage accuracy of the boundary admittance method and the set-default relay method for the electrical fault types could be computed with Equations (12) and (13), respectively.
where Accuracy% EFTBAMm is the percentage accuracy of the electrical fault types with the boundary admittance method, TVEFTm is the number of true electrical fault type values, MV BAMEFTm is the number of measured electrical fault type values matching the true electrical fault type values for the boundary admittance method, and mth is the electrical fault type.
where Accuracy% EFTsDRMm is the percentage accuracy of the electrical fault types for the set-default relay method, TVEFTm is the number of true electrical fault type values, MV SDRMEFTm is the number of measured electrical fault type values matching the true electrical fault type values for the set-default relay method, and mth is the electrical fault type.
Figure 11 shows the percentage accuracy of the types of electrical faults using the boundary admittance method and the set-default relay method, which was calculated using Table 5 and Equations (12) and (13).
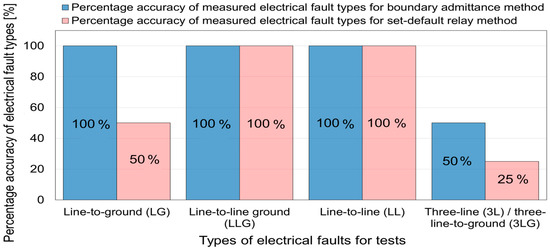
Figure 11.
Percentage accuracy of electrical fault types for the boundary admittance method and the set-default relay method.
5. Discussion
The relay misoperation analysis was based on comparing the boundary admittance method with the set-default relay method using the ASTDGT testbed. In Figure 10, the phase and ground LED states of the relays were measured satisfactorily for electrical fault types near to and far from the breaker site. The boundary admittance method performed well in the detection of the phase (A, B, C) and ground target LEDs (blue bars in Figure 10). In Figure 11, the percentage accuracy of the electrical fault types for the boundary admittance method and the set-default relay method is plotted, and the boundary admittance method (blue bars in Figure 11) had a percentage accuracy of 100% for the detection of SLG, LLG, and LL electrical faults. For ABCG and ABC electrical fault tests (10, 11, 21, 22) in Table 3, the boundary admittance method always identified an ABCG electrical fault; here, the percentage accuracy was 50%. However, the set-default relay method identified one ABC electrical fault, so the percentage accuracy was 25%, as is shown in Figure 11 for 3L/3LG electrical faults.
The boundary admittance method used an external algorithm that was run with an RTS with a relay in the loop. This external algorithm is defined by the phase and ground boundaries (Equations (5) and (6)), which are estimated by collecting the sequence impedances of the power line sections and then calculating the total admittance (YT), and the total zero sequence admittance (YT0) for the electrical grid circuit. The set-default relay method does not need to calculate the pre-setting values, and it can be implemented at any location in the electrical grid (feeders, power transformers, power lines, generators, etc.). The set-default relay method is only based on the A, B, and C phase and ground target LED settings with internal relay logic.
Based on a literature review, using the sequence method [10] to identify faulted phases with the target LEDs in relays had the same performance for AG/BCG, CG/ABG, and BG/CAG faults [10]. However, the boundary admittance method did not differentiate between ABC and ABCG faults. But LG and LLG faults are usually more frequent than 3LG faults in power grids. Based on Figure 11, the boundary admittance method is expected to perform better than the sequence method [10] and the set-default relay method assessed in this study. Also, the sequence method [10] has the advantage of not requiring additional settings, as opposed to the boundary admittance method, which requires the sequence impedance of the power line sections.
It is common practice for electrical engineers to record and plot events after an electrical fault to observe the incident in detail because relays sometimes cannot immediately identify electrical fault types with their light indicators. However, an accurate and fast visual report of electrical fault types from target LEDs could lead to a quick decision after a fault situation in implementing a pre-setting electrical fault type detection method with an external algorithm, like the presented boundary admittance method.
The ASTDGT testbed showed the relay control inputs to be a good interface for integrating an external relay algorithm (like the boundary admittance) run with an RTS because practically no delay time was observed in the signals. These external algorithms for advanced protection functions could be applied with an RTS using time steps of 50 us to implement a fast calculation process in control grid operations. Also, the relays’ analog signals from the low-voltage level interface could easily be connected with tee connectors from the relays to an RTS to implement external relay algorithms using the relays’ current and voltage scaling factors and the relays be wired to the RTS [40]. If the relay’s current and voltage scaling factors are not available in the relay manual, they could be estimated using an interface method to find low-voltage interfaces [41].
Power system protection engineers frequently use commercial relay test systems [36,37,38] to commission possible relay misoperations caused by incorrect and/or out-of-date relay settings. These commercial relay test systems usually test one relay in the loop, and they are enabled by a three-phase current/voltage power source that feeds the relay’s analog signals. The relay test systems generate the pre-fault, fault, and post-fault states with breaker pole state sequences and trip/close signals to assess the relay settings and programmed logic (algorithms) during electrical fault tests. In this study, an ASTDGT testbed with an RTS and paired relays was presented (Figure 3). It was based on a synchronized time digital grid twin testbed to compare the boundary admittance method (external algorithm) with the set-default relay method (internal algorithm). The novelties of the ASTDGT testbed are as follows:
- Main novelty: The ASTDGT testbed method was created to evaluate external relay algorithms because no specific standards are available for testing external relay algorithms; therefore, the ASTDGT testbed’s main contribution was focused on comparing the test results for the boundary admittance method (external algorithm) to those for the set-default relay method (internal algorithm) to assess an external relay algorithm for detecting electrical fault types.
- A platform with complex grids and high sampling frequencies: The ASTDGT testbed (Figure 3) has a digital grid twin circuit (Figure 6) created with an RTS and a time step of 50 us (sampling frequency of 20 kHz). The digital grid twin circuit is formed of breakers, power line sections, capacitor banks, and source models from MATLAB/Simulink (Figure 6), offering a realistic simulation approach for electrical fault scenarios and relays with high sampling frequencies greater than 3 kHz. Thus, the ASTDGT testbed presents a better simulation approach than commercial relay test systems [36,37,38], which are formed with one three-phase voltage/current source that cannot implement complex electrical grids and has a frequency limitation of 3 kHz [42].
- A digital grid twin to commission relays with synchronized time stamps: The ASTDGT testbed (Figure 3) can commission internal and external relay algorithms at the same time with multiple relays. In this case, two identical relays were used to evaluate the set-default relay method (internal algorithm) and the boundary admittance method (external algorithm) using a digital grid twin circuit (Figure 6) and a synchronized time source system (Figure 3) to evaluate the event behavior for both relays with the same time stamps.
- The application of time domain external relay algorithms: The ASTDGT implements the boundary admittance algorithm (Figure 3c), formed of an external relay algorithm (Figure 7) in an RTS. The implementation of this external relay algorithm using an RTS could be a great tool for integration with relays in the field in the future, considering RTSs are based on a time domain process with a time step of 50 us, which could speed the relay’s decisions up in some critical situations, such as the operation of breakers for inverter-based DERs.
6. Conclusions
The ASTDGT testbed assessed relay misoperations based on using an internal and external relay algorithm. The ASTDGT testbed with paired relays evaluated two different electrical fault detection algorithms with a synchronized time source, and the event behavior for both relays was analyzed and plotted. The boundary admittance method (external algorithm) presented good performance using the relay’s control inputs, with observation of the electrical fault types based on the relay’s front side light indicators and involving no delay time in the application of the external algorithm with the RTS.
The boundary admittance method (external algorithm) and the set-default (internal algorithm) relay method were assessed for detecting electrical fault types near to and far away from the relay’s breaker location. The electrical fault tests were performed with the ASTDGT testbed, and the boundary admittance method was 100% accurate in the detection of LG, LL, and LLG electrical faults. Also, the application of the time domain process (time step of 50 us) in the boundary admittance (external algorithm) method with the RTS and the relay in the loop had a good time response in detecting the electrical fault types.
In the future, the ASTDGT testbed will be upgraded with high-sampling-frequency relays and meters integrated with external algorithms using advanced protection schemes for inverter-based DERs.
Author Contributions
Conceptualization, E.C.P. and M.J.R.; methodology, E.C.P. and M.F.M.; validation, E.C.P.; formal analysis, E.C.P., M.J.R. and A.K.S.; investigation, E.C.P. and M.F.M.; resources, E.C.P. and M.J.R.; writing—original draft preparation, E.C.P.; writing—review and editing, M.J.R., A.K.S., and M.F.M.; visualization, E.C.P. and M.F.M.; supervision, E.C.P. and M.J.R. All authors have read and agreed to the published version of the manuscript.
Funding
This research was made possible by funding from the US Department of Energy’s Office of Electricity.
Data Availability Statement
The raw data supporting the conclusions of this article will be made available by the authors on request.
Conflicts of Interest
This manuscript was authored by UT-Battelle, LLC, under contract DE-AC05-00OR22725 and employees of National Technology & Engineering Solutions of Sandia, LLC under contract no. DE-NA0003525 with the US Department of Energy (DOE). The UT-Battelle, LLC and Sandia, LLC, employees own all rights, titles, and interests pertaining to the article and are solely responsible for its contents. The US government retains and the publisher, by accepting this article for publication, acknowledges that the U.S. government retains a non-exclusive, paid-up, irrevocable, worldwide license to publish or reproduce the published form of this manuscript or to allow others to do so for US government purposes. DOE will provide public access to these results of federally sponsored research in accordance with the DOE Public Access Plan; http://energy.gov/downloads/doe-public-access-plan) (accessed on 21 June 2024).
References
- Jagadeesan Nair, V.; Venkataramanan, V.; Haider, R.; Annaswamy, A.M. A Hierarchical Local Electricity Market for a DER-Rich Grid Edge. IEEE Trans. Smart Grid 2022, 14, 1353–1366. [Google Scholar] [CrossRef]
- Memon, A.A.; Karimi, M.; Kauhaniemi, K. Evaluation of New Grid Codes for Converter-Based DERs from the Perspective of AC Microgrid Protection. IEEE Access 2022, 10, 127005–127030. [Google Scholar] [CrossRef]
- Chapagain, P.; Culler, M.; Ishchenko, D.; Valdes, A. Stability Impact of IEEE 1547 Operational Mode Changes under High DER Penetration in the Presence of Cyber Adversary. In Proceedings of the 2021 IEEE Green Technologies Conference, Denver, CO, USA, 7–9 April 2021; pp. 67–74. [Google Scholar] [CrossRef]
- Ravi, A.; Bai, L.; Cecchi, V.; Ding, F. Stochastic Strategic Participation of Active Distribution Networks with High-Penetration DERs in Wholesale Electricity Markets. IEEE Trans. Smart Grid 2022, 14, 1515–1527. [Google Scholar] [CrossRef]
- PRC-004.6; Protection System Misoperation Identification and Correction. North American Electric Reliability Corporation: Atlanta, GA, USA, 2019; pp. 1–32. Available online: https://www.nerc.com/pa/Stand/Reliability%20Standards/PRC-004-6.pdf (accessed on 17 July 2024).
- Bian, J.J.; Slone, A.D.; Tatro, P.J. Protection system misoperation analysis. In Proceedings of the 2014 IEEE PES General Meeting, National Harbor, MD, USA, 27–31 July 2014; pp. 1–5. Available online: https://ieeexplore.ieee.org/document/6939488 (accessed on 21 June 2024).
- Welton, D.; Knapek, W. Important Considerations for Testing and Commissioning Digital Protective Relays: Avoid Misoperations. IEEE Ind. Appl. Mag. 2019, 25, 24–28. Available online: https://ieeexplore.ieee.org/document/8691670 (accessed on 21 June 2024). [CrossRef]
- Hosseini, M.; Stephen, B.; McArthur, S.D.; Helm, J. Current Based Trip Coil Analysis of Circuit Breakers for Fault Diagnosis. In Proceedings of the 2018 IEEE PES Innovative Smart Grid Technologies Conference Europe, Sarajevo, Bosnia and Herzegovina, 21–25 October 2018; pp. 1–6. [Google Scholar] [CrossRef]
- Biswas, S.S.; Srivastava, A.K.; Whitehead, D. A Real-Time Data-Driven Algorithm for Health Diagnosis and Prognosis of a Circuit Breaker Trip Assembly. IEEE Trans. Ind. Electron. 2014, 62, 3822–3831. [Google Scholar] [CrossRef]
- Kasztenny, B.; Mynam, M.V.; Fischer, N. Sequence Component Applications in Protective Relays—Advantages, Limitations, and Solutions. In Proceedings of the 46th Annual Western Protective Relay Conference, Spokane, WA, USA, 22–24 October 2019; pp. 1–23. Available online: https://selinc.com/api/download/125781/ (accessed on 17 July 2024).
- Costello, D.; Zimmerman, K. Determining the Faulted Phase. In Proceedings of the 63rd Annual Conference for Protective Relay Engineers, College Station, TX, USA, 29 March–1 April 2010; pp. 1–20. Available online: https://selinc.com/api/download/6381/ (accessed on 17 July 2024).
- Zimmerman, B.; Costello, D. Impedance-Based Fault Location Experience. SEL J. Reliab. Power 2010, 1, 1–28. Available online: https://selinc.com/api/download/4912 (accessed on 17 July 2024).
- C37.113-2015; IEEE Guide for Protective Relay Applications to Transmission Lines. IEEE: Piscataway, NJ, USA, 2016. Available online: https://standards.ieee.org/standard/C37_113-2015.html (accessed on 21 June 2024).
- Fentie, D.D. Understanding the Dynamic Mho Distance Characteristic. In Proceedings of the 69th Annual Conference for Protective Relay Engineers, College Station, TX, USA, 4–7 April 2016; pp. 1–15. [Google Scholar] [CrossRef]
- C37.2-2008; IEEE Standard Electrical Power System Device Function Numbers, Acronyms, and Contact Designations. IEEE: Piscataway, NJ, USA, 2008. Available online: https://standards.ieee.org/standard/C37_2-2008.html (accessed on 17 July 2024).
- Godoy, E.; Celaya, A.; Altuve, H.J.; Fischer, N.; Guzmán, A. Tutorial on Single-Pole Tripping and Reclosing. In Proceedings of the 39th Annual Western Protective Relay Conference, Spokane, WA, USA, 16–18 October 2012; pp. 1–21. [Google Scholar]
- Haleem, A.M.; Sharma, M.; Sajan, K.; Babu, K.D. A Comparative Review of Fault Location/Identification Methods in Distribution Networks. In Proceedings of the 2018 1st International Conference on Advanced Research in Engineering Sciences, Dubai, United Arab Emirates, 7–9 January 2018; pp. 1–6. [Google Scholar] [CrossRef]
- SEL-451-5 Protection, Automation, and Bay Control System Instruction Manual. 2017. Available online: https://selinc.com/products/451/docs/ (accessed on 17 July 2024).
- Wang, L. The Fault Causes of Overhead Lines in Distribution Network. MATEC Web Conf. 2016, 61, 02017. [Google Scholar] [CrossRef]
- Liu, P.; Huang, C. Detecting Single-Phase-to-Ground Fault Event and Identifying Faulty Feeder in Neutral Inefectively Grounded Distribution System. IEEE Trans. Power Deliv. 2017, 33, 2265–2273. [Google Scholar] [CrossRef]
- SPAJ 142 C Overcurrent and Earth-Fault Relay, User’s Manual and Technical Description, ABB. 2002. Available online: https://library.e.abb.com/public/b3cb5ff579b5707dc2256bf1002cfb67/FM_SPAJ142C_EN_BAC.pdf (accessed on 17 July 2024).
- Piesciorovsky, E.C.; Smith, T.; Ollis, T.B. Protection schemes used in North American microgrids. Int. Trans. Electr. Energy Syst. 2020, 30, e12461. [Google Scholar] [CrossRef]
- Bo, Z.; Caunce, B.; Redfern, M.; Dong, X. Under Voltage Accelerated Protection of Single Source Distribution Systems. In Proceedings of the 2003 IEEE Power Engineering Society General Meeting, Toronto, ON, Canada, 13–17 July 2003; pp. 2066–2071. [Google Scholar] [CrossRef]
- Liang, X.; Wallace, S.A.; Nguyen, D. Rule-Based Data-Driven Analytics for Wide-Area Fault Detection Using Synchrophasor Data. IEEE Trans. Ind. Appl. 2016, 53, 1789–1798. [Google Scholar] [CrossRef]
- Alstom Grid Worldwide Contact Centre. Distance Protection. In Network Protection & Automation Guide; Alstom Grid: Paris, France, 2022; Chapter 11; pp. 171–191. [Google Scholar]
- Wilkinson, S.B.; Mathews, C.A. Dynamic Characteristics of Mho Distance Relays, GE Power Management, GER-3742. Available online: https://www.gegridsolutions.com/products/applications/ger3742.pdf (accessed on 17 July 2024).
- Roberts, J.; Guzman, A. Schweitzer III EO, Z = V/I Does Not Make a Distance Relay. In Proceedings of the 48th Annual Georgia Tech Protective Relaying Conference, Atlanta, GA, USA, 9–21 October 1994; pp. 1–20. Available online: https://selinc.com/api/download/2429?id=2429 (accessed on 17 July 2024).
- Piesciorovsky, E.C.; Morales Rodriguez, M.E. Assessment of the Phase-to-Ground Fault Apparent Admittance Method with Phase/Ground Boundaries to Detect Types of Electrical Faults for Protective Relays Using Signature Library and Simulated Events. Int. Trans. Electr. Energy Syst. 2022, 2022, 1951836. [Google Scholar] [CrossRef]
- Jeong, D.-Y.; Baek, M.-S.; Lim, T.-B.; Kim, Y.-W.; Kim, S.-H.; Lee, Y.-T.; Jung, W.-S.; Lee, I.-B. Digital Twin: Technology Evolution Stages and Implementation Layers With Technology Elements. IEEE Access 2022, 10, 52609–52620. [Google Scholar] [CrossRef]
- Jamakatel, P.; Eberhardt, M.; Kerber, F. Development of a Toolchain for Automated Optical 3D Metrology Tasks. Metrology 2022, 2, 274–292. [Google Scholar] [CrossRef]
- Scholz, G.; Fortmeier, I.; Marschall, M.; Stavridis, M.; Schulz, M.; Elster, C. Experimental Design for Virtual Experiments in Tilted-Wave Interferometry. Metrology 2022, 2, 84–97. [Google Scholar] [CrossRef]
- Vlaeyen, M.; Haitjema, H.; Dewulf, W. Uncertainty-Based Autonomous Path Planning for Laser Line Scanners. Metrology 2022, 2, 479–494. [Google Scholar] [CrossRef]
- Straka, M.; Weissenbrunner, A.; Koglin, C.; Höhne, C.; Schmelter, S. Simulation Uncertainty for a Virtual Ultrasonic Flow Meter. Metrology 2022, 2, 335–359. [Google Scholar] [CrossRef]
- Lindqvist, R.P.; Strand, D.; Nilsson, M.; Collins, V.; Torstensson, J.; Kressin, J.; Spensieri, D.; Archenti, A. 3D Model-Based Large-Volume Metrology Supporting Smart Manufacturing and Digital Twin Concepts. Metrology 2023, 3, 29–64. [Google Scholar] [CrossRef]
- Barbie, A.; Hasselbring, W. From Digital Twins to Digital Twin Prototypes: Concepts, Formalization, and Applications. IEEE Access 2024, 12, 75337–75365. [Google Scholar] [CrossRef]
- F6000 Family of Power System Simulators User Guide, Doble Engineering Company, 2001, 72A-1589 Rev. C. Available online: https://www.trs-rentelco.com/Specs-Manuals/Doble-F6000-Series-Users-Guide-5121.pdf (accessed on 17 July 2024).
- CMC 356 User Manual, Omicron® Electronics. 2020. Available online: https://pesvs.com.au/wp-content/uploads/2022/05/CMC-356-User-Manual.pdf (accessed on 17 July 2024).
- MTS-5100 Protective Relay Test System User Manual, Manta Test Systems, First Edition. 2012. Available online: https://www.doble.com/wp-content/uploads/MTS-5100_User_Manual.pdf (accessed on 17 July 2024).
- Percentage Accuracy Calculator Weblink, Calculator Academy Team. Available online: https://calculator.academy/percentage-accuracy-calculator/ (accessed on 17 July 2024).
- Piesciorovsky, E.C.; Borges Hink, R.; Werth, A.; Hahn, G.; Lee, A.; Polsky, Y. Assessment and Commissioning of Electrical Substation Grid Testbed with a Real-Time Simulator and Protective Relays/Power Meters in the Loop. Energies 2023, 16, 4407. [Google Scholar] [CrossRef]
- Piesciorovsky, E.C.; Smith, T.; Mukherjee, S.K.; Marshall, M.W. A generic method for interfacing IEDs using low voltage interfaces to real-time simulators with hardware in the loop. Electr. Power Syst. Res. 2021, 199, 107431. [Google Scholar] [CrossRef]
- Piesciorovsky, E.C.; Karnowski, T. Variable Frequency Response Testbed to Validate Protective Relays up to 20 kHz. Electr. Power Syst. Res. 2021, 194, 107071. [Google Scholar] [CrossRef]


Disclaimer/Publisher’s Note: The statements, opinions and data contained in all publications are solely those of the individual author(s) and contributor(s) and not of MDPI and/or the editor(s). MDPI and/or the editor(s) disclaim responsibility for any injury to people or property resulting from any ideas, methods, instructions or products referred to in the content. |
© 2024 by the authors. Licensee MDPI, Basel, Switzerland. This article is an open access article distributed under the terms and conditions of the Creative Commons Attribution (CC BY) license (https://creativecommons.org/licenses/by/4.0/).