Abstract
This research investigates the influence of printing parameters and different materials on the geometrical and dimensional deviations of Fused Deposition Modelling (FDM) additive manufacturing. Using the Taguchi method, experiments with four factors are designed: print layer height, printing material, printing speed, and nozzle size, employing an L9 orthogonal array. Deviations in flatness, perpendicularity, parallelism, cylindricity, spherical form, and surface roughness of 3D-printed parts are evaluated. The results reveal that print speed and nozzle size significantly affect flatness and surface roughness, while layer height and material influence perpendicularity and parallelism deviations. Notably, nozzle size critically impacts cylindricity and spherical form deviations. Our study demonstrates that lower printing speed, smaller nozzle diameter, and reduced layer height are not universally optimal; instead, parameter adjustments based on specific geometrical requirements and part orientation are necessary. These findings are essential for improving the accuracy and quality of FDM-printed parts, supporting their broader application in precision manufacturing industries.
1. Introduction
Fused Deposition Modelling (FDM) additive manufacturing, or more popularly known as 3D printing, is a technology that plays a crucial role in achieving low-cost functional parts, particularly in lot size one production or prototype fabrication. This method’s ability to produce intricate geometries with relatively low-cost equipment has made it a cornerstone in the additive manufacturing landscape. However, ensuring high dimensional accuracy remains a critical challenge [1].
Geometrical and dimensional deviations in FDM are influenced by various factors such as slicing approaches, material selection, raster angles, and printing parameters. Studies have shown that the slicing strategy can contribute to dimensional inaccuracies [2], while polyethylene terephthalate glycol (PETG) materials tend to exhibit higher deviations compared to polylactic acid (PLA) and acrylonitrile butadiene styrene (ABS), with different raster angles affecting dimensional accuracy [3]. Additionally, the selection of printing parameters like layer height and infill density significantly impacts the length, width, height, and angle deviations of printed parts in FDM technology [4]. To address these challenges, advanced methods like the iterative closest point (ICP) algorithm have been proposed to accurately quantify geometric deviations without simplifying assumptions, enhancing the versatility of shape deviation quantification in additive manufacturing processes [5].
Existing research emphasizes the importance of optimizing various FDM printing parameters, such as infill density, layer thickness, and the number of contours, to enhance dimensional precision [6,7]. These parameters significantly influence the mechanical properties and accuracy of the printed parts, necessitating meticulous adjustment to meet specific manufacturing requirements [8,9,10].
Another crucial factor impacting geometric accuracy is the control software used in the printing process. Studies have demonstrated notable differences between proprietary and universal software solutions regarding print quality and dimensional deviations [11]. Proprietary software often provides tailored optimizations for specific printer models, while universal software offers broader compatibility at the potential cost of reduced precision.
The dimensional accuracy of FDM-printed parts is essential for ensuring product usability and overall quality. Recent advancements highlight the use of machine learning algorithms, such as Decision Trees, to predict dimensional variations and improve the consistency and quality of printed parts [12,13,14].
Geometrical and dimensional deviation prediction for FDM-manufactured parts is a critical aspect addressed in various research studies. Some studies have utilized machine learning models like Gaussian process regression (GPR), support vector machines (SVM), and artificial neural networks (ANN) to predict dimensional accuracy based on factors such as support spacing, layer thickness, and raster angle [15]. Additionally, 3D convolutional neural networks have been developed to predict and compensate for geometrical errors in FDM parts, significantly improving part quality by altering initial geometries based on predicted errors [16]. Other investigations are focused on developing a framework for evaluating the suitability of CAD models for AM, with a focus on aspects such as dimensional precision and part-specific challenges. These researchers [14,17] utilize machine learning methodology to forecast dimensional deviations at both the vertex and part levels in the produced object. By leveraging an artificial neural network (ANN), information from the model’s mesh vertices is processed to calculate the average error per vertex. This calculated error, in conjunction with other relevant data, is then employed to gauge the suitability of the model for specific AM technologies and intended uses.
These studies collectively highlight the importance of accurate prediction models in enhancing the quality and reliability of FDM additive manufacturing processes.
Currently, FDM is widely used for creating functional parts and prototypes, with a focus on enhancing their mechanical properties and wear resistance [18]. Existing research have explored various aspects to improve FDM-produced parts, such as investigating the impact of post-processing techniques like ironing on surface roughness [19], creating thermoplastic composites to add functional attributes like conductivity and radiation shielding [20], developing capability profiles to understand the mechanical properties of FDM parts and optimize manufacturing parameters [21], and experimenting with different infill patterns and layer stacking sequences to enhance tensile strength [22]. Additionally, studies have compared the wear performance of FDM-produced parts using different materials and filler types, highlighting the importance of material selection in achieving optimal wear resistance [23].
By optimizing printing parameters, selecting appropriate software, and accurately predicting dimensional variations, FDM technology can substantially improve geometrical and dimensional precision in additive manufacturing [24,25,26]. These advancements not only enhance the surface quality and functionality of 3D-printed parts, but also expand the applications of FDM in various industries, driving the technology towards more widespread and reliable usage in precision manufacturing.
2. Materials and Methods
2.1. Design of Experiment (DoE)
To systematically study the effects of various FDM printing parameters and materials on dimensional and geometrical accuracy, a Design of Experiment (DoE) was created using Minitab 20 software by employing the Taguchi method. The Taguchi method is a robust statistical approach designed to optimize the performance characteristics of a process by minimizing variation and identifying the most influential factors.
The Taguchi method utilizes orthogonal arrays to design experiments efficiently, allowing for the evaluation of multiple factors and their interactions with a minimal number of experiments. This method emphasizes robustness and quality by identifying optimal conditions that reduce the sensitivity of the system to variation.
For this study, four factors were selected, each at three levels, resulting in a comprehensive examination of their effects on FDM-printed parts. The factors and their respective levels are as follows.
The chosen parameters—layer height, material, print speed, and nozzle size—were prioritized to explore the combined effects of these particular factors on geometrical and dimensional deviations in 3D-printed parts. By focusing on these parameters, this study aims to fill a gap in the current body of knowledge, providing insights into how these specific factors interact to affect print quality. Future studies could build on this research by incorporating printing direction as a variable, particularly in less-geometrically complex parts where the orientation can be more systematically controlled.
Using the Taguchi method, an L9 orthogonal array was selected to accommodate the four factors and their levels, resulting in nine experimental runs. Each run combined different levels of the four factors to systematically investigate their influence on the desired outcomes, such as geometrical and dimensional accuracy and the surface finish of the printed parts.
By utilizing this structured approach, this study aims to identify the optimal combination of FDM printing parameters and different materials that yield the best performance in terms of accuracy and surface quality. The Taguchi method ensures that the results are not only optimal under controlled conditions, but are also resilient to variations in the manufacturing environment. This approach enables a thorough understanding of the parameters’ interactions and their effects, paving the way for more precise and reliable additive manufacturing processes.
Furthermore, in order to evaluate the surface quality, the Taguchi method was utilized, but in this case, an L27 orthogonal array was chosen which used the same factors as detailed in Table 1. For the experiment, 27 samples were fabricated, each with a parallelepipedal shape and dimensions of 50 mm × 100 mm × 5 mm. These samples were printed according to the combinations specified in the L27 orthogonal array, ensuring that each parameter combination (as shown in Table 2) was replicated three times to account for variability and to ensure trustworthy results.

Table 1.
The four AM factors used in the DoE for the Taguchi method.
Table 2.
Taguchi method, L9 orthogonal array.
Surface roughness measurements were performed at Continental Sibiu, using the MarSurf VD 140 roughness analyzer from Mahr, Göttingen, Germany equipped with a MarSurf BFW BFW A 10-45-2/90° probe arm. The specific inspection parameters used during the roughness analysis were as follows. Evaluation Length: 20 mm, which represents the total length of the surface over which the roughness measurement was conducted. Traverse Speed: 0.50 mm/s, the speed at which the probe traverses the surface during the measurement process. These measurement settings were chosen to ensure a comprehensive and accurate assessment of the surface roughness, focusing on the Ra (Arithmetic Average Roughness) and Rz (Maximum Height of Profile) parameters, which are critical indicators of the overall surface quality. By using this methodology, we aimed to isolate and understand the contributions each process parameter and different material had on the surface roughness, enabling us to draw conclusions about the optimal settings for achieving superior surface finishes in FDM-printed parts.
This study explores the deviations that arise in this context by employing a consistent methodology across all samples. Each specimen was fabricated with a uniform infill density of 15%, complemented by a wall thickness and a top/bottom thickness of 1.2 mm, utilizing a cubic infill pattern for structural integrity. Nozzle temperature was set as follows: PLA 205 °C; ABS 240 °C; PETG 235 °C. The fabrication process was conducted using the Snapmaker A350 3D printer at the Faculty of Engineering from Lucian Blaga University of Sibiu. The laboratory conditions were rigorously controlled with constant temperature and humidity level adjustments to exclude any environmental variables that could affect the results. The G-code, which dictates the printer’s movements and material extrusion, was generated using Snapmaker’s Luban software, version 4.5.1, ensuring that each sample was produced under equivalent digital instructions. The study’s integrity is based on the consistency of these parameters, except for the variables defined in Table 1.
2.2. Choice of 3D Part for Manufacturing
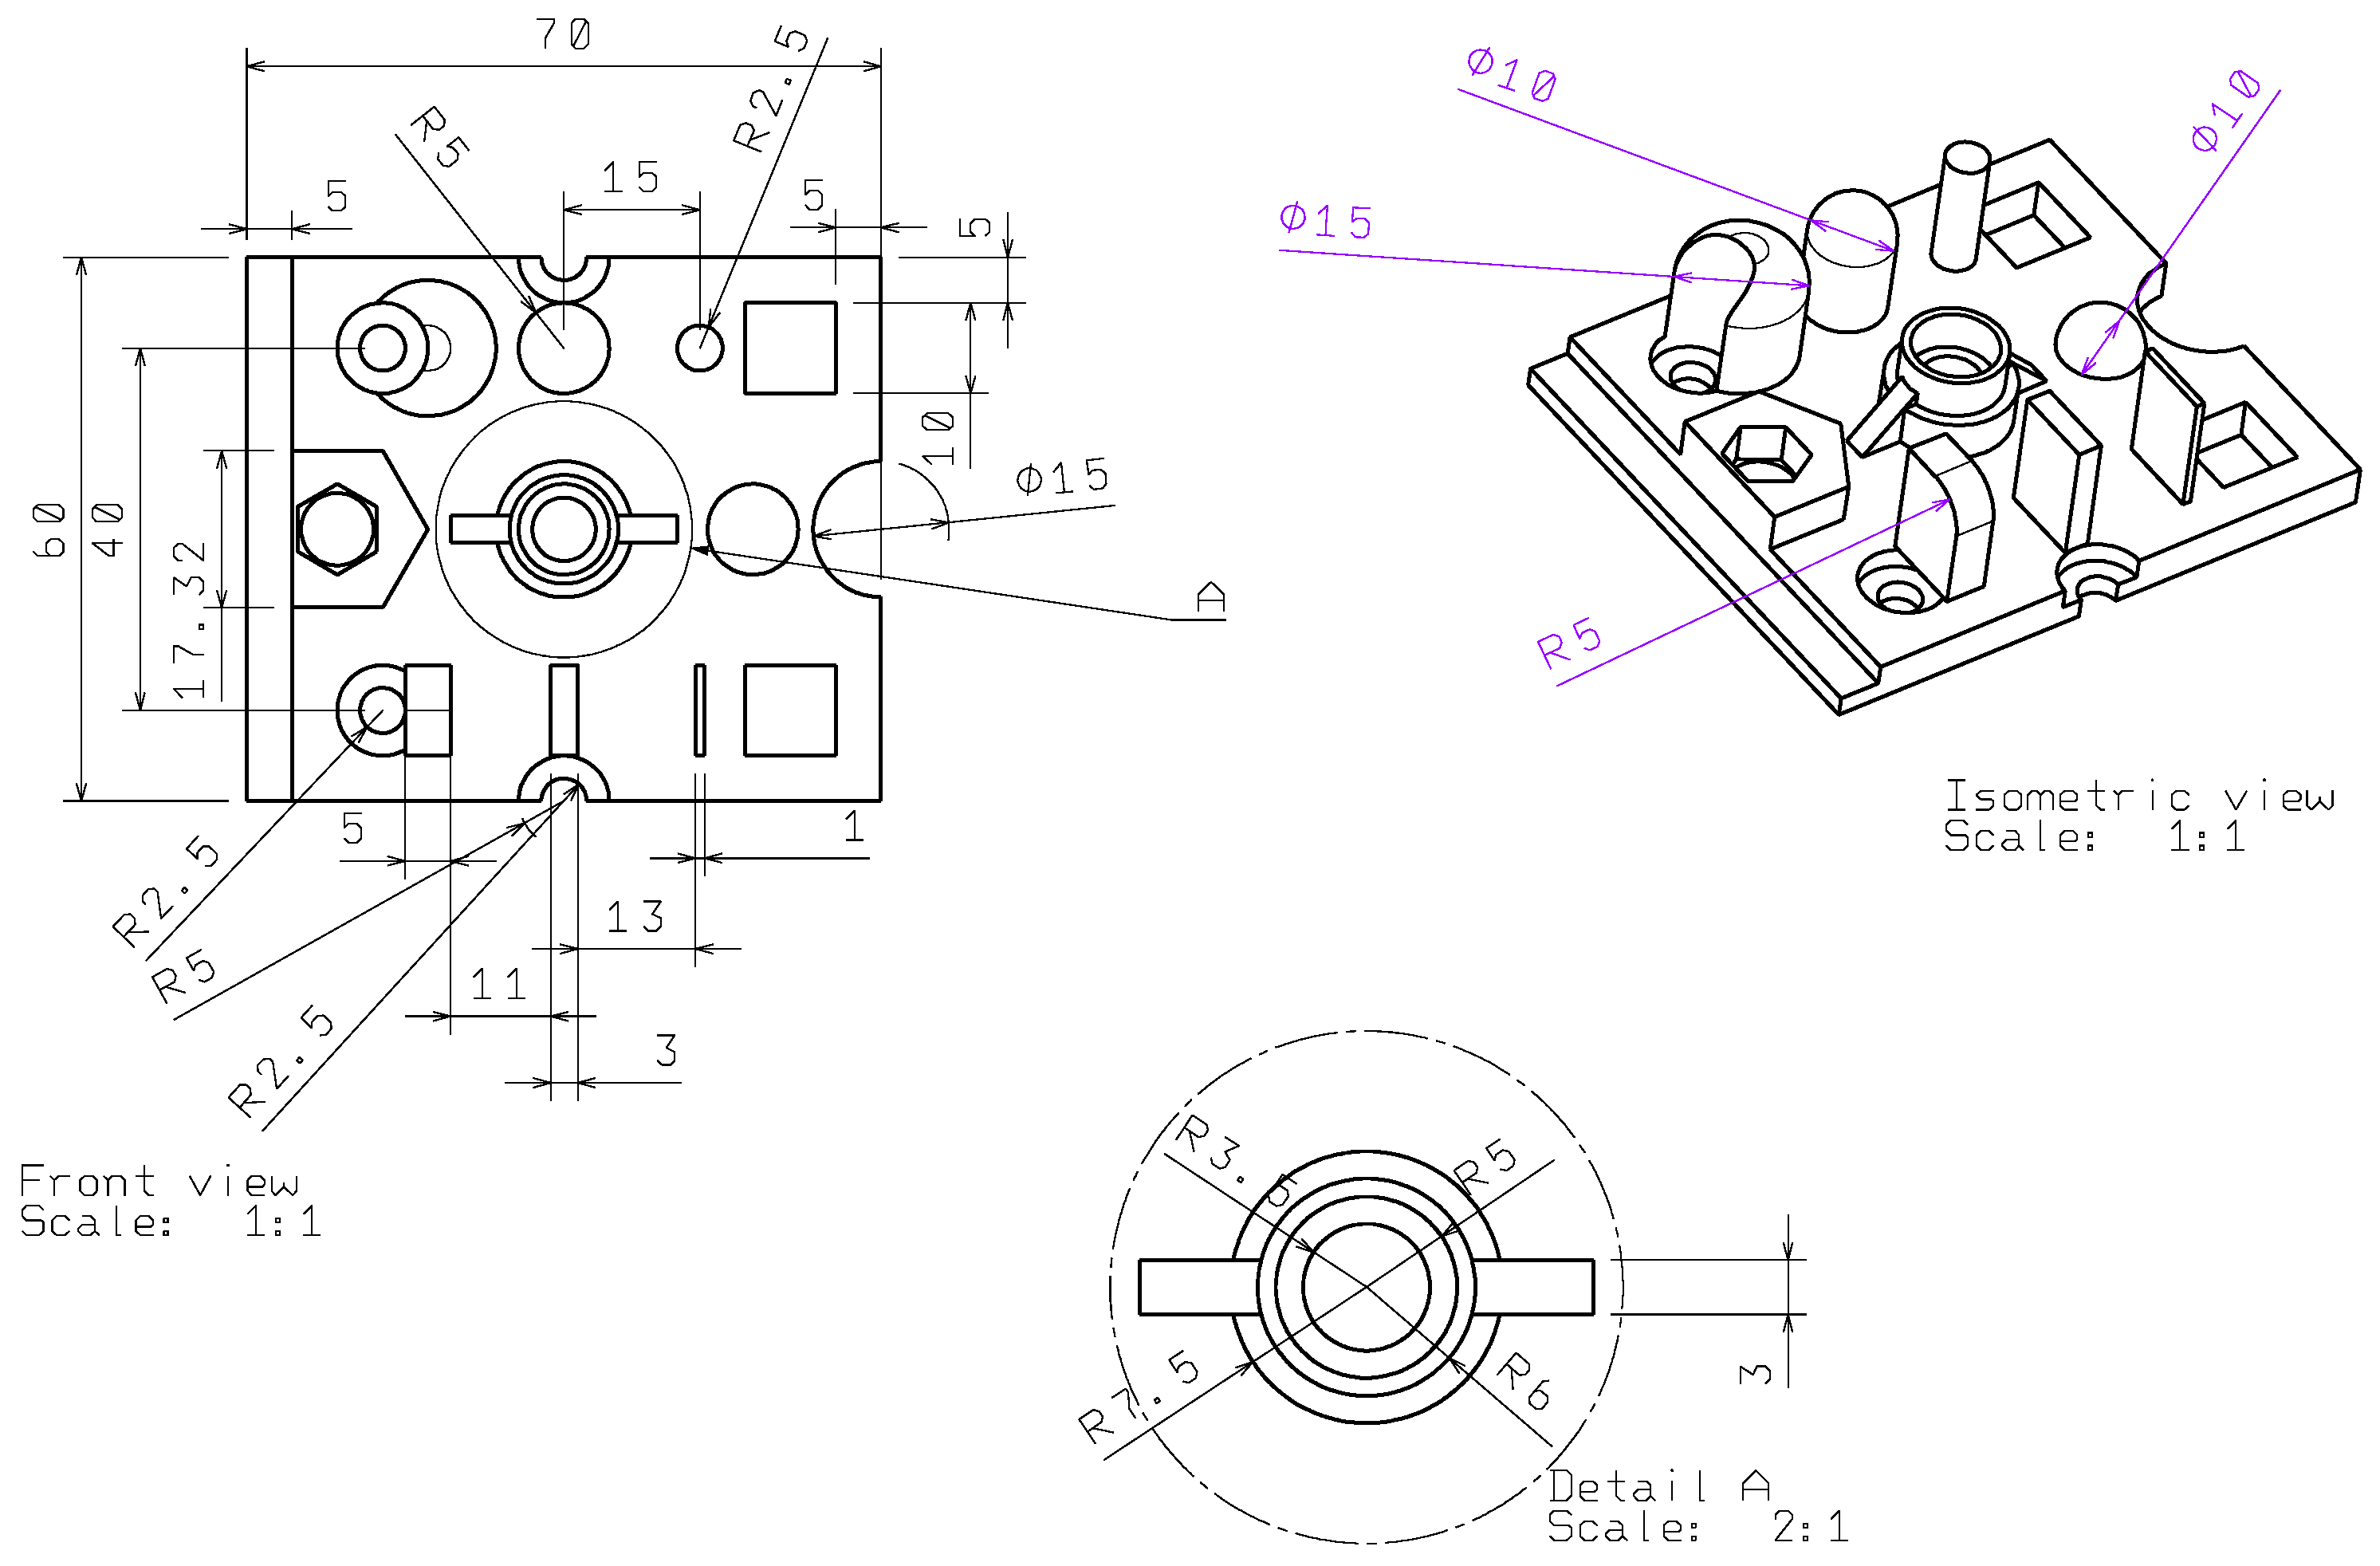
The selection of the 3D part to be manufactured using each configuration of the L9 Taguchi array was crucial for effectively measuring the impact of the chosen factors on dimensional and geometric accuracy. The part, specifically designed for this study, includes various basic geometrical entities such as cylinders, spheres, planar surfaces, pockets, and holes. This complexity allows for a comprehensive assessment of the printer’s performance across different shapes and features.
The chosen part’s design is represented in Figure 1 and incorporates elements specifically intended to measure different geometrical deviations, including the following:
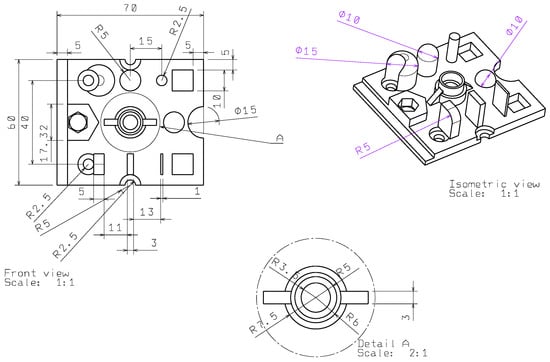
Figure 1.
Part to be manufactured using each configuration of the L9 Taguchi array.
- Flatness (form deviation): Measured on planar surfaces to evaluate how flat a printed surface is.
- Perpendicularity (orientation deviation): Assessed between different planes and surfaces to ensure accurate angles.
- Parallelism (orientation deviation): Measured between planes that should remain parallel.
- Cylindricity and spherical (form deviation): Evaluated on cylindrical features to check for deviations from a perfect cylinder.
Additionally, the part allows for the measurement of dimensional deviations such as size shape and size errors as follows:
- Location deviations: Position of the cylinders and the rectangular pockets.
- Dimensional deviation: Part total length and width.
This approach enables a detailed evaluation of the printer’s capability to produce parts within specified tolerances.
By using this specifically designed part, the study aims to capture a wide range of deviations and provide a detailed analysis of how different FDM printing parameters and materials affect the overall surface quality and precision of printed parts. The data collected from these measurements will contribute to identifying optimal printing conditions and in enhancing the reliability and accuracy of FDM processes in additive manufacturing.
2.3. Measurement Plan
To accurately assess the geometrical and dimensional deviations of the nine 3D-printed parts, a detailed measurement plan was developed utilizing a FARO Edge measuring arm and CAM2 Gage version 2.2.1 software. This plan involved defining two primary datum planes and establishing a reference system.
Datum Planes: Datum Plane A: Horizontal plane used as the primary reference. Datum Plane B: Vertical plane perpendicular to Datum Plane A, forming a reference corner.
Reference System: Located at the corner of the part where Datum Planes A and B intersect, providing a consistent starting point for all measurements.
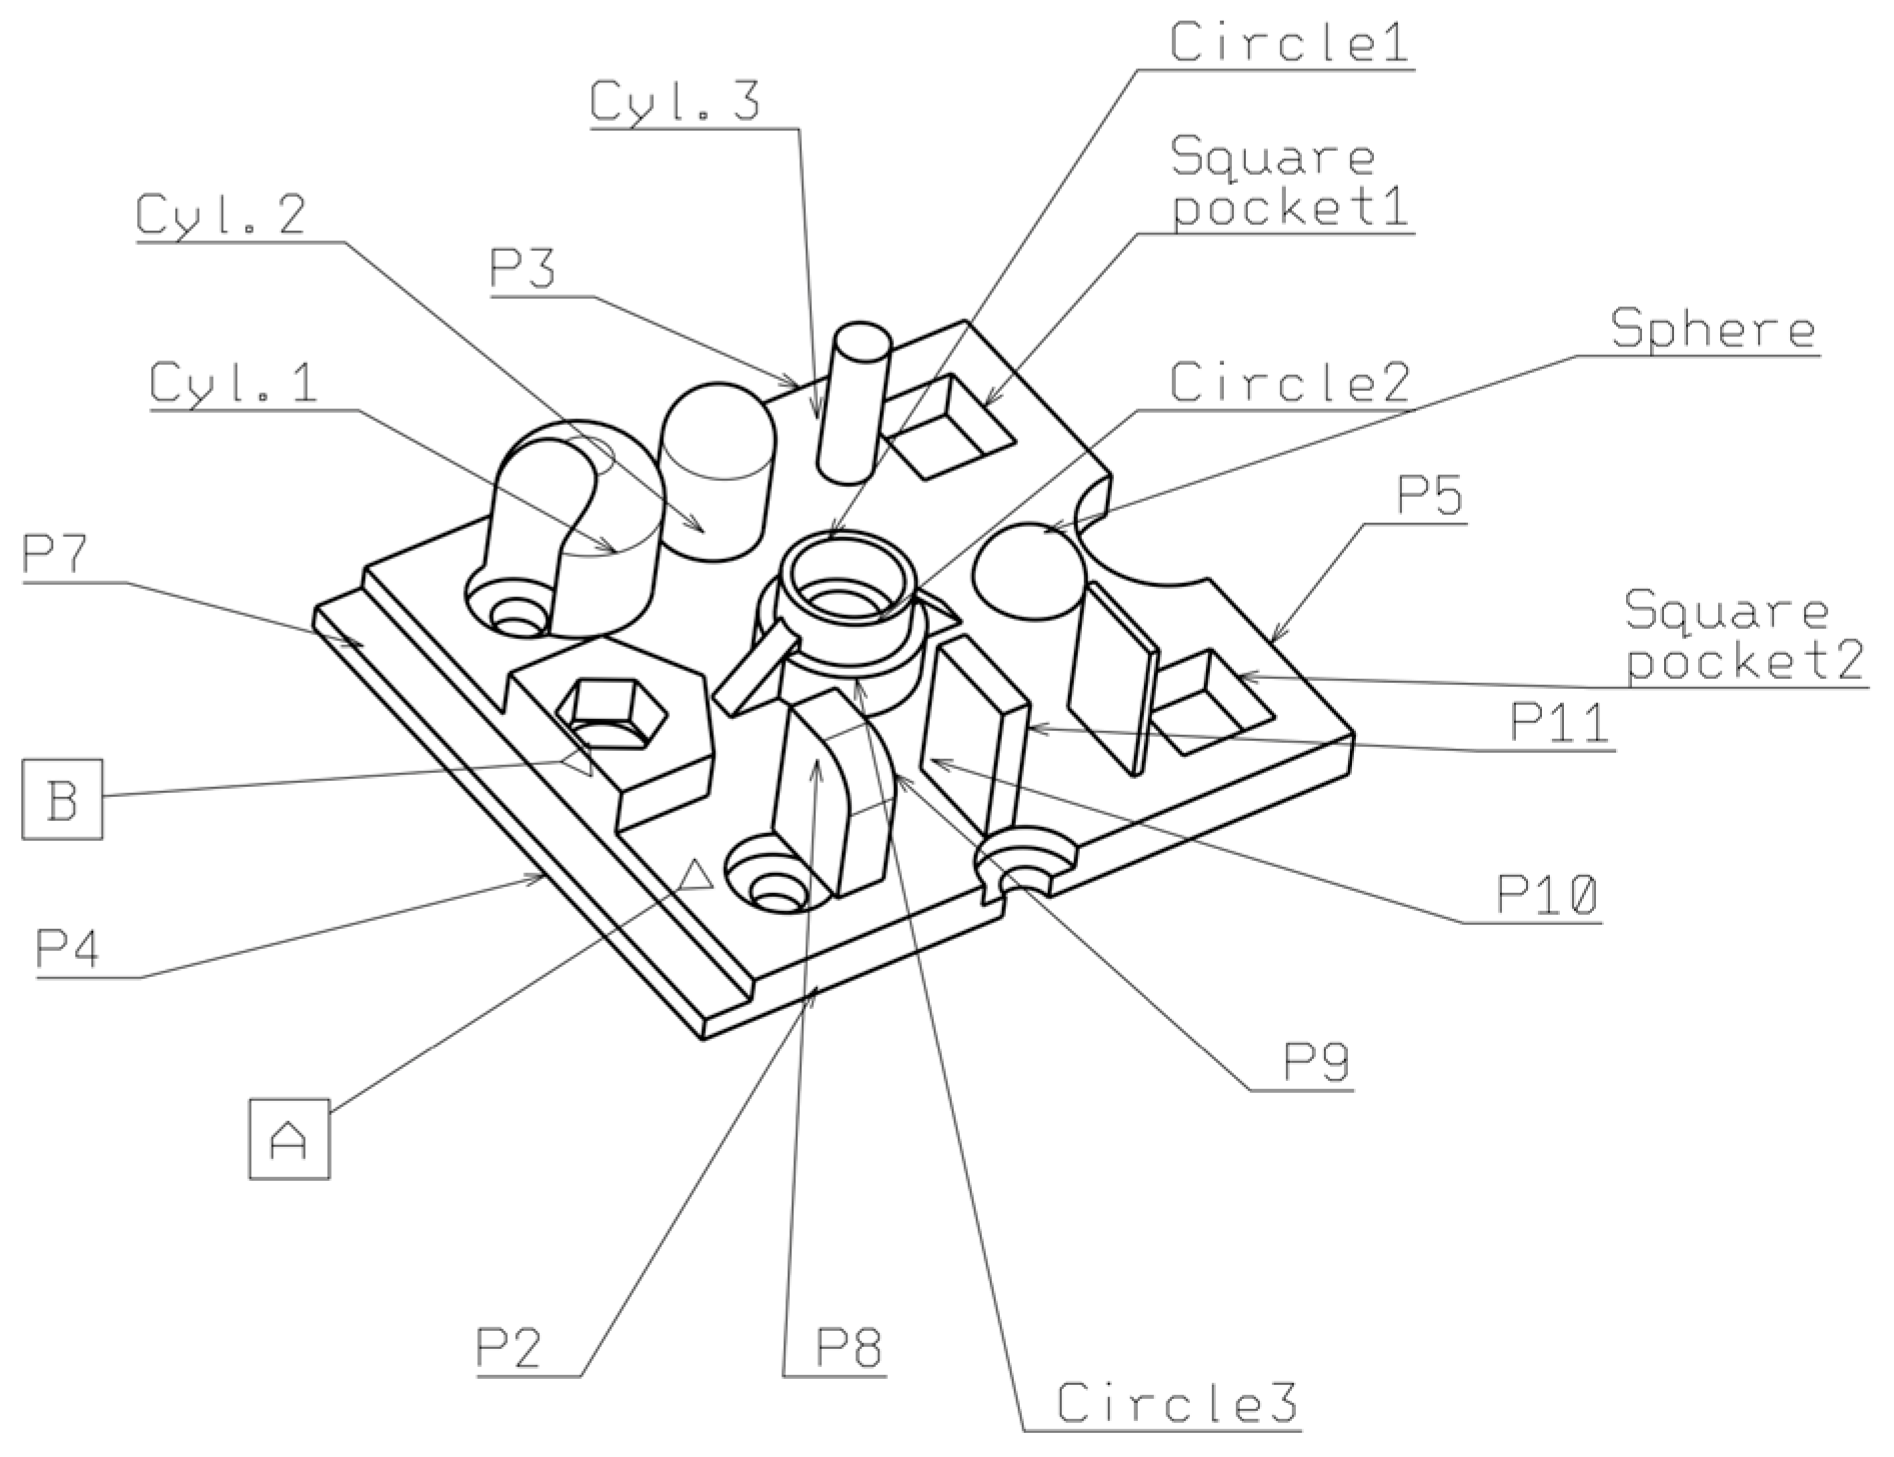
As detailed in Figure 2, the measurement plan encompassed the following elements:
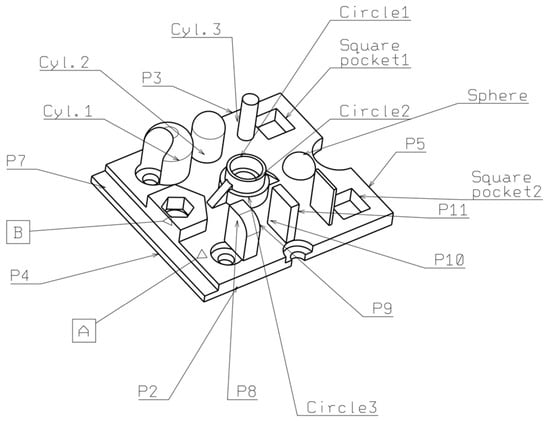
Figure 2.
Measured surfaces.
- 11 Planes: Various planar surfaces on the part were measured to evaluate flatness, perpendicularity, and parallelism. These planes provided critical data on the part’s overall geometric integrity.
- Three Cylinders: Cylindrical features were measured for their diameters to assess their size accuracy, their positions to ensure their correct placement within the part, and their cylindricity deviations to evaluate the roundness and straightness of the cylindrical features.
- One Sphere: The spherical feature was measured for its diameter to determine the size accuracy, its position to ensure its correct spatial location, and its shape to assess its sphericity and overall geometric fidelity.
- Three Circles: Circular features were measured for their circle centre to verify their accurate placement and their diameter to check for their dimensional precision.
Each measurement was performed using the FARO Edge measuring arm, ensuring high accuracy and repeatability. The tolerances specified by the measuring equipment manufacturer include a Single Point Articulation Test (SPAT) of 18 microns (0.0007 in) and a Volumetric Maximum Deviation of ±25 microns (±0.001 in). These values represent the maximum error that can occur within the Gage arm’s measurement volume [27].
The arm’s capability to capture precise data enabled a comprehensive evaluation of both the geometrical and dimensional deviations across the different experimental conditions. By systematically measuring these features, this study aimed to identify the effects of the various FDM materials and printing parameters and optimize the printing process for enhanced accuracy and surface quality.
3. Results and Discussion
The experimental results of the 3D-printed parts were analyzed using the Taguchi method. The analysis included the evaluation of various geometrical deviations such as flatness, perpendicularity, cylindricity, and parallelism, and dimensional deviations such as the diameters and positions of the cylinders and spheres. The response tables for signal-to-noise ratios and means for each measured parameter provide insights into the influence of the following four factors: layer height, printing material, print speed, and nozzle size.
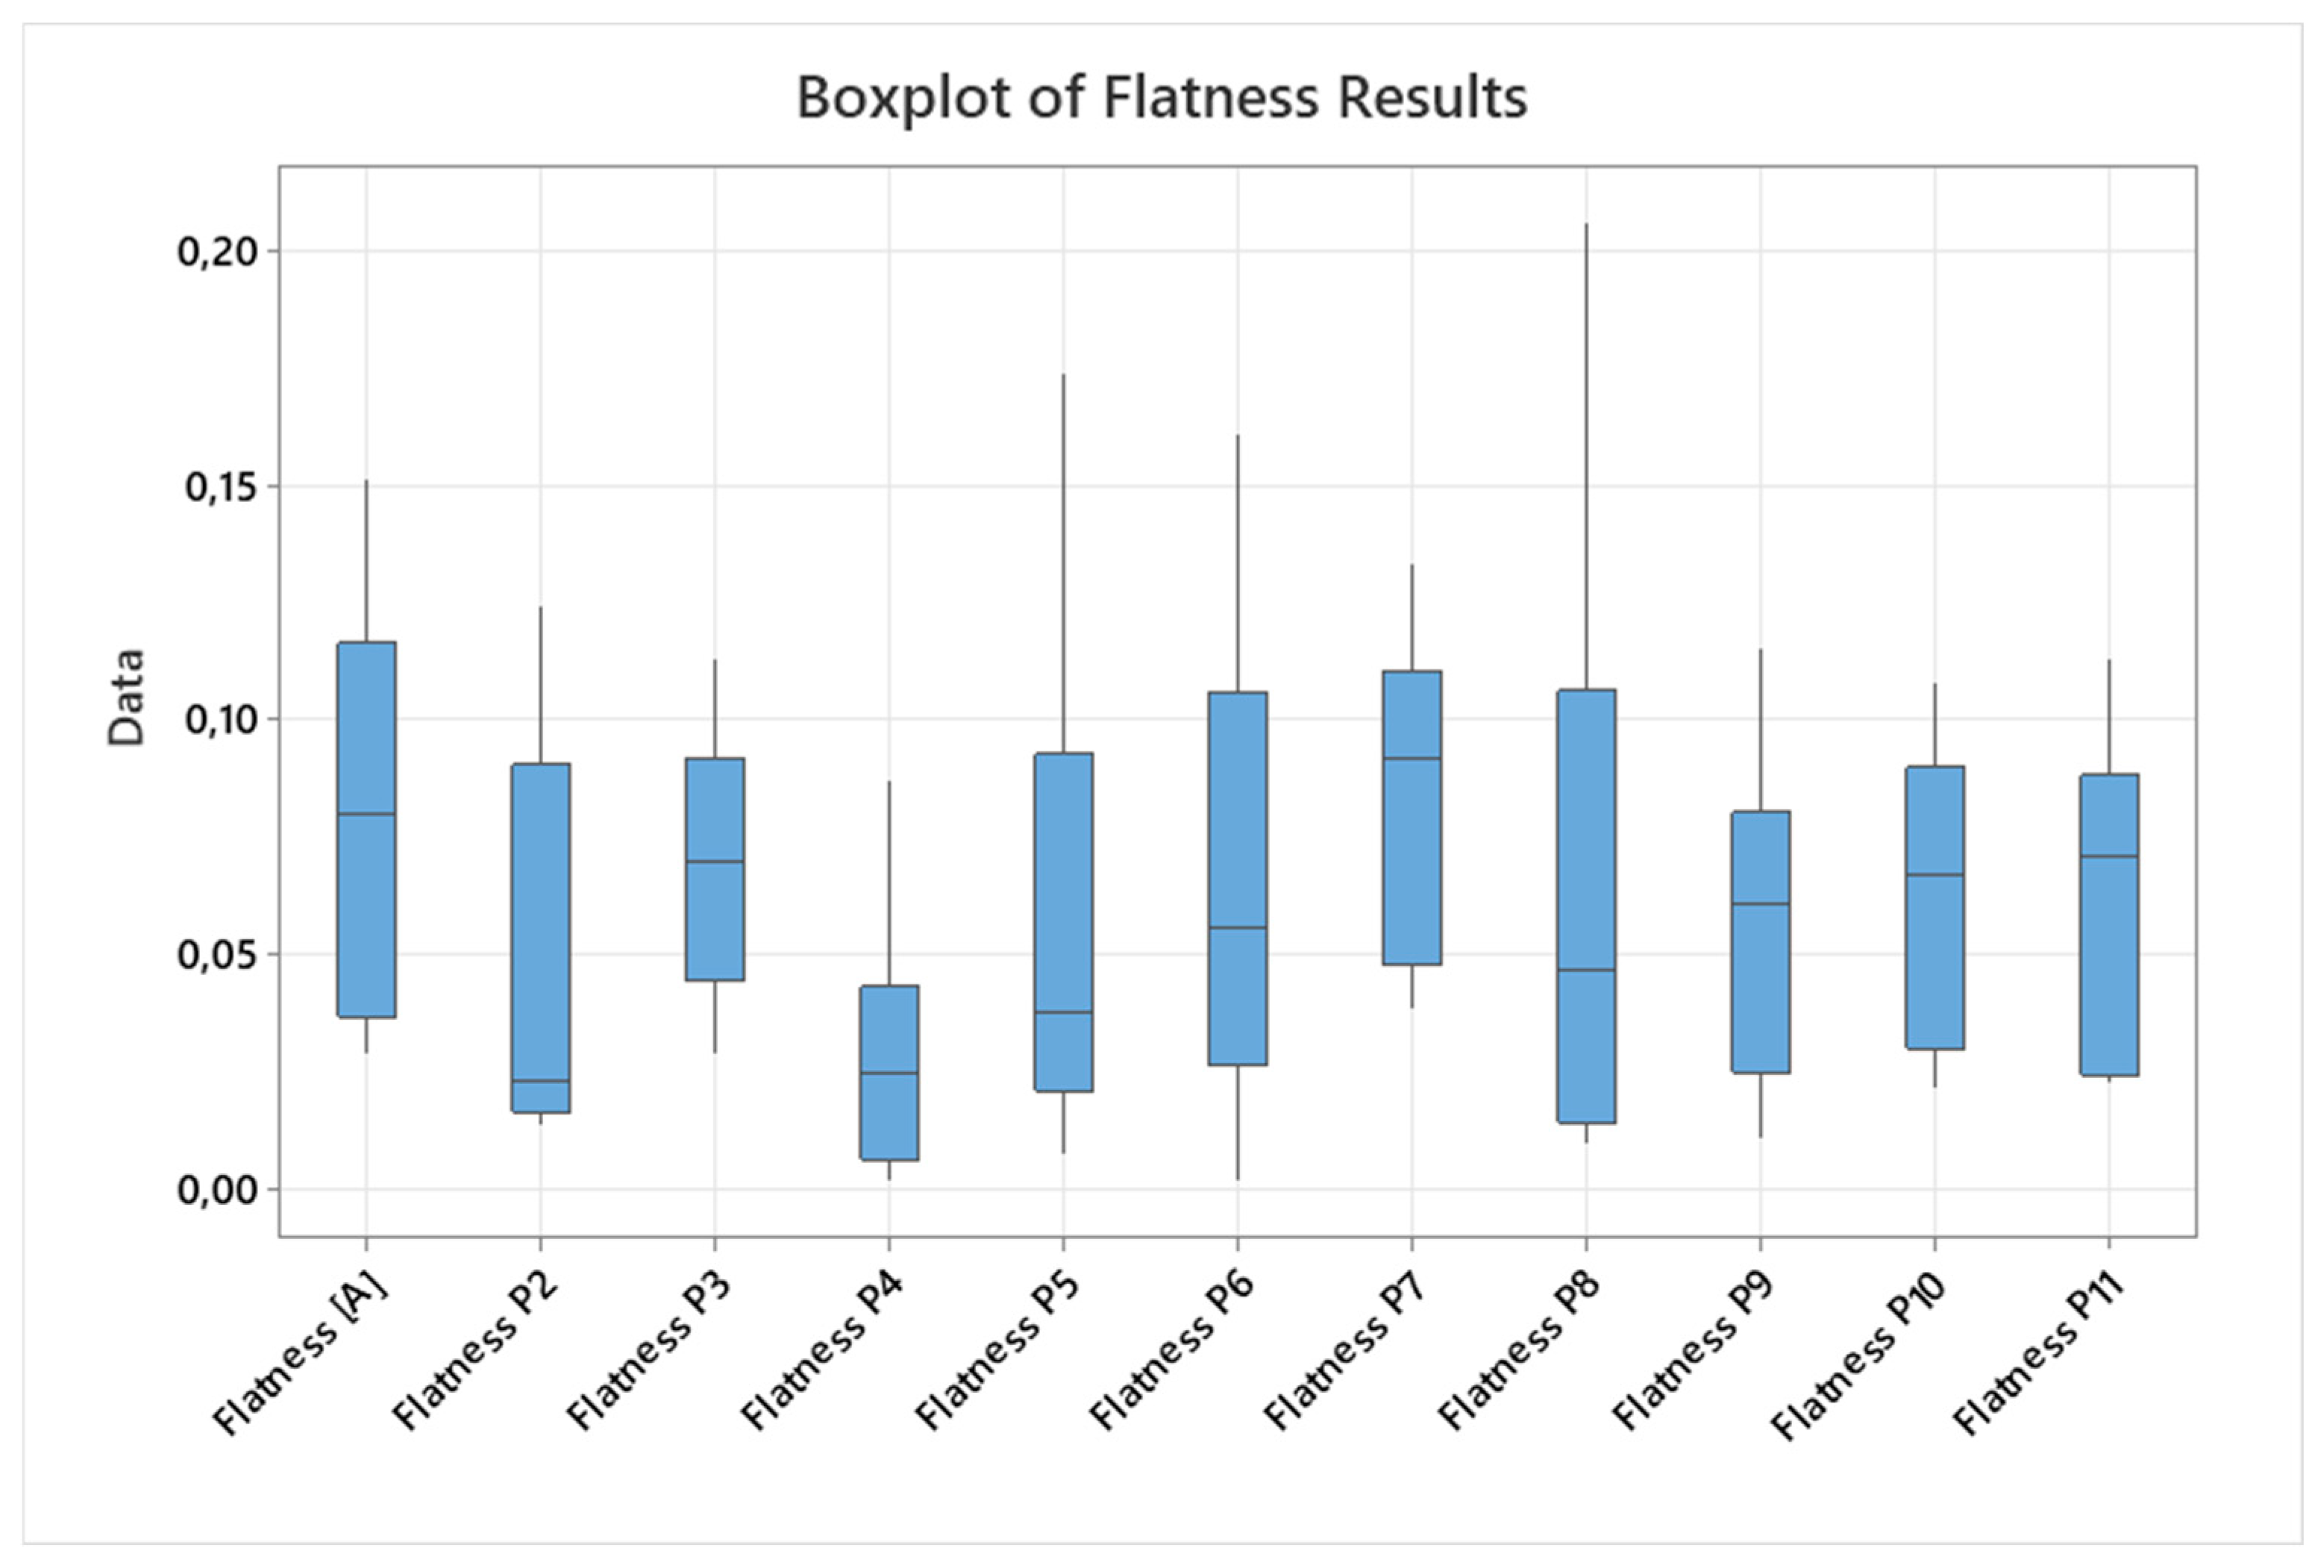
Before analyzing the results, the integrity of the data was ensured by checking for outliers using boxplots for each measurement. Figure 3 shows an example of a boxplot of flatness for datum plane A and other measured planes. This preliminary step confirmed that the data were clean and reliable for further statistical analysis.
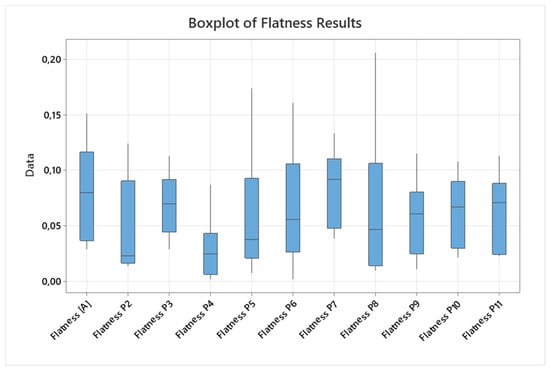
Figure 3.
Boxplot of flatness for the measured planes.
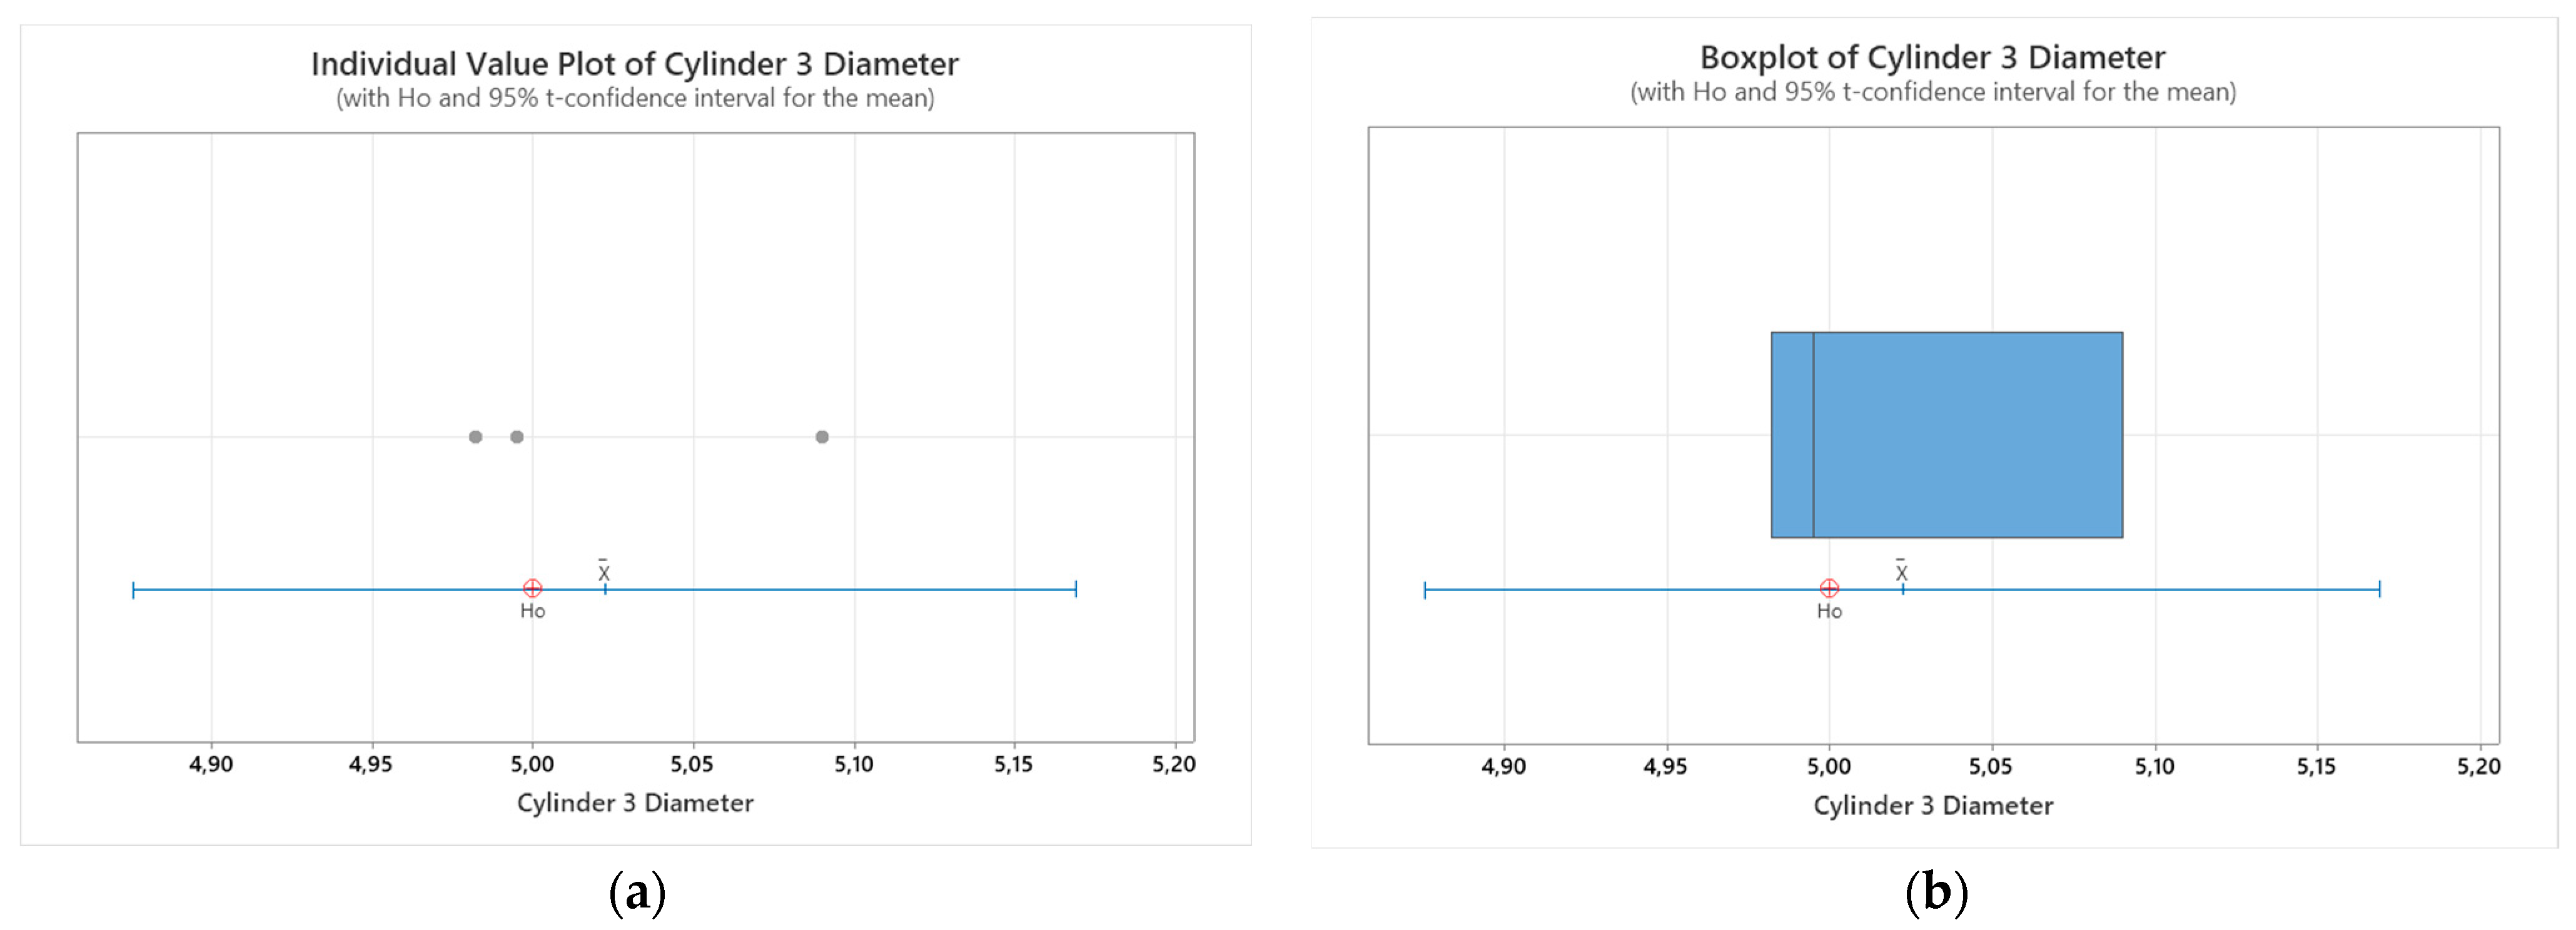
Furthermore, to address concerns regarding the statistical significance and reliability of our data, we reprinted the L6 sample twice more, resulting in three samples fabricated with identical parameters, similar to the Taguchi L27 orthogonal array DoE. This step was taken to ensure that the observed differences in our measurements were not due to random variation, but were consistent and reproducible (Figure 4a,b). To statistically validate the consistency of our reprinted samples, we performed a one-sample t-test. This test compared the mean of our sample data to a hypothesized mean to determine if there was a significant difference.

Figure 4.
Individual value plot of cylinder 3 diameter measurements in [mm] (a); boxplot of cylinder 3 diameter measurements in [mm] (b).
As detailed in Table 3, the one-sample t-test results for the cylinder 3 diameter measurements show that the two-tailed p-value equals 0.579, which, by conventional criteria, suggests that there are no major differences between the three samples and that the consistency of the measurements supports the reliability of the study. The high p-value provides confidence that the variations in the measurements are not to be considered statistically significant. The hypothetical mean is 5.00000, while the actual mean is 5.02233, with a difference of 0.02233. The 95% confidence interval for this difference ranges from −0.1241 to 0.1688. Intermediate values used in the calculations include a t-value of 0.6561 and a standard error in the mean (Se mean) of 0.034.
Table 3.
One-sample t-test: cylinder 3 diameter measurements in [mm].
3.1. Form Deviation—Flatness for Detum Plane A
Because datum plane A has the largest surface and serves as a critical reference for other measurements, we chose to first analyze the influence of the fabrication parameters on this plane. The Taguchi analysis for flatness on datum plane A involved evaluating the signal-to-noise ratios and means for layer height, material, print speed, and nozzle size.
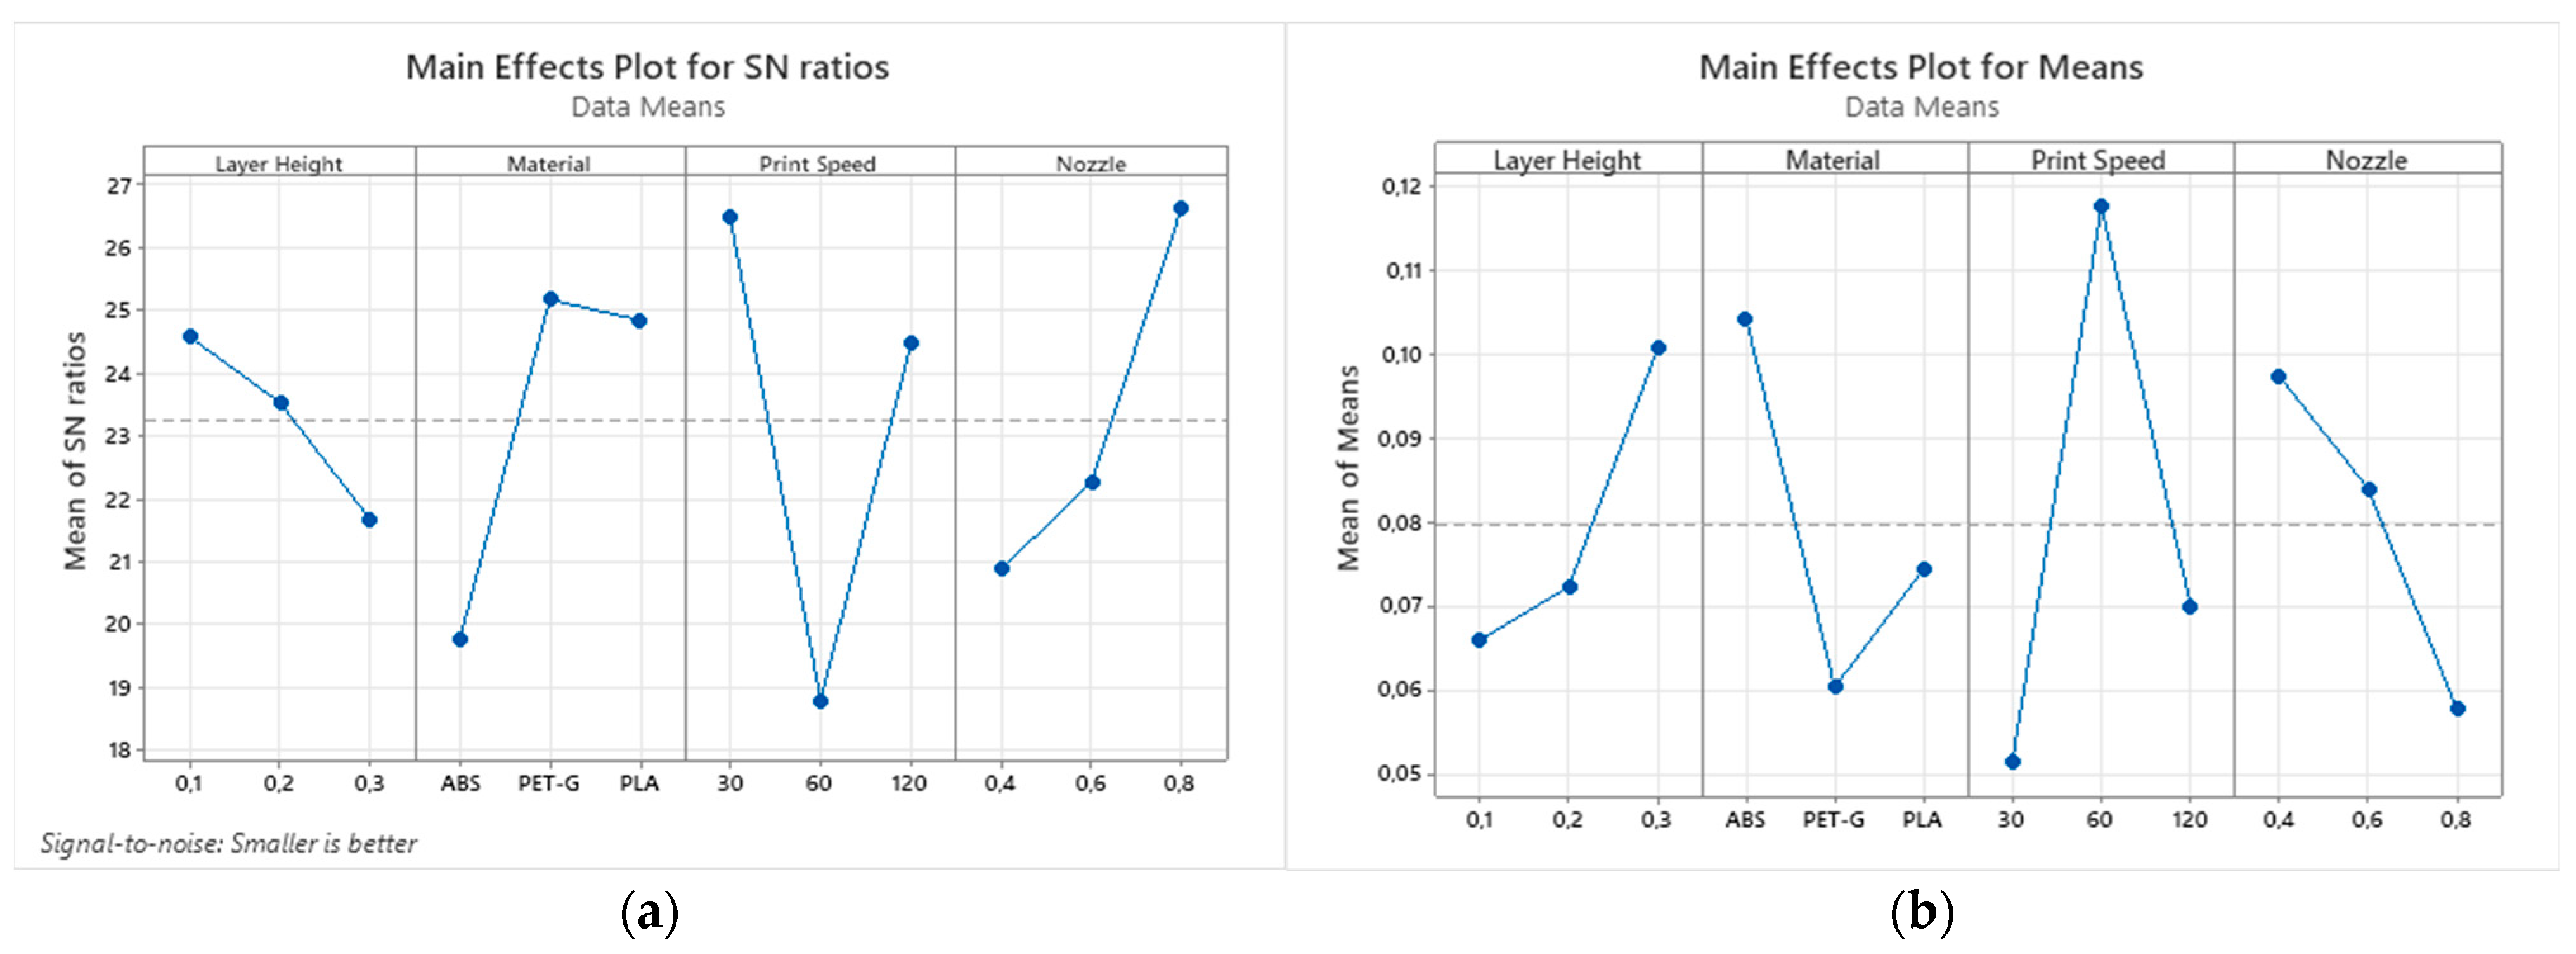
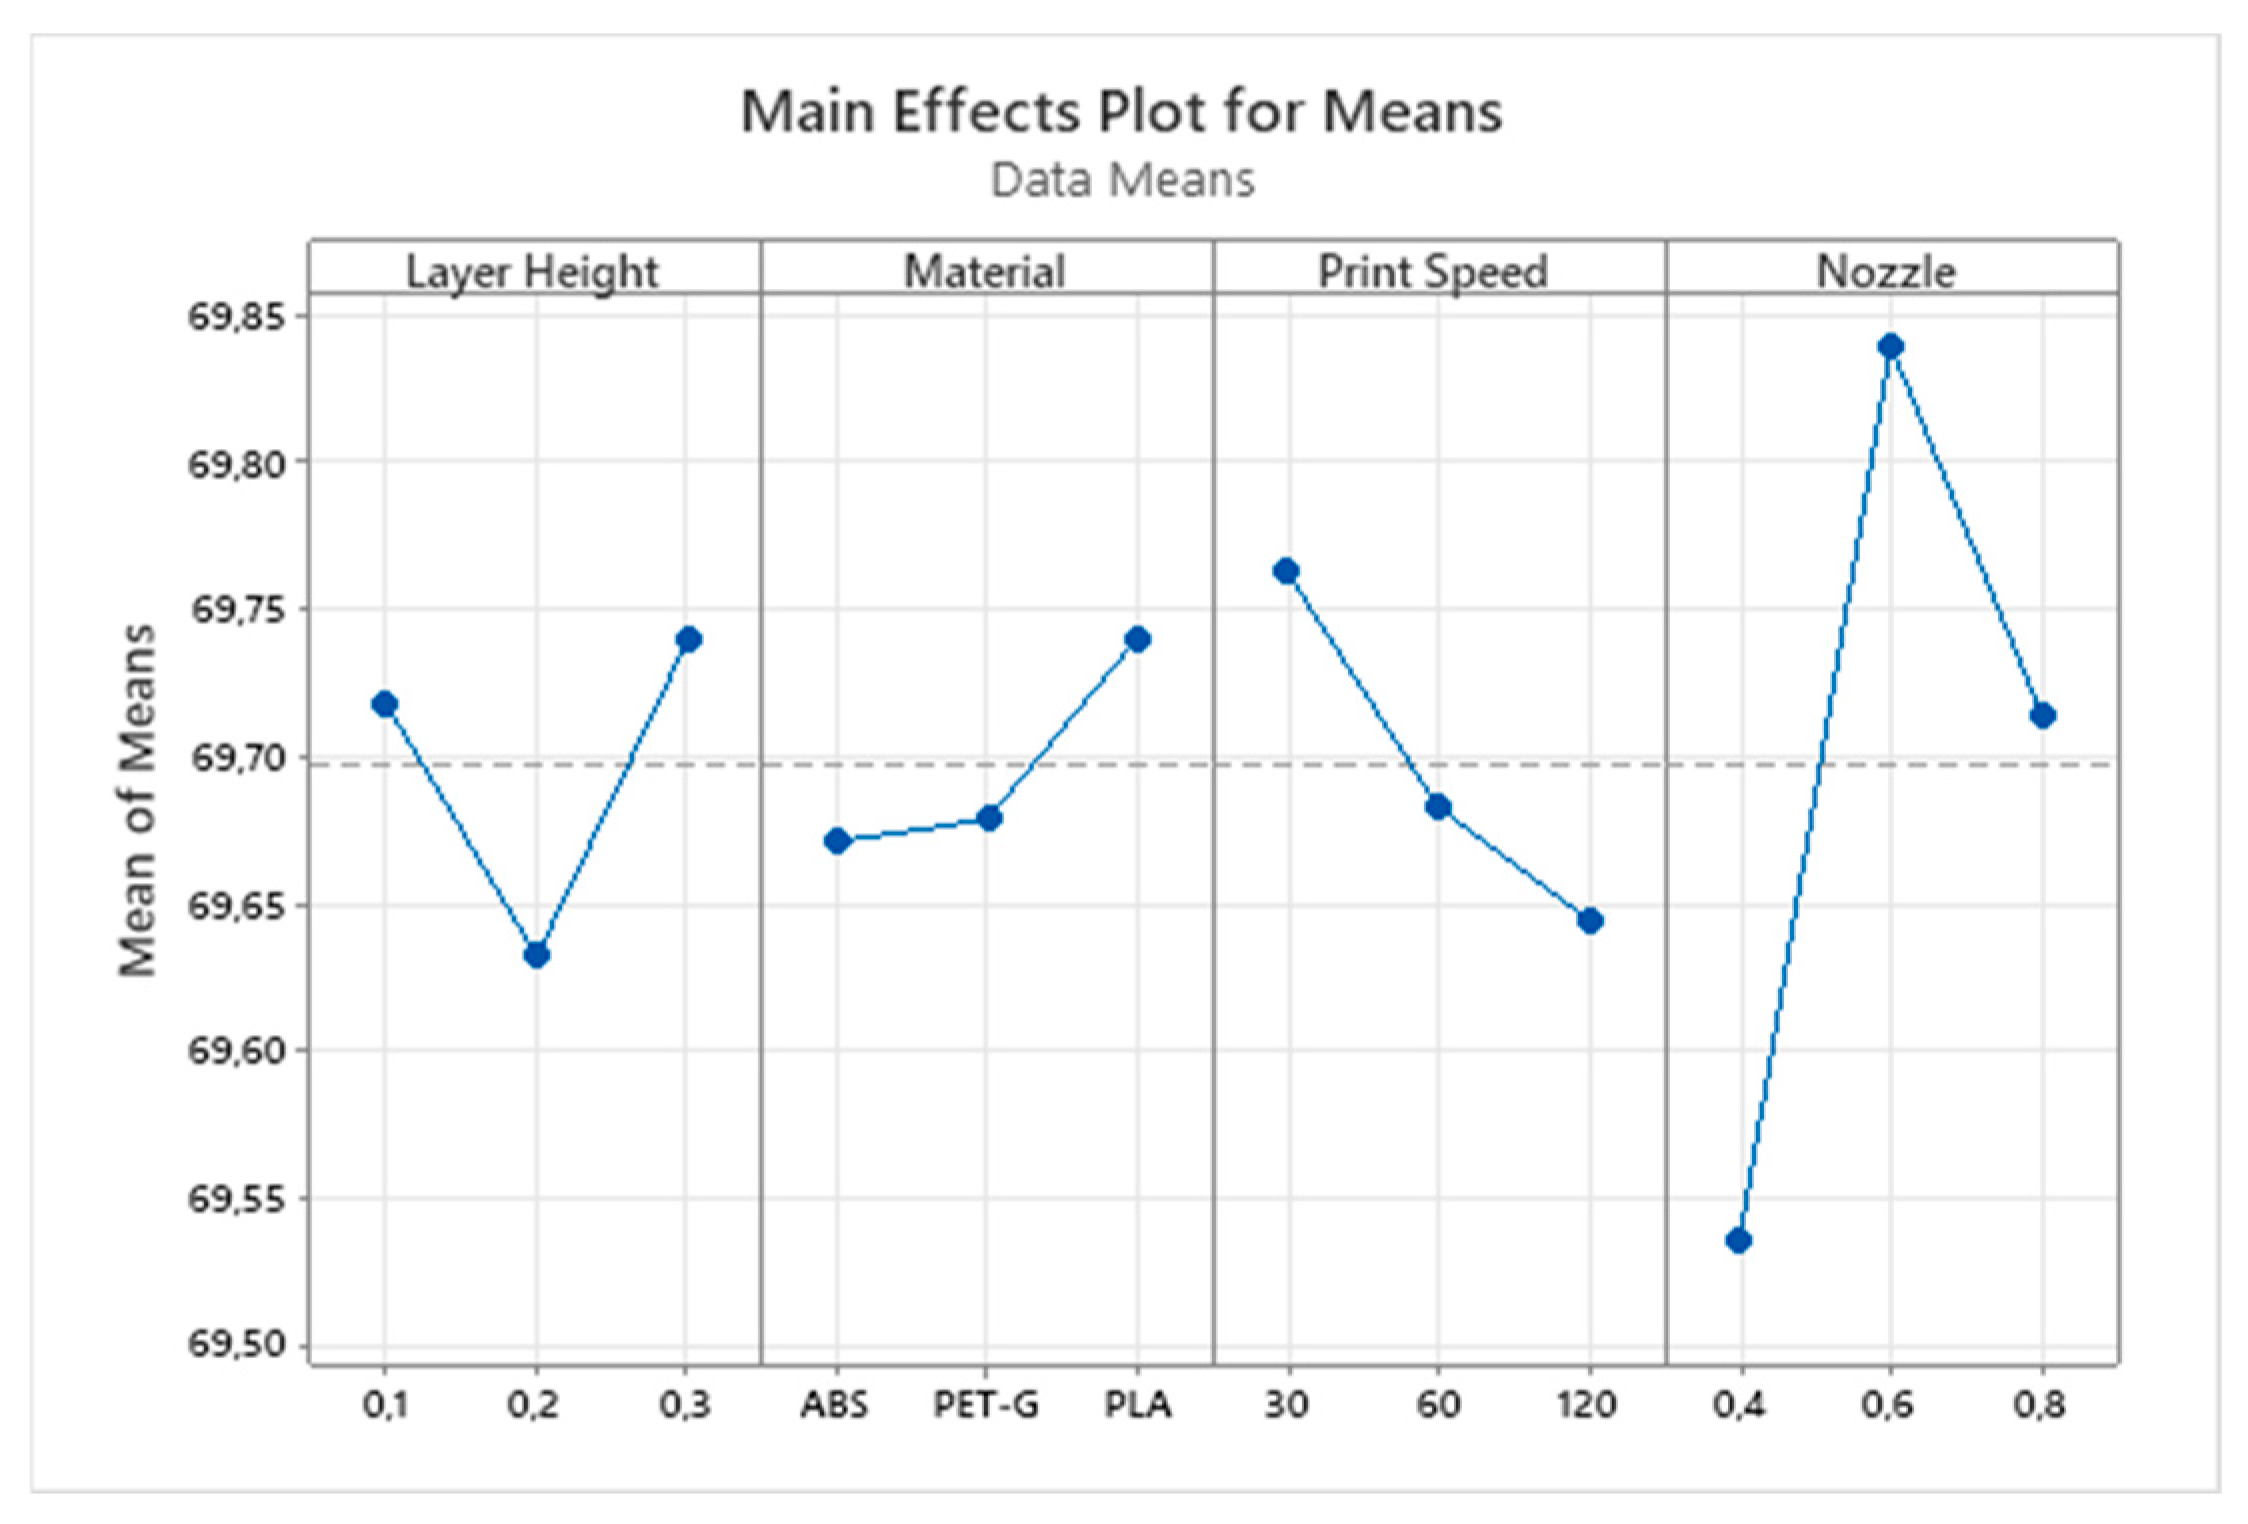
As detailed in Table 4 and Table 5 and as depicted in Figure 5, the analysis showed that print speed had the most significant effect on flatness deviation, with a delta value of 7.69 in the signal-to-noise ratio and 0.06633 in the means. Nozzle size and material also had substantial impacts, ranking second and third, respectively, while layer height had the least influence.
Table 4.
SN Ratios (smaller is better): flatness of datum plane [A] versus layer height; material; print speed; nozzle.
Table 5.
Response table for means: flatness of datum plane [A] versus layer height; material; print speed; nozzle.
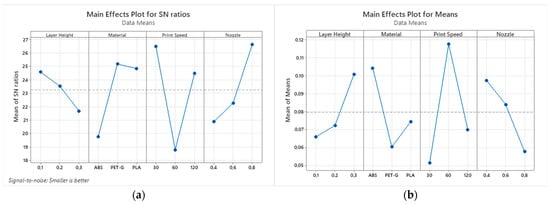
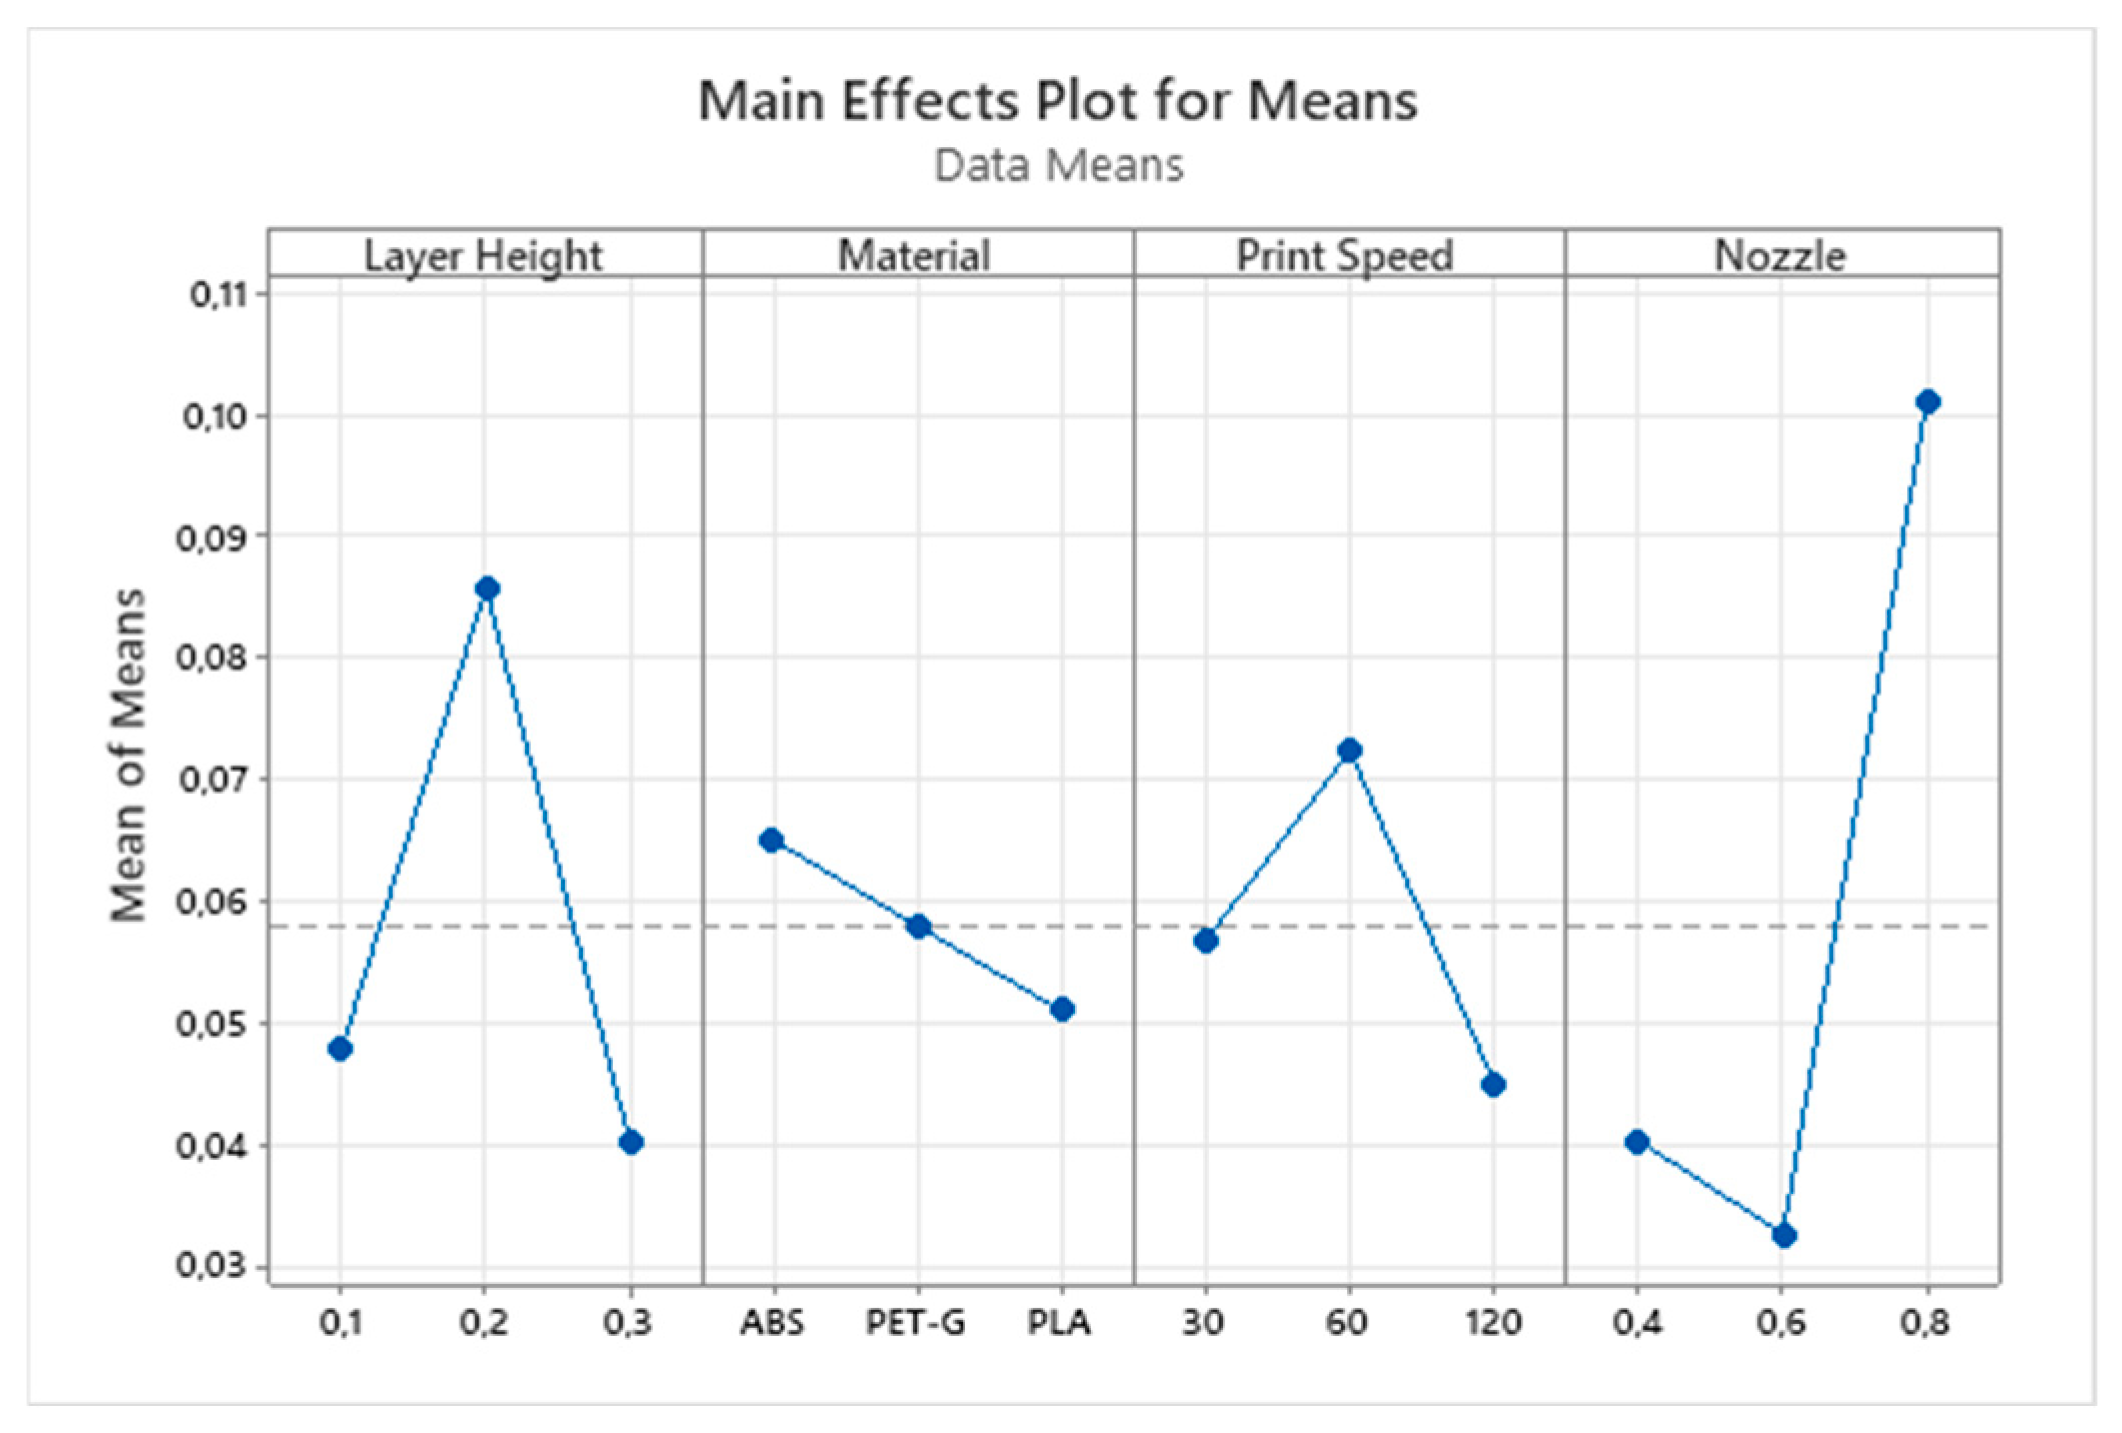
Figure 5.
Taguchi analysis graphs: main effect plot for the means (a) signal-to-noise ratio (b) for flatness of datum plane [A] versus layer height; material; print speed; nozzle.
The main effect plot for the signal-to-noise ratio (S/N ratio) helps in identifying the levels of the factors (in this case, layer height, material, print speed, and nozzle size) that minimize the variability in the response variable, which is the flatness deviation of datum plane A. The “smaller is better” criterion is used here to minimize deviations. This plot (depicted in Figure 5a) typically shows the average S/N ratio for each level of each factor, making it easier to visualize the impact of different factor levels on the response variable’s variability.
The main effect plot for the means displays the average response (flatness deviation) for each level of each factor. This plot allows us to see which levels of the factors result in lower or higher deviations. By examining this plot (depicted in Figure 5b), we can identify which factor levels produce the smallest deviations, indicating better flatness and dimensional accuracy.
The optimal settings for minimizing flatness deviations on datum plane A, based on the signal-to-noise ratios and means, were a layer height of 0.1 mm, ABS material, a print speed of 30 mm/s, and a nozzle size of 0.4 mm. These findings indicate that slower print speeds and smaller nozzle sizes contribute significantly to better flatness, aligning with existing research that emphasizes precision control in layer deposition for improved surface quality.
3.2. Perpendicularity and Parallelism Orientation Deviations
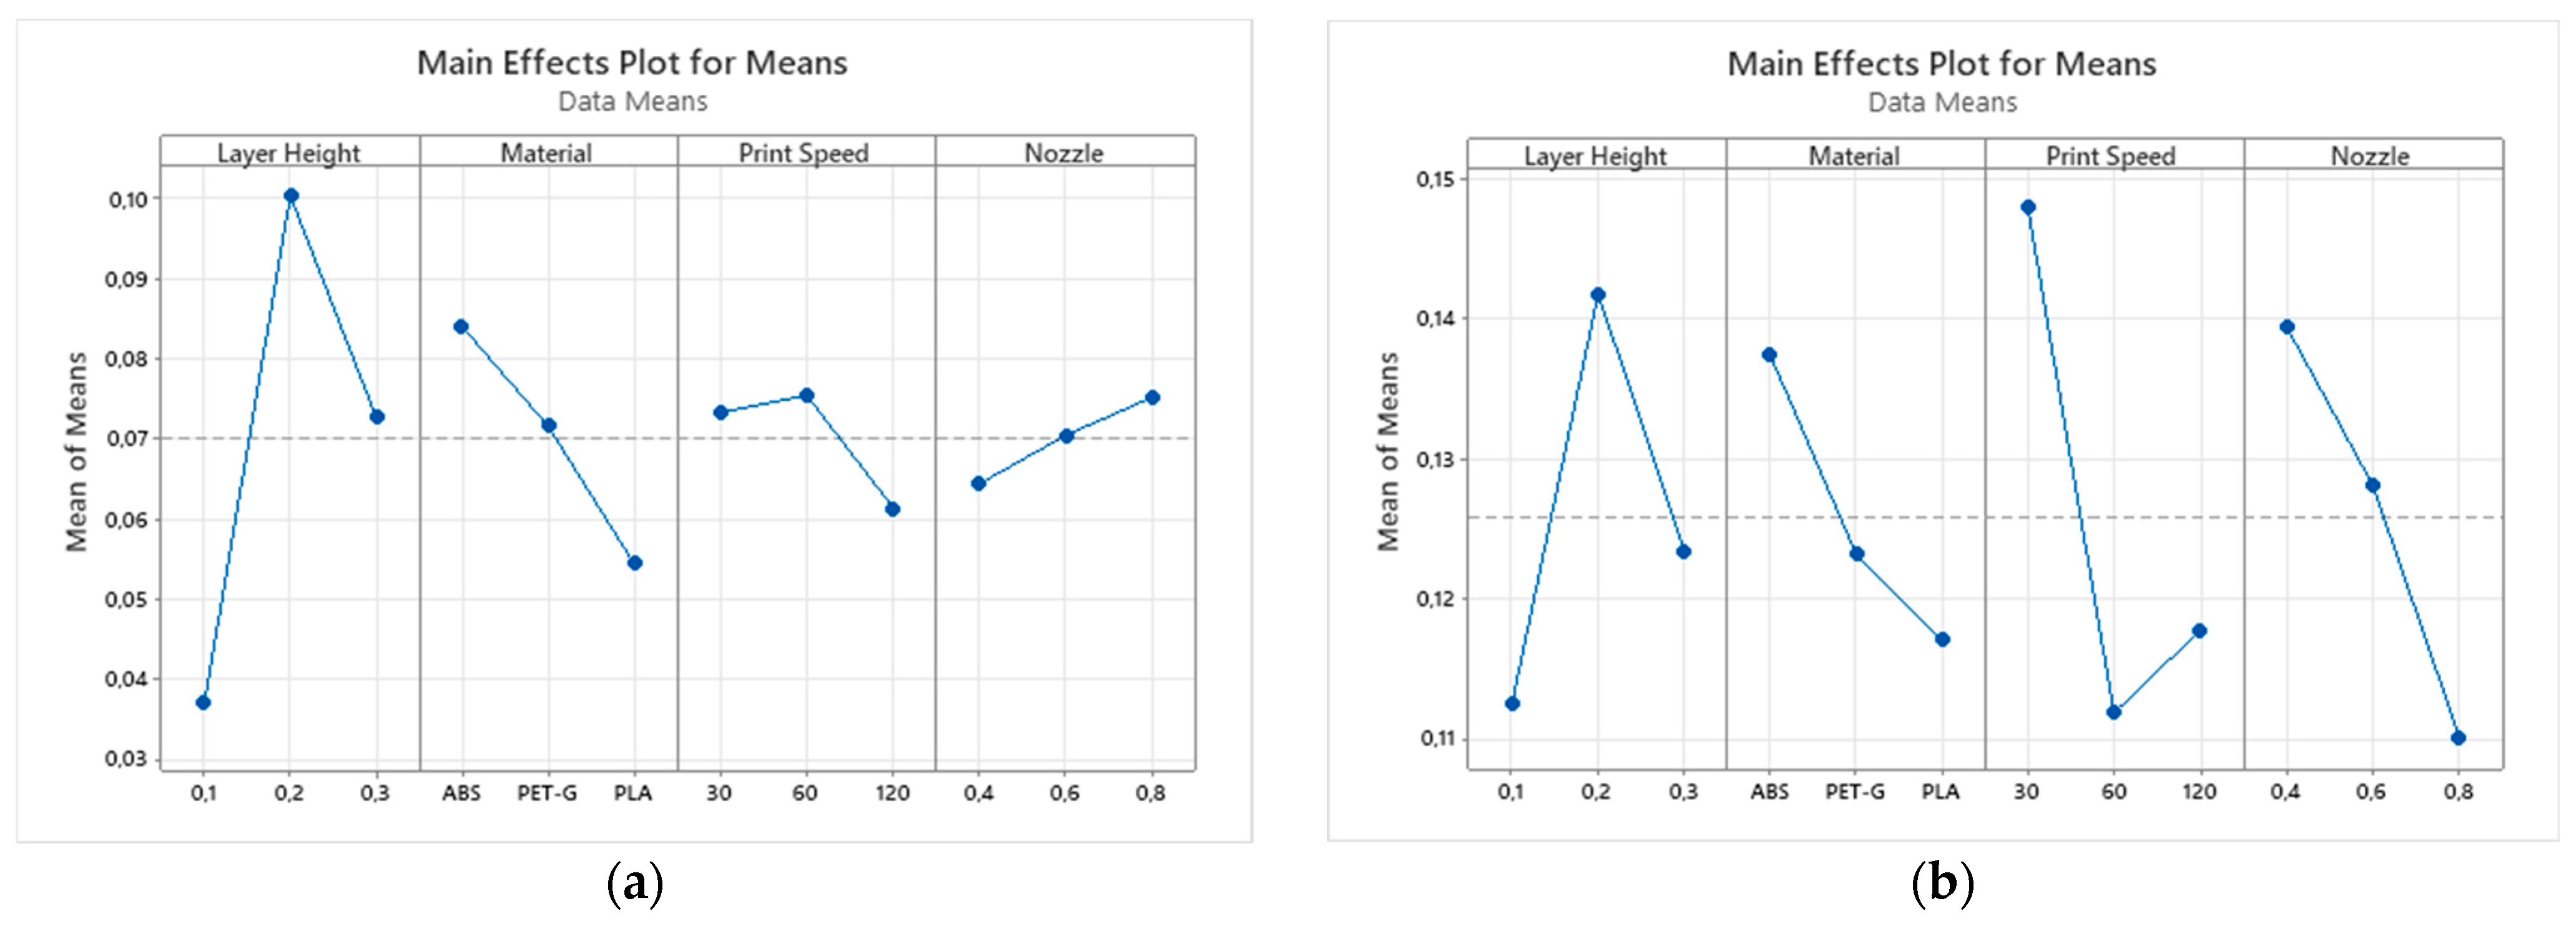
Next, a Taguchi analysis was performed to examine the perpendicularity deviations of the planes P2-A, P3-A, P4-A, P, P5-A, and A-B versus layer height, material, print speed, and nozzle size (detailed in Table 6 and Figure 6a). Additionally, the parallelism deviations of planes P4-B, P5-B, P8-B, P9-B, P10-B, and P11-B were analyzed against the same factors (detailed in Table 7 and Figure 6b).
Table 6.
Response table for means: perpendicularity deviations between planes P2-A, P3-A, P4-A, P, P5-A, and A-B, versus layer height, material, print speed, and nozzle.
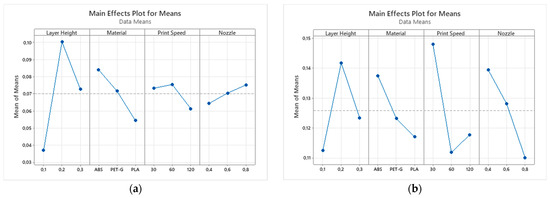
Figure 6.
Main effect plot for means: (a) perpendicularity and (b) parallelism deviations.
Table 7.
Response table for means: parallelism deviations of planes P4-B, P5-B, P8-B, P9-B, P10-B, and P11-B versus layer height, material, print speed, and nozzle.
These analyses revealed that layer height had the most significant impact on perpendicularity deviations, followed by material, print speed, and nozzle size. For parallelism deviations, print speed was the most influential factor, followed by layer height, nozzle size, and material. These findings underscore the importance of optimizing layer height and print speed to minimize geometric deviations in 3D-printed parts.
3.3. Cylindricity and Spherical Form Deviations
Furthermore, the Taguchi analysis conducted on cylindricity deviations revealed that nozzle size was the most influential factor, having the greatest impact on the precision of the cylindrical shapes produced. This is evident from the highest delta value in the response table for both the signal-to-noise ratios and the means (delta: 954 in S/N ratio and 0.007000 in means). Specifically, the results indicate that larger nozzle sizes tend to reduce the precision of the fabricated cylindrical primitives. This reduction in precision can also be attributed to the material deposition strategy, where concentric circles are deposited after starting and ending at the same point. If the material is deposited on top of or near an incompletely solidified path caused by increased speed, layer size, or larger nozzle, the solidification process further decreases the accuracy of the final cylindrical shape.
For spherical shape deviations, the analysis showed that nozzle size again emerged as the most significant factor affecting the form accuracy of the spheres. This is indicated by the highest delta value in the response tables for both the signal-to-noise ratios and the means (delta: 1135 in S/N ratio and 0.006833 in means), signifying that variations in nozzle size contribute more prominently to deviations in the spherical shapes compared to other factors (detailed in Table 8 and Figure 7).
Table 8.
Response table for means for spherical shape deviation versus layer height; material; print speed; nozzle.
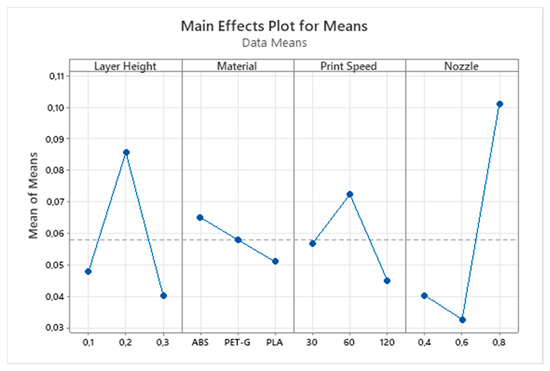
Figure 7.
Main effect plot for means for spherical shape deviation.
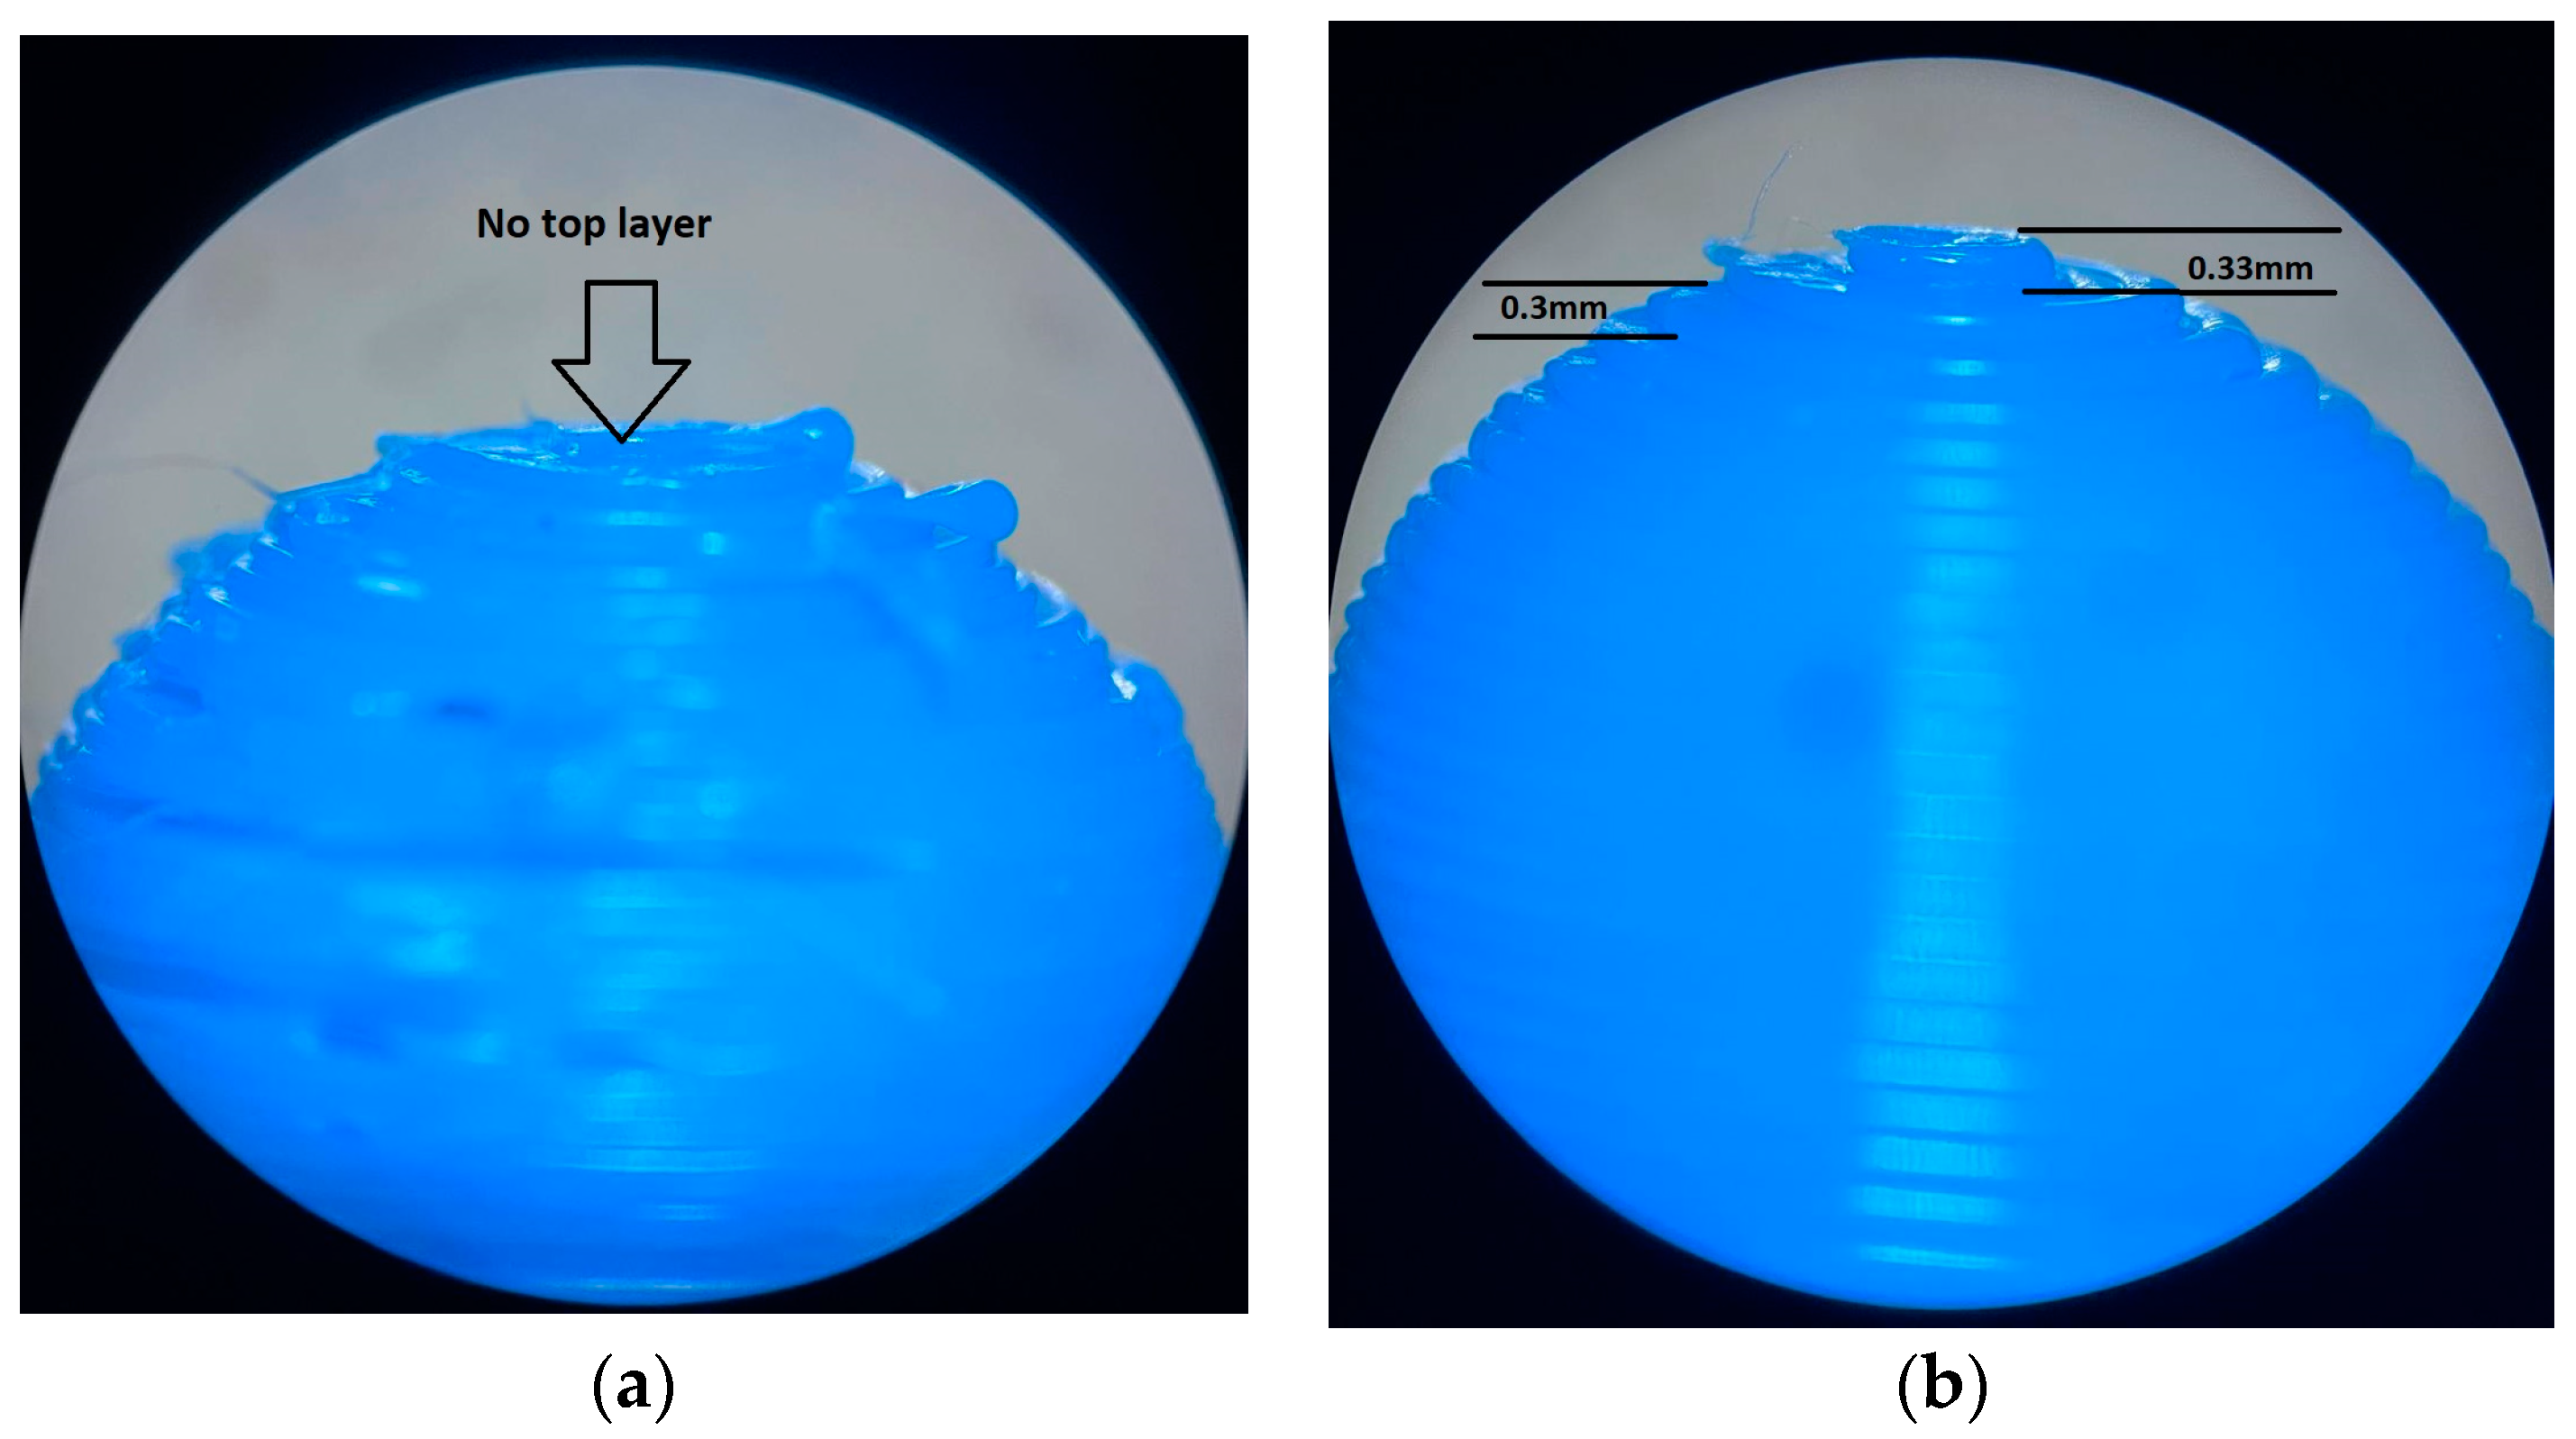
After a visual inspection using a stereo microscope, it was validated that the nozzle size and layer height significantly influences spherical shape accuracy in 3D printing. Microscope images allowed for a more detailed inspection on the layers that build the spherical shape, revealing that the last layer (top layer) contributes notably to the spherical shape’s deviation. For example, a 0.3 mm layer height and a sphere diameter of 10 mm result in approximately 33 layers, requiring an extra 0.1 mm layer to achieve the finished height. If the layer slicing division is not a whole number, the slicing software may either omit the excess, resulting in a slightly shorter sphere (approximately 9.9 mm), or not fully compress the final layer, leading to an increased final layer height (0.33 mm in our case), as seen in Figure 8b. Conversely, using a 0.2 mm layer height for the same sphere requires 50 layers, a whole number, which can affect the top spherical shape due to the larger diameter of the final layer compared to the 0.33 mm last layer (Figure 8a).

Figure 8.
Nozzle size and layer height’s influence on the spherical shape deviation. (a) Sample L6 with a layer height of 0.2 mm and (b) sample L9 with a layer height of 0.3 mm.
Additionally, it can be observed how the layer height greatly influences the roughness when measured parallel to the Z build direction.
3.4. Dimensional Deviations
To highlight how the choice of fabrication parameters affects the dimensional accuracy of the printed parts, Table 9 illustrates the deviations from the nominal dimensions for each sample fabricated with the parameters presented in Table 2.
Table 9.
Nominal and measured values in [mm].
The analysis of cylinder diameter deviations reveals distinct patterns associated with the different materials and printing parameters. For small-sized geometrical entities, such as cylinder no. 3 (Table 10 and Figure 9) with a nominal diameter of 5 mm, the nozzle size significantly affects the printed cylinder’s dimensions. Larger nozzle sizes tend to produce cylinders with diameters greater than the nominal value, while smaller nozzles result in smaller diameters. This phenomenon can be attributed to the material deposition strategy, where concentric circles are deposited. If the material is deposited on top of or near an incompletely solidified path, the solidification process is less controlled, leading to variations in the final dimensions.
Table 10.
Response table for means of cylinder no. 3 diameter in [mm] versus layer height; material; print speed; nozzle.
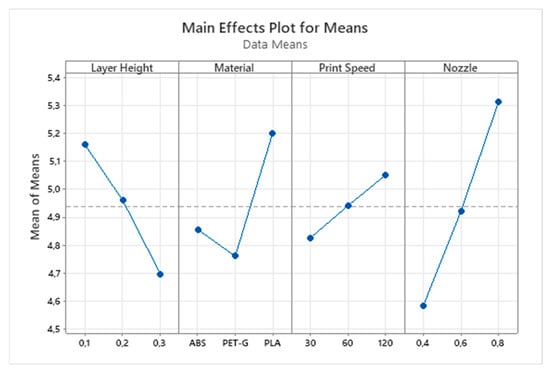
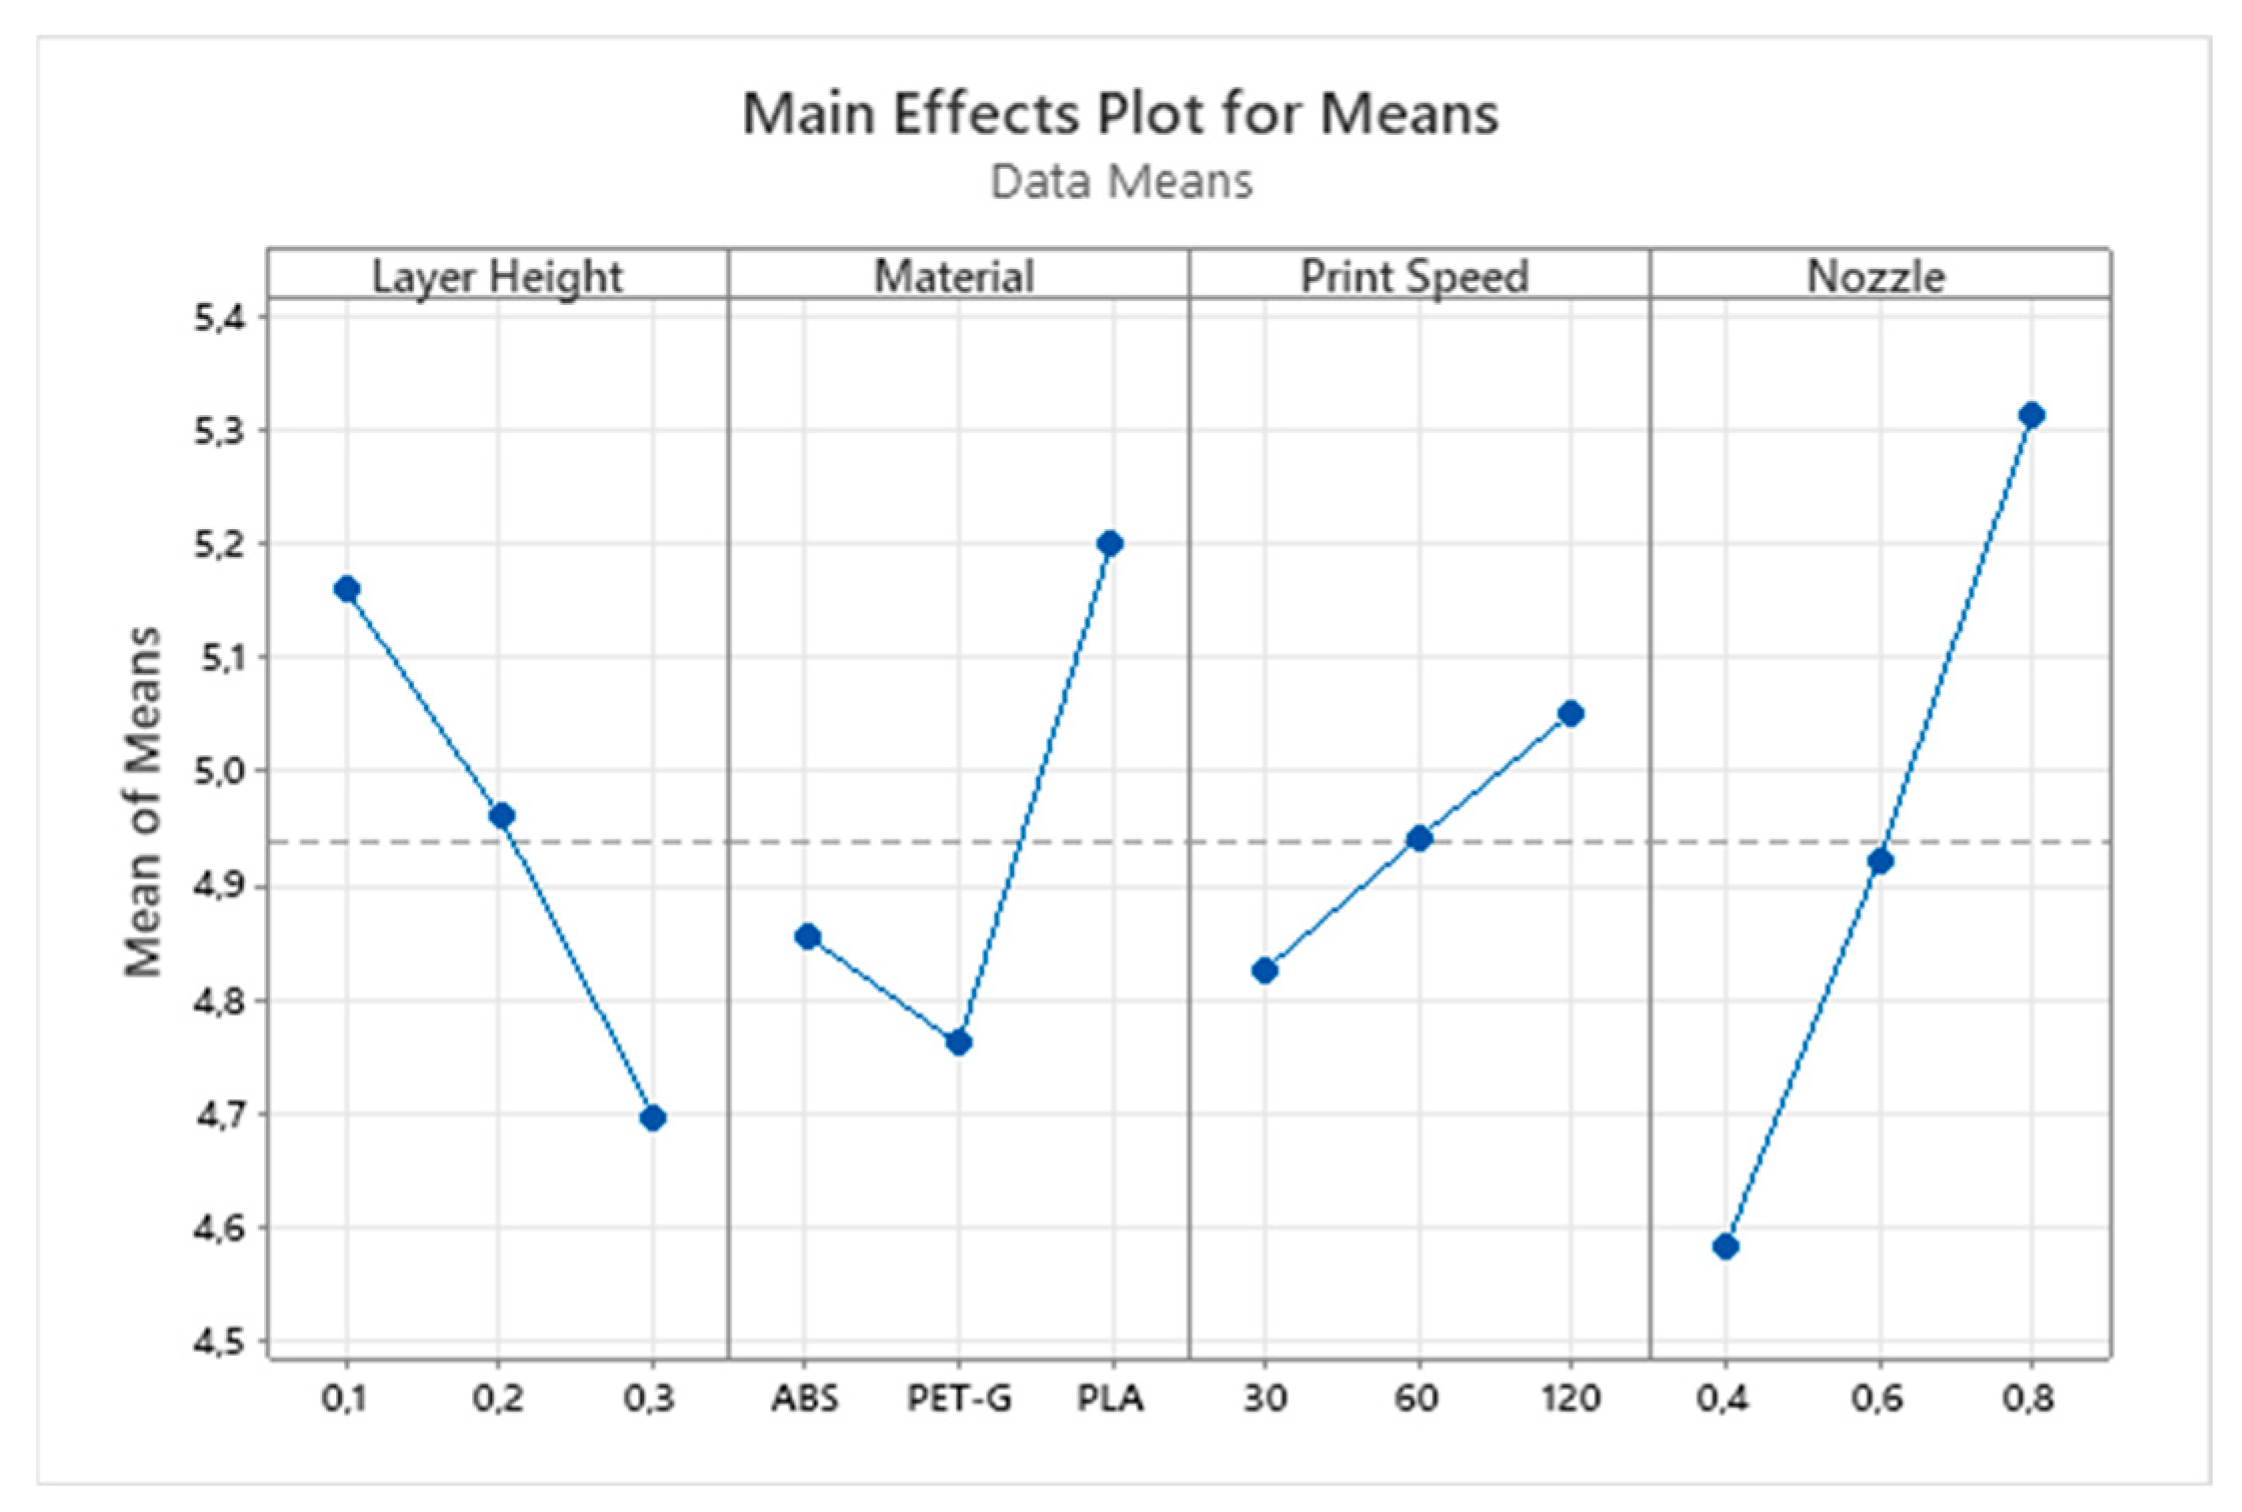
Figure 9.
Main effect plot for means of cylinder no. 3’s diameter.
Furthermore, the layer height also plays a crucial role. When a smaller layer height is selected, the resultant cylinder diameter tends to be larger than the nominal value. This increase is due to the “squeezing” phenomenon, where the material spreads out more when deposited in thinner layers, leading to a slight over-expansion. Conversely, with a larger layer height, the deposited material can better retain its extruded shape, reducing this over-expansion effect.
Interestingly, these effects are consistent across other measured cylinders, such as cylinder no. 1 and 2 with 15 mm and 10 mm nominal diameters. However, the diameter of these larger cylinders does not exceed the nominal value under any conditions. This is likely due to the material’s thermal contraction coefficient. As the material is deposited in larger quantities for bigger cylinders, the contraction during cooling becomes more pronounced, counteracting the expansion effects observed with smaller cylinders.
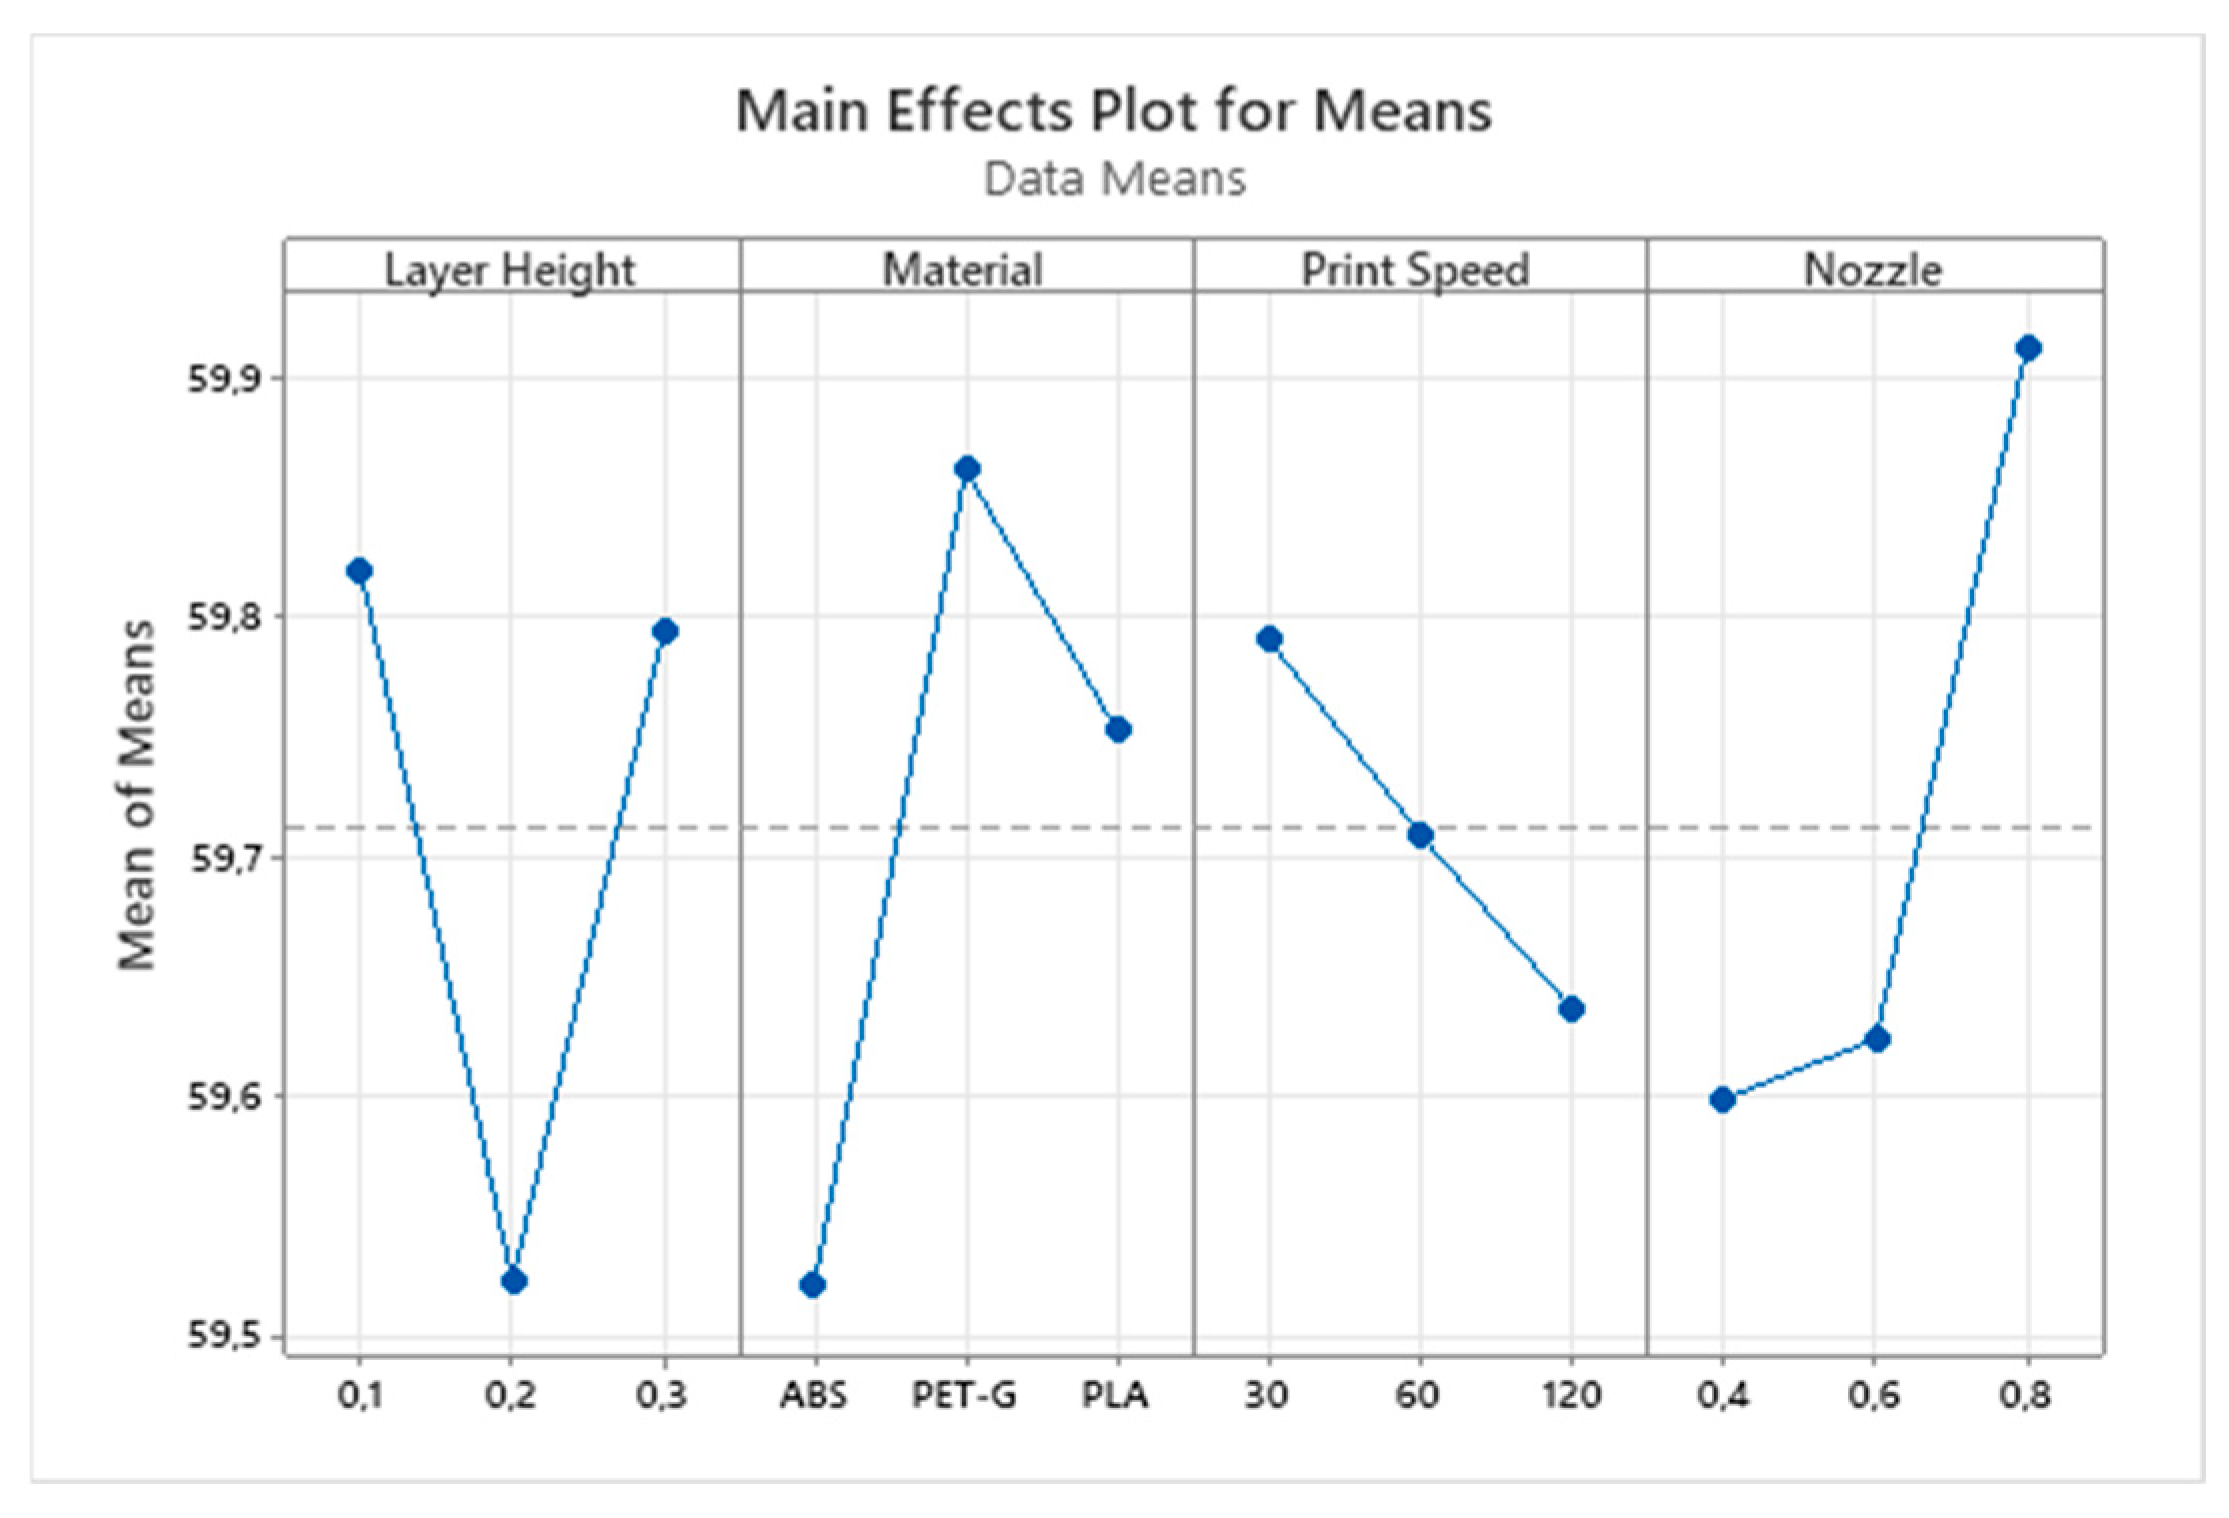
Another phenomenon can be observed while studying dimensional deviation for the width and length of the part. Mainly due to the material deposition’s direction, it can be observed that the nozzle diameter has a different influence on dimensional accuracy. This can be explained by different contraction coefficients along the deposition direction or perpendicular to it.
The phenomenon of dimensional deviation, particularly in the total width and length of the part (depicted in Figure 10 and Figure 11 and in Table 11 and Table 12), is influenced significantly by the direction of material deposition. The nozzle’s diameter plays a pivotal role in this context, as it affects the dimensional accuracy in a distinct manner. This variance in accuracy can be attributed to the differential contraction coefficients, which vary depending on whether they are measured along the direction of deposition or perpendicular to it. The contraction coefficient is influenced by several factors, including the thermal properties of the material, the cooling rate, and the interlayer adhesion strength.
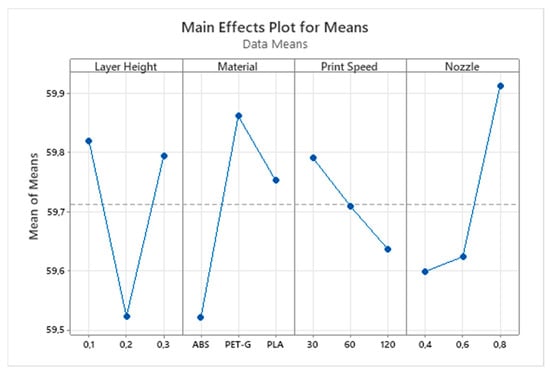
Figure 10.
Main effect plot for means of part width.
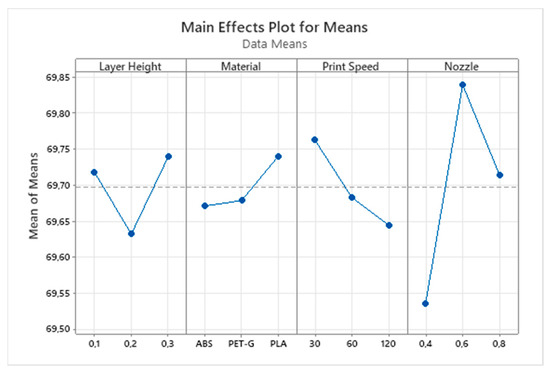
Figure 11.
Main effect plot for means of part length.
Table 11.
Response table for means of part width versus layer height; material; print speed; nozzle.
Table 12.
Response table for means of part length in [mm] versus layer height; material; print speed; nozzle.
3.5. Roughness Analysis
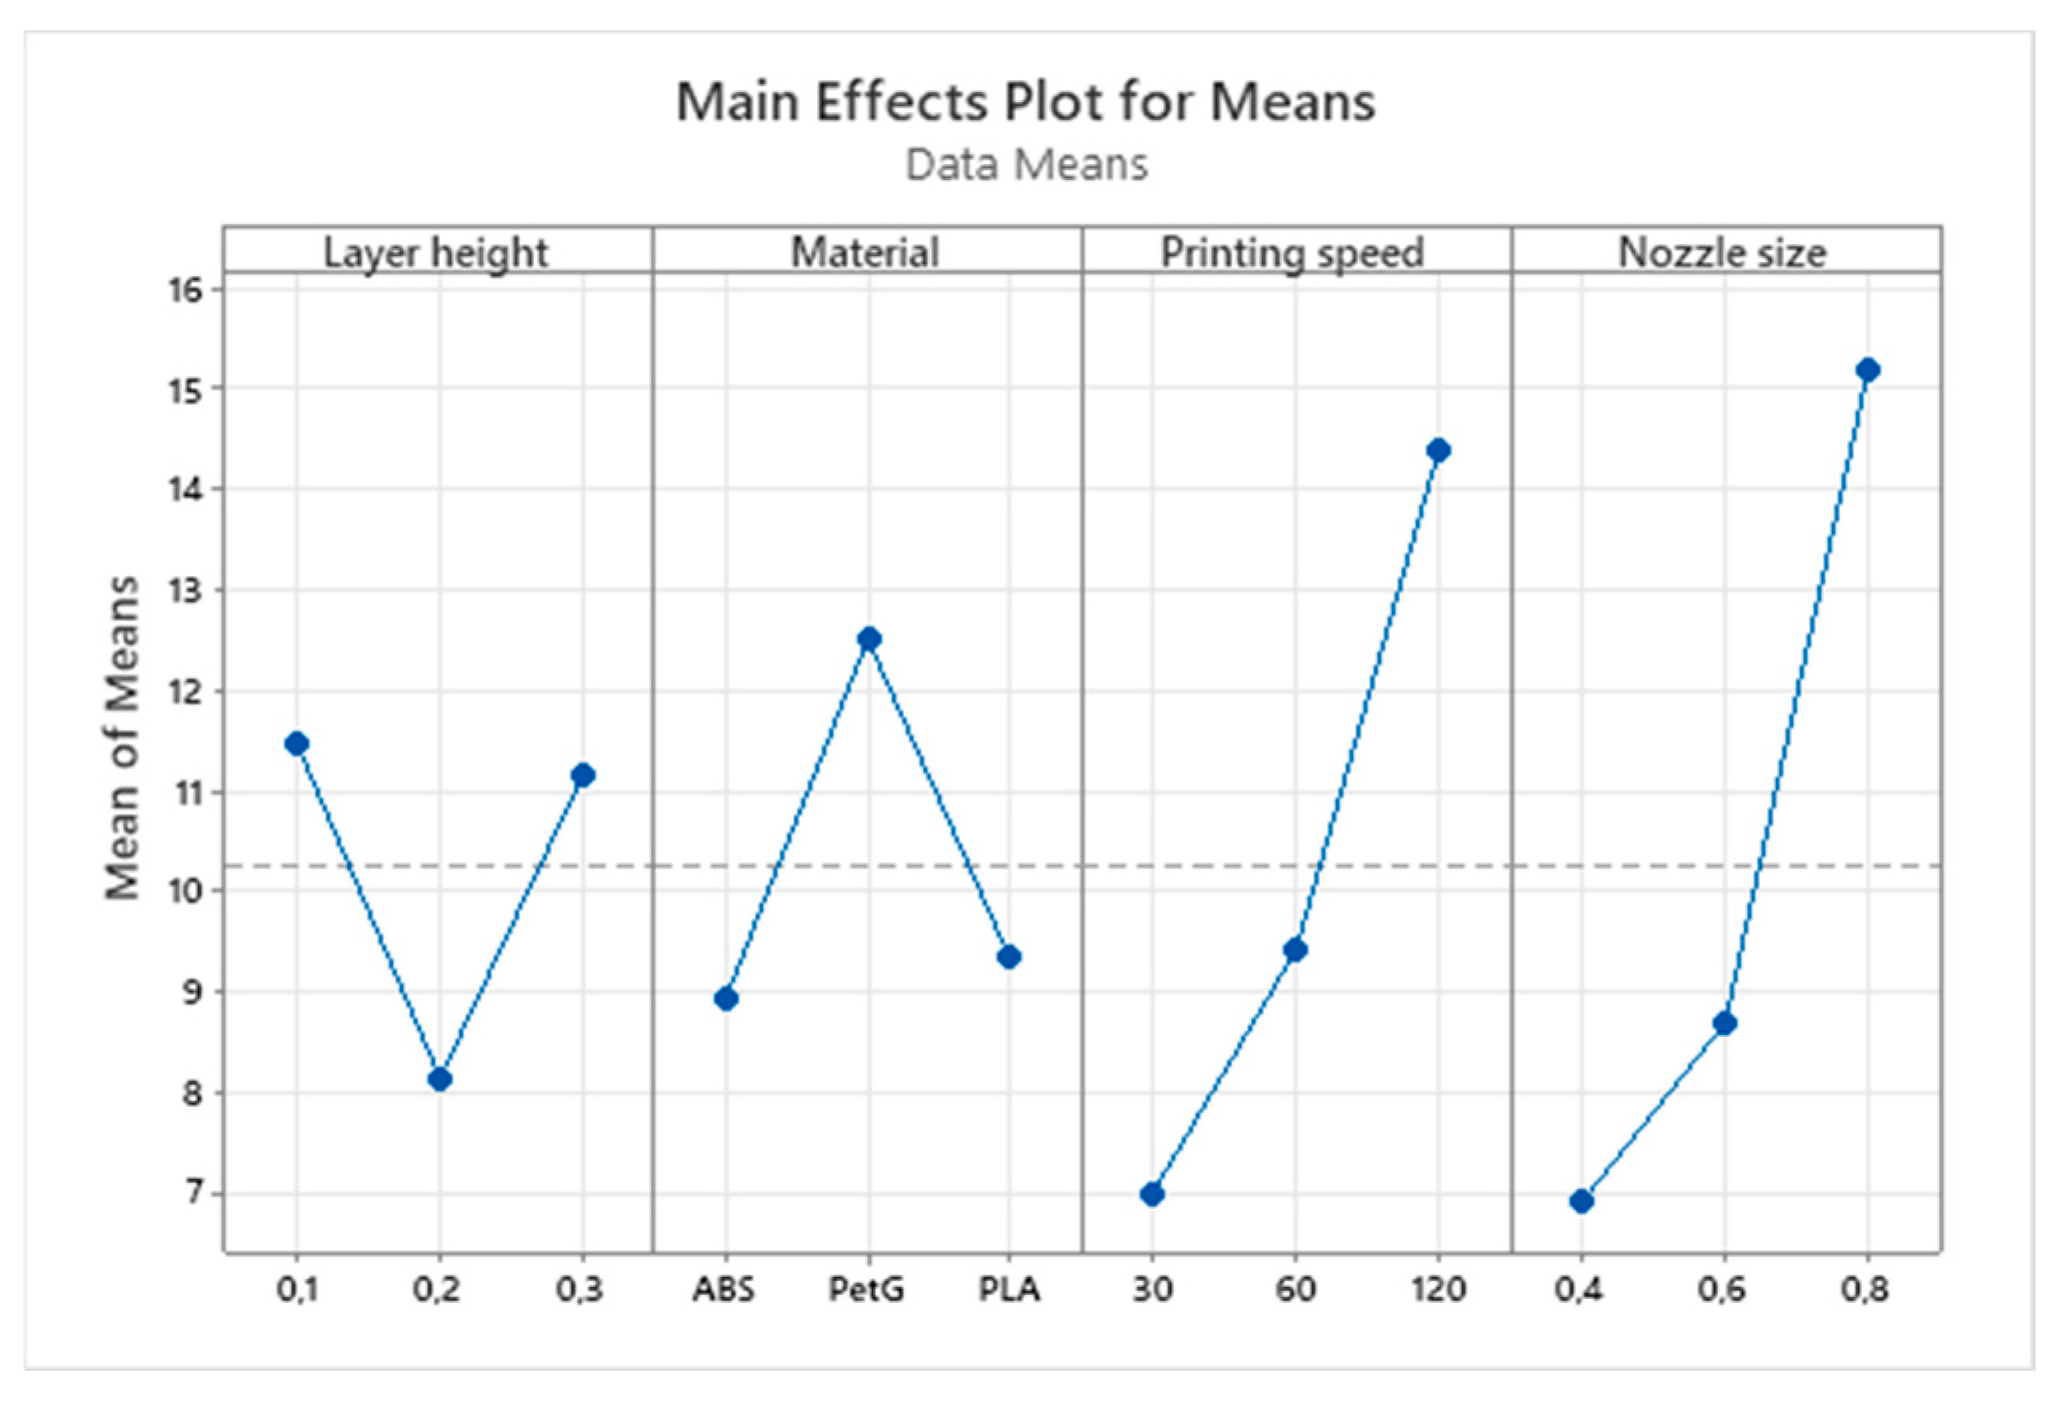
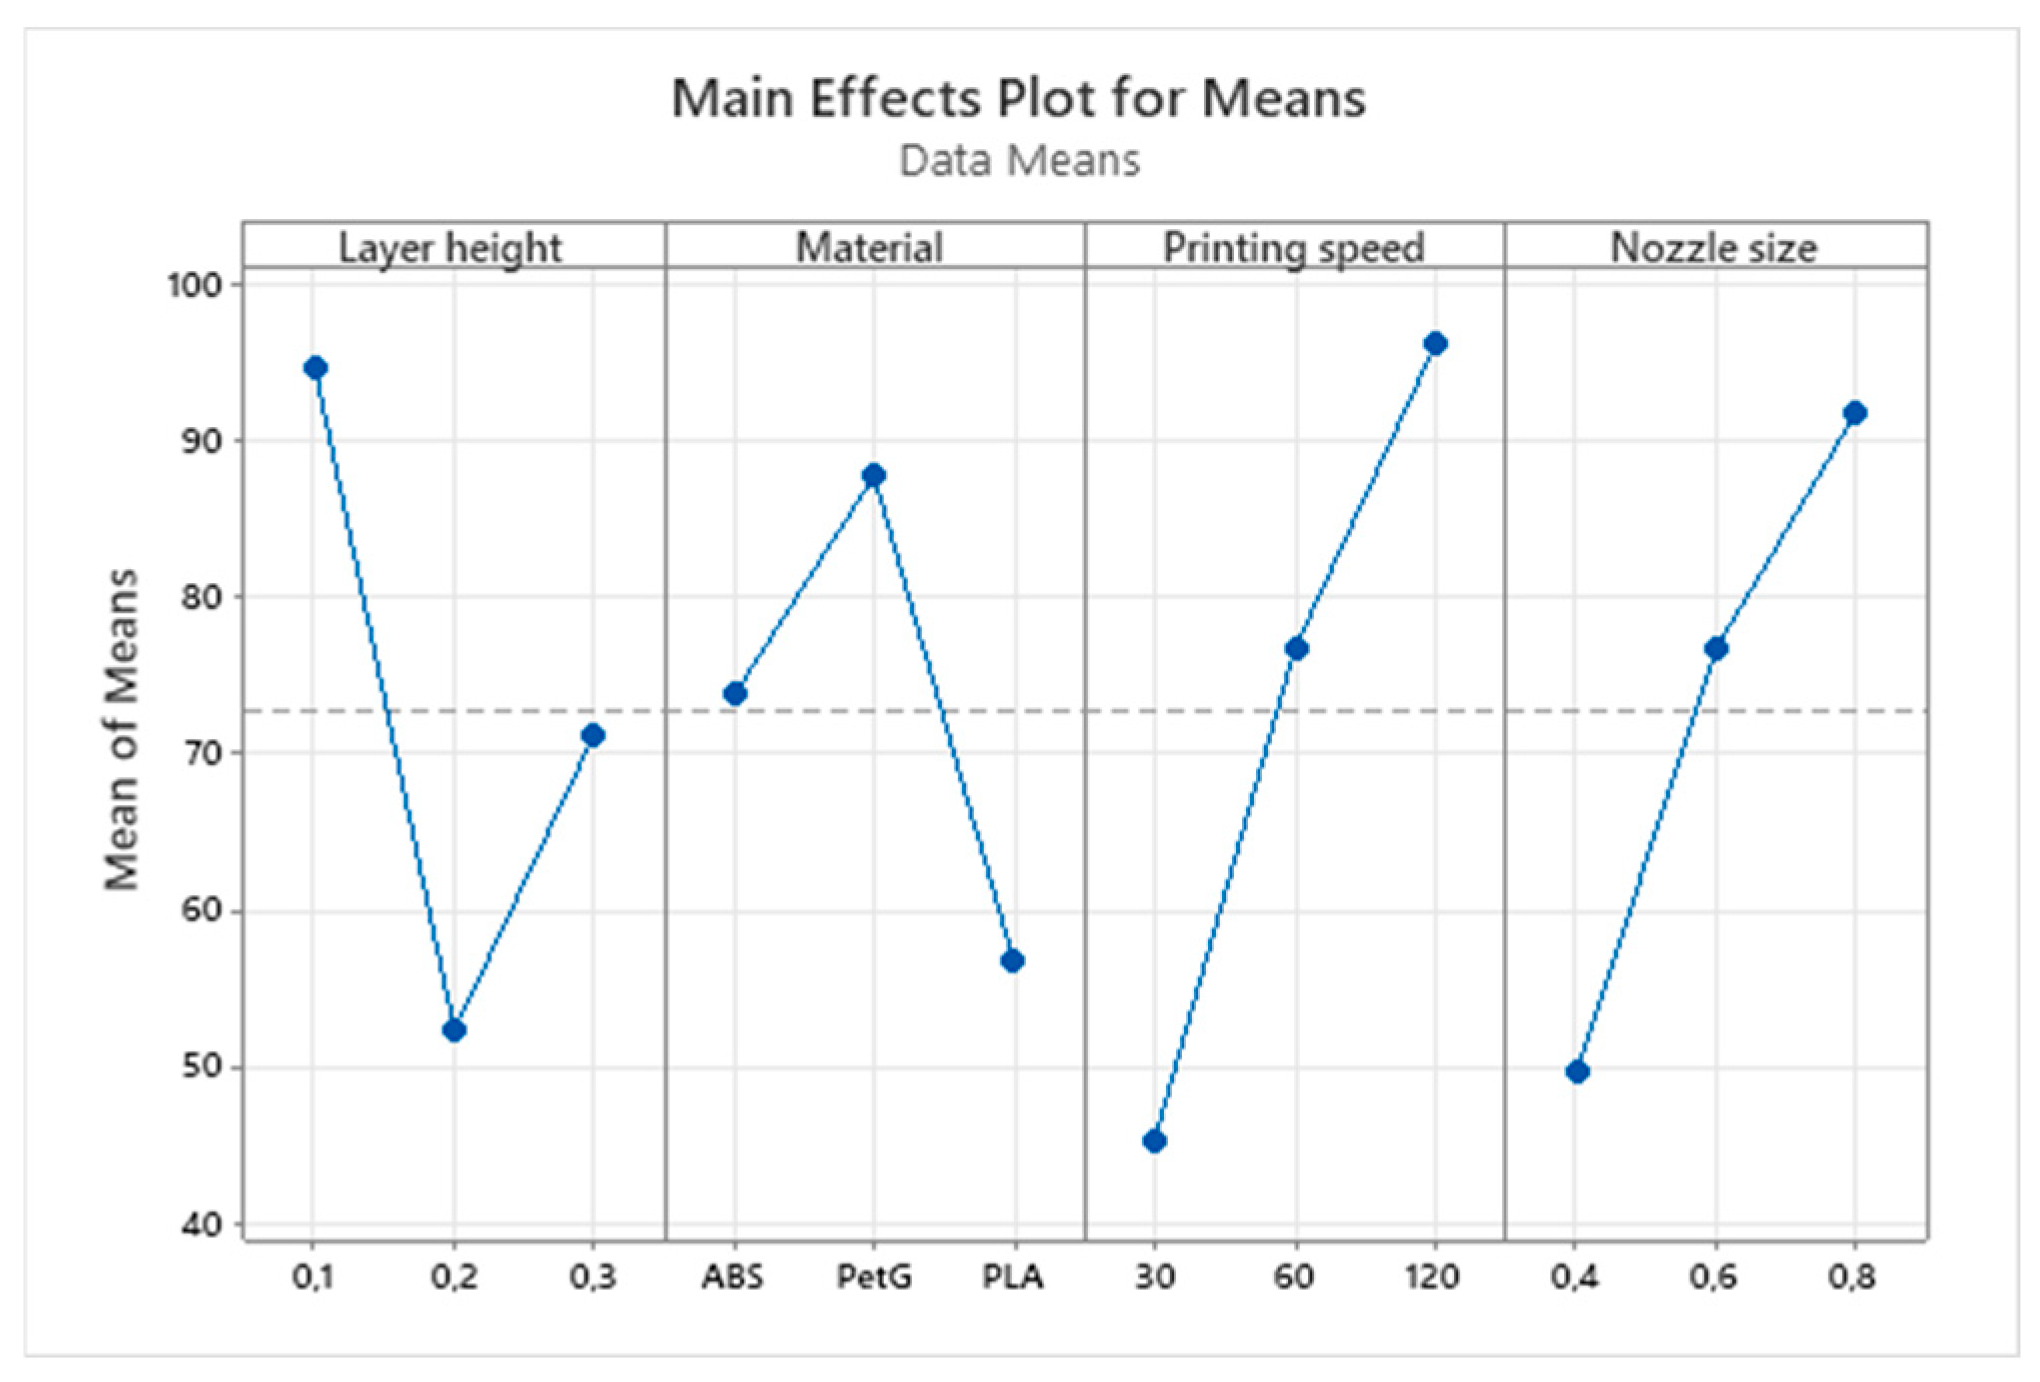
The results indicate that both arithmetic mean height (Ra) (detailed in Table 13 and Figure 12) and maximum height (Rz) (detailed in Table 14 and Figure 13), measured in [μm], are significantly affected by printing parameters, but in different ways. For Ra, the nozzle size is the most critical factor, suggesting that the precision of material deposition greatly influences the average surface roughness. A smaller nozzle size typically allows for finer control and smoother surface finishes. For Rz, printing speed is the dominant factor. Higher printing speeds can lead to increased surface irregularities due to less-controlled material deposition and rapid cooling, which might not allow the material to settle uniformly.
Table 13.
Response table for means: roughness Ra in [μm] versus layer height; material; print speed; nozzle.
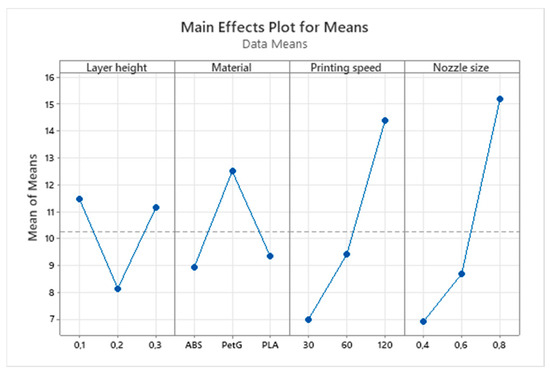
Figure 12.
Main effect plot for means Ra.
Table 14.
Response table for means: roughness Rz in [μm] versus layer height; material; print speed; nozzle.
Figure 13.
Main effect plot for means Rz.
Although within this study the quality of the surface was measured only on the top surface of the part, other researchers state that the surface quality of the walls of a 3D-printed part is highly influenced by the nozzle diameter, which produces the staircase effect [28].
3.6. Accuracy and Reliability of the Measurements
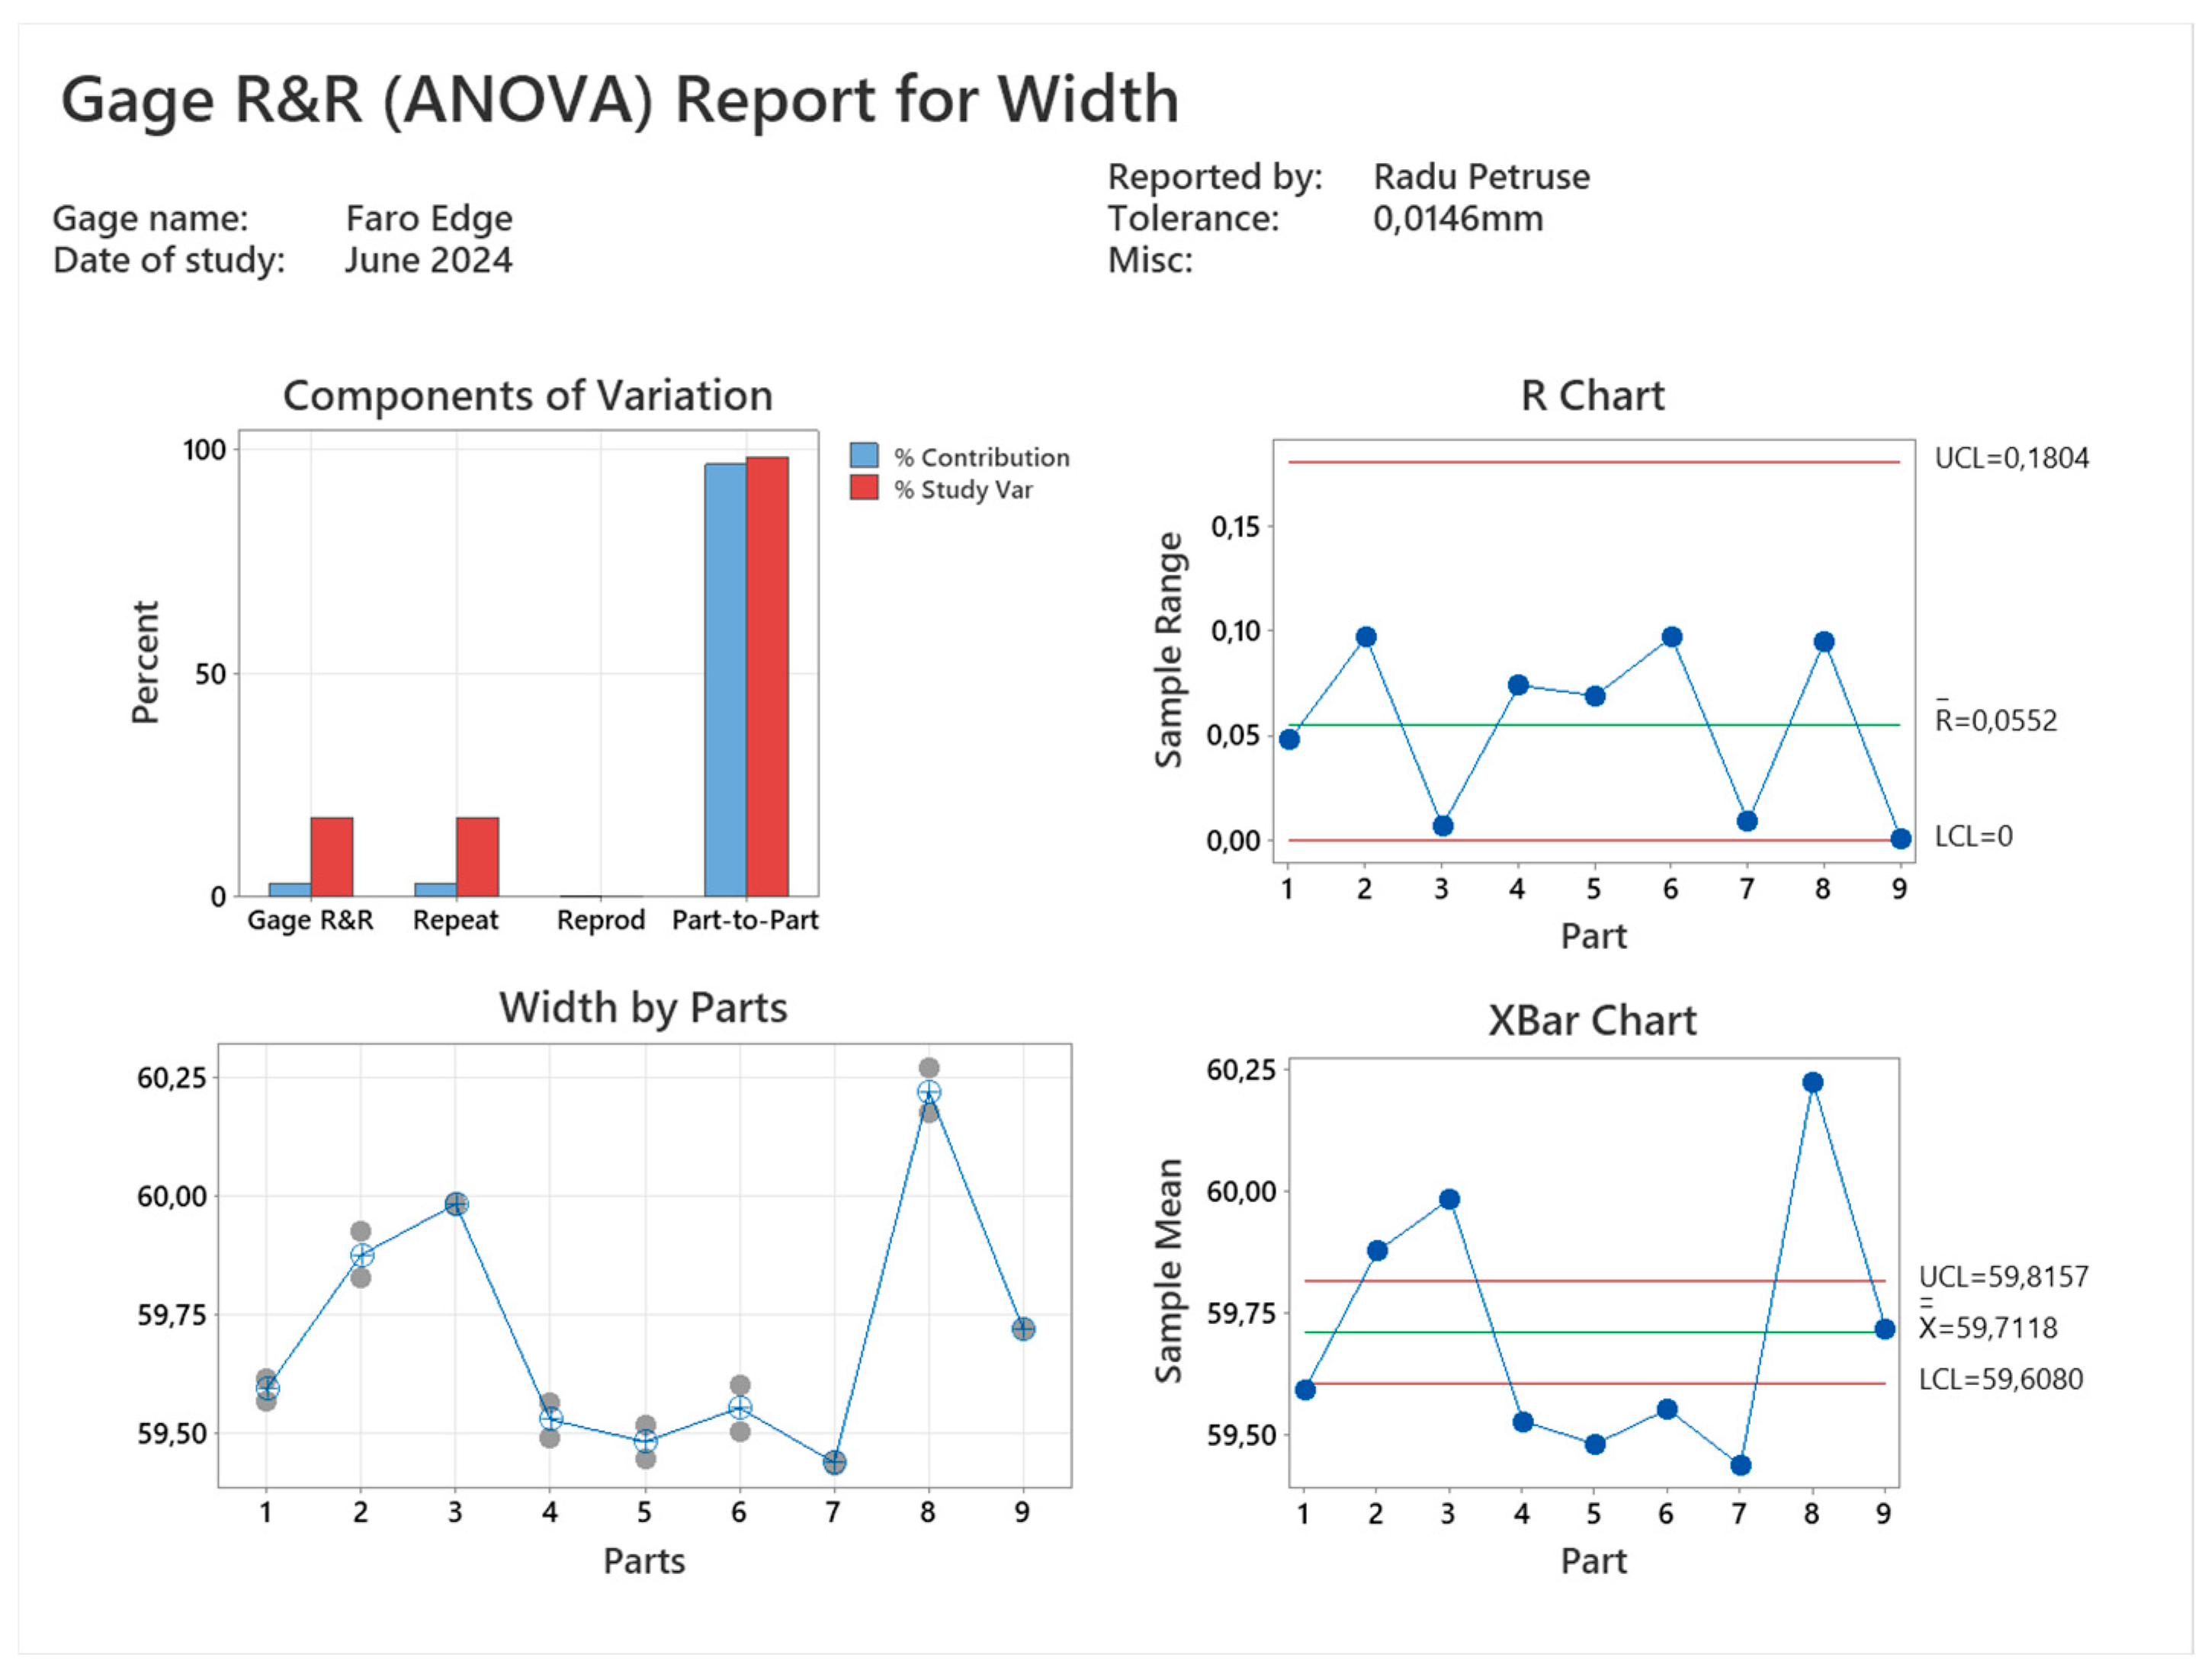
In order to ensure the accuracy and reliability of the measurements conducted in this study, a Gage Repeatability and Reproducibility (Gage R&R) study was performed using the ANOVA method. A Gage R&R study is a vital tool for identifying and quantifying the different sources of variation within a measurement system, which includes the measurement instrument, the personnel involved, and the items being measured.
The % contribution of Gage R&R quantifies the proportion of total variation that is due to the measurement system. For a robust and reliable measurement system, this % contribution should be less than 9%. In our study, the Gage R&R % contribution was calculated to be 3.16%, well within the acceptable range, indicating that the measurement system used was highly reliable. The Response by Part analysis looks at how each point represents at least one measurement of that part by the operator. Variations in the scatter of these points may suggest part bias, but in our case, the analysis confirmed that the measurement system was sufficiently accurate to support this study’s findings (Figure 14).

Figure 14.
Gage R&R report.
These Gage R&R studies’ outcomes reaffirm the validity of our measurement process, ensuring that the reported results are accurate and that the measurement system’s contribution to overall variation is minimal.
3.7. Case Study
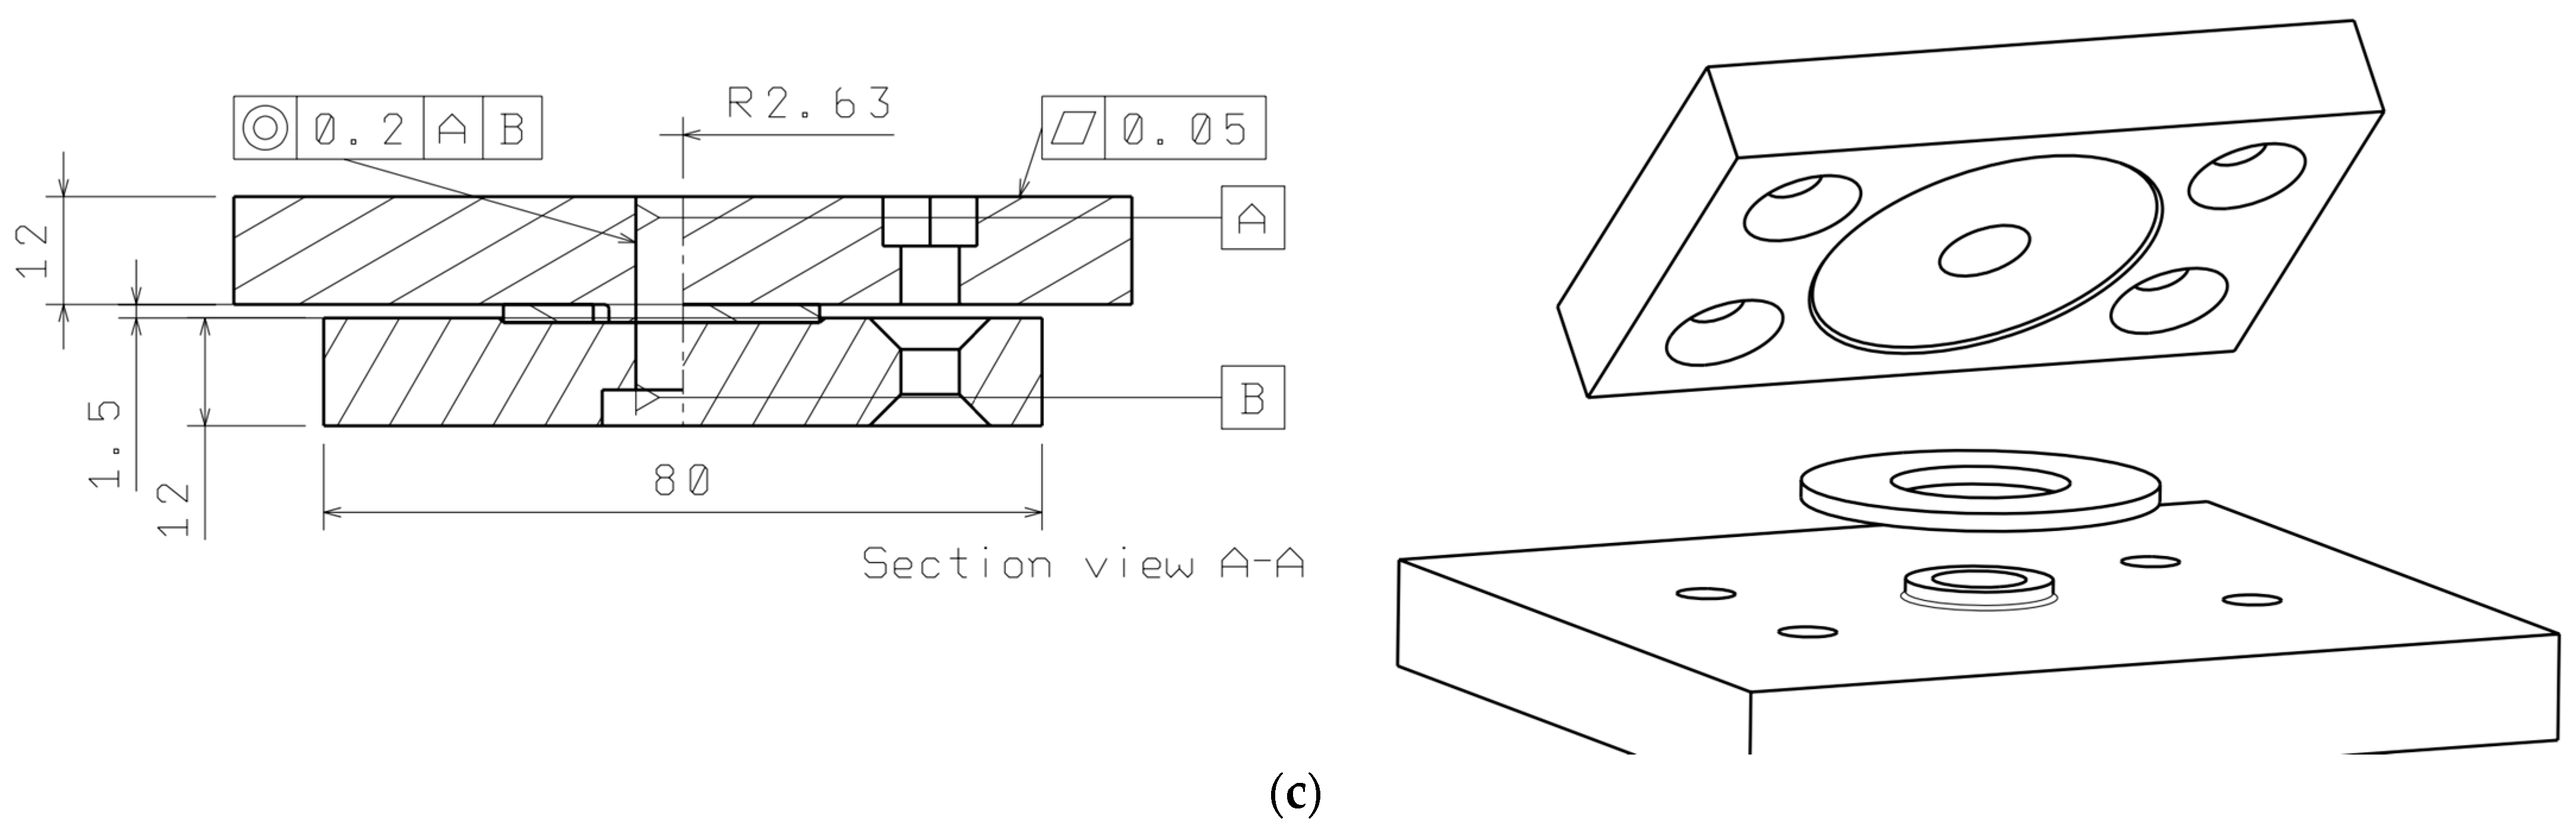
To validate the practical application of the research findings, a fixture device for a texture analyser was fabricated using FDM technology. The design of this fixture required the upper plate to be installed in two different positions (Figure 15a,b), with or without a retaining ring. This made the concentricity and cylindricity of the central hole from the three different components into a critical tolerance, along with the flatness deviation required to precisely orient the device on the texture analyser (Figure 15c).
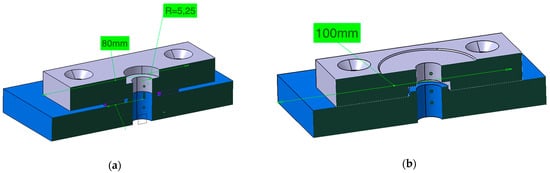
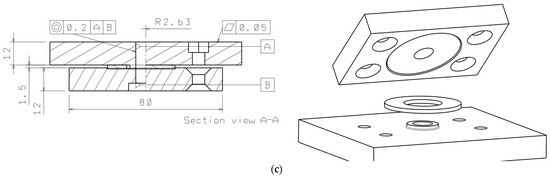
Figure 15.
Texture analyser fixture device (a) device assembled in configuration 1; (b) device assembled in configuration 2; (c) technical drawing of the device assembled in configuration 1 (dimensions are represented in [mm]).
Given the stringent requirements, it was essential that the fabricated device met concentricity tolerances for the central hole and flatness tolerances for optimal functionality. The optimal parameters identified from the flatness measurements (Table 4 and Table 5 and Figure 5) were combined with those from the cylinder’s dimensional deviation analysis (Table 10 and Figure 9). Specifically, the chosen parameters for the fabrication were the following: a layer height of 0.2 mm, PLA as the material, a print speed of 30 mm/s, and a nozzle size of 0.6 mm. By selecting these parameters, it was demonstrated that depending on which geometrical and dimensional deviation was prioritized for minimization, the optimal settings identified in this study could be effectively combined to enhance the accuracy of FDM additive-manufactured parts.
As illustrated in Figure 16, the fabricated fixture device conformed to the required specifications and was successfully installed on the texture analyser without compromising the device’s original capabilities. This case study demonstrates the feasibility of using optimized FDM parameters for producing components that meet industrial precision standards.
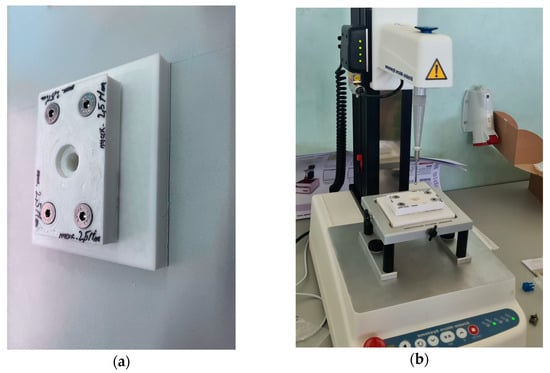
Figure 16.
Texture analyser fixture device’s physical assembly (a) and installation (b).
This research underscores the potential of FDM additive manufacturing for industrial applications, particularly in producing functional components that meet stringent tolerance requirements. By optimizing key printing parameters such as layer height, print speed, and nozzle size, it is possible to achieve high levels of accuracy and consistency in critical dimensions and geometries. This makes FDM technology not only suitable for prototyping, but also for manufacturing end-use components that must adhere to specific industrial standards. The successful application of the findings to fabricate a functional fixture device for a texture analyser further validates FDM as a viable solution for producing complex and precise parts in a cost-effective and time-efficient manner. This capability extends the utility of FDM from merely a prototyping tool to a valuable production method in various industries where precision and customization are crucial.
4. Conclusions
This study investigates the geometrical and dimensional deviations in FDM additive manufacturing and reveals critical insights into the optimization of printing parameters and the use of different materials to minimize geometrical and dimensional deviations. The Taguchi method proved useful in identifying the significant influence of print speed, nozzle size, material, and layer height on the flatness deviations, with the optimal settings being established for enhanced surface quality. Perpendicularity and parallelism deviations were predominantly influenced by layer height and print speed, respectively, emphasizing the importance of parameter optimization for geometric fidelity. Furthermore, nozzle size emerged as a decisive factor affecting cylindricity and spherical form deviations, where larger sizes compromised precision. Dimensional deviations were notably impacted by nozzle size and layer height, indicating a delicate balance between these parameters for accurate dimensions. Surface roughness measurements, Ra and Rz, confirmed the dependency on print speed and nozzle size, with slower speeds and smaller nozzles yielding superior finishes.
In conclusion, our study reveals that the commonly held belief in the superiority of lower printing speeds, smaller nozzle diameters, and reduced layer heights in FDM printing does not hold universally. It has been established that optimal printing parameters are highly contingent on the specific geometrical demands. This nuanced understanding necessitates a more tailored approach to parameter selection to achieve the desired precision and quality. Furthermore, further investigation into the impact of slicing software choices on the outcome of printed parts is needed, as it holds considerable promise for refining FDM technology. The insights gained from this study are poised to make a substantial contribution to the field of precision manufacturing and to the application of FDM printing in producing parts that meet stringent quality standards.
Author Contributions
Conceptualization, R.E.P.; methodology, R.E.P. and C.S.; software, R.E.P. and C.S.; validation, R.E.P. and C.S.; formal analysis, R.E.P. and C.S.; investigation, R.E.P. and C.S.; resources, I.B.; data curation, R.E.P. and C.S.; writing—original draft preparation, R.E.P.; writing—review and editing, R.E.P. and C.S.; visualization, I.B.; supervision, I.B.; project administration, R.E.P.; funding acquisition, R.E.P. All authors have read and agreed to the published version of the manuscript.
Funding
Project financed by Lucian Blaga University of Sibiu & Hasso Plattner Foundation research grants LBUS-IRG-2023-09.
Data Availability Statement
All data that was used for this research is available upon request.
Conflicts of Interest
The authors declare no conflict of interest. The funders had no role in the design of the study; in the collection, analysis, or interpretation of data; in the writing of the manuscript, or in the decision to publish the results.
References
- Baraheni, M.; Shabgard, M.R.; Tabatabaee, A.M.; Adhami, A.H. Practical Examining Performance of the FDM 3D Printed Parts 2022. [CrossRef]
- Robles-Lorite, L.; Dorado Vicente, R.; Torres-Jiménez, E.; García Collado, A.J. Influence of Slicing Strategy on FFF Parts Dimensional Deviations. Key Eng. Mater. 2023, 959, 57–63. [Google Scholar] [CrossRef]
- Tunçel, O. The Influence of the Raster Angle on the Dimensional Accuracy of FDM-Printed PLA, PETG, and ABS Tensile Specimens. Eur. Mech. Sci. 2024, 8, 11–18. [Google Scholar] [CrossRef]
- Abas, M.; Habib, T.; Noor, S.; Salah, B.; Zimon, D. Parametric Investigation and Optimization to Study the Effect of Process Parameters on the Dimensional Deviation of Fused Deposition Modeling of 3D Printed Parts. Polymers 2022, 14, 3667. [Google Scholar] [CrossRef]
- He, C.; Okwudire, C. A Versatile Point Cloud Registration Method for Quantifying Geometric Deviation in Additive Manufacturing. In Volume 1: Additive Manufacturing; Advanced Materials Manufacturing; Biomanufacturing; Life Cycle Engineering, Proceedings of the ASME 2023 18th International Manufacturing Science and Engineering Conference, New Brunswick, NJ, USA, 12–16 June 2023; American Society of Mechanical Engineers: New York, NY, USA, 2023; p. V001T01A029. [Google Scholar]
- Cappellini, C.; Borgianni, Y.; Maccioni, L.; Nezzi, C. The Effect of Process Parameters on Geometric Deviations in 3D Printing with Fused Deposition Modelling. Int. J. Adv. Manuf. Technol. 2022, 122, 1763–1803. [Google Scholar] [CrossRef]
- Babu, G.D.; Mounika, G.; Sai, N.V. Optimization of 3D Printer Parameters for Geometrical Accuracy Using CMM Measurements. AIP Conf. Proc. 2022, 2653, 030009. [Google Scholar] [CrossRef]
- Ekinci, B.; Ehrmann, A. Influence of Printing Parameters on the Dimensional Accuracy of Concave/Convex Objects in FDM Printing. Eng. Proc. 2022, 31, 40. [Google Scholar] [CrossRef]
- Gaikwad, S.R.; Pawar, N.H.; Sapkal, S.U. Comparative Evaluation of 3D Printed Components for Deviations in Dimensional and Geometrical Features. Mater. Today Proc. 2022, 59, 297–304. [Google Scholar] [CrossRef]
- Jadayel, M.; Khameneifar, F. Improving Geometric Accuracy of 3D Printed Parts Using 3D Metrology Feedback and Mesh Morphing. J. Manuf. Mater. Process. 2020, 4, 112. [Google Scholar] [CrossRef]
- Matúš, M.; Križan, P.; Beniak, J.; Ploskuňáková, L. Effect of Software for FDM Additive Manufacturing on Geometric Accuracy and Print Quality. Glob. J. Eng. Technol. Adv. 2022, 13, 110–120. [Google Scholar] [CrossRef]
- Deswal, S.; Narang, R.; Chhabra, D. Modeling and Parametric Optimization of FDM 3D Printing Process Using Hybrid Techniques for Enhancing Dimensional Preciseness. Int. J. Interact. Des. Manuf. IJIDeM 2019, 13, 1197–1214. [Google Scholar] [CrossRef]
- Yadav, M.; Kaushik, A.; Garg, R.K.; Yadav, M.; Chhabra, D.; Rohilla, S.; Sharma, H. Enhancing Dimensional Accuracy of Small Parts through Modelling and Parametric Optimization of the FDM 3D Printing Process Using GA-ANN. In Proceedings of the 2022 International Conference on Computational Modelling, Simulation and Optimization (ICCMSO), Pathum Thani, Thailand, 23–25 December 2022; pp. 89–94. [Google Scholar]
- Sharma, P.; Vaid, H.; Vajpeyi, R.; Shubham, P.; Agarwal, K.M.; Bhatia, D. Predicting the Dimensional Variation of Geometries Produced through FDM 3D Printing Employing Supervised Machine Learning. Sens. Int. 2022, 3, 100194. [Google Scholar] [CrossRef]
- Min, K.-E.; Jang, J.-W.; Shin, J.; Kim, C.; Yi, S. Development of Prediction Method for Dimensional Stability of 3D-Printed Objects. Appl. Sci. 2023, 13, 11027. [Google Scholar] [CrossRef]
- Standfield, B.; Kong, Z. A 3D Convolutional Neural Networks-Based Model for High-Resolution Prediction and Compensation of Geometrical Errors of Additive Manufactured Parts. In Volume 1: Additive Manufacturing; Advanced Materials Manufacturing; Biomanufacturing; Life Cycle Engineering, Proceedings of the ASME 2023 18th International Manufacturing Science and Engineering Conference, New Brunswick, NJ, USA, 12–16 June 2023; American Society of Mechanical Engineers: New York, NY, USA, 2023; p. V001T01A022. [Google Scholar]
- Ntousia, M.; Fudos, I.; Moschopoulos, S.; Stamati, V. Predicting Geometric Errors and Failures in Additive Manufacturing. Rapid Prototyp. J. 2023, 29, 1843–1861. [Google Scholar] [CrossRef]
- Pușcașu, S.; Petruse, R.; Pascu, A.; Bondrea, I. Study Regarding the Geometrical Deviations For 3D Printed Functional Parts. In Proceedings of the 35-th Danubia Adria Symposium on Advances in Experimental Mechanics (DAS), Sinaia, Romania, 25–28 September 2018. [Google Scholar]
- Butt, J.; Bhaskar, R.; Mohaghegh, V. Investigating the Effects of Ironing Parameters on the Dimensional Accuracy, Surface Roughness, and Hardness of FFF-Printed Thermoplastics. J. Compos. Sci. 2022, 6, 121. [Google Scholar] [CrossRef]
- Li, Z.; Feng, D.; Li, B.; Xie, D.; Mei, Y. FDM Printed MXene/MnFe2O4/MWCNTs Reinforced TPU Composites with 3D Voronoi Structure for Sensor and Electromagnetic Shielding Applications. Compos. Sci. Technol. 2023, 231, 109803. [Google Scholar] [CrossRef]
- Pămărac, R.G.; Petruse, R.E. Study Regarding the Optimal Milling Parameters for Finishing 3D Printed Parts from ABS and PLA Materials. Acta Univ. Cibiniensis Tech. Ser. 2018, 70, 66–72. [Google Scholar] [CrossRef]
- Chaudhary, K.; Suniya, N.K.; Rakecha, R.K.; Dave, B. Parametric Study of FDM Manufactured Parts to Analyze Dimensional Accuracy. In Recent Trends in Mechanical Engineering; Maurya, A., Srivastava, A.K., Jha, P.K., Pandey, S.M., Eds.; Lecture Notes in Mechanical Engineering; Springer Nature Singapore: Singapore, 2023; pp. 719–726. ISBN 978-981-19770-8-4. [Google Scholar]
- Boparai, K.S.; Singh, R. 13.29–Wear Analysis of LDPE Composite Parts Fabricated by FDM. In Comprehensive Materials Processing, 2nd ed.; Hashmi, S., Ed.; Elsevier: Oxford, UK, 2024; pp. 628–640. ISBN 978-0-323-96021-2. [Google Scholar]
- Rizea, A.D.; Anghel, D.C.; Iordache, D.M. Study of the Deviation of Shape for the Parts Obtained by Additive Manufacturing. IOP Conf. Ser. Mater. Sci. Eng. 2021, 1009, 012050. [Google Scholar] [CrossRef]
- Silva, R.; Azevedo, N. Dimensional Precision of Abs Parts Manufactured By Additive Manufacturing in FDM Technology. In Proceedings of the 8th World Congress on Mechanical, Chemical, and Material Engineering (MCM’22), Prague, Czech Republic, 31 July–2 August 2022. [Google Scholar]
- Zhou, C.; Han, T. Research on the Influencing Factors of FDM 3D Printing Accuracy. J. Phys. Conf. Ser. 2021, 1838, 012027. [Google Scholar] [CrossRef]
- Accuracy Specifications for the Legacy Gage FaroArm. Available online: https://knowledge.faro.com/Hardware/Legacy-Hardware/Legacy-Gage/Accuracy_Specifications_for_the_Legacy_Gage_FaroArm (accessed on 6 August 2024).
- Sai, P.C.; Yeole, S.N. Fused Deposition Modeling-Insights. In Proceedings of the International Conference on Advances in Design and Manufacturing ICAD&M, Tiruchirappalli, India, 5–7 December 2014. [Google Scholar]


Disclaimer/Publisher’s Note: The statements, opinions and data contained in all publications are solely those of the individual author(s) and contributor(s) and not of MDPI and/or the editor(s). MDPI and/or the editor(s) disclaim responsibility for any injury to people or property resulting from any ideas, methods, instructions or products referred to in the content. |
© 2024 by the authors. Licensee MDPI, Basel, Switzerland. This article is an open access article distributed under the terms and conditions of the Creative Commons Attribution (CC BY) license (https://creativecommons.org/licenses/by/4.0/).