Abstract
Cyanobacterial outgrowths are naturally occurring processes in eutrophic aquatic ecosystems. Furthermore, as a result of climate change and anthropogenic pollution, cyanobacteria harmful algal blooms (CyanoHABs) are expanding worldwide. CyanoHABs are considered a threat to human health and environment due to the production of potent toxic substances, but at the same time, valuable products can be obtained from these microorganisms. The main objective of this study was to test straightforward and cost-effective methods to reduce the toxin content of cyanobacterial biomass for the exploitation of this important biological resource. To carry out this study, lyophilized or hydrated biomass from microcystin-LR (MC-LR) producing Microcystis aeruginosa and cylindrospermopsin (CYN) producing Chrysosporum ovalisporum strains were subjected to the following treatments: (1) thermal (50 °C); (2) ultraviolet (UV) radiation; (3) ozone; and (4) sunlight, for periods varying between 2 and 12 h. MC-LR and CYN concentrations were quantified by LC-MS and compared between experimental groups. The results show a significant reduction in the amount of MC-LR in M. aeruginosa biomass (lyophilized and hydrated) exposed to sunlight. Since no other treatment reduced MC-LR in M. aeruginosa biomass, this molecule was demonstrated to be very stable. Regarding CYN, the concentration of this toxin in C. ovalisporum biomass was significantly reduced with the exposure to UV radiation, to approximately 51% of the initial concentration after 2 h of exposure; 86% reduction after 5 h of exposure; and 77% reduction after 12 h of exposure. Overall, this study demonstrates that the toxicity of cyanobacterial biomass can be reduced by employing environmentally friendly and cost-effective treatments with sunlight and UV radiation.
1. Introduction
Cyanobacteria are known for being the first photosynthetic microorganisms and have been playing an important role in the production of oxygen on Earth in the last 3 billion years [1]. Cyanobacteria are also known as blue-green algae and can be found in a variety of environments from freshwaters and oceans to soil and bare rock [2]. Eutrophication is now recognized as one of the main factors contributing to the geographic expansion of cyanobacteria and the occurrence of toxic strains [3]. Although important, eutrophication is not the only factor triggering the development of cyanobacteria harmful algal blooms (CyanoHABs) and related outbreaks. Anthropogenic pressure and world temperature increase have been playing an important role in CyanoHABs expansion [4]. Among the toxins produced by cyanobacteria, microcystins (MCs) and cylindrospermopsin (CYN) are the most prevalent. These toxins can cause severe harm to animals and humans. MCs constitute the largest and most structurally diverse group of cyanobacterial toxins [5]. MCs are cyclic heptapeptides, comprising L- and D-amino acids and two variable L-amino acids in the positions X and Y of the molecule [6]. The most common congeners are microcystin-LR (MC-LR), microcystin-RR (MC-RR), and microcystin-YR (MC-YR), which have leucine (L), arginine (R), or tyrosine (Y) in positions X and Y of the molecule. The most prevalent and toxic variant is, however, MC-LR [7]. MCs are produced by different genera of cyanobacteria including Microcystis, Planktothrix, and Anabaena [8]. MCs are usually classified as hepatotoxins, since the primary target of MCs in mammals is the liver [9], but it can affect other organs including the colon, kidneys, intestines, lungs, brain, heart, and reproductive system [10]. The cyclic structure of MCs is thought to confer great chemical stability to pH and temperature and to enzymatic digestion [11,12].
Cylindrospermopsin (CYN) is a tricyclic alkaloid cytotoxin, with a molecular weight of 415 Da. The first identification and isolation date back to 1992 [13]. It is considered an emerging global threat due to the increasing distribution of its main producer, Cylindrospermopsis raciborskii [14]. CYN production has also been associated with different cyanobacteria such as Umezakia natans, Aphanizomenon sp., Raphidiopsis curvata, Lyngbya wollei, and Anabaena bergii [15]. The toxin was reported to be stable to UV light, pH, and temperature and has high solubility and mobility in water [16]. Neurotoxicity, hepatotoxicity, cytotoxicity, and carcinogenic effects have been associated with the exposure to this toxin [5,17].
Nonetheless, cyanobacteria have been recognized as important biological resources, from which biochemically active natural substances can be isolated [18]. Many biotechnological applications can be exploited, namely, in the development of novel drugs and treatment of human illnesses, food supplements, cosmetics, antibiotics, environmental friendly pesticides, or anti-fouling paints [19,20,21], and cyanotoxins at very low concentrations may have positive effects on plant growth [22]. Cyanobacterial mats also can be used in agriculture as biofertilizers, plant stimulants, and soil amendments [23] or in control of plant pests [20]. The interest in this bioresource is increasing worldwide since cyanobacteria can be obtained from the environment in abundance or can be grown in controlled environment (in bioreactors, vessels, large outdoor tanks, or indoors). Furthermore, cyanobacterial biomass obtained at an industrial scale can be used to produce biofuels, contributing to ameliorate the world energy crisis and circular economy [24]. Exopolysaccharides (EPSs) in particular, in cyanobacteria, have been identified as excellent sources of cellulose for the production of bioethanol [25]. Cyanobacteria are also very rich in nutrients (proteins, carbohydrates, sugars, lipids, and vitamins), thus being very attractive food supplements [26,27].
Nevertheless, a major bottleneck in the exploitation of cyanobacteria is the production of cyanotoxins, including MCs and CYN, by some species or strains. The discovery of methods of processing cyanobacterial biomasses, leading to a decrease in the amount of toxic compounds, may be of high interest in the exploitation of this resource and development of new products. Therefore, the aim of this study is to explore cost-effective treatments by thermal heating, ozone, sunlight, and UV exposure, to reduce the concentration of MC-LR and CYN in M. aeruginosa and C. ovalisporum biomass.
2. Materials and Methods
2.1. Biological Material
For this study, two toxin-producing cyanobacterial strains from the Blue Biotechnology and Ecotoxicology Culture Collection (LEGE-CC) [28] were used. The cyanobacteria M. aeruginosa (LEGE 91094) and C. ovalisporum (LEGE X-001) were grown in sterilized Z8 medium at 26 ± 1 °C, with a photoperiod of 14 h/10 h (light/dark) and a light intensity of 20 µmol m−2 s−1 [29]. After growing for 45 days in 20 L vessels, the cyanobacteria were collected by centrifugation, frozen at −80 °C, and lyophilized for posterior use.
2.2. Experimental Design
Experiments were carried out with lyophilized as well as hydrated material. In the first case, approximately 10 mg of lyophilized cyanobacterial biomass was homogeneously distributed in Petri dishes sealed with film, making three equal samples for each experimental condition (n = 3). For the hydrated biomass, approximately 10 mg of freeze-dried biomass was hydrated with 500 μL of ultrapure water and homogeneously distributed in each Petri dish, using three equal samples for each condition (n = 3). In both cases, cyanobacterial biomass was exposed to the following treatments: (1) thermal heating at 50 °C in an incubator; (2) UV light at 253.7 nm, 25 W intensity, using a UVC/T-AR PCR UV cabinet (Grant Instruments, Cambridgeshire, UK); (3) sunlight at environmental conditions; and (4) ozone using an O3 Waves PAT30 ozone generator (Environmental Waves, Póvoa de Varzim, Portugal). The samples were exposed for 2 h, 5 h, and 12 h, except in the case of ozone treatment, in which the biomass samples were exposed for 2.5 and 5 min. Samples without treatment were used as a control of the study.
Sunlight exposure experiments were performed on 15 and 16 July and on 11 and 12 October 2021 at facilities of CIIMAR (GPS coordinates: 41°10′39.2″ N, 8°42′03.5″ W), Matosinhos, Portugal. Conditions on the days of sampling varied according to Table 1. The information reported was collected at the weather station Pedras Rubras (Lat. 41°13′48″, N/Lon. 8°40′48″ W) and provided by the Portuguese Institute of the Atmosphere and Sea (IPMA).

Table 1.
Meteorological conditions during sunlight exposure experiments.
2.3. Extraction of Cyanotoxins
To perform the cyanotoxin extraction, the total content of each sample was transferred from the Petri dish to a 15 mL tube. Then, 6 mL of methanol 50% (v/v) was added to M. aeruginosa material for the extraction of MC-LR and 6 mL methanol 10% (v/v) to C. ovalisporum material for the extraction of CYN. The samples were then submitted to ultrasounds for 5 min, in an ice bath, and then centrifuged (4000× g, 5 min, 4 °C). The pellet was subjected to a second extraction with 2 mL of previously mentioned solvent and left in the refrigerator at 4 °C overnight. The supernatants were pooled, and total volume was measured and afterwards stored at −20 °C until analysis.
2.4. Cyanotoxins Quantification by LC-ESI-MS
The LC-MS system used to quantify the cyanotoxins was a liquid phase chromatograph alliance e2695 HPLC system (Waters, Cedex, France), coupled with a triple quadrupole spectrometry detector (Micromass® Quattro micro™ API, Waters), with electrospray (ESI) interface. The program used for data acquisition and processing was MassLynx version 4.1. The mass spectrometer was operated in positive mode, and the quantification was performed with multiple reaction monitoring (MRM). The capillary voltage was maintained at 3.5 kV; cone at 20 V; extractor at 3 V; and lens at 0.2 V. The source temperature was held at 120 °C and desolvation at 350 °C and 500 L/h. Nitrogen was used as a sheath and auxiliary gas and argon as a collision gas at a pressure of 0.5 bar. Separation of cyanotoxins was achieved on C18 hypersil gold column (100 × 4.6 mm I.D., 5 μm, Thermo Scientific, Waltham, MA, USA) kept at 45 °C, with a flow rate of 0.35 mL/min, and the injected volume was 10 μL in the loop partial mode. A gradient elution was used with mobile phase A, MeOH, and B ultrapure water, both acidified with 0.1% formic acid (10% A and 90% B for 3 min and 40% A and 60% B at 4 min during 1 min, increasing to 60% A at 7 min for 2 min, increasing to 80% A for 2 min, and returning to initial conditions at 20 min and equilibrating during 10 min). Mass parameters were optimized with a standard solution and extracts of cyanobacteria that produce cyanotoxins CYN and MC-LR, all injected in the positive polarity mode, in full scan (30–1500 m/z) and MRM mode. Mass transitions, specific for each toxin, as well as cone and collision energy voltages, are presented in Table S5. The target compounds were CYN and MC-LR. The standards and samples were injected in duplicate, and in each set of 10 samples, a blank solution and two standard solutions of different concentration were introduced. Quantification was performed by external calibration curve.
All the standards were injected individually and then as a standard mixture with a concentration interval from 5 ppb to 500 ppb. Microcystin-LR (CRM-00-MC-LR, Lot 19-001, 96% purity) and CYN (CRM-03-CYN, Lot 16-001, 99% purity) standards were supplied by Cifga (Lugo, Spain).
2.5. Statistical Analysis
Data were first analyzed for the presence of outliers. One outlier was identified and discarded from the data (Figures S1–S4, Tables S1–S5). Next, the normal distribution of data was assessed by Shapiro–Wilk test. Data with normal distribution and equal variance (p values higher than 0.05) were followed by parametric analysis (ANOVA) and Dunnett’s multiple comparison tests. Data with unequal variance were analyzed by Brown–Forsythe Welch’s ANOVA followed by unpaired t-test. Differences between control and experimental groups were set at p < 0.05. All statistical analyses were carried out with the GraphPad Prism software (version 9). Values are presented as mean ± standard deviation (SD).
3. Results
Toxins MC-LR and CYN were extracted from cyanobacterial biomass after treatment with sunlight, UV, ozone, and heat (50 °C). Toxins were subsequently detected and quantified by liquid chromatography–mass spectrometry (LC-MS). Representative chromatograms of this analysis are shown in Figure 1 and Figure 2 and Figures S1–S4 and Table S5.

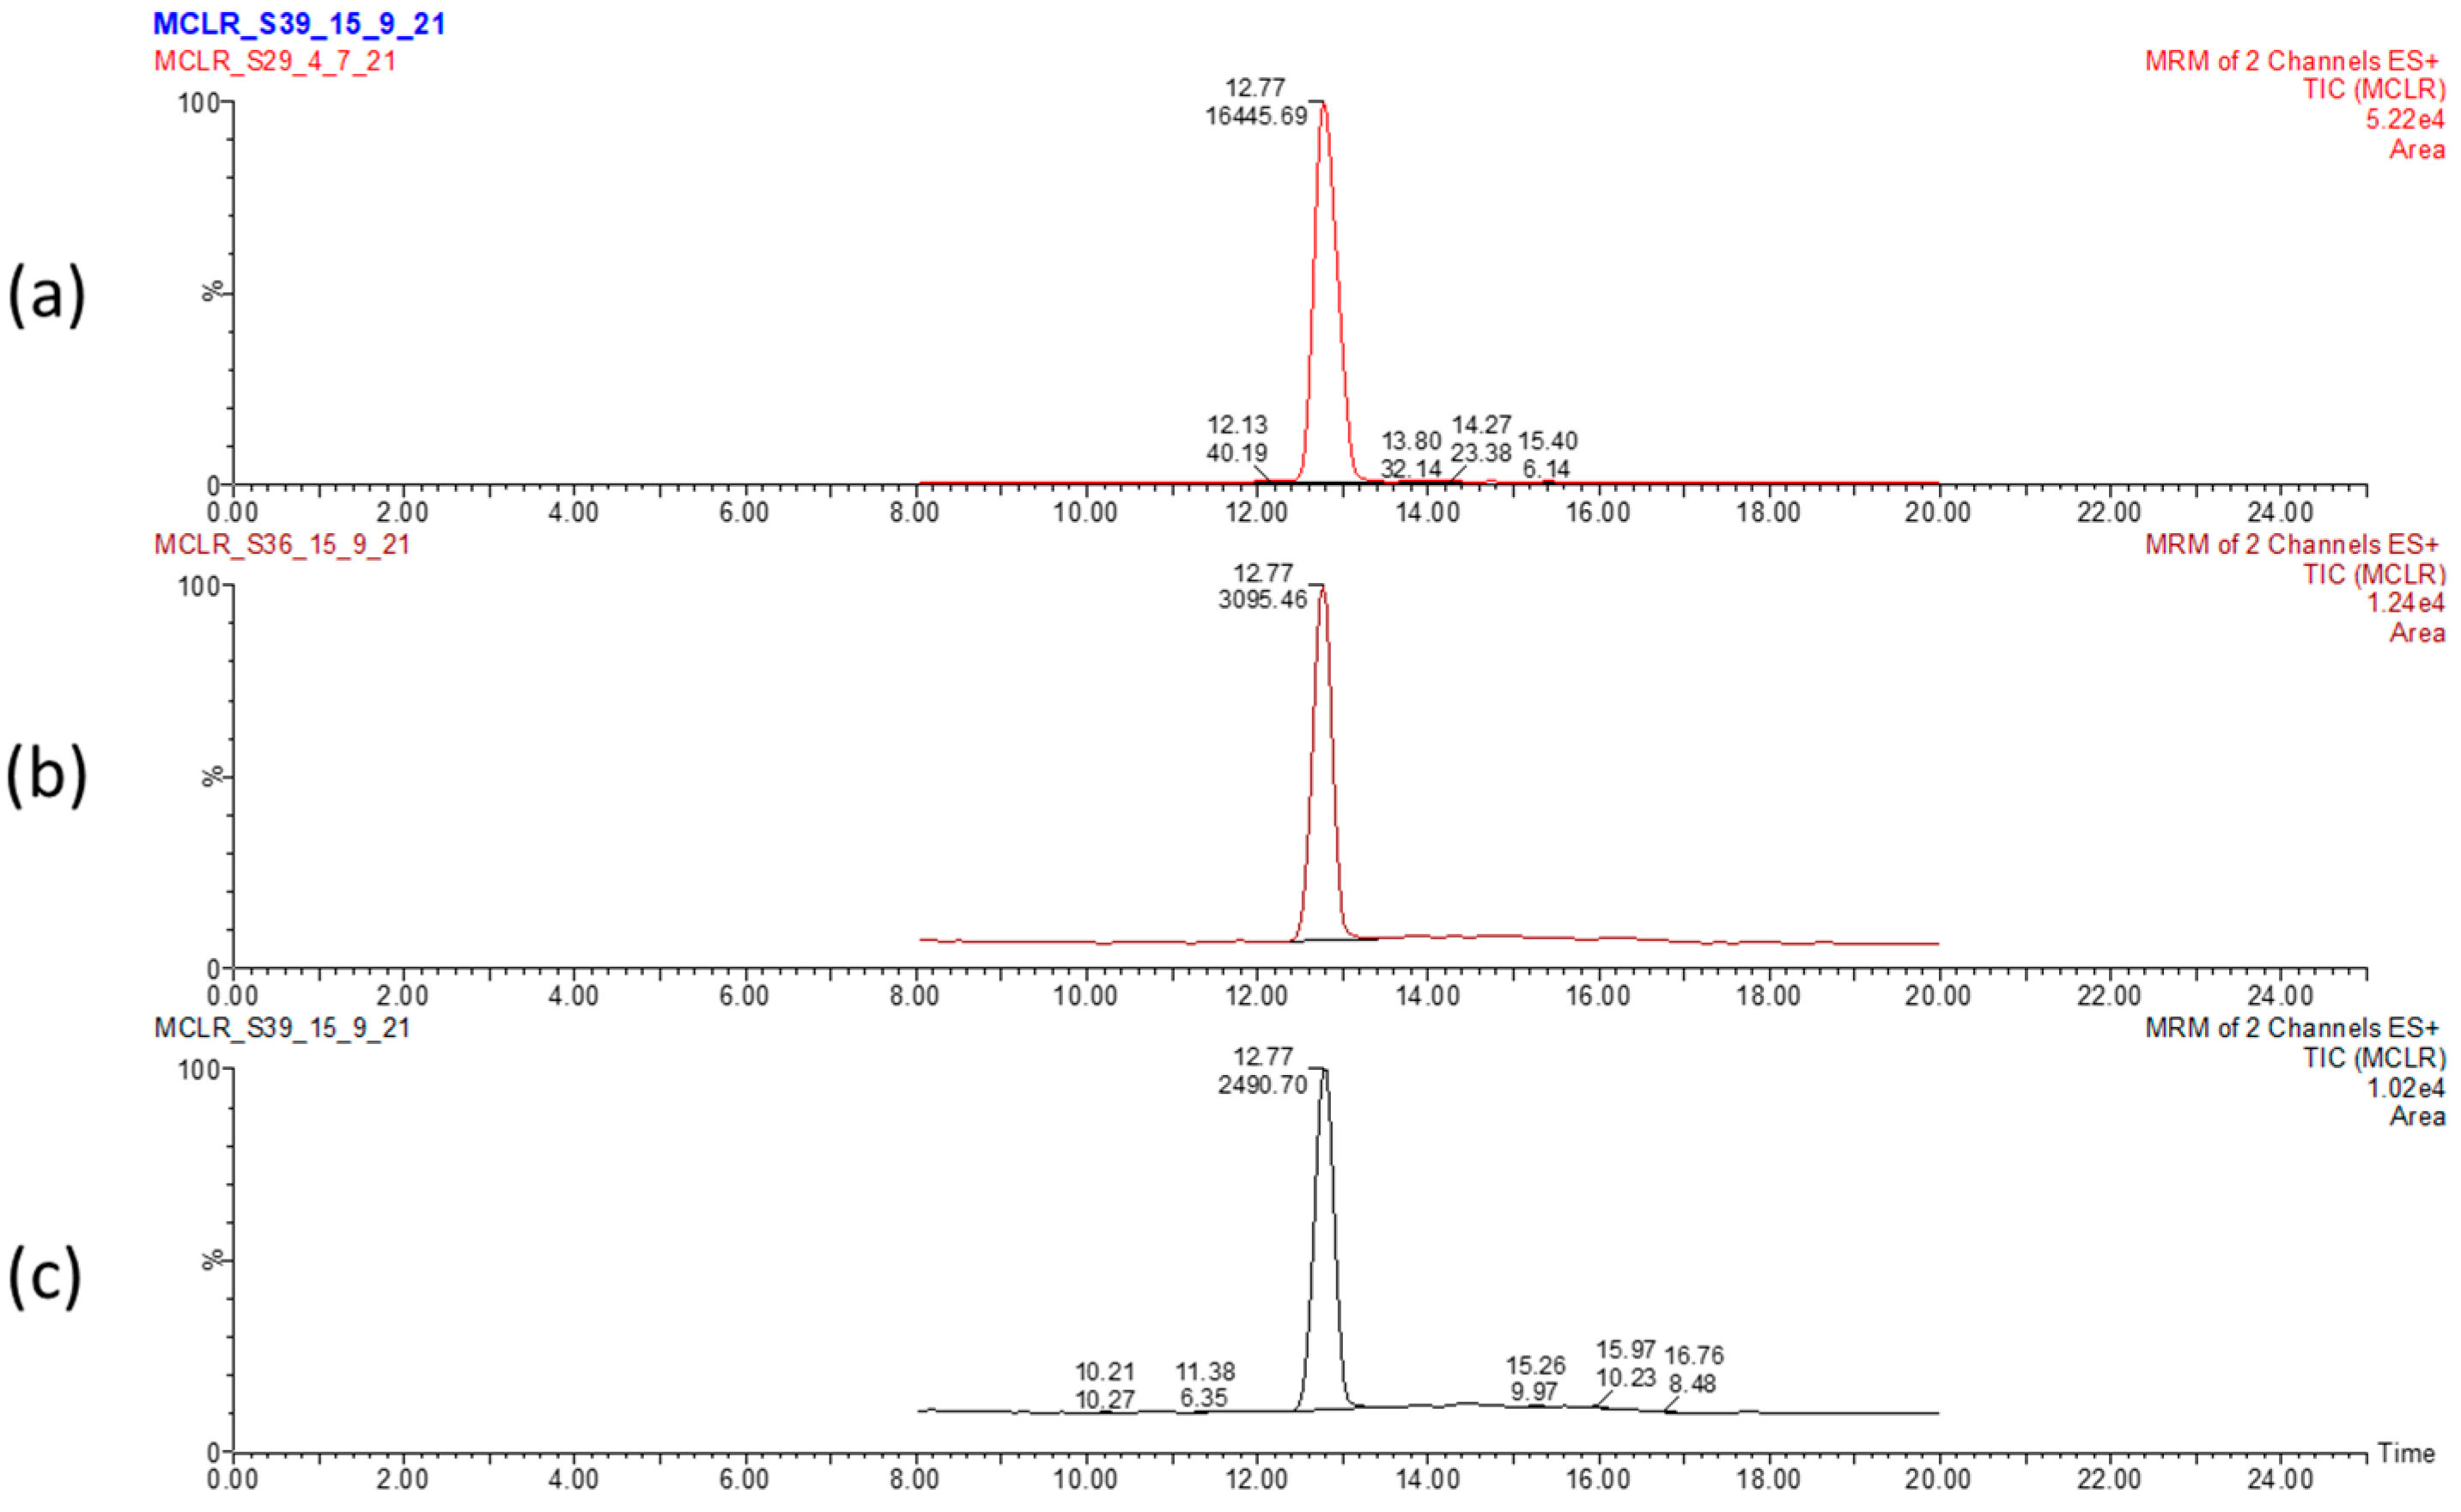
Figure 1.
LC-MS chromatogram displaying the elution time of MC-LR and peak area in dried Microcystis aeruginosa biomass. Control biomass (a) and sunlight 5 h- (b) and sunlight 12 h-treated (c) biomasses. Values correspond to elution time (12.17 min) and relative abundance of MC-LR.
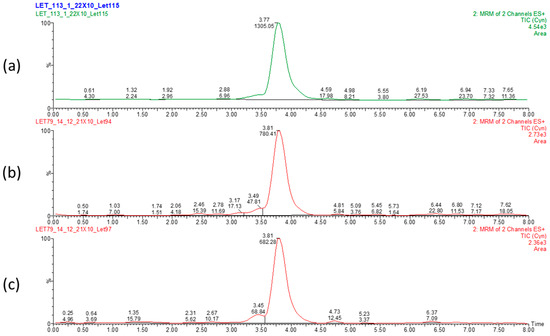
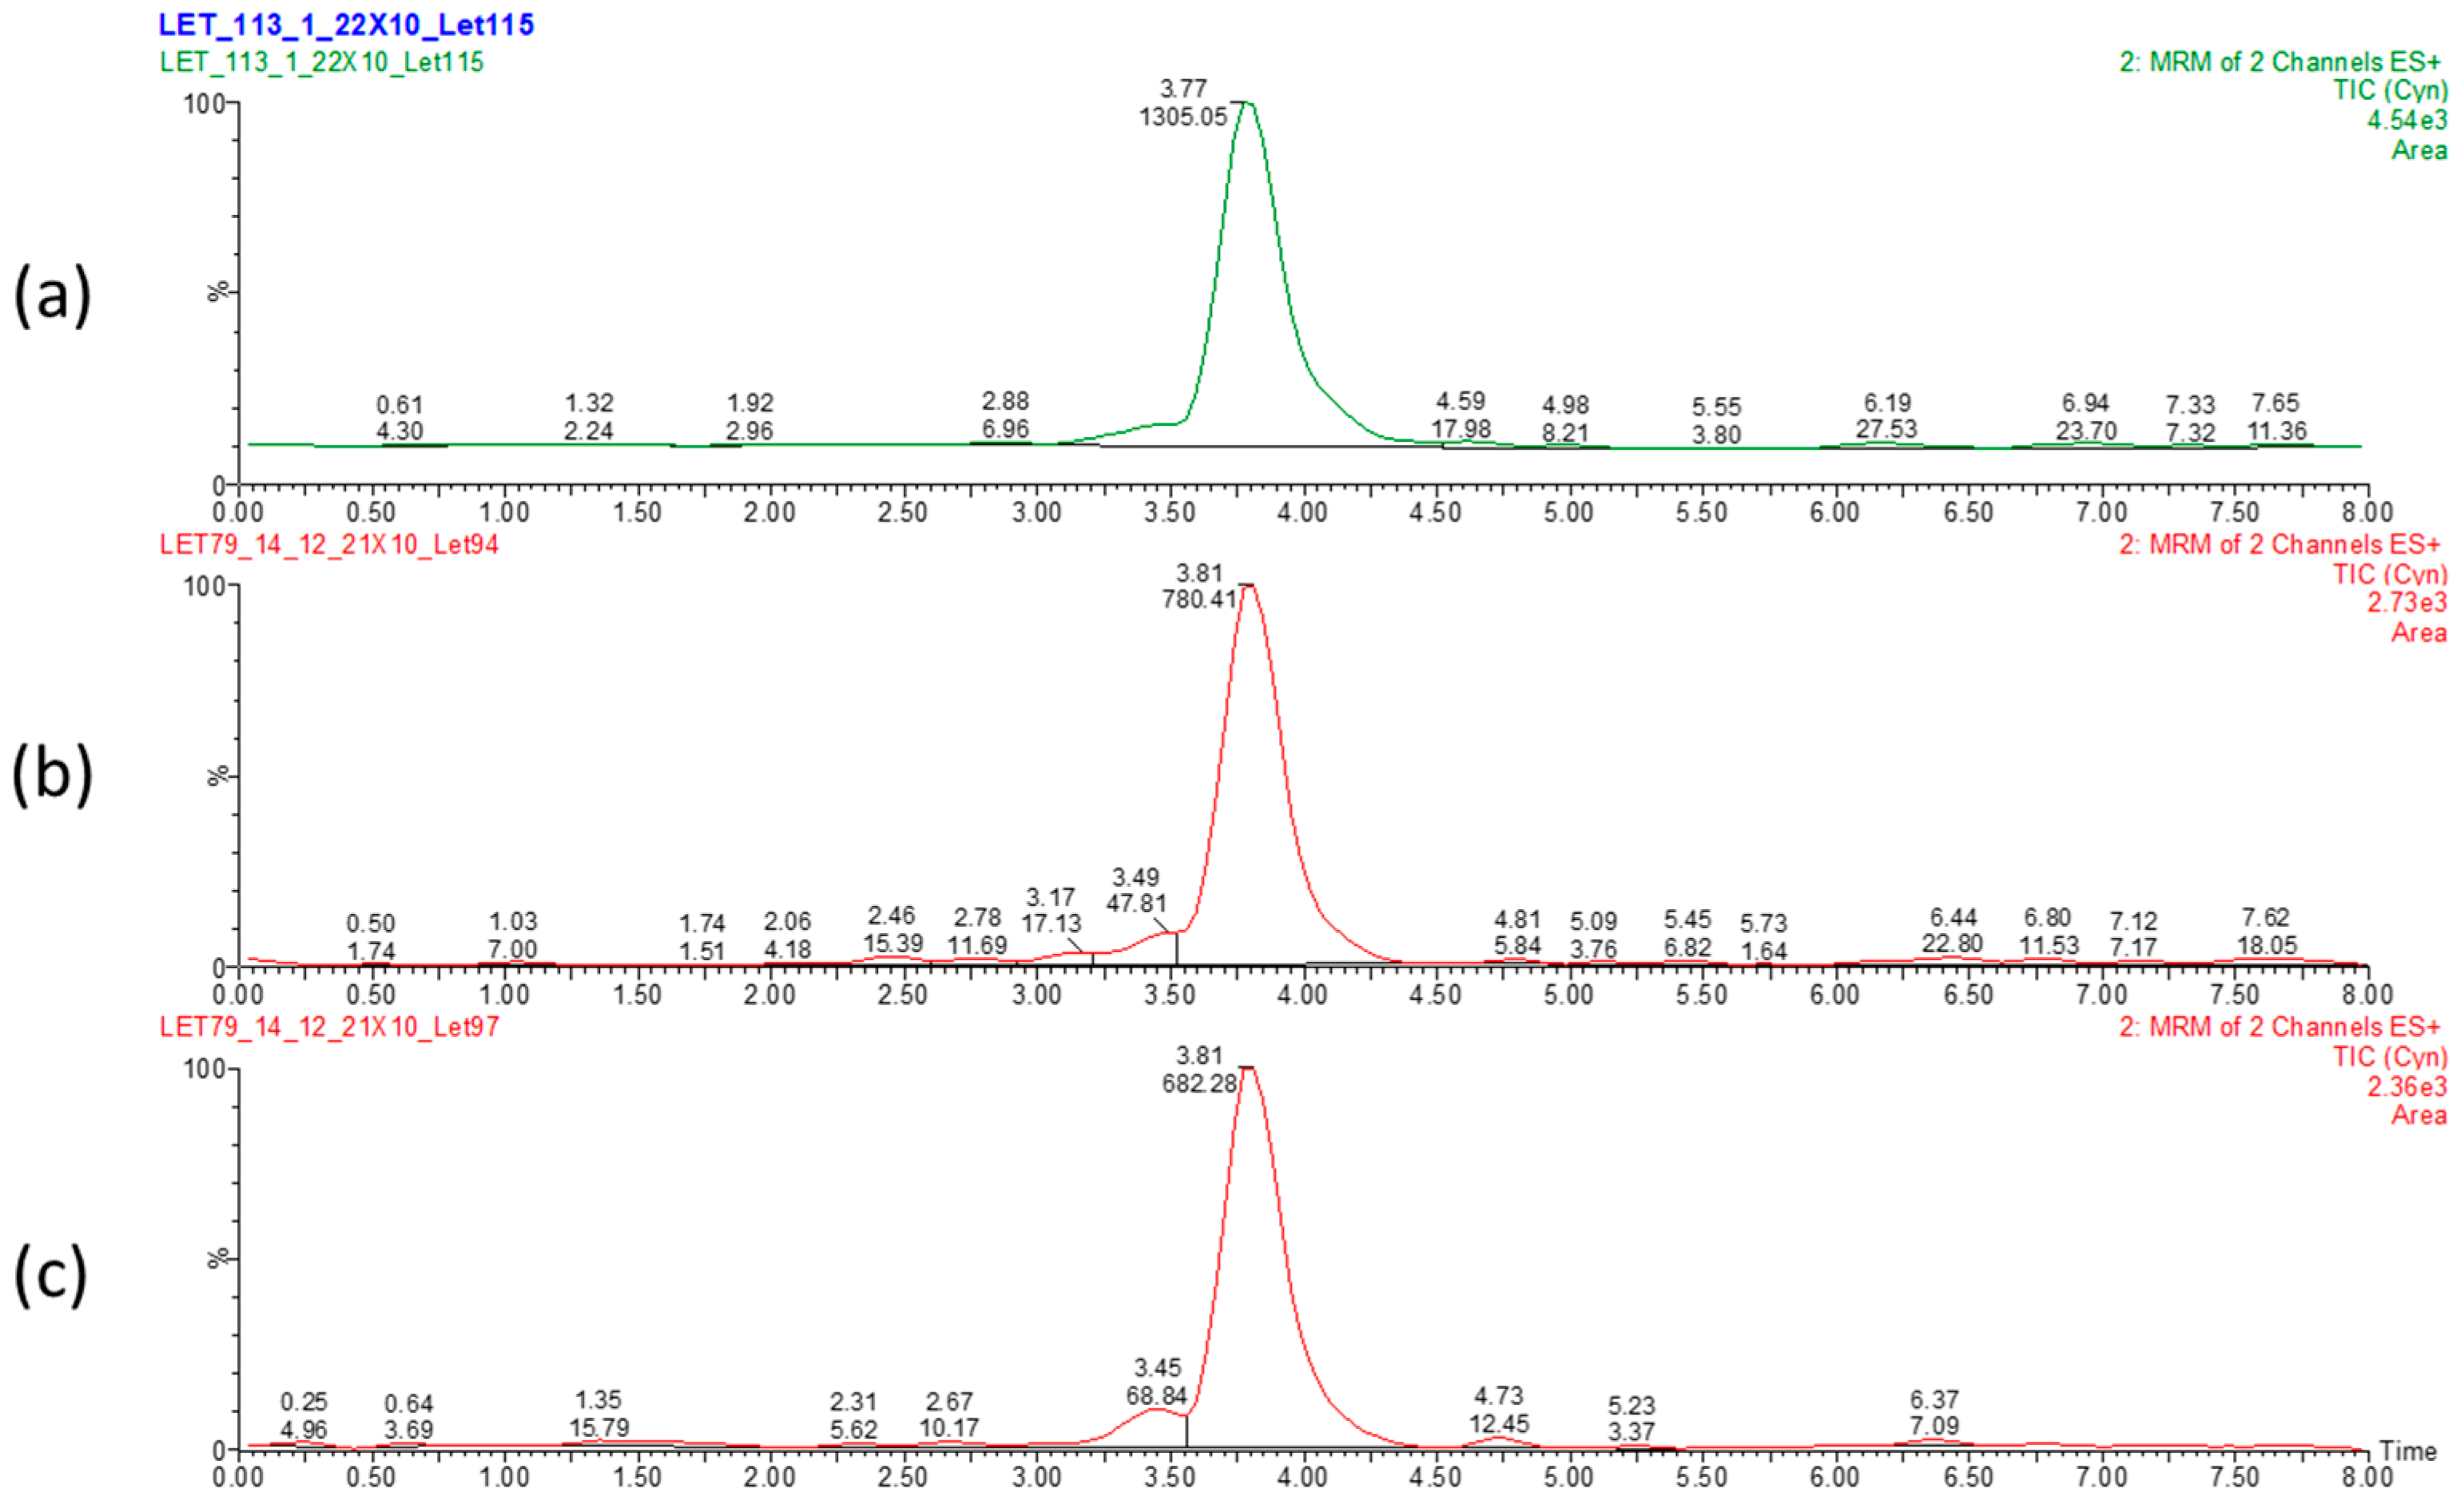
Figure 2.
LC-MS chromatogram displaying elution time of CYN and peak area in dried Chrysosporum ovalisporum biomass. Control biomass (a) and 50 °C 12 h- (b) and UV 2 h-treated (c) biomasses. Values correspond to elution time (3.81 min) and relative abundance of CYN.
3.1. Experiments with M. aeruginosa Biomass
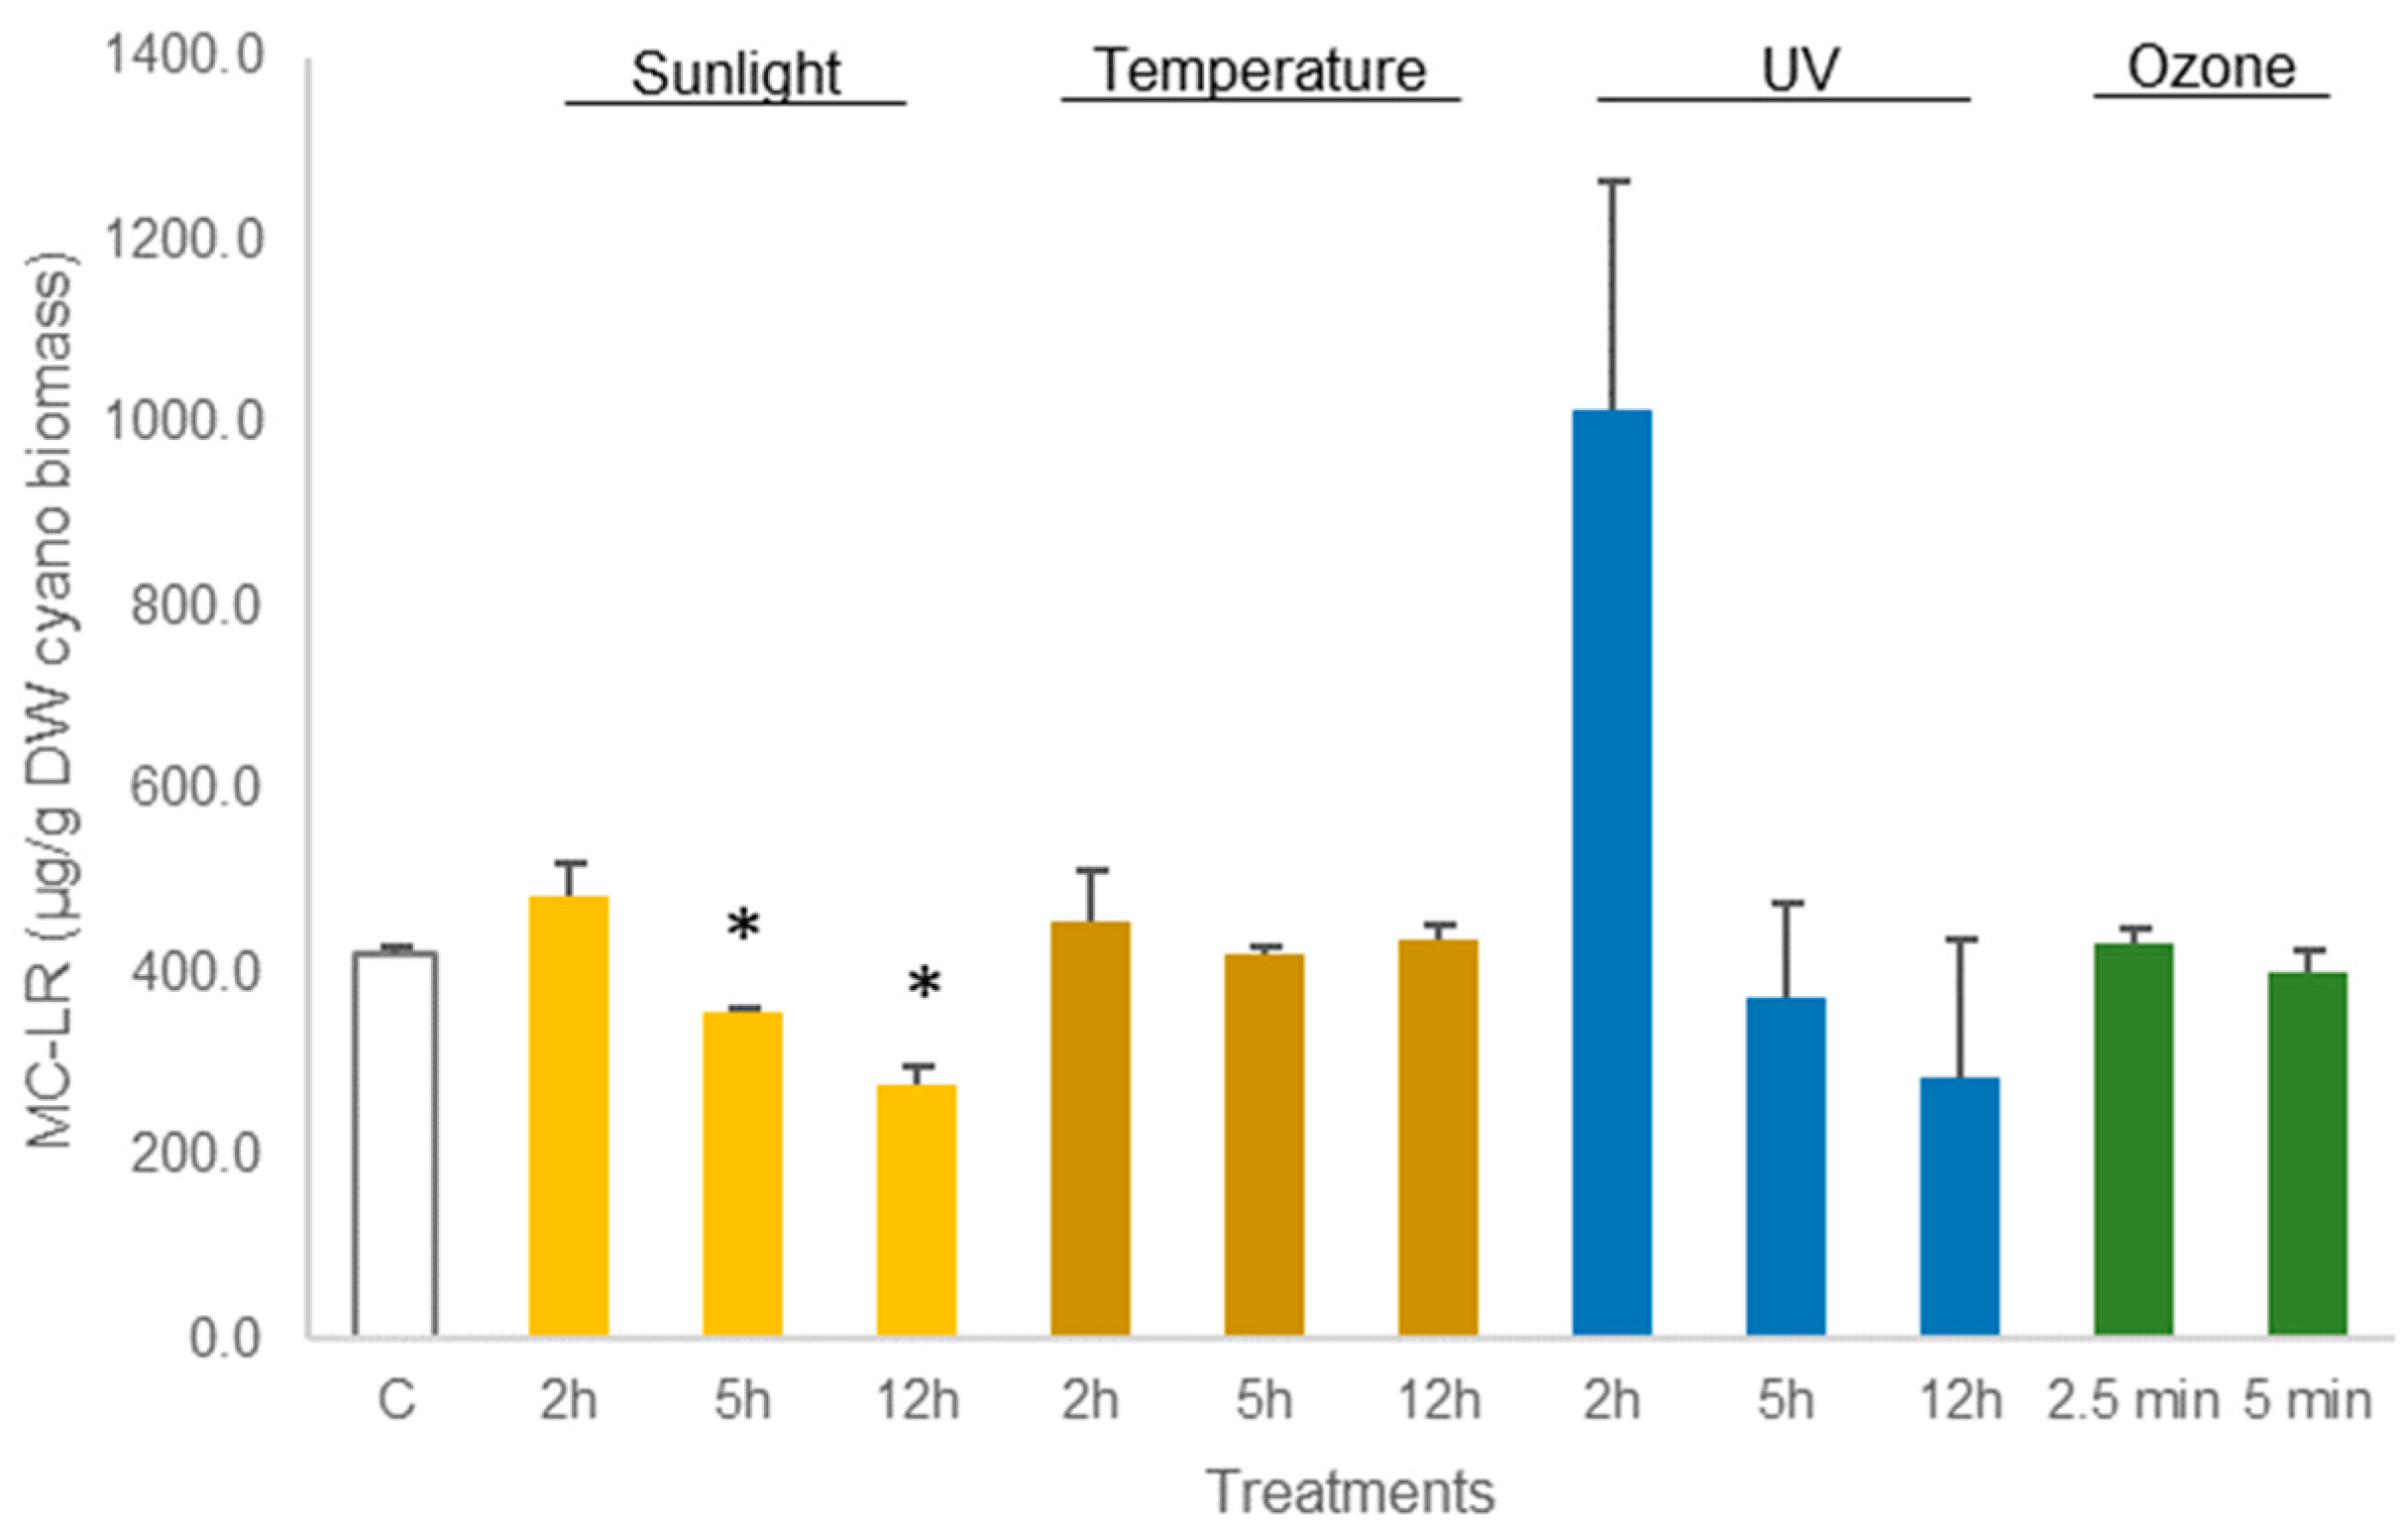
As shown in Figure 3, no statistical differences (p > 0.05, Table S1) were observed in the concentration of MC-LR in dried M. aeruginosa biomass exposed to UV light. Equally, the treatment of M. aeruginosa biomass at 50 °C or with ozone did not lead to any reduction in MC-LR concentration (p > 0.05, Table S1). The amount of toxin in the cyanobacterial biomass from these treatments did not differ from control (421.0 ± 7.0 µg MC-LR/g DW biomass). Nevertheless, the exposure to sunlight enabled to reduce MC-LR concentration in M. aeruginosa biomass. The reduction in MC-LR was 11% (p = 0.0016, Table S1) after 5 h of exposure and 32% (p = 0.0076, Table S1) after 12 h of exposure to sunlight (Figure 3).

Figure 3.
Variations in the concentration of the cyanotoxin MC-LR in lyophilized Microcystis aeruginosa biomass, treated with sunlight, temperature (50 °C), UV, and ozone. Bars report mean values (n = 3) and standard deviations (SD). (*) indicates statistical differences with control C (p < 0.05).
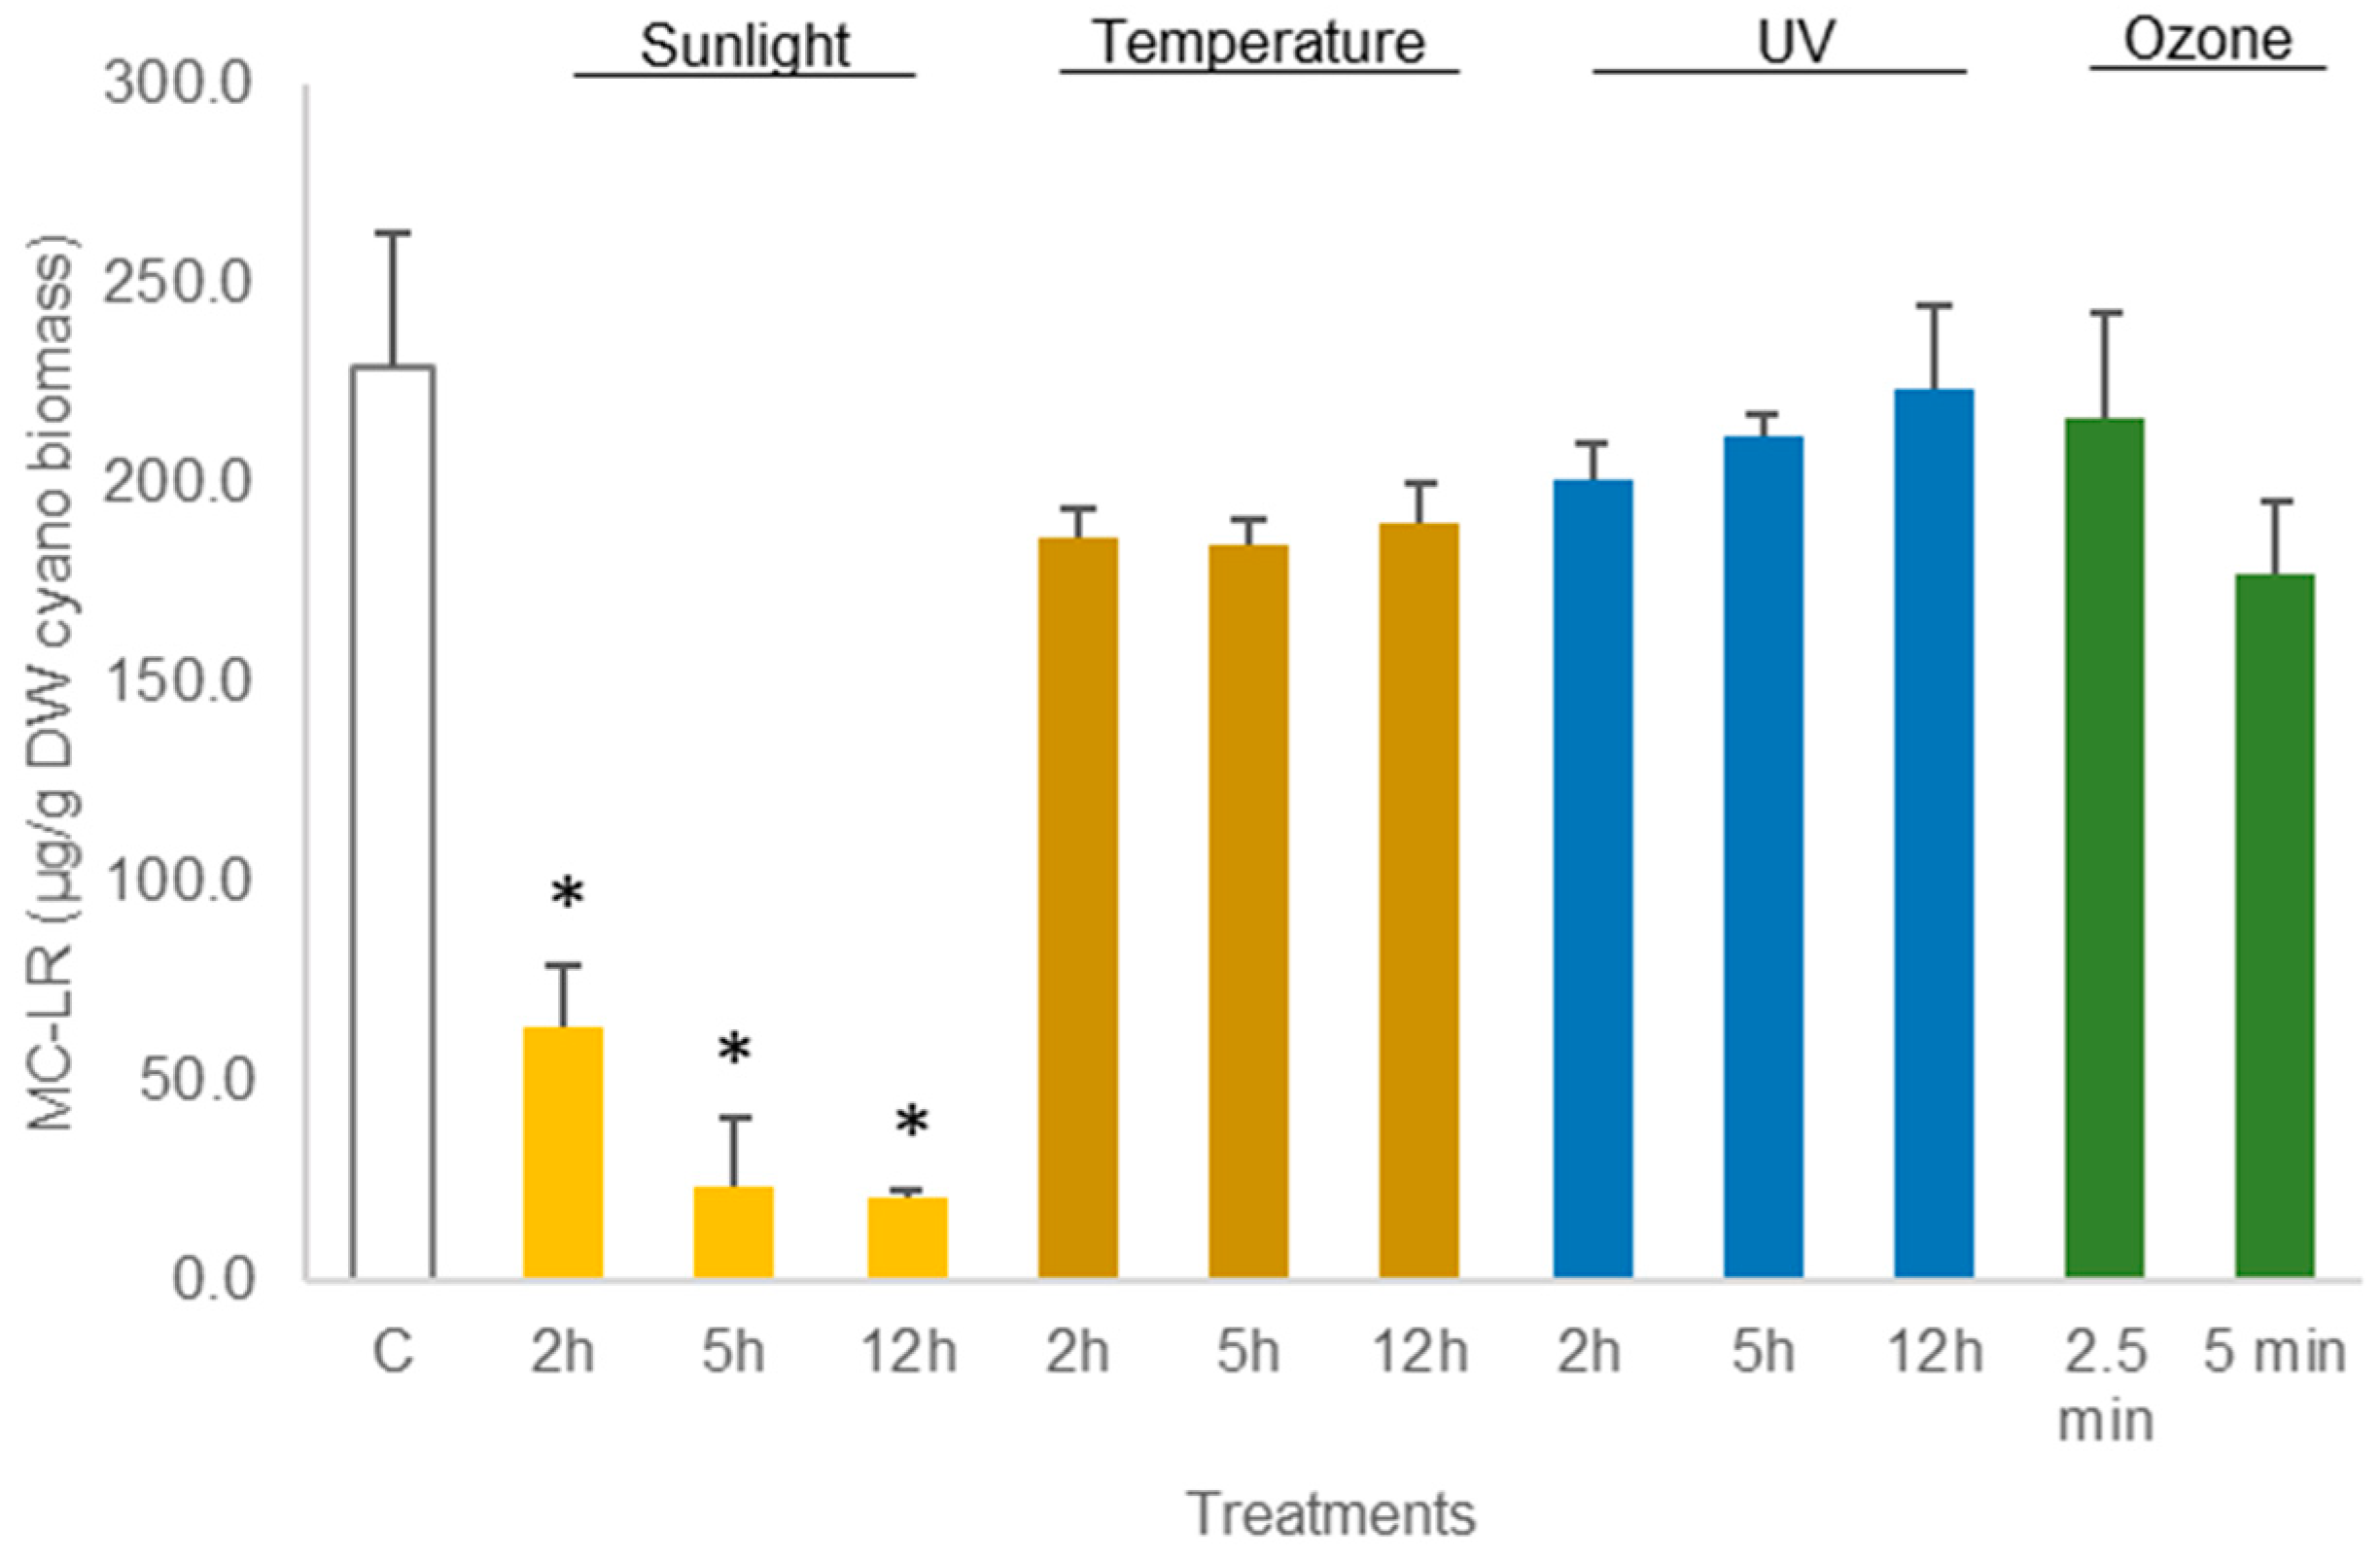
Similar results were reported in the experiments carried out with hydrated M. aeruginosa biomass, i.e., UV light led to a non-significant (p > 0.05, Table S2) decrease in MC-LR between 2% and 12%, depending on the duration of the exposure (Figure 4). Treatment with heat (50 °C) led to a non-significant decrease in MC-LR (between 17% and 20% compared to control concentrations). Only exposure to sunlight resulted in statistically significant reduction in MC-LR concentration in M. aeruginosa biomass. The reduction in MC-LR was 72% after 2 h exposure and 91% after 12 h exposure (p < 0.05) (Figure 4; Table S2). The LC-MS chromatograms corresponding to the analysis of MC-LR in samples displaying variations in the concentration of the toxin are reported in (Figures S1 and S2).

Figure 4.
Variations in the concentration of the cyanotoxin MC-LR in hydrated Microcystis aeruginosa biomass, treated with sunlight, temperature (50 °C), UV, and ozone. Bars report mean values (n = 3) and standard deviations (SD). (*) indicates statistical differences with control C (p < 0.05).
3.2. Experiments with C. ovalisporum Biomass
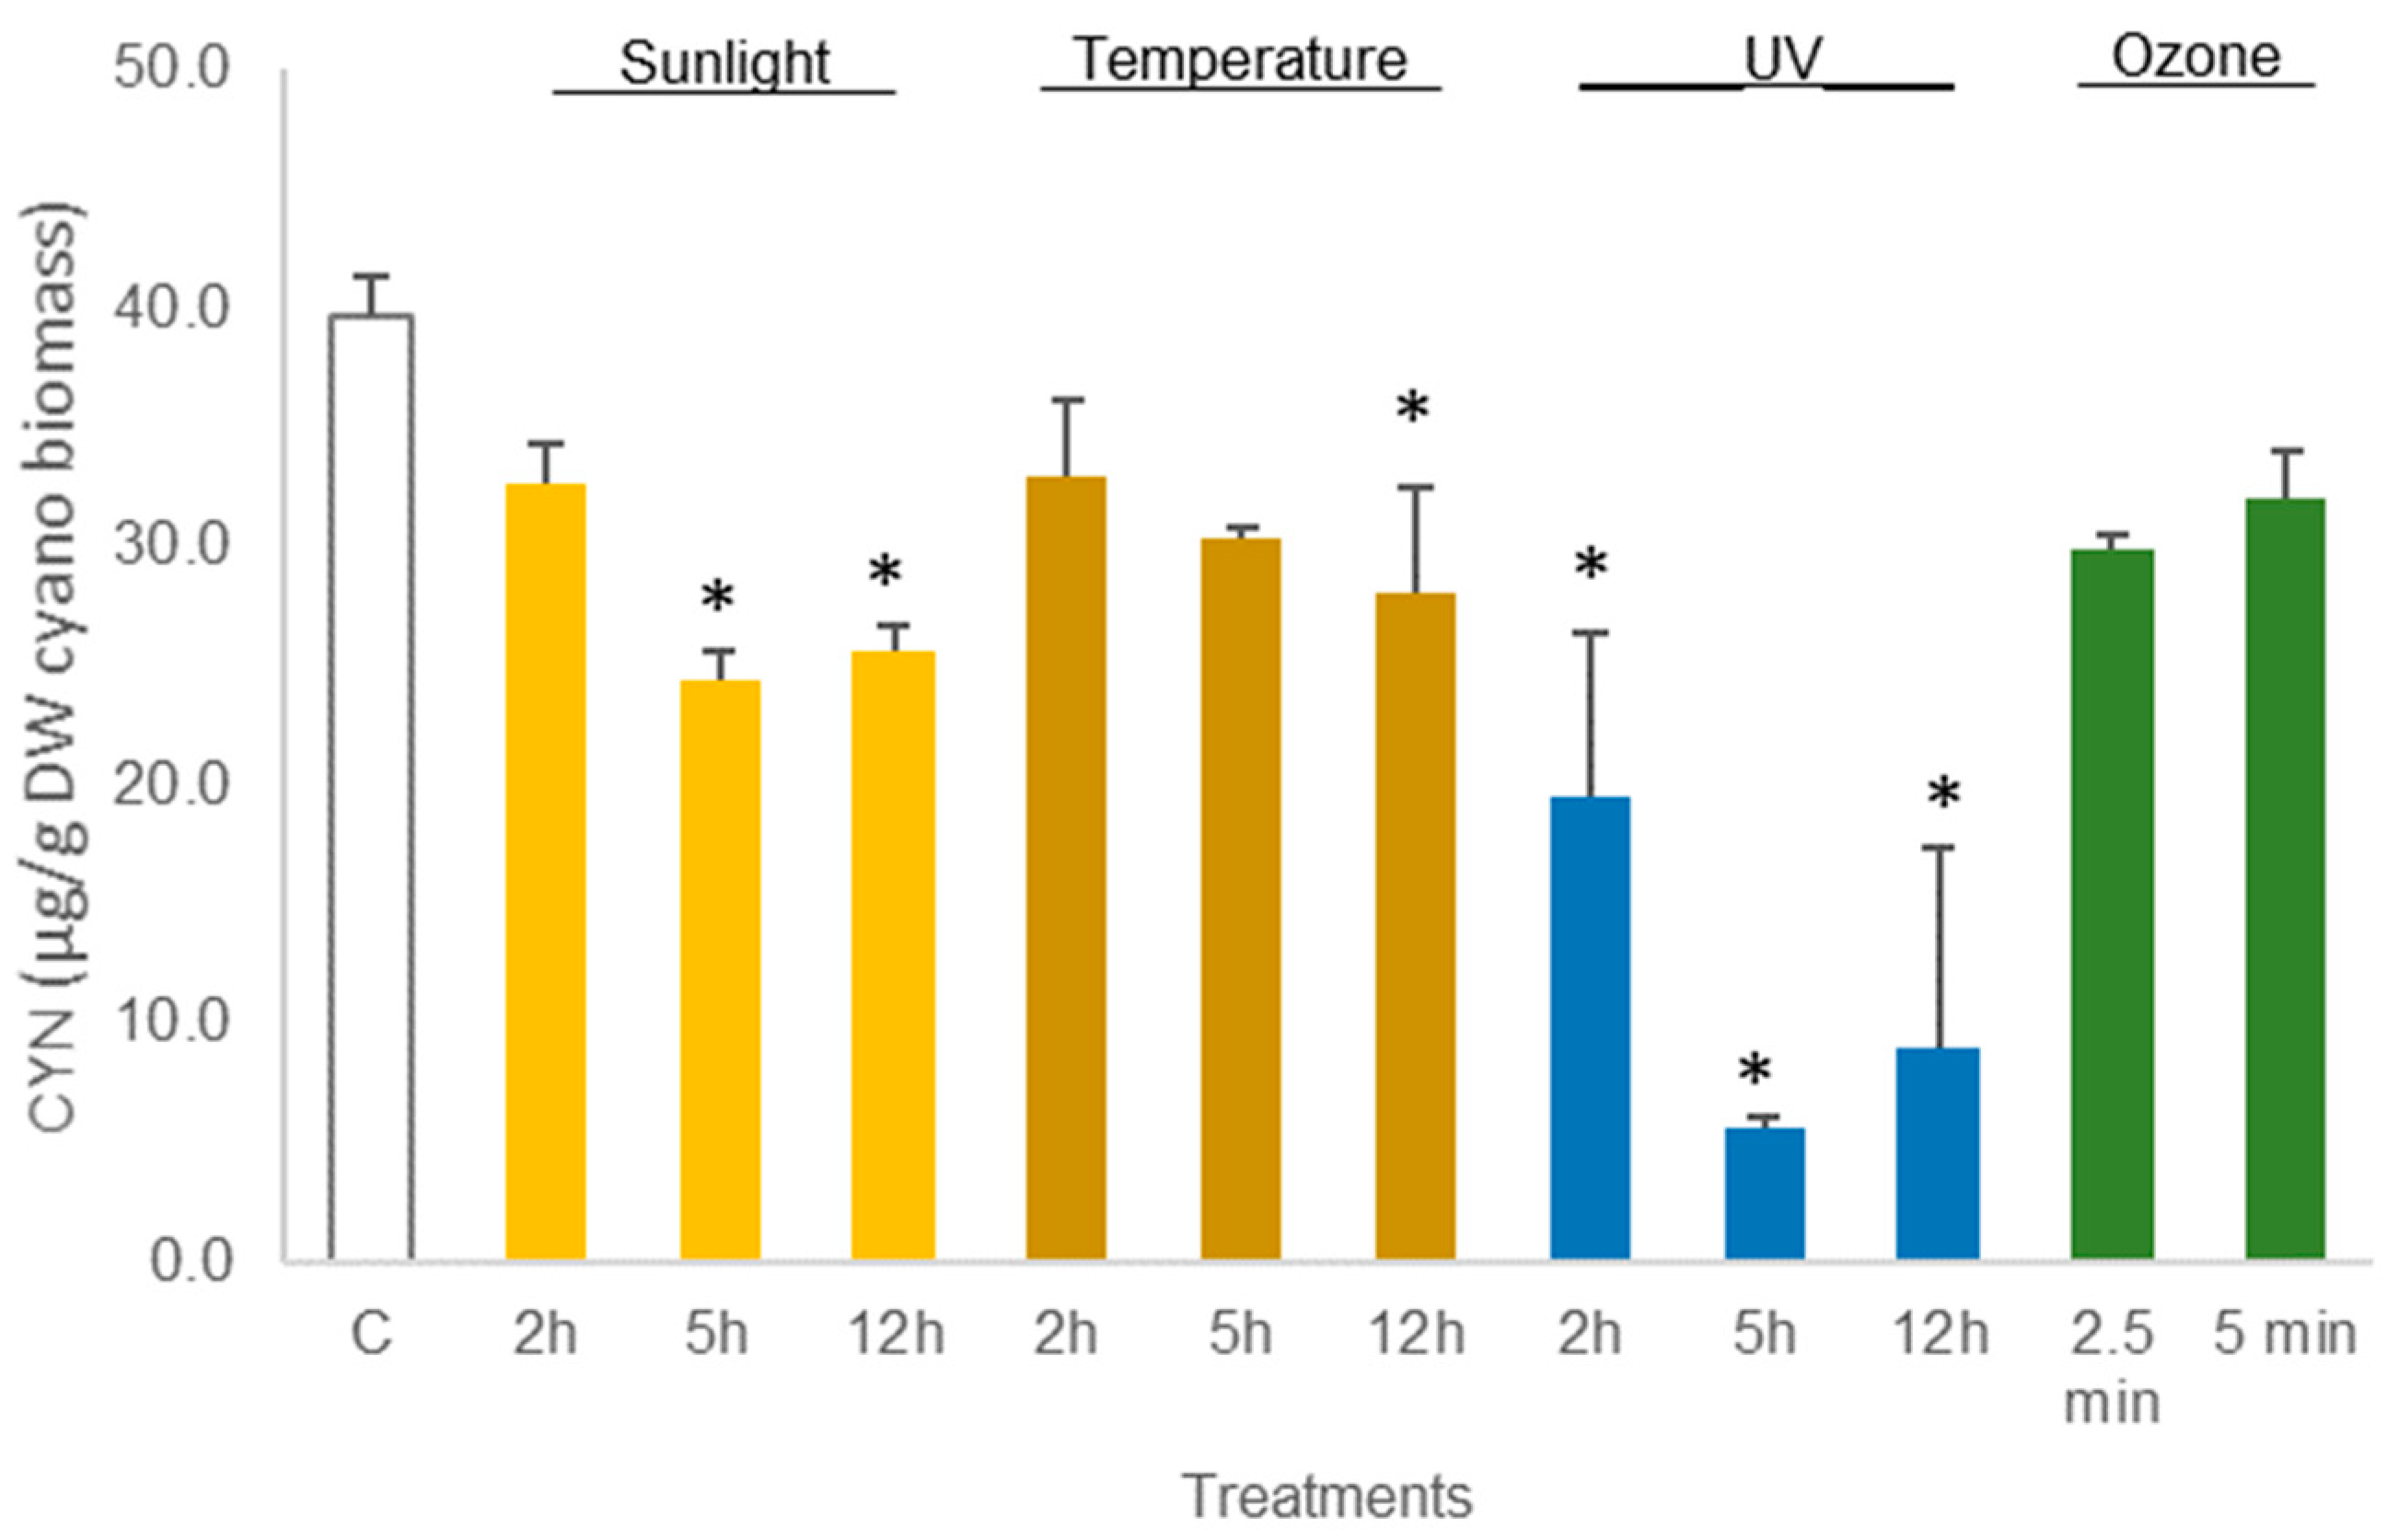
The average amount of toxin in freeze-dried C. ovalisporum biomass was 41.6 ± 2.5 µg/g DW biomass (control sample, Figure 3). No changes were reported in this concentration when the freeze-dried material was exposed to the different treatments except thermal heating (50 °C) for 12 h and UV light (2 h). These two treatments led to a decrease in the toxin amount to 66% and 62%, respectively, of the control (Figure 5; Table S3). Different results were obtained when the cyanobacterial biomass was hydrated before the assays. A decrease in the amount of toxin was observed for different conditions. Exposure to sunlight (5 h and 12 h) led to a significant reduction, 61.3% and 64.6%, in the total amount of toxin reported in the control sample (Figure 6; Table S4). The exposure to 50 °C for 12 h also led a significant decrease (p < 0.05, Table S4) in toxin amount (70.7% of the total CYN in control). Furthermore, exposure to UV also led to a significant decrease in the content of CYN in the biomass. Toxin concentrations determined after UV exposure for 2 h, 5 h, and 12 h were, respectively, 49.2%, 14.1%, and 22.5% of the amount determined in control (Figure 6; Table S4).
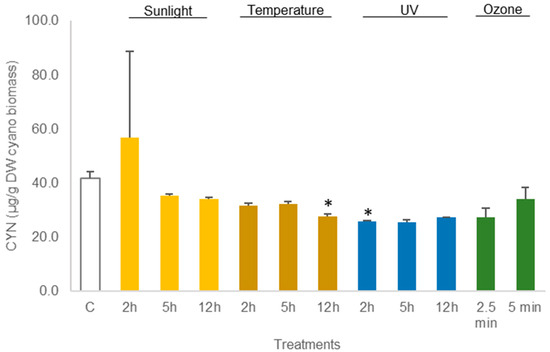
Figure 5.
Variations in the concentration of the cyanotoxin CYN in lyophilized Chrysosporum ovalisporum biomass, treated with sunlight, temperature (50 °C), UV, and ozone. Bars report mean values (n = 3) and standard deviations (SD). (*) indicates statistical differences with control (p < 0.05).
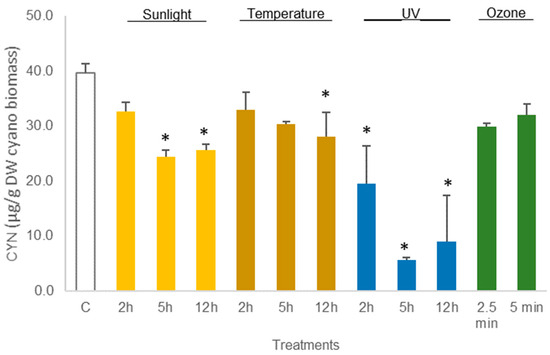
Figure 6.
Variations in the concentration of the cyanotoxin CYN in hydrated Chrysosporum ovalisporum biomass, treated with sunlight, temperature (50 °C), UV, and ozone. Bars report mean values (n = 3) and standard deviations (SD). (*) indicates statistical differences with control (p < 0.05).
4. Discussion
Regarding MC-LR in M. aeruginosa biomass (freeze-dried and hydrated), the most significant results were obtained with the exposure to sunlight. In freeze-dried biomass, we report an 11% reduction in MC-LR concentration after 5 h and 32% reduction after 12 h of exposure to sunlight. In hydrated biomass, the reduction in MC-LR concentration ranged from 72% to 91%.
In the experiments with lyophilized C. ovalisporum biomass, the maximum reduction in CYN concentration was observed with UV treatment (5 h). Temperature treatment also led to a significant reduction in CYN. In the hydrated C. ovalisporum biomass, significant reduction was achieved with UV light (2 h, 5 h, and 12 h), temperature (12 h), and sunlight (5 h and 12 h).
The results fulfill the objective of this study, which was to reduce the concentration of both toxins with the treatments applied, in both hydrated and freeze-dried cyanobacterial biomasses. Furthermore, CYN seems to be less stable than MC-LR to the tested conditions. The best results were obtained when M. aeruginosa and C. ovalisporum biomasses were hydrated, meaning that water content is important in the process of cyanotoxin decomposition, involving oxidation or hydrolysis reactions.
4.1. Microcystin-LR Decomposition
MCs are known to be very stable in natural ambient conditions. This behavior is likely related to its unique chemical structure. In full sunlight, MCs undergo slow photochemical breakdown and isomerization, with the reaction rate being enhanced by the presence of water-soluble cell pigments, such as phycobiliproteins. In the presence of pigments, the photochemical breakdown of MC in full sunlight can take between 2 and 6 weeks or more to achieve 90% breakdown, depending on the concentration of pigments [30]. Harada et al. (1996) [11] reported the half-life of MC-LR in water at pH 1 and 9 and 40 °C to be 3 and 10 weeks, respectively, demonstrating that pH and temperature exert a limited effect on the decomposition of this cyanotoxin when dissolved in water. Under conditions mimicking the natural environment, the authors reported the MC-LR half-life to be about 10 weeks. In the absence of other pigments and other cellular metabolites, MC-LR revealed incredible resistance to sunlight and photolysis [31]. Organic matter (dissolved or in suspension) has shown to influence the photo-degradation of dissolved MCs in water. One organic compound with natural photosensitizing properties is fulvic acid (FA). The photo-degradation of MC-LR by FA apparently follows second-order reaction kinetics and is highly dependent on pH [32]. In another study, humic acid and suspended solids collected from natural samples showed to affect the photo-degradation of dissolved MC-LR [33].
Sunlight and UV can be combined with TiO2 nanoparticles to accelerate the decomposition of MC-LR. This procedure proved to be very effective in the elimination of M. aeruginosa cells and in the degradation of MC-LR released into the aqueous media [34]. More recently, Chang et al. (2015) [35] reported that the combination of UV and ozone can breakdown the toxin, with this combination being more efficient than the two processes on their own. Nevertheless, dissolved organic carbon and pH (between 5 and 10) can reduce the efficiency of this treatment. The transformation reactions proposed by the authors include the oxidation and cleavage of Adda and Mdha residues in the structure of the toxin. But the isomerization of the Adda moiety and the decarboxylation of MeAsp and Glu were attributed to UV radiation [35]. Mizukami (2016) [36] reported that the irradiation of MC-LR with UV light resulted in the compound tricyclo-Adda MC-LR, an intermediate in the photochemical transformation of this toxin. In this study, MC-LR was irradiated with a UV lamp (6 kW power) at a wavelength of 254 nm, with the distance between the cell and the lamp being 0.1 m [36]. Thirumavalavan et al. (2012) [33] also reported the effective photo-degradation of MC-LR employing higher energy and lower wavelength (254 nm) UV light within 60 min. We were not able to reproduce such results, perhaps because of the nature of the material being treated (cyanobacterial biomass instead of MC-LR dissolved in water). Dissolved ozone proved to be an efficient MC oxidizing agent, both in acidic and neutral buffer solutions and over the temperature range of 10 to 30 °C [37]. When the solution pH changed from 7 to 2 MC oxidation rate, the kinetic constant changed from 3.4 × 10⁴ to 1.0 × 10⁵ M−ls−1 [37]. Chlorination also has a potent action on MCs, and decreases of up to 99% MC-LR were reported by Merel et al. (2009) [38]. The rate of degradation of MCs depends on the pH of the water (best at a pH lower than 8) and the oxidizing capability of the chlorine forms. Several by-products have been identified based on their the reactivity with chlorine, including isomers such as monochloro-dihydroxy-microcystin and dichloro-dihydroxy-microcystin [38]. However, despite chlorination being an effective method, it has associated costs and enhances environmental degradation through the by-products that are generated.
The results of this study demonstrate the potential of sunlight to reduce the amount of MC-LR in the freeze-dried and hydrated M. aeruginosa biomasses. The results could be a consequence of the photochemical reactions triggered by sunlight and UV exposure. It is, however, important to highlight that this study differs from others (described above), with respect to the experiment performed, i.e., the toxic material comprised freeze-dried cyanobacterial cells; thus, MC-LR was mostly located inside the cyanobacterial cells (biomass) in contrast to most of the studies carried out with the dissolved toxin. The cell wall and other cellular contents may protect the toxin from the employed treatments and from degradation. On the other hand, the cellular contents of cyanobacterial cells, including pigments, can potentially interact chemically with MC-LR and eventually contribute to its transformation. UV and ozone, in turn, were not effective in decreasing the toxin concentration in the M. aeruginosa biomass. This is in contrast with studies revealing the potential of UV to transform this toxin [33]. We suspect that this result could be due to the protective effect of cell constituents (cell wall and other cellular structures) that protected the toxins from UV treatment. Unfortunately, it was not possible to detect any product of MC-LR breakdown by LC-MS most likely because of the matrix effect (of the crude cyanobacterial extract) that led to a loss of sensitivity of the instrument. Regarding the toxicity of the compounds generated from the photochemical transformation of MC-LR, so far, no toxic products have been reported due to thermal decomposition, photolysis, or biological degradation [39].
4.2. CYN Decomposition
Chiswell et al. (1999) [40] reported that CYN in an algal extract from C. raciborskii degrades rapidly when exposed to natural sunlight (a half-life of 1.5 h), with CYN showing a 94% reduction in concentration after 72 h exposure. The rate of decomposition appears to be dependent on the presence and concentration of algal pigments. In the same study, CYN concentration decreased by 57% when exposed to a temperature of 50 °C, but decomposition was slower at lower temperatures (4 to 50 °C) [40]. Variation in light spectra revealed that most of the photochemical reactions in this molecule are catalyzed by UV-A (320–400 nm, 75%) followed by UV-B (280–320 nm, 25%). In turn, photosynthetically active radiation (PAR, 400–700 nm) seemed to not have any influence on CYN degradation [41].
Advanced oxidation processes involving UV-254 nm and H2O2 demonstrated to be effective in eliminating and decomposing CYN. The authors also reported that CYN was effectively eliminated under extended UV exposure. The transformation pathways include hydroxyl addition (+16 Da), alcoholic oxidation or dehydrogenation (−2 Da), and the elimination of sulfate group (−80 Da). Furthermore, the cleavage of the uracil moiety, as well as the oxidation of hydroxymethyl bridge, may reduce the toxicity of CYN significantly, since both groups are considered important for CYN activity [42]. Treatment of contaminated fish samples with temperature (boiling and microwave) was reported to decrease the concentration of the toxin and to generate several decomposition compounds. Among the compounds described were 7-epi-CYN and several diasteroisomers [43].
Chlorine treatments were shown to be efficient in the elimination of CYN. Nearly 99% of CYN in solution could be eliminated with treatment with residual concentration of chlorine (0.5 mg/L) at pH of 6–9. The efficiency of chlorine, however, decreased at a lower pH and with the increase in dissolved organic carbon in the water [44]. Furthermore, TiO2-catalyzed ozonation proved to be efficient to reduce the toxic activity of CYN. In this process, TiO2 accelerated the decomposition of ozone and increased the production of hydroxyl radicals (OH-) that react with the toxin [45]. But ozone alone proved to be effective to decompose CYN. In total, 36 different compounds were described from the decomposition of CYN by ozone [46]. Furthermore, the decrease in toxicity according to bioassays in human cell lines provided evidence that no toxic metabolites were generated from CYN decomposition. The authors also reported that the carbon–carbon double bond in the uracil ring of CYN was most susceptible to an ozone attack [46]. Advances in water treatment methods include, for instance, photo-Fenton processes with light-emitting diodes (EDDs) as an irradiation source. The toxin CYN was efficiently decomposed by combining the following elements, H2O2 (30 mg/L), Fe(III) (5 mg/L), and Fe(III):ligand (1:0.5, molar ratio), and completely removed CYN in 15 min. In such a process, EDDs function as an iron chelating agent [47]. Photocatalysis can also be performed using UV-A, visible light, and TiO2 photocatalysts. These elements in combination have shown great efficiency, eliminating CYN from water in 15 to 120 min depending on the type of irradiation employed (UV-A or solar light). In contrast, photo-degradation in the absence of TiO2 photocatalysts was minor [48].
The results of this study seem to be consistent with some previous studies. Here, the intracellular CYN decreased with the exposure to UV. Furthermore, the temperature proved to play a role in the elimination of CYN, as previously reported by Chiswell et al. (1999) [40]. Unfortunately, it was not possible to confirm the effectiveness of ozone treatment. Also, in the case of CYN, the reduced capacity of ozone to eliminate this toxin might be related to the experimental set-up and the low levels of ozone applied in the study. Again, it is worth mentioning that this experimental set-up using cyanobacterial biomass differs considerably from decomposition studies with toxins dissolved in water. In this case, cell walls and other cellular structures are likely protecting these molecules from the tested treatments and slowing the degradation process of the toxin.
5. Conclusions
This study demonstrates that the cyanotoxin content in cyanobacterial biomass can be significantly reduced, applying environmentally friendly and cost-effective procedures such as exposure to UV or sunlight. These procedures can be investigated further to enable the better control of the process and the identification of the metabolites generated during CYN and MC decomposition. Eventually, these procedures can be improved and optimized for processing cyanobacterial biomass for industrial applications. Simple procedures like exposure (and drying) of cyanobacterial biomass under sunlight could be sufficient to reduce the amount of toxins and to transform a toxic material into a non-toxic one. Nonetheless, the photochemical reactions promoted by sunlight or UV in cyanobacterial biomass should be investigated in-depth to ensure that no new toxic molecules are generated during the process. Agriculture is an important sector to apply cyanobacterial products such as biofertilizers and soil amendments. Cyano-products (e.g., biomass) to be used in agriculture can be decontaminated with methods such as those investigated in this study.
Supplementary Materials
The following supporting information can be downloaded at: https://www.mdpi.com/article/10.3390/biomass4020027/s1, Figure S1: LC-MS chromatogram displaying elution time of MC-LR and peak area in Control (a), sunlight 5 h (b) and sunlight 12 h (c) in dried M. aeruginosa biomass. Values correspond to elution time (12.77 min) and relative abundance of MC-LR. Figure S2: LC-MS chromatogram displaying elution time of MC-LR and peak area in Control (a), sunlight 2 h (b), 5 h (c) and (d) in hydrated M. aeruginosa biomass. Values correspond to elution time (12.81 min) and relative abundance of MC-LR. Figure S3: LC-MS chromatogram displaying elution time of CYN and peak area in Control (a), 50 °C 12 h (b) and UV 2 h (c) and in dried C. ovalisporum biomass. Values correspond to elution time (3.81 min) and relative abundance of CYN. Figure S4: LC-MS chromatogram displaying elution time of CYN and peak area in Control (a), sunlight 5 h (b) and 12 h (c), 50 °C 12 h (d), UV 2 h (e), 5 h (f) and 12 h (g) and in hydrated C. ovalisporum biomass. Values correspond to elution time (3.81 min) and relative abundance of CYN. Table S1: Quantification of MC-LR in hydrated M. aeruginosa biomass and statistics; Table S2: Quantification of MC-LR in dried M. aeruginosa biomass and statistics; Table S3: Quantification of CYN in hydrated C. ovalisporum biomass and statistics; Table S4: Quantification of CYN in dried C. ovalisporum biomass and statistics; Table S5: Mass-spectrometry operating parameters for the analysis of cyanotoxins.
Author Contributions
Conceptualization, A.C., V.V., M.F. and L.L.; methodology, J.A., A.C., M.F., L.L. and T.A.; formal analysis, J.A.; investigation, L.L., A.C., M.F. and T.A.; writing—original draft preparation, A.C., L.L. and M.F.; writing—review and editing, V.V., T.A., M.F., L.L., J.A. and A.C.; supervision, A.C.; funding acquisition, A.C. All authors have read and agreed to the published version of the manuscript.
Funding
This project has received funding from the European Union’s Horizon 2020 research and innovation programme under the Marie Skłodowska-Curie grant agreement No 823860 and from the Strategic Funding UIDB/04423/2020 and UIDP/04423/2020 through national funds provided by Portuguese Foundation for Science and Technology (Fundação para a Ciência e Tecnologia; FCT) and the European Regional Development Fund (ERDF) in the framework of the program PT2020. Alexandre Campos’s work contract was funded by FCT (CEECIND/03767/2018).
Data Availability Statement
All data produced in this study are available in the Supplementary Material.
Conflicts of Interest
The authors declare no conflicts of interest.
References
- Rasmussen, B.; Fletcher, I.R.; Brocks, J.J.; Kilburn, M.R. LETTERS Reassessing the first appearance of eukaryotes and cyanobacteria. Nature 2008, 455, 1101–1104. [Google Scholar] [CrossRef] [PubMed]
- Whitton, B.A. Ecology of Cyanobacteria II: Their Diversity in Space and Time; Springer: Dordrecht, The Netherlands, 2012; pp. 1–760. [Google Scholar] [CrossRef]
- Glibert, P.M.; Seitzinger, S.; Heil, C.A.; Burkholder, J.M.; Parrow, M.W.; Codispoti, L.A.; Kelly, V. The role of eutrophication in the global proliferation of harmful algal blooms. Oceanography 2005, 18, 198–209. [Google Scholar] [CrossRef]
- Huisman, J.; Codd, G.A.; Paerl, H.W.; Ibelings, B.W.; Verspagen, J.M.H.; Visser, P.M. Cyanobacterial blooms. Nat. Rev. Microbiol. 2018, 16, 471–483. [Google Scholar] [CrossRef] [PubMed]
- Pearson, L.; Mihali, T.; Moffitt, M.; Kellmann, R.; Neilan, B. On the Chemistry, Toxicology and Genetics of the Cyanobacterial Toxins, Microcystin, Nodularin, Saxitoxin and Cylindrospermopsin. Mar. Drugs 2010, 8, 1650–1680. [Google Scholar] [CrossRef] [PubMed]
- Campos, A.; Vasconcelos, V. Molecular Mechanisms of Microcystin Toxicity in Animal Cells. Int. J. Mol. Sci. 2010, 11, 268–287. [Google Scholar] [CrossRef] [PubMed]
- Lone, Y.; Koiri, R.K.; Bhide, M. An overview of the toxic effect of potential human carcinogen Microcystin-LR on testis. Toxicol. Rep. 2015, 2, 289–296. [Google Scholar] [CrossRef]
- Sivonen, K.; Jones, G. Toxic Cyanobacteria in Water: A Guide to Their Public Health Consequences, Monitoring, and Management; E & FN Spon: London, UK, 1999. [Google Scholar]
- Díez-Quijada, L.; Puerto, M.; Gutiérrez-Praena, D.; Llana-Ruiz-Cabello, M.; Jos, A.; Cameán, A.M. Microcystin-RR: Occurrence, content in water and food and toxicological studies. A review. Environ. Res. 2019, 168, 467–489. [Google Scholar] [CrossRef]
- Funari, E.; Testai, E. Human Health Risk Assessment Related to Cyanotoxins Exposure. Crit. Rev. Toxicol. 2008, 38, 97–125. [Google Scholar] [CrossRef] [PubMed]
- Harada, K.I.; Tsuji, K.; Watanabe, M.F.; Kondo, F. Stability of microcystins from cyanobacteria—III. Effect of pH and temperature. Phycologia 1996, 35, 83–88. [Google Scholar] [CrossRef]
- Moreno, I.M.; Maraver, J.; Aguete, E.C.; Leao, M.; Gago-Martínez, A.; Cameán, A.M. Decomposition of Microcystin-LR, Microcystin-RR, and Microcystin-YR in Water Samples Submitted to in Vitro Dissolution Tests. J. Agric. Food Chem. 2004, 52, 5933–5938. [Google Scholar] [CrossRef]
- Ohtani, I.; Moore, R.E.; Runnegar, M.T.C. Cylindrospermopsin: A Potent Hepatotoxin from the Blue-Green Alga Cylindrospermopsis raciborskii. J. Am. Chem. Soc. 1992, 114, 7941–7942. [Google Scholar] [CrossRef]
- Kinnear, S. Cylindrospermopsin: A Decade of Progress on Bioaccumulation Research. Mar. Drugs 1999, 8, 542–564. [Google Scholar] [CrossRef] [PubMed]
- Dittmann, E.; Fewer, D.P.; Neilan, B.A. Cyanobacterial toxins: Biosynthetic routes and evolutionary roots. FEMS Microbiol. Rev. 2013, 37, 23–43. [Google Scholar] [CrossRef]
- Lee, J.; Lee, S.; Jiang, X. Cyanobacterial Toxins in Freshwater and Food: Important Sources of Exposure to Humans. Annu. Rev. Food Sci. Technol. 2017, 8, 281–304. [Google Scholar] [CrossRef]
- Falconer, I.R.; Humpage, A.R. Cyanobacterial (blue-green algal) toxins in water supplies: Cylindrospermopsins. Environ. Toxicol. 2006, 21, 299–304. [Google Scholar] [CrossRef] [PubMed]
- Singh, S.; Kate, B.N.; Banecjee, U.C. Bioactive Compounds from Cyanobacteria and Microalgae: An Overview. Crit. Rev. Biotechnol. 2005, 25, 73–95. [Google Scholar] [CrossRef]
- Saeed, M.U.; Hussain, N.; Shahbaz, A.; Hameed, T.; Iqbal, H.M.N.; Bilal, M. Bioprospecting microalgae and cyanobacteria for biopharmaceutical applications. J. Basic Microbiol. 2022, 62, 1110–1124. [Google Scholar] [CrossRef]
- Falsini, S.; Rosi, M.C.; Ravegnini, E.; Schiff, S.; Gonnelli, C.; Papini, A.; Adessi, A.; Urciuoli, S.; Ristori, S. Nanoformulations with exopolysaccharides from cyanobacteria: Enhancing the efficacy of bioactive molecules in the Mediterranean fruit fly control. Environ. Sci. Pollut. Res. Int. 2023, 30, 83760–83770. [Google Scholar] [CrossRef] [PubMed]
- Antunes, J.; Pereira, S.; Ribeiro, T.; Plowman, J.E.; Thomas, A.; Clerens, S.; Campos, A.; Vasconcelos, V.; Almeida, J.R. A Multi-Bioassay Integrated Approach to Assess the Antifouling Potential of the Cyanobacterial Metabolites Portoamides. Mar. Drugs 2019, 17, 111. [Google Scholar] [CrossRef]
- Campos, A.; Redouane, E.M.; Freitas, M.; Amaral, S.; Azevedo, T.; Loss, L.; Máthé, C.; Mohamed, Z.A.; Oudra, B.; Vasconcelos, V.; et al. Impacts of Microcystins on Morphological and Physiological Parameters of Agricultural Plants: A Review. Plants 2021, 10, 639. [Google Scholar] [CrossRef]
- Devi, R.; Kaur, T.; Kour, D.; Yadav, A.; Yadav, A.N.; Suman, A.; Ahluwalia, A.S.; Saxena, A.K. Minerals solubilizing and mobilizing microbiomes: A sustainable approach for managing minerals’ deficiency in agricultural soil. J. Appl. Microbiol. 2022, 133, 1245. [Google Scholar] [CrossRef] [PubMed]
- Ezhumalai, G.; Arun, M.; Manavalan, A.; Rajkumar, R.; Heese, K. A Holistic Approach to Circular Bioeconomy Through the Sustainable Utilization of Microalgal Biomass for Biofuel and Other Value-Added Products. Microb. Ecol. 2024, 87, 61. [Google Scholar] [CrossRef] [PubMed]
- Galetović, A.; Peña, G.; Fernández, N.; Urrutia, M.; Flores, N.; Gómez-Silva, B.; Di Ruggiero, J.; Shene, C.; Bustamante, M. Cellulose Synthase in Atacama Cyanobacteria and Bioethanol Production from Their Exopolysaccharides. Microorganisms 2023, 11, 2668. [Google Scholar] [CrossRef] [PubMed]
- Wu, Q.; Liu, L.; Miron, A.; Klímová, B.; Wan, D.; Kuča, K. The antioxidant, immunomodulatory, and anti-inflammatory activities of Spirulina: An overview. Arch. Toxicol. 2016, 90, 1817–1840. [Google Scholar] [CrossRef] [PubMed]
- Nova, M.; Citterio, S.; Martegani, E.; Colombo, S. Unraveling the Anti-Aging Properties of Phycocyanin from the Cyanobacterium Spirulina (Arthrospira platensis). Int. J. Mol. Sci. 2024, 25, 4215. [Google Scholar] [CrossRef] [PubMed]
- Ramos, V.; Morais, J.; Castelo-Branco, R.; Pinheiro, Â.; Martins, J.; Regueiras, A.; Pereira, A.L.; Lopes, V.R.; Frazão, B.; Gomes, D.; et al. Cyanobacterial diversity held in microbial biological resource centers as a biotechnological asset: The case study of the newly established LEGE culture collection. Arab Emir. J. Appl. Phycol. 2018, 30, 1437–1451. [Google Scholar] [CrossRef] [PubMed]
- Oliveira, F.; Diez-Quijada, L.; Turkina, M.V.; Morais, J.; Felpeto, A.B.; Azevedo, J.; Jos, A.; Camean, A.M.; Vasconcelos, V.; Martins, J.C.; et al. Physiological and Metabolic Responses of Marine Mussels Exposed to Toxic Cyanobacteria Microcystis aeruginosa and Chrysosporum ovalisporum. Toxins 2020, 12, 196. [Google Scholar] [CrossRef] [PubMed]
- Chorus, I.; Welker, M. Cyanobacterial Toxins. In Toxic Cyanobacteria in Water: A Guide to Their Public Health Consequences, Monitoring and Management, 2nd ed.; Chorus, I., Welker, M., Eds.; CRC: Boca Raton, FL, USA, 2021; pp. 15–162. [Google Scholar] [CrossRef]
- Tsuji, K.; Watanuki, T.; Kondo, F.; Watanabe, M.F.; Suzuki, S.; Nakazawa, H.; Suzuki, M.; Uchida, H.; Harada, K.I. Stability of microcystins from cyanobacteria—II. Effect of UV light on decomposition and isomerization. Toxicon 1995, 33, 1619–1631. [Google Scholar] [CrossRef] [PubMed]
- Sun, Q.; Zhang, T.; Wang, F.; Liu, C.; Wu, C.; Xie, R.R.; Zheng, Y. Ultraviolet photosensitized transformation mechanism of microcystin-LR by natural organic matter in raw water. Chemosphere 2018, 209, 96–103. [Google Scholar] [CrossRef]
- Thirumavalavan, M.; Hu, Y.L.; Lee, J.F. Effects of humic acid and suspended soils on adsorption and photo-degradation of microcystin-LR onto samples from Taiwan reservoirs and rivers. J. Hazard. Mater. 2012, 217–218, 323–329. [Google Scholar] [CrossRef]
- Pinho, L.X.; Azevedo, J.; Vasconcelos, V.M.; Vilar, V.J.P.; Boaventura, R.A.R. Decomposition of Microcystis aeruginosa and microcystin-LR by TiO 2 oxidation using artificial UV light or natural sunlight. J. Adv. Oxid. Technol. 2012, 15, 98–106. [Google Scholar] [CrossRef]
- Chang, J.; Chen, Z.L.; Wang, Z.; Kang, J.; Chen, Q.; Yuan, L.; Shen, J.M. Oxidation of microcystin-LR in water by ozone combined with UV radiation: The removal and degradation pathway. Chem. Eng. J. 2015, 276, 97–105. [Google Scholar] [CrossRef]
- Mizukami, Y. Photochemical Reactions of Microcystin-LR Following Irradiation with UV Light. Open J. Phys. Chem. 2016, 6, 79–85. [Google Scholar] [CrossRef]
- Shawwa, A.R.; Smith, D.W. Kinetics of Microcystin-LR Oxidation by Ozone. Ozone Sci. Eng. 2001, 23, 161–170. [Google Scholar] [CrossRef]
- Merel, S.; LeBot, B.; Clément, M.; Seux, R.; Thomas, O. Ms identification of microcystin-LR chlorination by-products. Chemosphere 2009, 74, 832–839. [Google Scholar] [CrossRef]
- Harada, K.I.; Tsuji, K. Persistence and Decomposition of Hepatotoxic Microcystins Produced by Cyanobacteria in Natural Environment. J. Toxicol. Toxin Rev. 1998, 17, 385–403. [Google Scholar] [CrossRef]
- Chiswell, R.K.; Shaw, G.R.; Eaglesham, G.; Smith, M.J.; Norris, R.L.; Seawright, A.A.; Moore, M.R. Stability of cylindrospermopsin, the toxin from the cyanobacterium, Cylindrospermopsis raciborskii: Effect of pH, temperature, and sunlight on decomposition. Env. Toxicol. 1999, 14, 155–161. [Google Scholar] [CrossRef]
- Wörmer, L.; Huerta-Fontela, M.; Cirés, S.; Carrasco, D.; Quesada, A. Natural photodegradation of the cyanobacterial toxins microcystin and cylindrospermopsin. Environ. Sci. Technol. 2010, 44, 3002–3007. [Google Scholar] [CrossRef]
- He, X.; Zhang, G.; De La Cruz, A.A.; O’Shea, K.E.; Dionysiou, D.D. Degradation mechanism of cyanobacterial toxin cylindrospermopsin by hydroxyl radicals in homogeneous UV/H2O2 process. Environ. Sci. Technol. 2014, 48, 4495–4504. [Google Scholar] [CrossRef]
- Prieto, A.I.; Guzmán-Guillén, R.; Valderrama-Fernández, R.; Jos, Á.; Cameán, A.M. Influence of Cooking (Microwaving and Broiling) on Cylindrospermopsin Concentration in Muscle of Nile Tilapia (Oreochromis niloticus) and Characterization of Decomposition Products. Toxins 2017, 9, 177. [Google Scholar] [CrossRef]
- Senogles, P.; Shaw, G.; Smith, M.; Norris, R.; Chiswell, R.; Mueller, J.; Sadler, R.; Eaglesham, G. Degradation of the cyanobacterial toxin cylindrospermopsin, from Cylindrospermopsis raciborskii, by chlorination. Toxicon 2000, 38, 1203–1213. [Google Scholar] [CrossRef] [PubMed]
- Wu, C.C.; Huang, W.J.; Ji, B.H. Degradation of cyanotoxin cylindrospermopsin by TiO2-assisted ozonation in water. J. Environ. Sci. Health Part A 2015, 50, 1116–1126. [Google Scholar] [CrossRef] [PubMed]
- Yan, S.; Jia, A.; Merel, S.; Snyder, S.A.; O’Shea, K.E.; Dionysiou, D.D.; Song, W. Ozonation of Cylindrospermopsin (Cyanotoxin): Degradation Mechanisms and Cytotoxicity Assessments. Environ. Sci. Technol. 2016, 50, 1437–1446. [Google Scholar] [CrossRef] [PubMed]
- Ortiz, D.; Munoz, M.; Garcia, J.; Cirés, S.; de Pedro, Z.M.; Quesada, A.; Casas, J.A. Photo-Fenton oxidation of cylindrospermopsin at neutral pH with LEDs. Environ. Sci. Pollut. Res. 2023, 30, 21598–21607. [Google Scholar] [CrossRef]
- Fotiou, T.; Triantis, T.; Kaloudis, T.; Hiskia, A. Photocatalytic degradation of cylindrospermopsin under UV-A, solar and visible light using TiO2. Mineralization and intermediate products. Chemosphere 2015, 119, S89–S94. [Google Scholar] [CrossRef]

Disclaimer/Publisher’s Note: The statements, opinions and data contained in all publications are solely those of the individual author(s) and contributor(s) and not of MDPI and/or the editor(s). MDPI and/or the editor(s) disclaim responsibility for any injury to people or property resulting from any ideas, methods, instructions or products referred to in the content. |
© 2024 by the authors. Licensee MDPI, Basel, Switzerland. This article is an open access article distributed under the terms and conditions of the Creative Commons Attribution (CC BY) license (https://creativecommons.org/licenses/by/4.0/).