Abstract
In axisymmetric fusion devices like tokamaks, the winding of the magnetic field is characterized by its safety profile . Similarly, the winding of the current density field is characterized by . Currently, the relationship between and profiles and their effect on tokamak plasma confinement properties remains unexplored, as the profile is neither computed nor considered. This study presents a reconstruction of the current density winding profile from experimental data in the quiescent H-mode. The topology analysis derived from was carried out using Hamada coordinates. It shows a large central plasma region unaffected by current filamentation-driven resonant magnetic perturbations, while the outer region harbors a spectrum of magnetic resonant modes, induced by current filaments located within the core plasma, which degrade peripheral confinement. These results suggest a QH-mode signature pattern needing further validation with additional data. Implementing real-time monitoring could provide insights into tokamak confinement regimes with significant implications.
1. Introduction
It has been shown that [1], in axisymmetric driven devices for fusion applications, such as the tokamak, both the magnetic and the current density fields have rotational transforms which allows a complete classification of modes according to their topology. At each given time, one can characterize the way that axisymmetric vector fields wind about the central axis through the well-known safety profile for the magnetic field and its analogous profile for the current density field or, equivalently, through their inverse functions that are traditionally named winding profiles. In the experiments, modern sophisticated codes can resolve the Grad–Shafranov equation in real time and reconstruct the equilibrium using the data derived from its diagnostics [2,3,4,5,6,7,8,9,10,11,12,13,14,15,16,17,18,19,20]. This equilibrium reconstruction specifically allown to be obtained in real time. Complementing this reconstruction with the computation of can fully identify the nature of the perturbation modes and unveil the turbulence actuators. Indeed, as in neutral fluids, it is an empirical fact that vorticity filaments support (velocity) turbulence [21], and one may infer that current density filaments play a similar role in small-scale magnetic turbulence, which is the backbone of anomalous heat transport [22,23,24]. They have been extensively reported in experiments, e.g., in Refs. [25,26,27,28,29,30,31,32].
Currently, the study of the relationship between the and profiles in relation to the confinement properties of tokamak plasmas is a blank slate, as the profile is neither computed nor taken into account. It is the objective of the present study to perform the first cross-analysis of the magnetic and current density field topologies. This will be carried out using the data of Pankin et al. [33] on the discharge 163518 from the DIII-D tokamak operating in the quiescent H-mode. Quiescent H-modes, also known as QH-modes, form an operational regime in tokamak plasmas that has garnered significant attention in the magnetic confinement fusion community. This has been achieved in tokamaks with advanced plasma control systems, which allow for precise control of the plasma shape, density, and temperature. QH mode was originally discovered on DIII-D [34,35] and was subsequently investigated on ASDEX-Upgrade [36,37,38], JT-60U [39,40] and JET [37]. QH modes form a subset of high (H) confinement-mode plasmas that exhibit a unique behavior as they operate at high confinement levels without the presence of large Edge-Localized Modes (ELMs).
2. Methods
2.1. Reconstruction Problem Formulation
To my knowledge, this work [1] contains the first evaluation of in the convenient flux coordinates. Using the Grad–Shafranov equation, the expression of the profile in the usual poloidal magnetic flux function variable is [1]
where p is the pressure and F is the diamagnetic function, . Consequently, any classical equilibrium reconstruction code could freely add the evaluation line (1) to compute , as all the required information is known. Indeed, it should have converged to unfold the flux functions and , determined by minimizing the from the measured data and obtaining from
where v is the volume enclosed by the flux surface. Therefore it should have already computed the surface average function . Our objective here is to compute using the expression (1). Figure 2 in Pankin et al.’s article [33] represents the flux surfaces computed with EFIT for the DIII-D discharge 163518 at 2350 ms. Also plotted are the total plasma pressure, the pressure gradient , and the and profiles as functions of the normalized toroidal flux. Consequently, only the data for as a function of the normalized toroidal flux is missing, and it needs to be estimated in order to use Equation (1).
2.2. Evaluation of the Flux Surface Averages
Here, we use the usual flux coordinates , where and are the poloidal and toroidal geometrical angles, respectively. Let us recall the definition of the flux surface average as
Using the expression of the poloidal magnetic field, Equation (3) yields
The closed line integrals are evaluated here using [41], for any point function f,
where denotes the area of the surface of the poloidal cross-section enclosed by the flux surface . We therefore have
In the above expression, it is possible to use the normalized poloidal magnetic flux, , instead of the poloidal magnetic flux, . This connects with the dimensionless (normalized) effective-radius based on the toroidal magnetic flux enclosed by the flux surface defined as
where denotes the surface of the poloidal cross-section of the plasma within the last closed flux surface. The connection is made using the expression of as
2.3. Principles of the Analysis
It has been proposed in Ref. [1] to inspect the resonant or non-resonant character of any perturbation with respect to both the magnetic and current density field lines. In toroidal geometry, the appropriate framework to do this is to use the Hamada coordinates , which are a canonical set of variables for both the magnetic and current density field lines. In the Hamada coordinates [42], if then . This allows a mode-by-mode topological classification [1]. Moreover, the and profiles of the axisymetric equilibria are intrinsic quantities that do not depend on the coordinate system, as long as the same magnetic surfaces are parameterized, so that and . Let us now consider some current density perturbation . This can be resonant for the current density field lines if, at some , or equivalently corresponding v or , one has , i.e., . It can also be resonant for the magnetic field lines if there exists some , such that . Let us use an example. Suppose that is smaller than 0.2 everywhere, whereas is above 1 so that has positive values smaller than 1. Then, the mode is magnetically resonant but is not associated with a resonant current density perturbation as . The same is true for all the modes such that .
In the following sections of the paper, modes are considered in the Hamada setting. A mode in the Hamada coordinates does not correspond to a single mode in flux coordinates. It projects onto a spectrum of modes in flux coordinates, where and where the dominant contribution comes from the mode. In the cylindrical limit, this would be the only contribution. Consequently, in the toroidal geometry, a Hamada -resonance generally amounts in the real space to a superposition of filaments.
3. Results
3.1. Computation of Flux Surface Averages
The plasma domain was extracted and digitized from Figure 2 of Ref. [33]. The last closed flux surface is the inner bold curve of Figure 1. In order to compute the flux surface averages of using Equation (6), one needs to know the flux contours. To achieve this, the Grad–Shafranov equation was solved using this last closed flux surface as the boundary of the computational domain. Figure 1 depicts the obtained approximation of the flux contours and the red dot reports the location of the magnetic axis obtained from Figure 2 of Ref. [33]. One can then proceed to the evaluation of the flux surface averages of . The resulting estimates are depicted in Figure 2. To account for some inevitable imprecision, a confidence band is drawn around the estimated curve, spanning values between 0.93 and 1.07 times the estimated .
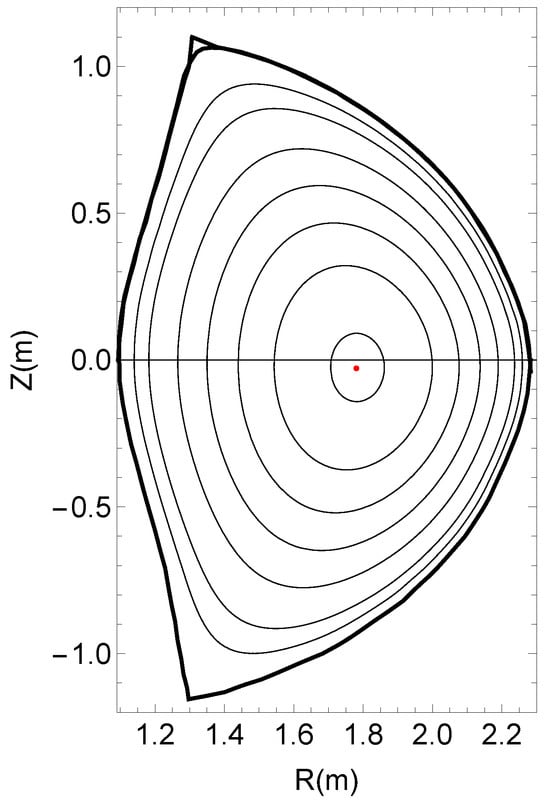
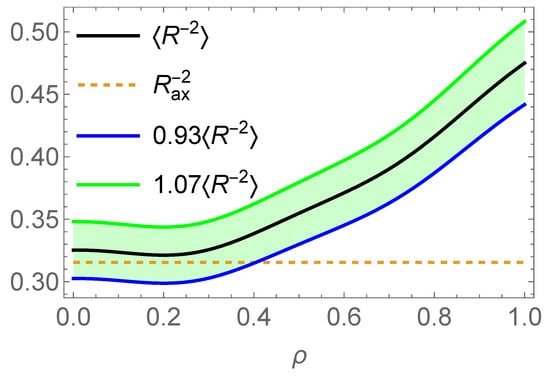
Figure 2.
Evaluation of the flux surface average as a function of . At , the flux surface average of should be with the radius of the magnetic axis. The reconstructed curve shows some discrepancy compared to this value in the limit . To account for some inevitable imprecision, a confidence band is shown around the estimated curve, spanning values between 0.93 and 1.07 times the estimated .
3.2. Equilibrium Reconstruction of the -Profile
We then have all the requested information to compute the winding profile, , of the current density field lines. The reconstructed profile is shown on Figure 3.
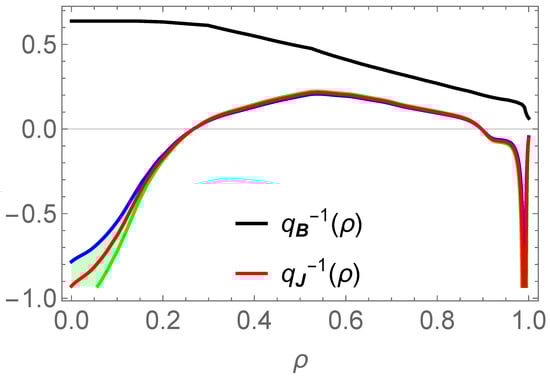
Figure 3.
Evaluation of the winding profile, , of the current density field lines in the QH mode. To account for some inevitable imprecision, the confidence band is depicted around the estimated curve using, in the evaluation of , values spanning between 0.93 and 1.07 times the estimated . The winding profile, , of the magnetic field lines is represented for comparison. We do not take into account here the imprecision in the digitization of the , , and profiles.
Figure 3 represents the confidence band introduced by some uncertainty in the evaluation of the flux surface averages of . To be thoroughly rigorous, we must also test the robustness of the computation of against errors in curve digitization. Let us then estimate the uncertainty in the evaluation of introduced by the digitization of the data. Considering as a function of , , and , the Laplace–Gauss uncertainty propagation formula yields, for the uncertainty on ,
After some calculations using Equation (1), Equation (9) gives
Assuming that all the uncertainties are similar with yields
For , one computes the uncertainty band shown in Figure 4.
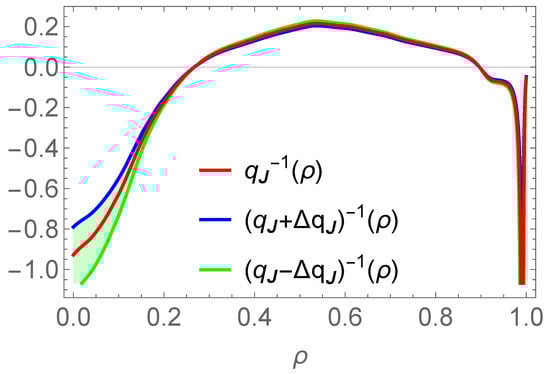
Figure 4.
Evaluation of the winding profile, , of the current density field lines in the QH mode. To account for the imprecision in the digitization of the , and profiles and in the evaluation of the flux surface averages , the confidence band for this evaluation is plotted using Equation (10) with .
The obtained confidence band for the evaluation of the current density winding profile is very similar to that plotted in Figure 3. This shows that the result obtained for is highly robust to small perturbations in the data, except in a very central zone of the tokamak plasma (roughly within ) where its knowledge is less precise and the confidence interval is larger. The negative value of in this region renders this point irrelevant in terms of the topological properties of magnetic and current density modes: in this region, irrespective of the point located within the confidence interval, filamentation modes (i.e., current density resonances) are not associated with magnetic islands but with non-resonant magnetic perturbations.
3.3. Important Remark
It turns out that the shape of the current density winding profile, , could have been inferred simply by the inspection of the functions and plotted in Figure 2 of Ref. [33]. Indeed, this shows that for , while is positive in the core, changes sign, and becomes negative in an inner region before returning to positive in the edge domain. The locations where vanishes correspond to the two zeros of shown in the plots. The height of the positive bump can be inferred by any rough geometrical estimate for the surface average . Indeed, Figure 3 shows that the maximal value of the current density winding profile is very robust to variations in .
4. Analysis and Discussion
4.1. Classification of Modes
Let us now analyse Figure 5 and first consider the current density winding profile.
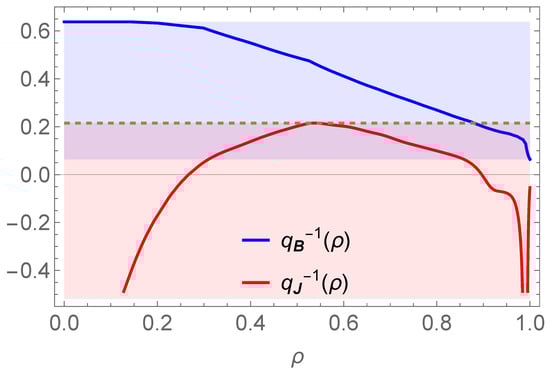
Figure 5.
Plots of the winding profiles as in Figure 3. For clarity, the confidence band is not drawn. Above the horizontal dashed line, in the blue stripe, the resonant magnetic modes , such that are not associated with resonant current density modes. In the violet stripe, modes are both resonant to and . In the red band, modes are only resonant to .
Any mode where there exists some for which is resonant for the current density field, and therefore, when isolated, takes the form of a current filamentation mode. Yet, in tokamaks, the magnetic and current density field are, at any time, related by Ampère’s law, as the displacement current is substantially lower than the plasma current. This filamentation mode is then, by Ampère’s law, associated with some magnetic perturbation. This magnetic perturbation can be either resonant for magnetic field lines if , or non-resonant otherwise. In the red stripe, the spectrum of tiny filamentation modes is associated by Ampère’s law with a spectrum of non-resonant magnetic modes that has a negligible impact on electron heat transport. On the contrary, in the violet stripe, the spectrum of tiny filamentation modes is associated by Ampère’s law to a spectrum of resonant magnetic modes that may impact the electron heat transport. Finally, in the blue stripe, there is no resonant mode for the current density field. Therefore, the potentially resonant magnetic modes can only arise there from smooth, non-resonant, modes of deformation of the equilibrium current density field lines.
Figure 6 shows the spatial distribution of magnetic modes, categorized according to the scheme outlined in Figure 5.
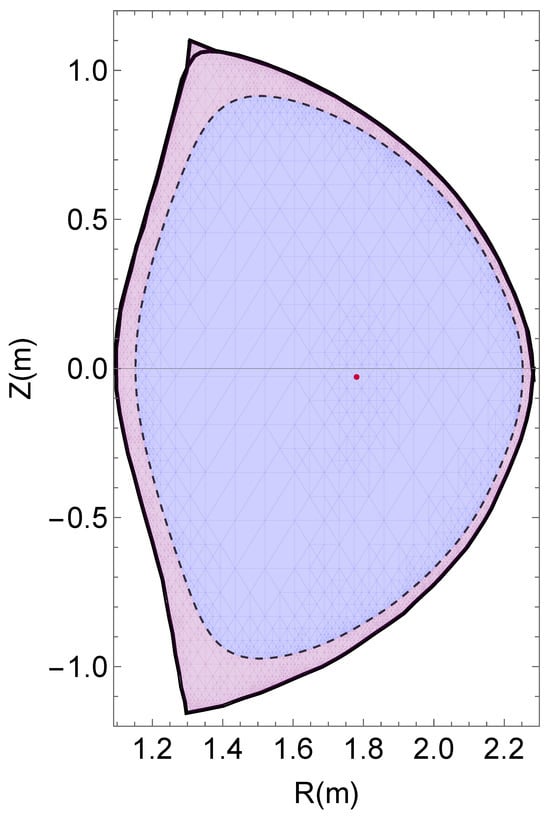
Figure 6.
The large central zone colored in blue is free from resonant magnetic perturbations originating from current density filamentation modes in the QH mode. In the outer violet-colored region of the tokamak plasma having approx. , there exists some spectrum of resonant magnetic perturbations associated with the spectrum of tiny current filamentation modes, which are present in the interval , according to Figure 5.
The broad central region on the poloidal cross-section, depicted in blue in this figure, as in Figure 5, is devoid of magnetic modes originating from the current filament spectrum. This region extends up to . This value is obtained from Figure 5 as the -value at which the function enters the violet stripe. In the outer region, depicted in violet, the resonant magnetic modes are conversely originating from a spectrum of current filamentation modes. This is due to the superposition of numerous current filaments that permeate the plasma in the region spanning from to where the image of is in the violet stripe in Figure 5.
Consequently, the comparison of the and profiles (or, equivalently, of their inverses), in an example of QH-mode occurrence, uncovers a key feature. It reveals the existence of two distinct plasma zones: a central region unaffected by magnetic turbulence caused by current filaments, and a thin peripheral zone where there exists a spectrum of magnetic modes associated to current filaments. Let us now briefly review some experimental facts about QH-modes before interpreting this result.
4.2. Overview of QH-Mode Phenomenology
In the standard H-modes, ELMs result in substantial transient spikes of particle and heat fluxes to the divertor components, which could potentially cause unacceptable damage in future fusion devices. In QH-modes, the plasma remains stable and quiet, without the deleterious ELM events. In terms of confinement, QH modes are similar to H modes. Their performance indicators are at the same level. Furthermore, although the quiescent H-modes do not experience ELMs, the edge particle transport in QH-mode is still rapid enough to provide some beneficial particle exhaust, which is a crucial requirement for future fusion reactors in order to remove impurities and helium ash. The QH-mode differs then from the standard ELM-free H-mode, where the density and radiated power exhibit a monotonic increase. An edge electromagnetic mode, the edge harmonic oscillation (EHO), provides enhanced edge particle transport that, when time-averaged, surpasses the transport produced by ELMs. This enhanced, time-averaged particle transport provided by the EHO allows for the constant density operation observed in the QH mode [43]. Notably, the EHO is self-generated by the plasma, and therefore the QH mode does not require the additional coils needed for ELM suppression via resonant magnetic perturbations [44].
4.3. Discussion
Generically, any perturbation to the tokamak equilibrium current density decomposes into a spectrum of modes, including a resonant spectrum that is a superposition of small current density filaments. In a Poincaré plot, the overlap of the current density field resonances (filaments modes) may result in some chaotic braiding of the current density field lines, with only possibly large filaments emerging from an overall chaotic sea. Yet, the corresponding magnetic perturbations may or may not be resonant depending on . In the context of the QH-mode considered here, the Figure 5 tells us that only in the violet stripe does the spectrum of tiny current density resonances produce a spectrum of resonant magnetic perturbations triggering magnetic braiding [45]. This happens here in the edge plasma region of the tokamak represented on Figure 6. Conversely, the large central zone of the plasma, colored in blue, is preserved from this current-driven small-scale magnetic turbulence. Figure 6 is therefore consistent with the phenomenological properties of QH-modes: the fact that, in the whole plasma center, the spectrum of magnetic modes associated with small current density filaments is non-resonant and, therefore, does not affect the integrity of the magnetic field lines is consistent with an improved heat confinement. This makes this operating mode similar to an H-mode. Conversely, in the edge plasma, the spectrum of small current density filaments spoils the integrity of the magnetic field lines. This is consistent with a low heat and electron confinement in the edge region. This is also consistent with edge particle exhaust enabling the constant density operation in QH-mode.
In addition to these general outcomes, the present reconstruction concerns the discharge 163518 from the DIII-D tokamak at time , where a clear EHO, a coherent edge magnetic activity characteristic of many QH-mode plasmas, with dominant mode is observed. This magnetic activity can be inferred to be related to magnetic resonant modes at or , having dominant mode numbers or being associated with some plasma current filamentation present at or that takes place close to , according to Figure 5.
5. Conclusions
As advocated in Ref. [1], if the axisymmetric fusion device could be driven so as to disconnect and , in the sense that the intersection of the images of the functions and is empty, then all the resonant magnetic modes would only originate from smooth modes of deformation of the current but not from current density resonances. All the small magnetic perturbations produced by the tiny current filaments necessarily coming in from the distortion to axisymmetry about the resonant surfaces would then not affect the integrity of the magnetic surfaces, being nonresonant. Thus, by forcing the operating regime of a tokamak to allow the and profiles to be separated, the magnetic surfaces could be preserved from magnetic perturbations due to current filamentation modes. This could be a favorable route for preserving heat confinement.
This work presents the first cross-analysis of magnetic and current density field topologies. This uses experimental data obtained in the promising QH-mode regime. If the pattern of the magnetic and current density winding profiles displayed in Figure 5 characterizes the QH-modes, which needs further investigation, then the central region of the tokamak plasma, in which and are disconnected, supports the above scenario as heat confinement is preserved there. On the contrary, the hump in the current density winding profile taking place in the violet stripe signals that the outer plasma region is the home of a spectrum of current filament-produced resonant magnetic modes degrading the peripheral confinement. This stochastization may explain the absence of edge-localized modes and allows some beneficial particle exhaust.
Overall, the present results point to a possible signature pattern of the QH-modes to be further reinforced and substantiated by additional data. Implementing the real-time monitoring could help uncover insights into the diverse tokamak confinement regimes with possibly important implications for magnetic confinement fusion. In particular, similar analyses could focus on uncovering the signatures associated with the emergence of ELMs. In the case of ELMs, one hypothesis is that the and profiles are locally equal to some in the edge region in coincidence with a local vanishing of the pressure gradient and the current filament flowing within the magnetic island.
Funding
This research received no external funding.
Data Availability Statement
The data presented in this study are available in the article. The raw data used were originally published in [A.Y. Pankin et al 2020 Nucl. Fusion 60 092004] and are available under the Creative Commons Attribution 3.0 licence (https://doi.org/10.1088/1741-4326/ab9afe, accessed on 8 June 2025). The results derived from these data are fully presented in this work.
Acknowledgments
M.C.F. acknowledges support from EUROfusion H-Europe/WP24 TRED.
Conflicts of Interest
The author declares no conflict of interest.
References
- Firpo, M.C. Interplay of the magnetic and current density field topologies in axisymmetric devices for magnetic confinement fusion. J. Plasma Phys. 2024, 90, 175900601. [Google Scholar] [CrossRef]
- Lao, L.; John, H.S.; Stambaugh, R.; Kellman, A.; Pfeiffer, W. Reconstruction of current profile parameters and plasma shapes in tokamaks. Nucl. Fusion 1985, 25, 1611. [Google Scholar] [CrossRef]
- Lao, L.; Ferron, J.; Groebner, R.; Howl, W.; John, H.S.; Strait, E.; Taylor, T. Equilibrium analysis of current profiles in tokamaks. Nucl. Fusion 1990, 30, 1035. [Google Scholar] [CrossRef]
- Lütjens, H.; Bondeson, A.; Sauter, O. The CHEASE code for toroidal MHD equilibria. Comput. Phys. Commun. 1996, 97, 219–260. [Google Scholar] [CrossRef]
- Ferron, J.; Walker, M.; Lao, L.; John, H.S.; Humphreys, D.; Leuer, J. Real time equilibrium reconstruction for tokamak discharge control. Nucl. Fusion 1998, 38, 1055. [Google Scholar] [CrossRef]
- Lao, L.L.; John, H.E.S.; Peng, Q.; Ferron, J.R.; Strait, E.J.; Taylor, T.S.; Meyer, W.H.; Zhang, C.; You, K.I. MHD Equilibrium Reconstruction in the DIII-D Tokamak. Fusion Sci. Technol. 2005, 48, 968–977. [Google Scholar] [CrossRef]
- Blum, J.; Boulbe, C.; Faugeras, B. Real-time equilibrium reconstruction in a tokamak. In Proceedings of the Burning Plasma Diagnostics: An International Conference, Varenna, Italy, 24–28 September 2007; Orsitto, F., Gorini, G., Sindoni, E., Tardocchi, M., Eds.; American Institute of Physics: College Park, MD, USA, 2007; Volume 988, pp. 420–429. [Google Scholar] [CrossRef]
- Katsuro-Hopkins, O.; Sabbagh, S.; Bialek, J.; Park, H.; Bak, J.; Chung, J.; Hahn, S.; Kim, J.; Kwon, M.; Lee, S.; et al. Equilibrium and global MHD stability study of KSTAR high beta plasmas under passive and active mode control. Nucl. Fusion 2010, 50, 025019. [Google Scholar] [CrossRef]
- Blum, J.; Boulbe, C.; Faugeras, B. Reconstruction of the equilibrium of the plasma in a Tokamak and identification of the current density profile in real time. J. Comput. Phys. 2012, 231, 960–980. [Google Scholar] [CrossRef]
- Li, G.Q.; Ren, Q.L.; Qian, J.P.; Lao, L.L.; Ding, S.Y.; Chen, Y.J.; Liu, Z.X.; Lu, B.; Zang, Q. Kinetic equilibrium reconstruction on EAST tokamak. Plasma Phys. Control. Fusion 2013, 55, 125008. [Google Scholar] [CrossRef]
- Faugeras, B.; Orsitto, F.; Contributors, J. Equilibrium reconstruction at JET using Stokes model for polarimetry. Nucl. Fusion 2018, 58, 106032. [Google Scholar] [CrossRef]
- Xing, Z.; Eldon, D.; Nelson, A.; Roelofs, M.; Eggert, W.; Izacard, O.; Glasser, A.; Logan, N.; Meneghini, O.; Smith, S.; et al. CAKE: Consistent Automatic Kinetic Equilibrium reconstruction. Fusion Eng. Des. 2021, 163, 112163. [Google Scholar] [CrossRef]
- Zheng, L.; Kotschenreuther, M.T.; Waelbroeck, F.L.; Todo, Y. ATEQ: Adaptive toroidal equilibrium code. Phys. Plasmas 2022, 29, 072503. [Google Scholar] [CrossRef]
- Hansen, C.; Stewart, I.G.; Burgess, D.; Pharr, M.; Guizzo, S.; Logak, F.; Nelson, A.O.; Paz-Soldan, C. TokaMaker: An open-source time-dependent Grad-Shafranov tool for the design and modeling of axisymmetric fusion devices. arXiv 2023, arXiv:2311.07719. [Google Scholar] [CrossRef]
- Huang, Y.; Xiao, B.J.; Luo, Z.P. Fast parallel Grad-Shafranov solver for real-time equilibrium reconstruction in EAST tokamak using graphic processing unit. Chin. Phys. B 2017, 26, 085204. [Google Scholar] [CrossRef]
- Ma, R.; Xia, F.; Ling, F.; Li, J. Acceleration optimization of real-time equilibrium reconstruction for HL-2A tokamak discharge control. Plasma Sci. Technol. 2018, 20, 025601. [Google Scholar] [CrossRef]
- Joung, S.; Kim, J.; Kwak, S.; Bak, J.; Lee, S.; Han, H.; Kim, H.; Lee, G.; Kwon, D.; Ghim, Y.C. Deep neural network Grad–Shafranov solver constrained with measured magnetic signals. Nucl. Fusion 2019, 60, 016034. [Google Scholar] [CrossRef]
- Lao, L.L.; Kruger, S.; Akcay, C.; Balaprakash, P.; Bechtel, T.A.; Howell, E.; Koo, J.; Leddy, J.; Leinhauser, M.; Liu, Y.Q.; et al. Application of machine learning and artificial intelligence to extend EFIT equilibrium reconstruction. Plasma Phys. Control. Fusion 2022, 64, 074001. [Google Scholar] [CrossRef]
- Kaltsas, D.A.; Throumoulopoulos, G.N. Neural network tokamak equilibria with incompressible flows. Phys. Plasmas 2022, 29, 022506. [Google Scholar] [CrossRef]
- Pavone, A.; Merlo, A.; Kwak, S.; Svensson, J. Machine learning and Bayesian inference in nuclear fusion research: An overview. Plasma Phys. Control. Fusion 2023, 65, 053001. [Google Scholar] [CrossRef]
- Douady, S.; Couder, Y.; Brachet, M.E. Direct observation of the intermittency of intense vorticity filaments in turbulence. Phys. Rev. Lett. 1991, 67, 983–986. [Google Scholar] [CrossRef]
- Rechester, A.B.; Rosenbluth, M.N. Electron Heat Transport in a Tokamak with Destroyed Magnetic Surfaces. Phys. Rev. Lett. 1978, 40, 38–41. [Google Scholar] [CrossRef]
- Isichenko, M.B. Effective plasma heat conductivity in `braided’ magnetic field-I. Quasi-linear limit. Plasma Phys. Control. Fusion 1991, 33, 795. [Google Scholar] [CrossRef]
- Isichenko, M.B. Effective plasma heat conductivity in ’braided’ magnetic field-II. Percolation limit. Plasma Phys. Control. Fusion 1991, 33, 809. [Google Scholar] [CrossRef]
- Vianello, N.; Naulin, V.; Schrittwieser, R.; Müller, H.W.; Zuin, M.; Ionita, C.; Rasmussen, J.J.; Mehlmann, F.; Rohde, V.; Cavazzana, R.; et al. Direct Observation of Current in Type-I Edge-Localized-Mode Filaments on the ASDEX Upgrade Tokamak. Phys. Rev. Lett. 2011, 106, 125002. [Google Scholar] [CrossRef] [PubMed]
- Harrison, J.R.; Fishpool, G.M.; Thornton, A.J.; Walkden, N.R.; MAST Team. The appearance and propagation of filaments in the private flux region in Mega Amp Spherical Tokamak. Phys. Plasmas 2015, 22, 092508. [Google Scholar] [CrossRef]
- Ebrahimi, F. Nonlinear reconnecting edge localized modes in current-carrying plasmas. Phys. Plasmas 2017, 24, 056119. [Google Scholar] [CrossRef]
- Banerjee, S.; Bisai, N.; Chandra, D.; Dhyani, P.; Manchanda, R.; Chowdhuri, M.B.; Ramaiya, N.; Sangwan, D.; Ghosh, J.; Tanna, R.L.; et al. Observation of thick toroidal filaments during the disruptive phase of Aditya tokamak plasma. Phys. Plasmas 2017, 24, 102513. [Google Scholar] [CrossRef]
- Grenfell, G.; Spolaore, M.; Abate, D.; Carraro, L.; Marrelli, L.; Predebon, I.; Spagnolo, S.; Veranda, M.; Agostini, M.; van Milligen, B.; et al. Turbulent filament properties in L and H-mode regime in the RFX-mod operating as a tokamak. Nucl. Fusion 2020, 60, 126006. [Google Scholar] [CrossRef]
- Hao, G.Z.; Dong, G.Q.; Cui, B.T.; Liu, Y.Q.; Xu, Y.H.; Sun, T.F.; Ji, X.Q.; Wang, S.; Zhao, Y.F.; Xu, J.Q.; et al. Toroidal modeling of 3D perturbations generated by current filaments in scrape-off layer in tokamak with biased divertor targets. Nucl. Fusion 2022, 63, 016006. [Google Scholar] [CrossRef]
- Ham, C.; Kirk, A.; Pamela, S.; Wilson, H. Filamentary plasma eruptions and their control on the route to fusion energy. Nat. Rev. Phys. 2020, 2, 159–167. [Google Scholar] [CrossRef]
- Chouchene, S.; Brochard, F.; Lemoine, N.; Cavalier, J.; Desecures, M.; Weinzettl, V. Mutual interactions between plasma filaments in a tokamak evidenced by fast imaging and machine learning. Phys. Review. E 2024, 109, 045201. [Google Scholar] [CrossRef] [PubMed]
- Pankin, A.; King, J.; Kruger, S.; Chen, X.; Burrell, K.; Garofalo, A.; Groebner, R.J.; McKee, G.; Yan, Z. Towards validated MHD modeling of edge harmonic oscillation in DIII-D QH-mode discharges. Nucl. Fusion 2020, 60, 092004. [Google Scholar] [CrossRef]
- Burrell, K.H.; Austin, M.E.; Brennan, D.P.; DeBoo, J.C.; Doyle, E.J.; Fenzi, C.; Fuchs, C.; Gohil, P.; Greenfield, C.M.; Groebner, R.J.; et al. Quiescent double barrier high-confinement mode plasmas in the DIII-D tokamak. Phys. Plasmas 2001, 8, 2153–2162. [Google Scholar] [CrossRef]
- Burrell, K.H.; Austin, M.E.; Brennan, D.P.; DeBoo, J.C.; Doyle, E.J.; Gohil, P.; Greenfield, C.M.; Groebner, R.J.; Lao, L.L.; Luce, T.C.; et al. Quiescent H-mode plasmas in the DIII-D tokamak. Plasma Phys. Control. Fusion 2002, 44, A253. [Google Scholar] [CrossRef]
- Suttrop, W.; Maraschek, M.; Conway, G.D.; Fahrbach, H.U.; Haas, G.; Horton, L.D.; Kurki-Suonio, T.; Lasnier, C.J.; Leonard, A.W.; Maggi, C.F.; et al. ELM-free stationary H-mode plasmas in the ASDEX Upgrade tokamak. Plasma Phys. Control. Fusion 2003, 45, 1399. [Google Scholar] [CrossRef]
- Suttrop, W.; Hynönen, V.; Kurki-Suonio, T.; Lang, P.; Maraschek, M.; Neu, R.; Stäbler, A.; Conway, G.; Hacquin, S.; Kempenaars, M.; et al. Studies of the ‘Quiescent H-mode’ regime in ASDEX Upgrade and JET. Nucl. Fusion 2005, 45, 721. [Google Scholar] [CrossRef]
- Meier, L.; Hoelzl, M.; Cathey, A.; Huijsmans, G.; Viezzer, E.; Dunne, M.; van Dijk, J.; Zabala, D.J.C.; Lackner, K.; Günter, S.; et al. MHD simulations of formation, sustainment and loss of quiescent H-mode in the all-tungsten ASDEX Upgrade. Nucl. Fusion 2023, 63, 086026. [Google Scholar] [CrossRef]
- Sakamoto, Y.; Shirai, H.; Fujita, T.; Ide, S.; Takizuka, T.; Oyama, N.; Kamada, Y. Impact of toroidal rotation on ELM behaviour in the H-mode on JT-60U. Plasma Phys. Control. Fusion 2004, 46, A299. [Google Scholar] [CrossRef]
- Oyama, N.; Sakamoto, Y.; Isayama, A.; Takechi, M.; Gohil, P.; Lao, L.; Snyder, P.; Fujita, T.; Ide, S.; Kamada, Y.; et al. Energy loss for grassy ELMs and effects of plasma rotation on the ELM characteristics in JT-60U. Nucl. Fusion 2005, 45, 871. [Google Scholar] [CrossRef]
- Khinchin, A.Y. Mathematical Foundations of Statistical Mechanics; Dover Publications: New York, NY, USA, 1949. [Google Scholar]
- Hamada, S. Hydromagnetic equilibria and their proper coordinates. Nucl. Fusion 1962, 2, 1–2. Available online: https://iopscience.iop.org/article/10.1088/0029-5515/2/1-2/005 (accessed on 8 June 2025). [CrossRef]
- Burrell, K.H.; Osborne, T.H.; Snyder, P.B.; West, W.P.; Fenstermacher, M.E.; Groebner, R.J.; Gohil, P.; Leonard, A.W.; Solomon, W.M. Quiescent H-Mode Plasmas with Strong Edge Rotation in the Cocurrent Direction. Phys. Rev. Lett. 2009, 102, 155003. [Google Scholar] [CrossRef] [PubMed]
- Evans, T.E.; Moyer, R.A.; Burrell, K.H.; Fenstermacher, M.E.; Joseph, I.; Leonard, A.W.; Osborne, T.H.; Porter, G.D.; Schaffer, M.J.; Snyder, P.B.; et al. Edge stability and transport control with resonant magnetic perturbations in collisionless tokamak plasmas. Nat. Phys. (Print) 2006, 2, 419–423. [Google Scholar] [CrossRef]
- Firpo, M.C. Microtearing turbulence: Magnetic braiding and disruption limit. Phys. Plasmas 2015, 22, 122511. [Google Scholar] [CrossRef]
Disclaimer/Publisher’s Note: The statements, opinions and data contained in all publications are solely those of the individual author(s) and contributor(s) and not of MDPI and/or the editor(s). MDPI and/or the editor(s) disclaim responsibility for any injury to people or property resulting from any ideas, methods, instructions or products referred to in the content. |
© 2025 by the author. Licensee MDPI, Basel, Switzerland. This article is an open access article distributed under the terms and conditions of the Creative Commons Attribution (CC BY) license (https://creativecommons.org/licenses/by/4.0/).