Article

Spatial and Temporal Variation of C, N, and S Stable Isotopes and Seagrass Coverage Related to Eutrophication Stress in Zostera marina

by
Jerrica M. Waddell
1,
Christina C. Pater
1,
Michael R. S. Coffin
2,
Robert F. Gilmour, Jr.
3,
Simon C. Courtenay
4 and
Michael R. van den Heuvel
1,*
1
Canadian Rivers Institute, Department of Biology, University of Prince Edward Island, Charlottetown, PE C1A 4P3, Canada
2
Fisheries and Oceans Canada, Gulf Fisheries Center, Moncton, NB E1C 5K4, Canada
3
Faculty of Sustainable Design Engineering, University of Prince Edward Island, Charlottetown, PE C1A 4P3, Canada
4
Canadian Rivers Institute, School of Environment, Resources and Sustainability, University of Waterloo, Waterloo, ON N2L 3G1, Canada
*
Author to whom correspondence should be addressed.
Coasts 2024, 4(2), 419-436; https://doi.org/10.3390/coasts4020021
Submission received: 25 March 2024 / Revised: 1 May 2024 / Accepted: 23 May 2024 / Published: 3 June 2024

Abstract

:
Zostera marina is an ecologically valuable species that has been declining due to anthropogenic environmental stressors. In this study, spatial and temporal indicators of eelgrass stress, such as coverage and biomass, were compared with the isotopic composition of C, N, and S to understand the mechanism(s) of plant stress. Eelgrass samples were collected in June, July, and August of 2020 at five stations along an estuary spatial gradient in the southern Gulf of St. Lawrence to measure above- and below-ground biomass and tissue isotopes in eelgrass leaves and roots/rhizomes. Eelgrass biomass was lowest at the innermost sampling station, which coincided with eutrophication-induced hypoxia relative to outer sampling stations. δ13C levels at the upstream station were depleted compared to downstream stations. Comparatively, δ15N and δ34S findings were not correlated with plant biomass. Thus, sulfide intrusion was not a major stressor for eelgrass in this estuary. Between the years 2014 and 2020, eelgrass coverage was found to have increased, which coincided with high and low recorded external nutrient loads from the Wheatley River, respectively. Ultimately, these findings indicate that isotopic composition and biomass can be useful in assessing the health of eelgrass in temperate estuaries.

Graphical Abstract

1. Introduction

Zostera marina, or eelgrass, is an ecosystem engineer species of seagrass found across the world in temperate coastal marine ecosystems [1]. Anthropogenic activity is the greatest threat to seagrasses, and an estimated 29% of known areal seagrass coverage is thought to have been lost globally between the years 1879 and 2006 [2]. Nutrient enrichment in estuaries and coastal zones has been demonstrated to lead to eelgrass decline [3,4].
There is also evidence of eelgrass bed coverage improvement, or at minimum, stabilization, in response to successful efforts to reduce nutrient pollution [5]. As another example of stability, eelgrass distribution in the Izembek Lagoon, Alaska, and Puget Sound remained unchanged over the course of the study [6,7]. Some studies show mixed results, such as Short et al. [8], who linked ongoing development to continued eelgrass decline over a period of one decade at 7 of 10 sites studied. Other studies have drawn less optimistic conclusions, such as Leblanc et al. [9], who analyzed three decades of eelgrass data and noted that eelgrass health indicators remained poor following a large decline in eelgrass condition between the years 1995 and 1999. In some instances, monitoring eelgrass stability over time has been challenging, as there is often a paucity of historical data from eelgrass monitoring to confirm improvements [4].
While the decline of seagrasses is well documented, the exact mechanism(s) are not as clear, although a number have been proposed that could impact seagrasses either on their own or cumulatively. Nutrient and sediment loading and their related consequences of increased algal growth and light limitation are among the most common hypotheses for Zostera marina decline in temperate ecosystems [10]. Toxicity induced by excess nitrate has also been hypothesized as explanatory of seagrass decline. An experiment conducted by Burkholder et al. [11] found that eelgrass health (growth and survival) was negatively impacted when exposed to nitrate input, and these results were exacerbated at high water temperatures. Eutrophication generally alters the geochemistry of the ecosystem, including an increase in sediment anoxia, leading to higher sulfide levels. Toxicity from sulfide intrusion is yet another mechanism negatively impacting eelgrass growth and survival [12].
Elemental and isotopic analysis of tissue in stressed plants combined with measures of biomass can give clues as to the physiological status of the plant and help to identify potential mechanisms. Carbon isotopes can be employed to examine light availability as it is known to influence δ13C isotope differentiation. Ribulose bisphosphate carboxylase-oxygenase (RuBisCO) is the enzyme that fixes atmospheric carbon in plants. During periods of very high photosynthetic activity, carbon becomes limiting, and RUBISCO discriminates less between heavier and lighter isotopes [13,14]. This leads to isotopic signatures more enriched in δ13C. However, another mechanism can also lead to higher δ13C; seagrasses may obtain up to 50% of their carbon from bicarbonate, and this shift occurs during CO2 limitation. The specific mechanisms of stress leading to plant death remain unclear and likely vary beyond just light limitation. A recent study in the Gulf of St. Lawrence demonstrated that light was not a correlate of eelgrass coverage, and, with some exceptions, only nutrient load was explanatory for presumed declines [4]. However, this study could not examine the effects of nutrient loads on light attenuation by epiphytes, and even phytoplankton-related light reduction can be highly episodic. A conceptual model for shallow systems not limited by light suggests that macroalgal dominance will occur under this scenario [15], which is the case for most of the impacted estuaries in the southern Gulf of St. Lawrence [16].
Elevated nitrogen may lead to carbon starvation (a paucity of carbon assimilation that leads to poor tissue health) due to elevated levels of nitrate reductase reducing discrimination between carbon stable isotopes [17]. Isotopic studies from plants and sediment in seagrass meadows demonstrate little or no δ15N fractionation, indicating that ammonium from organic matter decay is the primary form of nitrogen in beds [18]. Thus, the tissue composition (C:N ratios) under eutrophic conditions may vary when plant growth is limited, and N is abundant as the plant uptakes sufficient nitrogen but cannot use it due to reduced carbon fixation.
Due to the substantial isotopic depletion of sulfide vs. sulfate, δ34S is an excellent indicator of tissue sulfide intrusion and can consequently be an indicator of plant stress. Holmer et al. [19] found that under high sulfide concentrations, Zostera marina accumulated elemental sulfur in below-ground tissues, which led to both rotting meristems as well as increased mortality across the study period. Additionally, more sulfide accumulated in eelgrass roots exposed to low light conditions compared with those under full light conditions, indicating that light saturation plays an important role in sulfide intrusion. While sulfide would be predicted to be elevated in eutrophic and often anoxic environments, with expected sulfide intrusion, results from field surveys are often, paradoxically, the opposite [20].
The primary objective was to use the discrimination of stable isotopes of C, N, and S, and the tissue composition of those elements to evaluate the relative amount of stress due to nitrogen enrichment/eutrophication. It was hypothesized that isotopic and elemental compositional changes may occur in stressed plants, including a lower ratio of total carbon to nitrogen and depleted δ34S indicative of sulfide intrusion along an estuarine eutrophication gradient. In areas where plant growth is limited by stress, isotopic carbon was expected to be depleted due to the absence of CO2 limitation. The second objective of this research was to examine the stability of eelgrass coverage in a eutrophic estuary over seven years. It was hypothesized that as freshwater nitrate concentrations have been stable for over a decade, eelgrass coverage would be unchanged. A secondary objective of examining coverage was to identify the upstream areas of eelgrass coverage where the plant may be stressed from higher nutrient loads. Eelgrass distribution was mapped in a eutrophic estuary using sonar techniques in 2014 and 2020. The isotopes δ13C, δ15N, and δ34S were measured in above-ground (leaves) and below-ground (roots/rhizomes) eelgrass tissues at five stations over three summer months along a spatial gradient within the estuary studied.

2. Materials and Methods

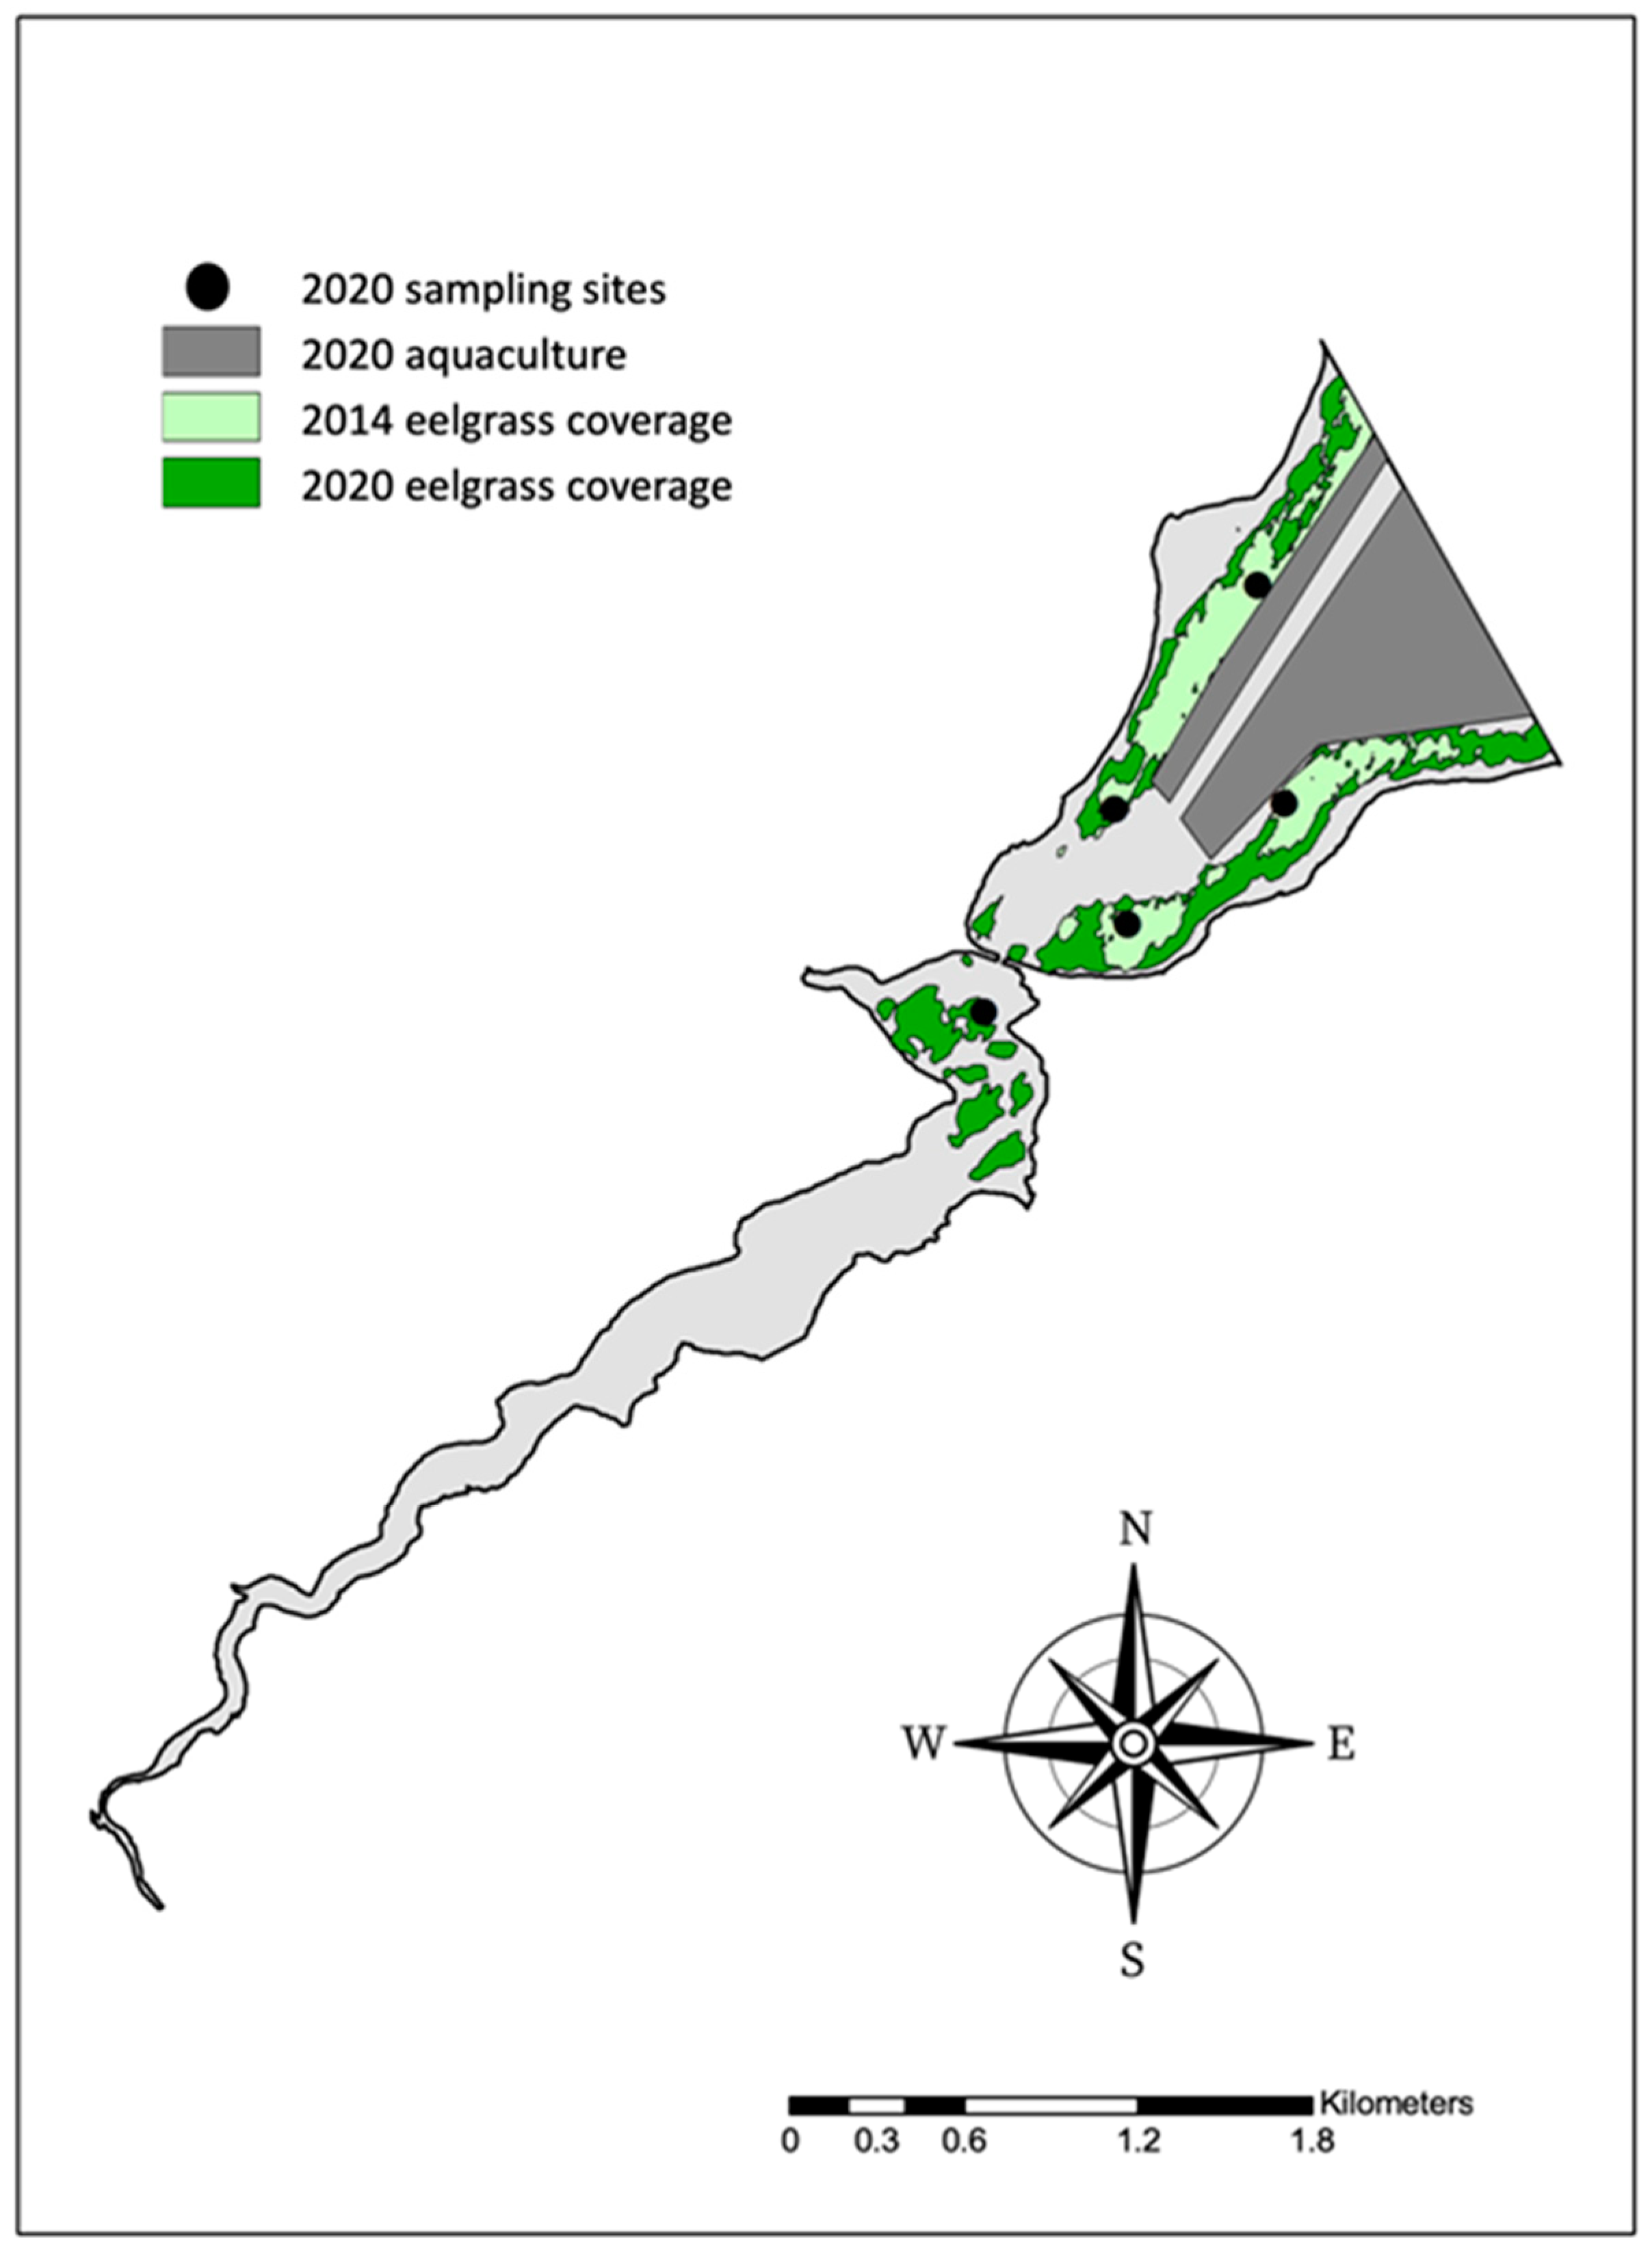
2.1. Study Area and Station Location

This study was conducted in the Wheatley River watershed, Prince Edward Island (PEI), Canada (Figure 1), which has a watershed area of 77.3 km2. Wheatley River was chosen as the location for this study because it is influenced by both agricultural (66.4% of land area) and aquacultural practices, and the impacts include evidence of eelgrass decline [4] and annual anoxia [21]. In this temperate region, eelgrass sprouts in mid-May and begins to wrack in early September. The extent of the Wheatley River estuary (area 3.6 km2) was determined by a mean salinity of 0.5 PSU at the upstream end and full mixing where the river enters a larger embayment at the downstream end. Wheatley River is on the north shore of the island, which is microtidal (mean tidal amplitude of 0.49 m) and has periods of diurnal tides as opposed to semi-diurnal, making it more susceptible to eutrophication. The residence time of the Wheatley River has been determined to be 1.74 d, midway in the regional range of 0.5 to 4 d [21]. The majority of nitrogen entering the estuary derives from synthetic fertilizer, and the calculated nutrient external load from fresh water entering the head of the estuary was 298 and 3.6 kg/d for N and P, respectively [22]. The mean maximum potential internal nutrient load from estuarine sediment was calculated to be 608 and 106 kg/d for N and P, respectively [22].
Five sampling stations along the spatial gradient of the estuary were selected with beds chosen in the innermost area that eelgrass occupies, and equidistant beds to the outer edge of the defined area of the estuary. Stations were identified by the numbers 1–5, with one being the most upstream station (Figure 1). While areas upstream of the chosen estuary stations contain extensive suitable eelgrass habitat [4], eelgrass has been largely extirpated from this region in association with the proliferation of macroalgae (Ulva sp.).

2.2. Historic External Nitrogen Load Calculations

To examine external nitrogen load change over time, nitrate-N measurements from just above the head of tide in the Wheatley River between 2006 and 2020 were obtained from multiple sources. For the years 2006 to 2008, 2019, and 2020, analyses were conducted at the University of Prince Edward Island (UPEI) using suppressed ion chromatography, as described by Schein et al. [23] (for 2006 to 2008) and Cormier et al. [20] (for the years 2019 and 2020). Additional measurements were used from 2012 and 2013 from Grizard et al. [24]. Nitrate-N concentrations for the interim period of 2011 to 2018 and 2021 were obtained from the province of Prince Edward Island public surface water quality database (https://www.princeedwardisland.ca/en/service/view-surface-water-quality, accessed 1 June 2023). No data were available for the years 2009 or 2015–2017. Interpolations were made for those years on the basis of the mean of the closest previous and subsequent years.
Nitrate-N concentration does not vary substantially within or between years in this system due to the almost complete dominance of groundwater to river baseflow in this system [22]. Due to the dominance of the sub-surface N pathway, nitrate-N concentrations decrease marginally during rain events, indicating that surface runoff does not contribute significantly to nitrogen loading [22,25]. Nitrate-N loading calculations were performed with the mean nitrate-N value for each year. As flow is the critical determinant of loading and is continuously decreasing in the May to August period, instantaneous load based on the water sample collection date would be biased based on the collection dates. To overcome the collection date bias, a mean nitrate-N load (kg/d) from the Wheatley River was calculated from daily loads between 1 May and 31st August to provide loading values unbiased by nutrient collection dates and reflective of the flow regime. Daily flow estimates were calculated by creating a model for the Wheatley River flow from the Environment Canada hydrometric station for the Dunk River (Environment and Climate Change hydrometric station 01CB002; https://wateroffice.ec.gc.ca/mainmenu/real_time_data_index_e.html accessed 1 June 2023), as the two watersheds are adjoining in the headwaters. The Dunk River daily average flow was related to the Wheatley River daily average flow from data collected on the Wheatley River for two full years from 2012 to 2014 [26] using a second-order polynomial function (n = 726, r2 = 0.86, p < 0.05). This approach was validated using the manually measured flow from 2019 and 2020, and the mean deviance of the manually measured flow from the model was 16%. Loading estimates were not conducted for 2021, as flow data from the Dunk River were not yet available. Daily nitrate-N load was calculated as the product of daily volume based on mean daily flow for all days over the chosen period and mean annual nitrate-N and is presented as kg/d of nitrate-N.

2.3. Estuarine Water Quality

Five Onset (Bourne, MA, USA) HOBO oxygen loggers were deployed on 15 June 2020 and remained in the estuary throughout the sampling period until 7 August 2020. Loggers were placed in each of the five chosen eelgrass sampling beds along the spatial gradient of the estuary and numbered 1–5 from the innermost to the outermost station (Figure 1). The loggers were secured approximately 30 cm above the substrate, either to a galvanized metal stand fixed in concrete, and were downloaded and fouling removed once a month throughout the summer. YSI V2 6600 multiparameter water quality sonde profile measurements of salinity were also recorded during the eelgrass sample collection dates in June, July, and August.
Estuarine sediment and water chemistry data from 2019 were previously presented as interpolated gradients over the defined area of the estuary [22]. To gather representative values for the five sample stations used in this study (except salinity, oxygen, and temperature, which were measured directly), five random cells surrounding the sample station coordinates were chosen from the interpolation gradient map and averaged. These values are presented as a June–September range in Table 1.

2.4. Submerged Aquatic Vegetation Sonar Survey

A sonar survey was conducted once per summer in 2014 and 2020 within the Wheatley River to record bathymetry and eelgrass coverage. The 2014 survey was previously published [4] and was re-interpolated for comparison purposes in the present study. Eelgrass surveys took place over the course of 2 days from 31 July to 1 August in 2014 and 2 September to 3 September in 2020.
Sonar methods were previously described [4] and are briefly outlined here. Sounding was performed with a Knudsen (Knudsen Engineering Limited, Perth, ON, Canada) model 1612 dual channel echosounder equipped with a 3° beam width Knudsen KEL-291 at 200 kHz. The geolocation of each sounder ping was achieved with a Trimble® Geo7X (Trimble Navigation Limited, Sunnyvale, CA, USA) with real-time correction to an accuracy of at least 0.5 m using the Can-Net Virtual Reference Station Network (Cansel, Burnaby, BC, Canada). Truthing was performed visually for each of the transects, as eelgrass was always visible from the surface. Transects were approximately 50 m apart.

2.5. Eelgrass Tissue Collection and Biomass Measurements

A total of five randomly chosen replicate samples approximately 1 m apart were taken from each of the five stations within the estuary at three separate time points throughout the summer (15 June, 14 July, and 7 August 2020). A 1.2 m tall post-hole digger with a 15 cm diameter opening was deployed from a boat to manually collect eelgrass samples, which were immediately frozen upon returning to the lab.
At the time of analysis, eelgrass was thawed in distilled water to remove any surficial salts, and a razor blade was used to remove all epiphytes from eelgrass leaves. There was no selection for the growth stage of leaf tissue; the entire sample was pooled. Above-ground and below-ground biomass were separated manually, dried at 60 °C in a PRECISION Economy Incubator for approximately 48–72 h, and weighed. Dried above-ground and below-ground tissues were then ground to a fine powder using a coffee grinder followed by a mortar and pestle. Ground tissues were sent to the Ján Veizer Stable Isotope Laboratory at the University of Ottawa for isotope analysis of elemental carbon, nitrogen, and sulfur.

2.6. Isotope Analysis

Isotopes (δ13C, δ15N, δ34S) and C, N, and S mass proportions were quantified in replicate leaf and root/rhizome samples (n = 5) from each of the 5 stations over three sampling periods. All samples were dried as per the previous paragraph. Isotopes were processed at the Ján Veizer Stable Isotope Laboratory at the University of Ottawa, Ottawa, ON, Canada. For carbon and nitrogen isotope and elemental analysis, ground plant samples were combusted to gas using an Elementar VarioEL Cube Elemental Analyser (Elementar Americas Inc., Ronkonkoma, NY, USA). A DeltaPlus Advantage isotope ratio mass spectrometer (Thermo Fisher Scientific Inc., Bremen, Germany) with continuous flow coupled with a ConFlo III interface was then used for separation and online analysis.
Sulfur isotopic and elemental analysis was conducted by flash combustion with oxygen at 1800 °C using an Isotope Cube autosampler (Elementar Analysensysteme GmbH, Langenselbold, Germany). Ultra-pure helium was used to move the gases through the column(s) and SO2 was separated for analysis using the “trap and purge” method wherein the helium carries the SO2 gas into the Thermo Finnigan DeltaPlus XP IRMS (Thermo Fisher Scientific Inc., Bremen, Germany) via a Conflo IV. Isotope ratios were calculated as outlined in Hitchcock et al. [18].

2.7. Statistical Analysis

Submerged vegetation analysis was previously described [4] and is summarized herein. Sonar5-Pro version 608.39 (Lindem Data Acquisition, Oslo, Norway) was used to manually assess plant height. Indicator Kriging, a non-parametric technique, (ArcGIS 10.3, Geospatial Analyst) was used with height data, as eelgrass data significantly violates assumptions of other methods. Indicator Kriging determined the probability of eelgrass being present based on a height threshold of 0.1 m. As density influences the probability of detection, to ensure comparability between surveys, the probability of detection was modified iteratively until 95% of observed eelgrass detection was in the modeled area (referred to hereafter as coverage area). The occupancy of available habitat was obtained by dividing the area of the eelgrass polygons by suitable habitat based on a salinity of >10 PSU, a depth of less than 3 m (with regards to mean sea level), and a depth greater than mean low tide and removing the area occupied by non-fed aquaculture (namely surface mussel leases). Eelgrass density within the interpolated polygon was expressed as the ratio of detections to non-detections within that area.
Assumptions of all parametric statistics were evaluated using normal probability plots and the Brown–Forsythe test. Deviations from normality and heteroscedasticity were addressed with logarithmic transformations, followed by re-testing. Isotopic and elemental data were evaluated using analysis of variance using stations and collection date as categorical variables. Station-wise difference was examined using Tukey’s test. All statistics were performed with Statistica v. 13.5. The critical level of significance for all analyses was evaluated as p < 0.05.

3. Results

3.1. Wheatley River Nitrate-N Loading

The freshwater concentration of nitrate-N in the Wheatley River was characterized by a relatively narrow range of 2.6 to 3.7 mg/L of nitrate-N over 15 years from 2006 to 2020 (Figure 2). The nitrate-N loading in the Wheatley River, PEI, demonstrated that while nitrate-N concentrations only vary by a coefficient of variation of 8%, nitrate-N is misleading as a eutrophication indicator since the calculated nitrate-N load varies by an order of magnitude and is driven by stream flow. As the peak of nitrate-N was 3.5 mg/L in 2010 and 2021, there is little evidence of declines in nitrate-N over time. In contrast to nitrate-N concentration, the calculated May to August loading varied by more than an order of magnitude, reflecting the dominant influence of stream flow. In the 2014 eelgrass survey, loading was 154 kg/d. In 2020, the year of the most recent eelgrass survey, there was a significant drought event on PEI, and this was reflected in the all-time low loading of 16 kg/d. These data are also suggestive of modest drops in nitrate-N concentration in years after relatively high annual flow. The converse, a sharp increase in nitrate-N concentration was particularly apparent in 2021 following the 2020 drought year.

3.2. Eelgrass Coverage from 2014 and 2020

A comparison of the sonar survey performed in the Wheatley River estuary in 2014 to the one performed in 2020 showed that the eelgrass coverage increased. The measured eelgrass density within the interpolated area in 2014 was 69.1%, which increased to 87.1% in 2020. Similarly, the % of available habitat occupied by Z. marina increased more than twofold, from 19.3% in 2014 to 40.3% in 2020 (Figure 3). Increases were noted within the area upstream of the causeway in 2020. Eelgrass did occur in this area in 2014 but was so sparse that it was not detected as a significant probability of eelgrass being present in the interpolation.

3.3. Eelgrass Bed Sampling Sediment and Water Chemistry

Measured hypoxia was most persistent at station 1 which spent 29% of time below 4 mg/L O2. Hypoxia decreased through stations 1–3 and was nearly identical at stations 4 and 5 at approximately 0%, while measured superoxia (>10 mg/L), a photosynthesis proxy, showed the opposite trend. The innermost station showed the least amount of time under superoxic conditions at approximately 21%, while the outermost stations showed a higher frequency of superoxia, with station 4 spending the most time under superoxic conditions at approximately 59% (Table 1).
The measured mean salinity increased through stations 1–4, with station 5 being nearly identical to station 3. The measured mean temperature varied by only 0.4 °C across stations. Interpolated maximum chlorophyll was lowest at station 1, around 6.5 μg/L, and was higher for stations 2–5, where it ranged from 8.3 to 9.0 μg/L (Table 1). Despite this, the interpolated turbidity was threefold higher at station 1 compared with that at other stations.
Interpolated sediment %N was similar spatially and temporally, with the lowest value being 0.0 (station 5 in June and September) and the highest value being 0.8 (station 1 in September). Interpolated N flux was highest at station 1 in September at 4.5 mg/m2/h and ranged only from 0.5–0.8 mg/m2/h at all remaining stations and time points. Consistent with the trends reported in sediment %N and N flux, interpolated P flux was also found to be highest at station 1; however, unlike N flux, was highest in June rather than September, at 1.6 mg/m2/h, with a range of only 0.1 to 0.7 mg/m2/h for all remaining stations and sampling time points (Table 1).
Interpolated organic carbon was always higher in June than in September except for that at station 1, which showed the opposite trend. Organic carbon was highest at station 1 during both seasons with a range of 3.8–8.9% d.w. and was consistently lower (ranging from 1.5–2.9% d.w.) at all remaining stations (Table 1).

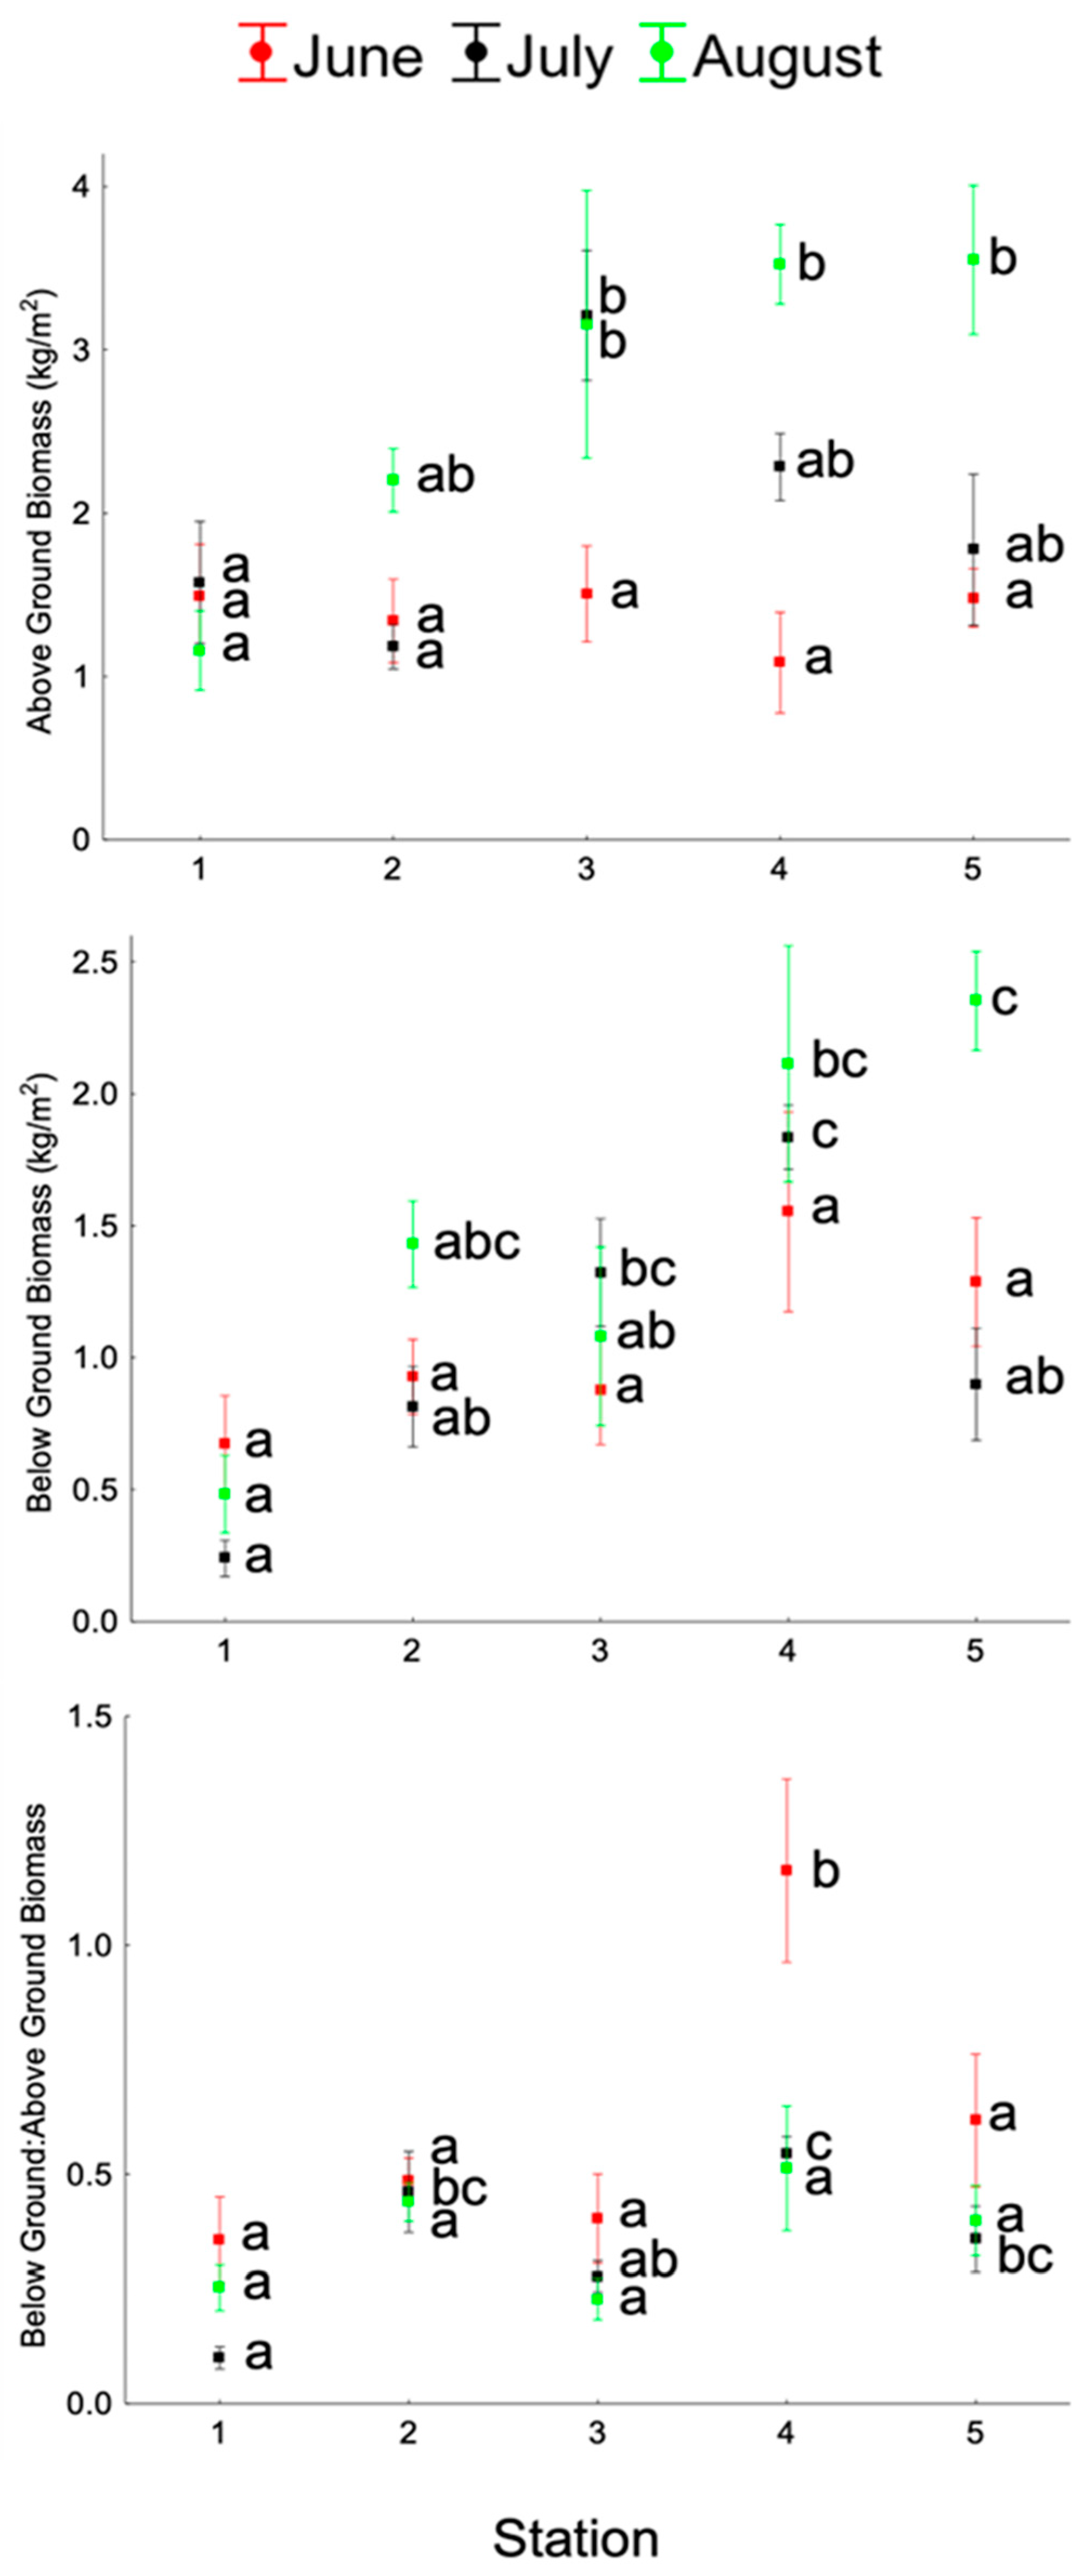
3.4. Eelgrass Biomass

Above-ground biomass ranged between 1 and 2 kg/m2 at all stations during the month of June; however, both July and August saw more station variation (Figure 4). In July, the eelgrass above-ground biomass was highest at station 3 with a mean of 3.2 kg/m2, while the lowest biomass occurred at station 1 in August, with a mean of 1.2 kg/m2. Thus, over the course of the summer months, there was virtually no above-ground biomass growth at station 1.
June showed the highest below-ground biomass at station 4, with a mean of approximately 1.6 kg/m2. In August, below-ground biomass did increase compared with the previous 2 months but was highest at station 5, with a mean of approximately 2.4 kg/m2. During all three sampling time points (June, July, and August), below-ground biomass was lowest at station 1 (Figure 4).
The ratio of below-ground to above-ground biomass showed similar trends to the below-ground biomass results. During each month, station 1 showed the lowest below-ground to above-ground biomass ratio. The below-to-above-ground eelgrass biomass ratio was highest overall during June at station 4, with a mean of approximately 1.2, and lowest in July at station 1, with a mean of 0.1 (Figure 4).

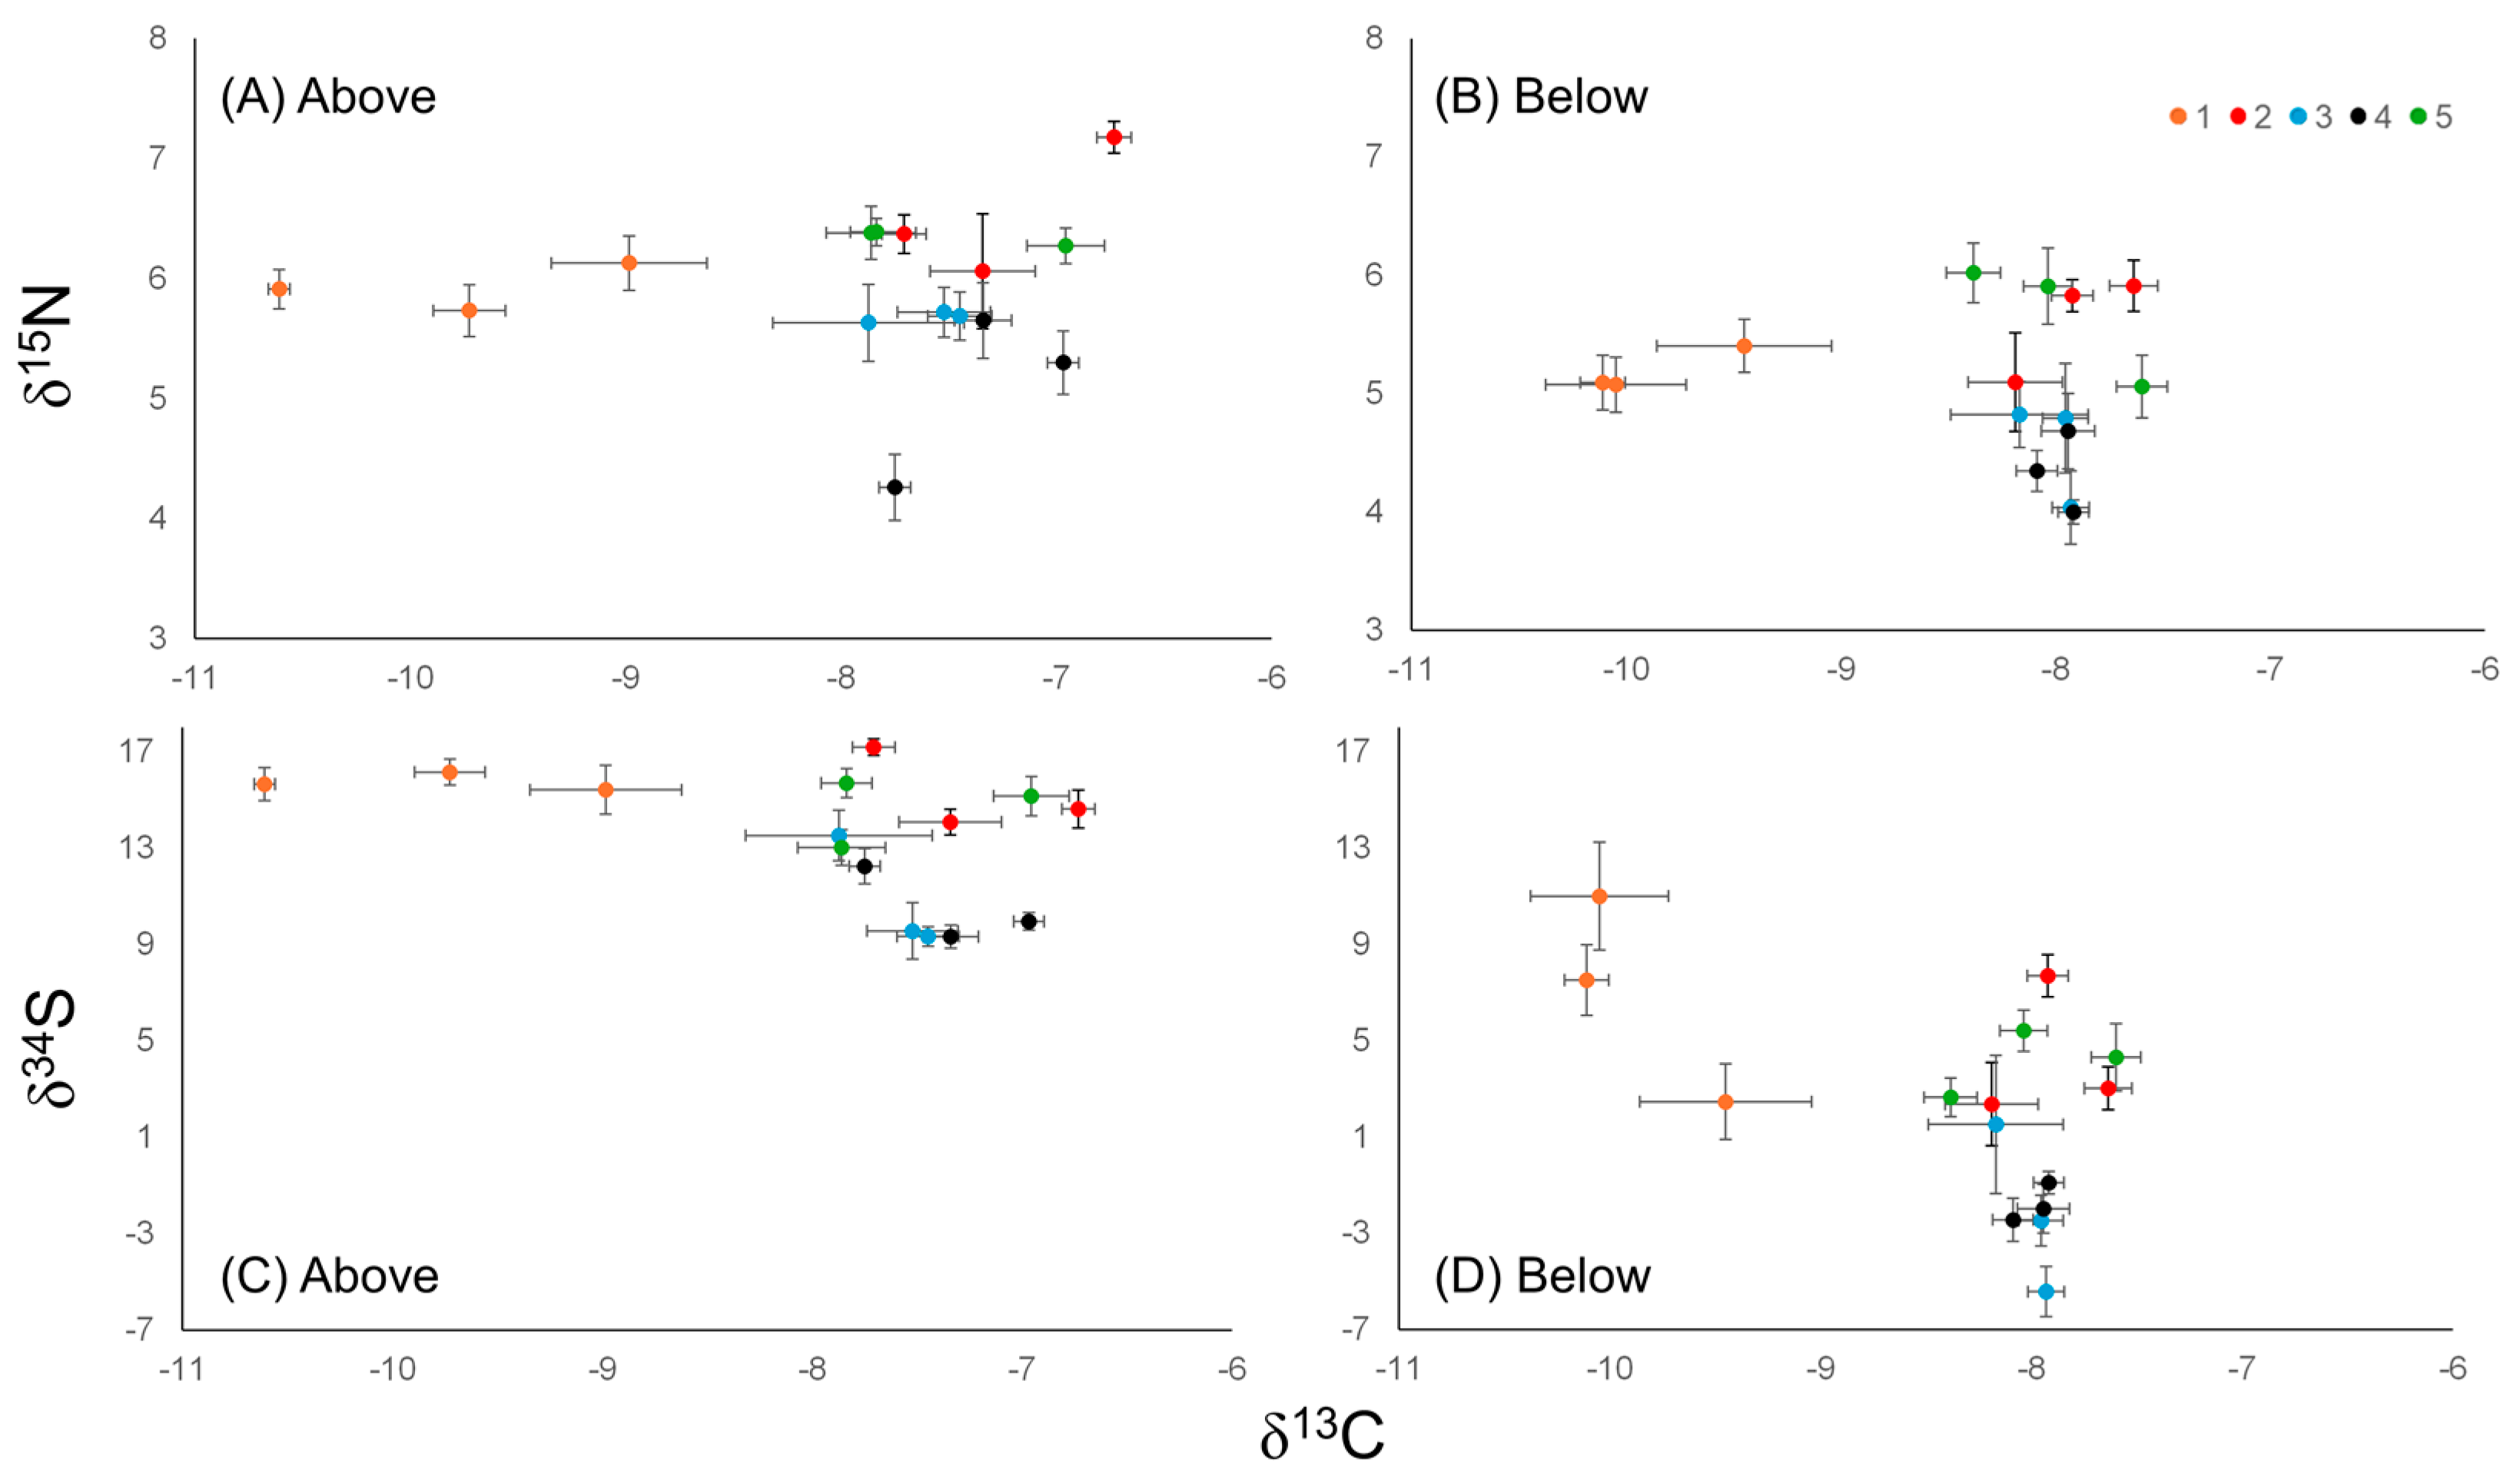
3.5. Eelgrass Tissue Isotopes

The δ13C was lowest in both above- and below-ground tissues at station 1 (between −11 and −9) for all three sampling time points (Figure 5, Table 2). Contrastingly, all remaining stations had relatively similar values around −8 ppt for below-ground biomass and between −8 and −7 ppt for above-ground biomass. For leaves and roots/rhizomes, the most enriched values at station 1 occurred in the month of June, while for the remaining stations, values were generally more enriched during the months of July–August, except for below-ground tissue at station 4, where values were just barely higher in June compared with July or August.
δ15N was highest at stations 2 and 5 for both above- and below-ground tissues. The leaves at stations 1 and 3 had very similar δ15N levels, while the roots and rhizomes at stations 3 and 4 were most similar. The δ15N of both above- and below-ground tissues was typically higher in August compared with that in other summer months (Figure 5, Table 2).
δ34S was very similar at all stations for above-ground tissues, ranging from approximately 9 to 17. Contrastingly, there was a much wider range and lower values in δ34S in below-ground tissues across stations, ranging from approximately −5 to 11. In leaf tissues, stations 2–5 saw the highest δ34S values in June, while station 1 saw the highest δ34S values in August. Similarly, in roots/rhizomes, stations 2–5 saw the highest δ34S values in June; however, station 1 saw the highest δ34S value in July (Figure 5, Table 2).
The C:N ratio in above-ground tissues was highest at all stations during the month of August, followed by July, and lastly June (Figure 6). At station 1, however, the June and July ratios were nearly identical. When comparing all stations against one another, the C:N ratio was consistently lowest at station 1. The C:N ratio in below-ground tissues followed a different trend—in below-ground tissues, the C:N ratio was consistently highest in July, with one exception, station 5, where August had a slightly higher ratio. The lowest C:N ratios occurred in June for stations 2–5 but occurred in August for station 1. Again, the C:N ratio was consistently lowest at station 1 throughout all three sampling months.

4. Discussion

Eelgrass coverage was 33.6% higher in 2020 compared with that in 2014, corresponding with the lowest nutrient load observed over 15 years. Despite improvements, eelgrass in the upstream part of its distribution was much less productive in terms of above- and below-ground biomass than stations farther downstream, indicating stress at the most upstream location. This area showed hypoxic conditions for just under a third of the measurement period, while temperature was nearly identical to the other stations. The upper station eelgrass tissue reflected this eutrophication stress in terms of higher nitrogen elemental composition and correspondingly lower carbon in both above- and below-ground tissue. The δ13C isotope was depleted in leaves and rhizomes of plants at station 1, while δ15N and δ34S did not indicate plant stress at the innermost station.
The present study illustrates the importance of using watershed loads in contrast to nutrient concentrations to predict biological responses in estuaries. Presently, many jurisdictions, including the province of PEI, run comprehensive and publicly available nutrient monitoring programs that periodically sample fresh water. In groundwater-driven watersheds such as those that have been extensively modeled on PEI, at least 80% of nutrients enter streams through groundwater inputs, and those groundwater inputs can make up almost 100% of base flow in the summer months [25]. In years of low groundwater recharge, groundwater inputs into streams drop, and so, consequently, do external loadings—often dramatically, as seen in 2020 in this study. Unfortunately, flow monitoring is rarely as extensive as nutrient monitoring, although this can be overcome by modeling flow and calculating nutrient loads. The responses of biota to this large fluctuation have implications for monitoring frequency and interpretation. According to a multi-estuary model of nitrogen loading vs. eelgrass coverage for the region [4,27], the predicted coverage based on the nutrient loading observed herein was 20.9 and 44.5% of available habitat occupied for 2014 and 2020, respectively. The predicted values differed by less than 10% of the observed values, strongly suggesting a nutrient-mediated increase.
Researchers have reported declining seagrass coverage related to increased and/or ongoing eutrophication in coastal systems [28,29]. Olsen et al. [30] found a relationship between N loading and plant biomass and determined that while the relationship was positive for macroalgae, it was negative for eelgrass. Furthermore, they found that with increasing N load, the ratio of macroalgae to eelgrass also increased (from 0.16 at low load to 1.30 at high load). The proposed remedy, therefore, for increasing, or at minimum stabilizing eelgrass bed coverage, is reduced nutrient loads [31,32], although the literature here is controversial, with some studies reporting no improvements in seagrass coverage despite reduced nutrient loading [33,34]. Another possibility for this natural eelgrass recovery could be genetic diversity, as described by Plaisted et al. [35]. In this study, the researchers found that eelgrass resilience (to low light and high organic matter conditions) was better in eelgrass populations with higher genetic diversity. More frequent monitoring would help to determine if this eelgrass population is increasing consistently or sporadically.
The inability of eelgrass to accumulate carbohydrates, as indicated by below-ground biomass, is an indicator of eelgrass plant stress [36,37]. The nearly sixfold range in below-ground biomass observed herein showed an inner-to-outer estuary stress gradient. This finding is supported by reports from Grice et al. [38], who explained that root biomass was typically higher under low nutrient conditions to enable the plant to assimilate more nutrients. Unlike findings reported by Hitchcock et al. [20], who reported an increasing below-to-above-ground ratio in July and then again in September, the present findings showed that the highest below-ground to above-ground biomass occurred in June. This can be explained by the observation that the above-ground biomass continued to increase into August 2020, whereas in the same system in 2014, above-ground biomass did not change after June. This was a stark difference between the two years that likely led to the substantial increases in plant density in 2020.
Changes in C to N ratios may be a strong indicator of plant stress if used appropriately. The significant change in these ratios at the upper site was driven by a higher tissue concentration of nitrogen. According to observations reported by Atkinson and Smith [39] and Duarte [40], a higher C:N ratio is indicative of plants living under relatively lower nutrient levels compared to those with a lower C:N ratio (as a result of increased N levels). Other factors influencing the eelgrass C:N ratio, particularly in above-ground tissues, are light conditions, as they can alter photosynthetic rates and, therefore, nutrient uptake. Grice et al. (1996) reported a positive correlation between light and the C:N ratio. A case has often been made for the use of tissue nitrogen as an indicator of eutrophication stress in eelgrass though interpretation of such data is often confounded as, for example, lower carbon is an influence [41]. The present study confirms that such an endpoint has utility in studying within-estuary responses but not necessarily between-estuary responses, as has been previously concluded [20]. While this response is often interpreted as uptake of excess anthropogenic nitrogen, in the present study, nitrogen in this mid-estuary site, while more available, is likely tightly cycled, as it is many kilometers from the freshwater source. This C:N ratio response may be better represented as an alteration in photosynthesis, resulting in less carbohydrate production, with proportionally more nitrogenous cellular components, a conclusion supported in particular by lower below-ground tissue carbon and a large difference in plant productivity.
The δ13C values found herein were similar to those reported by Hitchcock et al. [20] for the Wheatley River estuary. As was discussed in this study as well as others [41,42], the slightly enriched δ13C signature relative to other aquatic primary producers may be indicative of bicarbonate (as opposed to carbon dioxide) being the preferred source of carbon for eelgrass. Terrestrial inputs can be depleted in 13C, and this was observed in sediment in the upper estuary [22], although this influence did not extend as far as the eelgrass beds and is unlikely to explain the depletion observed in eelgrass at the upper station. In light of the high salinity and substantial growth of macroalgae in the upper estuary, estuarine sources of carbon are expected to be dominant in all eelgrass beds. Another possible influence on the dissolved inorganic carbon would be higher respiration (as indicated by higher hypoxia). However, this is counteracted on a daily basis by high photosynthesis as indicated by superoxia, and respiration would not occur during anoxia. Given the relative proximity of the stations, carbon sources would move quickly between them, so it is more likely that other factors are influencing the isotopic shift. The similarity in isotopic content in sediment supports the conclusion that external carbon δ13C does not differ substantially [22]. Other influential factors contributing to seagrass δ13C signatures are irradiance and temperature [43]. As temperature varied little between sampling stations, it is unlikely this factor played a large role. Irradiance, on the other hand, may have been more impactful. Grice et al. [38] reported δ13C values of up to 4‰ more enriched when five tested seagrass species experienced full-sun conditions compared to lower light regimes. Although the present study lacks light data, acoustic surveying data determined that stations 1 and 5 were the deepest, which could explain the more depleted δ13C signature at station 1. Additionally, turbidity was higher at station 1 compared with all outer stations (Table 1). Despite station 5 being equal in depth to station 1, it is located much further downstream, and, therefore, is not as impacted by eutrophic conditions, which could explain the more enriched δ13C signature that is consistent with all outer stations (2–5). Additionally, station 5 had much more above-ground growth compared with station 1, indicating that it could have grown up to the light.
The depletion of δ13C associated with reduced plant productivity is likely an indirect effect of nitrogen loading. Olsen et al. [30] studied the relationship between δ13C and N load and found an inverse relationship. As N loads increased, δ13C signatures of both producers and consumers generally became more depleted. Comparing their assessment to the results found herein would indicate that station 1 (where eelgrass δ13C was approximately −9 to −10) seemed to have a higher N load than stations 2–5 (where eelgrass δ13C was approximately −7 to −8). This conclusion would also be consistent with data previously presented [22,27] that found that local conditions in inner Wheatley River stations (in this case station 1) were generally poorer in quality compared with local conditions in outer stations (in this case stations 2–5). Lower light, as supported herein by increased turbidity, will lead to lower photosynthetic productivity, which is evidenced by the very low above- and below-ground biomass. Under lower levels of plant growth, CO2 will be more available, precluding the more energetic intensive shift to bicarbonate leading to more depleted δ13C [16]. By contrast, thriving outer estuary plants are likely depleting CO2, which is known to occur at high growth rates.
Nitrogen isotopes have only marginal utility for evaluating plant stress within the context of eelgrass within an estuary. Several research studies, such as those performed by Schubert et al. [18] and Grice et al. [38], have concluded that seagrasses with higher δ15N values were found within more eutrophic areas. Similarly, researchers have uncovered a relationship between N load and land use to the δ15N signature—the higher the load or the more synthetic fertilizer that is used for agricultural purposes—the more enriched the signature [30,44,45]. However, manure can contribute to enriched δ15N more than synthetic fertilizer, and consistent with this, at least one estuary with low agriculture land use was more enriched in 15N compared with the Wheatley River [20]. The δ15N levels between stations did not particularly coincide with proxy measurements of eutrophication, such as anoxia and hypoxia, suggesting that perhaps using eelgrass δ15N to estimate eutrophic conditions between estuaries may be more valuable than comparing stations within an estuary, a finding supported by Hitchcock et al. [20]. In an estuary like the Wheatley River, the vast majority of nitrogen originates from fertilizer and over decades has saturated the system, and thus special changes are only expected during processes such as denitrification, which is inhibited under high salinity and low oxygen conditions. However, previously observed minor differences in sediment δ15N likely represent a weak denitrification signature [22], as was also present in eelgrass tissue examined herein.
Sulfur isotopes did not provide a strong indication of upper estuary plant stress. According to Holmer et al. [46], δ34S may be inversely related to salinity; however, that gradient was minimal in the present study. Likewise, in this study, δ34S decreased slightly, moving from the inner to outer estuary stations, with the change being most apparent in below-ground tissues. Above-ground eelgrass δ34S values for Wheatley River were very similar to those reported by Hitchcock et al. [20]. These researchers did not report δ34S findings for below-ground tissues; however, the results of below-ground tissues in the present study demonstrated that δ34S was more depleted than in above-ground tissues. Researchers such as Fraser and Kendrick [47] also concluded that δ34S was more depleted at stations that had previously experienced more eelgrass decline. However, the results herein and those of Hitchcock et al. [20] contradict that observation. Consistent with results published by Hitchcock et al. [20], below-ground eelgrass biomass collected in 2020 was more depleted at outer estuary sites compared with that at inner sites, despite N loading being higher in the innermost site. Although previous studies have supported the theory that increased biomass and increased lacunal area were positively correlated with one another [36], this may not have been the case in the present study. For instance, if the lacunal area did not increase with biomass, it would make it challenging for the plant to maintain its oxic rhizospheres to prevent sulfide intrusion [48]. Therefore, in future studies, the lacunal area should be analyzed along with below-ground biomass to clarify if this could have played a role.
This intensive study on one estuary has provided important clues for the mechanism of eutrophication stress on eelgrass, as well as insights into the most relevant monitoring tools. The substantial interannual differences in nutrient loading and eelgrass coverage, while not definitive based on just two years, provide further evidence of a nitrogen-eelgrass response that has been frequently documented. The depletion of 13C in stressed and unproductive eelgrass beds, combined with lower % carbon (higher nitrogen), is suggestive of changes to photosynthesis and light limitation. Isotope results rule out sulfide intrusion and toxicity as a likely mechanism explaining plant stress. While tissue nitrogen is higher in stressed plants due to the limited presence of nitrate in this reducing, often anoxic environment, the nitrogen increases are likely a function of poor carbon fixation. Several factors related to nitrogen can explain light limitation, including phytoplankton, macroalgae, and epiphytes; thus, further work is required to elucidate the relative contribution to light limitation.

Author Contributions

Conceptualization, J.M.W., S.C.C. and M.R.v.d.H.; fieldwork and data collection, J.M.W. and C.C.P.; writing—original draft preparation, J.M.W. and M.R.v.d.H.; writing—review and editing, all authors; supervision, M.R.v.d.H. and S.C.C.; funding acquisition, M.R.v.d.H., M.R.S.C. and R.F.G.J. All authors have read and agreed to the published version of the manuscript.

Funding

Financial support was received from Fisheries and Oceans Canada, awarded to M.R.v.d.H., as well as from a Natural Sciences and Engineering Research Council of Canada Discovery Grant awarded to R.F.G.J. J.M.W. was personally supported through an NSERC Post-Graduate Scholarship.

Institutional Review Board Statement

Not applicable.

Informed Consent Statement

Not applicable.

Data Availability Statement

Data are available upon request.

Conflicts of Interest

The authors declare no conflicts of interest. The funders had no role in the design of the study; in the collection, analyses, or interpretation of data; in the writing of the manuscript; or in the decision to publish the results.

References

  1. Vandermeulen, H.; An Introduction to Eelgrass (Zostera marina L.): The Persistent Ecosystem Engineer. Government of Canada. 2009. Available online: https://www.dfo-mpo.gc.ca/csas-sccs/publications/resdocs-docrech/2009/2009_085-eng.htm (accessed on 25 January 2024).
  2. Waycott, M.; Duarte, C.M.; Carruthers, T.J.B.; Orth, R.J.; Dennison, W.C.; Olyarnik, S.; Calladine, A.; Fourqurean, J.W.; Heck, K.L., Jr.; Hughes, A.R.; et al. Accelerating loss of seagrasses across the globe threatens coastal ecosystems. Proc. Natl. Acad. Sci. USA 2009, 106, 12377–12381. [Google Scholar] [CrossRef] [PubMed]
  3. Valiela, I.; McClelland, J.; Hauxwell, J.; Behr, P.J.; Hersh, D.; Foreman, K. Macroalgal blooms in shallow estuaries: Controls and ecophysiological and ecosystem consequences. Limnol. Oceanogr. 1997, 42 (Pt 2), 1105–1118. [Google Scholar] [CrossRef]
  4. van den Heuvel, M.R.; Hitchcock, J.K.; Coffin, M.R.S.; Pater, C.C.; Courtenay, S.C. Inorganic nitrogen has a dominant impact on estuarine eelgrass distribution in the Southern Gulf of St. Lawrence, Canada. Limnol. Oceanogr. 2019, 64, 2313–2327. [Google Scholar] [CrossRef]
  5. Vaudrey, J.M.P.; Kremer, J.N.; Branco, B.F.; Short, F.T. Eelgrass recovery after nutrient enrichment reversal. Aquat. Bot. 2010, 93, 237–243. [Google Scholar] [CrossRef]
  6. Shelton, A.O.; Francis, T.B.; Feist, B.E.; Williams, G.D.; Lindquist, A.; Levin, P.S. Forty years of seagrass population stability and resilience in an urbanizing estuary. J. Ecol. 2017, 105, 458–470. [Google Scholar] [CrossRef]
  7. Ward, D.; Markon, C.; Douglas, D. Distribution and stability of eelgrass beds at Izembek Lagoon, Alaska. Aquat. Bot. 1997, 58, 229–240. [Google Scholar] [CrossRef]
  8. Short, F.; Coles, R.; Fortes, M.; Victor, S.; Salik, M.; Isnain, I.; Andrew, J.; Seno, A. Monitoring in the Western Pacific region shows evidence of seagrass decline in line with global trends. Mar. Pollut. Bull. 2014, 83, 408–416. [Google Scholar] [CrossRef] [PubMed]
  9. Leblanc, M.L.; O’Connor, M.I.; Kuzyk, Z.Z.A.; Noisette, F.; Davis, K.E.; Rabbitskin, E.; Sam, L.L.; Neumeier, U.; Costanzo, R.; Ehn, J.K.; et al. Limited recovery following a massive seagrass decline in subarctic eastern Canada. Glob. Change Biol. 2023, 29, 432–450. [Google Scholar] [CrossRef]
  10. Hauxwell, J.; Cebrian, J.; Valiela, I. Eelgrass Zostera marina loss in temperate estuaries: Relationship to land-derived nitrogen loads and effect of light limitation imposed by algae. Mar. Ecol. Prog. Ser. 2003, 247, 59–73. [Google Scholar] [CrossRef]
  11. Burkholder, J.M.; Mason, K.M.; Glasgow, H.B., Jr. Water-column nitrate enrichment promotes decline of eelgrass Zostera marina: Evidence from seasonal mesocosm experiments. Mar. Ecol. Prog. Ser. 1992, 81, 163–178. [Google Scholar] [CrossRef]
  12. Holmer, M.; Bondgaard, E.J. Photosynthesis and growth response of eelgrass to low oxygen and high sulfide concentrations during hypoxic events. Aquat. Bot. 2001, 70, 29–38. [Google Scholar] [CrossRef]
  13. Cooper, L.W.; de Niro, M.J. Stable carbon isotope variability in the seagrass Posidonia oceanica: Evidence for light intensity effects. Mar. Ecol. Prog. Ser. 1989, 50, 225–229. [Google Scholar] [CrossRef]
  14. McPherson, M.L.; Zimmerman, R.C.; Hill, V.J. Predicting carbon isotope discrimination in Eelgrass (Zostera marina L.) from the environmental parameters—Light, flow, and [DIC]. Limnol. Oceanogr. 2015, 60, 1875–1889. [Google Scholar] [CrossRef]
  15. McGlathery, K.J.; Sundbäck, K.; Anderson, I.C. Eutrophication in shallow coastal bays and lagoons: The role of plants in the coastal filter. Mar. Ecol. Prog. Ser. 2007, 348, 1–18. [Google Scholar] [CrossRef]
  16. Coffin, M.R.S.; Courtenay, S.C.; Pater, C.C.; van den Heuvel, M.R. An empirical model using dissolved oxygen as an indicator for eutrophication at a regional scale. Mar. Pollut. Bull. 2018, 133, 261–270. [Google Scholar] [CrossRef]
  17. Burkholder, J.M.; Tomasko, D.A.; Touchette, B.W. Seagrasses and eutrophication. J. Exp. Mar. Biol. Ecol. 2007, 350, 46–72. [Google Scholar] [CrossRef]
  18. Schubert, P.; Karez, R.; Reusch, T.; Dierking, J. Isotopic signatures of eelgrass (Zostera marina L.) as bioindicator of anthropogenic nutrient input in the western Baltic Sea. Mar. Pollut. Bull. 2013, 72, 64–70. [Google Scholar] [CrossRef]
  19. Holmer, M.; Frederiksen, M.S.; Møllegaard, H. Sulfur accumulation in eelgrass (Zostera marina) and effect of sulfur on eelgrass growth. Aquat. Bot. 2005, 81, 367–379. [Google Scholar] [CrossRef]
  20. Hitchcock, J.K.; Courtenay, S.C.; Coffin, M.R.S.; Pater, C.C.; van den Heuvel, M.R. Eelgrass bed structure, leaf nutrient, and leaf isotope responses to natural and anthropogenic gradients in estuaries of the southern Gulf of St. Lawrence, Canada. Estuaries Coasts 2017, 40, 1653–1665. [Google Scholar] [CrossRef]
  21. Coffin, M.R.S.; Courtenay, S.C.; Knysh, K.M.; Pater, C.C.; van den Heuvel, M.R. Impacts of hypoxia on estuarine macroinvertebrate assemblages across a regional nutrient gradient. FACETS 2018, 3, 23–44. [Google Scholar] [CrossRef]
  22. Cormier, J.M.; Coffin, M.R.S.; Pater, C.C.; Knysh, K.M.; Gilmour, R.F., Jr.; Guyondet, T.; Courtenay, S.C.; van den Heuvel, M.R. Internal nutrients dominate load and drive hypoxia in a eutrophic estuary. Environ. Monit. Assess. 2023, 195, 1211. [Google Scholar] [CrossRef] [PubMed]
  23. Schein, A.; Courtenay, S.C.; Crane, C.S.; Teather, K.L.; van den Heuvel, M.R. The role of submerged aquatic vegetation in structuring the nearshore fish community within an estuary of the southern Gulf of St. Lawrence. Estuaries Coasts 2012, 35, 799–810. [Google Scholar] [CrossRef]
  24. Grizard, P.; MacQuarrie, K.; Jiang, Y. Land-use based modeling approach for determining freshwater nitrate loadings from small agricultural watersheds. Water Qual. Res. J. 2020, 55, 278–294. [Google Scholar] [CrossRef]
  25. Jiang, Y.; Nishimura, P.; van den Heuvel, M.R.; MacQuarrie, K.T.B.; Crane, C.S.; Xing, Z.; Raymond, B.G.; Thompson, B.L. Modeling land-based nitrogen loads from groundwater-dominated agricultural watersheds to estuaries to inform nutrient reduction planning. J. Hydrol. 2015, 529, 213–230. [Google Scholar] [CrossRef]
  26. Alberto, A.; St-Hilaire, A.; Courtenay, S.C.; van den Heuvel, M.R. Monitoring stream sediment loads in response to agriculture in Prince Edward Island, Canada. Environ. Monit. Assess. 2016, 188, 415. [Google Scholar] [CrossRef] [PubMed]
  27. Coffin, M.R.S.; Knysh, K.M.; Roloson, S.D.; Pater, C.C.; Theriaul, E.; Cormier, J.M.; Courtenay, S.C.; van den Heuvel, M.R. Influence of nutrient enrichment on temporal and spatial dynamics of dissolved oxygen within northern temperate estuaries. Environ. Monit. Assess. 2021, 193, 804. [Google Scholar] [CrossRef]
  28. Hauxwell, J.; Cerbian, J.; Furlong, C.; Valiela, I. Macroalgal canopies contribute to eelgrass (Zostera marina) decline in temperate estuarine ecosystems. Ecology 2001, 82, 1007–1022. [Google Scholar] [CrossRef]
  29. Short, F.T.; Burdick, D.M.; Kaldy III, J.E. Mesocosm experiments quantify the effects of eutrophication on eelgrass, Zostera marina. Limnol. Oceanogr. 1995, 40, 740–749. [Google Scholar] [CrossRef]
  30. Olsen, Y.S.; Fox, S.E.; Teichberg, M.; Otter, M.; Valiela, I. δ15N and δ13C reveal differences in carbon flow through estuarine benthic food webs in response to the relative availability of macroalgae and eelgrass. Mar. Ecol. Prog. Ser. 2011, 421, 83–96. [Google Scholar] [CrossRef]
  31. Tomasko, D.; Alderson, M.; Burnes, R.; Hecker, J.; Leverone, J.; Raulerson, G.; Sherwood, E. Widespread recovery of seagrass coverage in Southwest Florida (USA): Temporal and spatial trends and management actions responsible for success. Mar. Pollut. Bull. 2018, 135, 1128–1137. [Google Scholar] [CrossRef] [PubMed]
  32. Greening, H.; Janicki, A. Toward reversal of eutrophic conditions in a subtropical estuary: Water quality and seagrass response to nitrogen loading reductions in Tampa Bay, Florida, USA. Environ. Manag. 2006, 38, 163–178. [Google Scholar] [CrossRef] [PubMed]
  33. Carstensen, J.; Krause-Jensen, D.; Markager, S.; Timmermann, K.; Windolf, J. Water clarity and eelgrass responses to nitrogen reductions in the eutrophic Skive Fjord, Denmark. Hydrobiologia 2013, 704, 293–309. [Google Scholar] [CrossRef]
  34. Kendrick, G.; Aylward, M.; Hegge, B.; Cambridge, M.; Hillman, K.; Wyllie, A.; Lord, D. Changes in seagrass coverage in Cockburn Sound, Western Australia between 1967 and 1999. Aquat. Bot. 2002, 73, 75–87. [Google Scholar] [CrossRef]
  35. Plaisted, H.; Novak, A.; Weigel, S.; Klein, A.; Short, F. Eelgrass genetic diversity influences resilience to stresses associated with eutrophication. Estuaries Coasts 2020, 43, 1245–1438. [Google Scholar] [CrossRef]
  36. Marbà, N.; Krause-Jensen, D.; Alcoverro, T.; Birk, S.; Pedersen, A.; Neto, J.M.; Orfanidis, S.; Garmendia, J.M.; Muxika, I.; Borja, A.; et al. Diversity of European seagrass indicators: Patterns within and across regions. Hydrobiologia 2013, 704, 265–278. [Google Scholar] [CrossRef]
  37. Roca, G.; Alcoverro, T.; Krause-Jensen, D.; Balsby, T.J.S.; van Katwijk, M.M.; Marbà, N.; Santos, R.; Arthur, R.; Mascaró, O.; Fernández-Torquemada, Y.; et al. Response of seagrass indicators to shifts in environmental stressors: A global review and management synthesis. Ecol. Indic. 2016, 63, 310–323. [Google Scholar] [CrossRef]
  38. Grice, A.M.; Loneragan, N.R.; Dennison, W.C. Light intensity and the interactions between physiology, morphology, and stable isotope ratios in five species of seagrass. J. Exp. Mar. Biol. Ecol. 1996, 195, 91–110. [Google Scholar] [CrossRef]
  39. Atkinson, M.J.; Smith, S.V. C:N:P ratios of benthic marine plants. Limnol. Oceanogr. 1983, 28, 568–574. [Google Scholar] [CrossRef]
  40. Duarte, C.M. Seagrass nutrient content. Mar. Ecol. Prog. Ser. 1990, 67, 201–207. [Google Scholar] [CrossRef]
  41. Lee, K.-S.; Short, F.T.; Burdick, D.M. Development of a nutrient pollution indicator using the seagrass, Zostera marina, along nutrient gradients in three New England estuaries. Aquat. Bot. 2004, 78, 197–216. [Google Scholar] [CrossRef]
  42. Schein, A.; Courtenay, S.C.; Kidd, K.; Campbell, A.; van den Heuvel, M.R. Food web structure within an estuary of the southern Gulf of St. Lawrence undergoing eutrophication. Can. J. Fish. Aquat. Sci. 2013, 70, 1805–1812. [Google Scholar] [CrossRef]
  43. Hemminga, M.A.; Mateo, M.A. Stable carbon isotopes in seagrasses: Variability in ratios and use in ecological studies. Mar. Ecol. Prog. Ser. 1996, 140, 285–298. [Google Scholar] [CrossRef]
  44. Bateman, A.S.; Kelly, S.D. Fertilizer nitrogen isotope signatures. Isot. Environ. Health Stud. 2007, 43, 237–247. [Google Scholar] [CrossRef] [PubMed]
  45. McClelland, J.W.; Valiela, I.; Michener, R.H. Nitrogen-stable isotope signatures in estuarine food webs: A record of increasing urbanization in coastal watersheds. Limnol. Oceanogr. 1997, 42, 930–937. [Google Scholar] [CrossRef]
  46. Holmer, M.; Baden, S.; Bostrom, C.; Moksnes, P.-O. Regional variation in eelgrass (Zostera marina) morphology, production and stable sulfur isotopic composition along the Baltic Sea and Skagerrak coasts. Aquat. Bot. 2009, 91, 303–310. [Google Scholar] [CrossRef]
  47. Fraser, M.W.; Kendrick, G.A. Belowground stressors and long-term seagrass declines in a historically degraded seagrass ecosystem after improved water quality. Sci. Rep. 2017, 7, 14469. [Google Scholar] [CrossRef]
  48. Brodersen, K.; Nielsen, D.; Ralph, P.; Kuhl, M. Oxic microshield and local pH enhancement protects Zostera muelleri from sediment-derived hydrogen sulphide. New Phytol. 2015, 205, 1264–1276. [Google Scholar] [CrossRef]
Figure 1. Sample and data collection stations in the Wheatley River estuary on the north coast of Prince Edward Island, Canada. Numbers indicate eelgrass sampling stations. Black outlines in the regional map are watershed/subwatershed boundaries. The blue polygon is the defined area of the estuary. The labeled points are the sampling locations.
Coasts 04 00021 g001
Figure 2. Nitrogen loading and nitrate-N concentration from freshwater external loading in the Wheatley River estuary between 2006 and 2021. Error bars are standard errors of the mean, the nutrient concentration sample size ranges between 1 and 6, and the sample size of the estimated load is 123 d.
Coasts 04 00021 g002
Figure 3. Wheatley River estuary, PE, Canada, showing eelgrass coverage results from 2014 (light green) and 2020 (dark green). All eelgrass coverage in 2014 fell within the area of eelgrass coverage in 2020. Dark grey indicates shellfish aquaculture leases within the estuary (largely at a depth below 3 m, outside of the area of suitable eelgrass habitat).
Coasts 04 00021 g003
Figure 4. Above-ground, below-ground, and the below-to-above-ground ratio of dried biomass from Zostera marina collected in the Wheatley River estuary. Error bars are the standard errors of the mean, and the nominal sample size for each point was five but ranged from four to five. Different letters indicated significant differences within each sample period.
Coasts 04 00021 g004
Figure 5. Mean eelgrass C, N, and S stable isotopes for (A,C) above-ground-biomass and (B,D) below-ground biomass at each of five sampling stations within the Wheatley River estuary.
Coasts 04 00021 g005
Figure 6. The ratio of total C to total N data for above-ground (A) and below-ground (B) eelgrass tissues collected from five sampling stations within the Wheatley River estuary over the months of June, July, and August. Error bars are the standard error of the mean and the nominal sample size for each point was five, but ranged from four to five. Different letters indicated significant differences within each sample period.
Coasts 04 00021 g006
Table 1. Measured (2020) and interpolated (2019) temperature, sediment, and water chemistry characteristics of five eelgrass monitoring stations in the Wheatley River estuary. Oxygen and temperature metrics represent the summary of continuous monitoring from 15 June to 7 August 2020 (n = 2539). Salinity was measured monthly in 2020 (15 June, 14 July, and 7 August). Maximum chlorophyll (mean of top and bottom 0.5 m) was derived from samples collected on 6 August 2019. Turbidity is displayed as a grand mean calculated from samples taken from 5 June to 13 September 2019. Sediment characteristics were based on the average of reactor studies and sediment analysis conducted in June and September of 2019 (described in Cormier et al. [22]) and are presented as the June-to-September range. Interpolations were based on 10 stations. S.E.M. is standard error of the mean.
Station12345
Depth (m)1.20.60.80.91.2
Measured hypoxia (percentage of time < 4 mg/L) %29.18.16.80.20.4
Measured superoxia (percentage of time > 10 mg/L) %20.844.744.759.248.1
Measured mean temperature (S.E.M., °C)21.3 (0.05)21.2 (0.06)20.9 (0.06)21.1 (0.05)21.1 (0.05)
Measured temperature range (°C)12.9–27.3 13.1–29.2 12.8–28.7 13.0–28.1 12.9–27.1
Measured salinity (PSU)27.129.930.531.230.8
Interpolated max chlorophyll a (μg/L)6.59.08.98.68.3
Interpolated turbidity (NTU, grand mean)9.33.33.22.92.5
Interpolated sediment %N0.3–0.80.2–0.10.2–0.10.1–0.10.0–0.0
Interpolated N flux (mg/m2/h)3.4–4.50.7–0.80.7–0.80.6–0.70.6–0.5
Interpolated P flux (mg/m2/h)1.6–0.40.3–0.70.3–0.60.2–0.40.3–0.1
Interpolated sediment organic C (% d.w.)3.8–8.92.9–2.02.8–2.02.4–1.82.0–1.5
Table 2. Mean (SEM) carbon, nitrogen, and sulfur stable isotopes from eelgrass above- and below-ground biomass. The nominal sample size was five, sample size ranged from three to six. Means within rows (stations within a sampling period) with the same superscript letter are not significantly different.
Isotope/DateStation
12345
δ13C
Above-ground
June 15−8.98 (0.36) b−7.71 (0.10) a−7.87 (0.44) a−7.75 (0.07) a−7.84 (0.12) a
July 14−10.61(0.04) b−7.34 (0.24) a−7.52 (0.22) a−6.97 (0.07) a−6.96 (0.18) a
August 7−9.73 (0.16) c−6.73 (0.08) a−7.45 (0.15) b−7.34 (0.13) ab−7.86 (0.21) b
Below-ground
June 15−9.45 (0.41) b−7.92 (0.10) a−8.17 (0.32) a−7.92 (0.07) a−8.04 (0.11) a
July 14−10.05 (0.33) b−8.19 (0.22) a−7.95 (0.11) a−8.09 (0.10) a−7.60 (0.12) a
August 7−10.11 (0.10) c−7.64 (0.11) a−7.93 (0.09) ab−7.94 (0.12) ab−8.38 (0.13) b

δ15N
Above-ground
June 156.13 (0.23) a6.37 (0.16) a5.63 (0.32) a4.26 (0.27) b6.37 (0.11) a
July 145.91 (0.16) a6.06 (0.48) a5.72 (0.21) a5.30 (0.26) a6.27 (0.15) a
August 75.73 (0.22) b7.18 (0.13) a5.69 (0.20) b5.65 (0.31) b6.38 (0.22) ab
Below-ground
June 155.40 (0.22) ab5.83 (0.14) a4.82 (0.28) bc4.00 (0.10) c5.91 (0.32) a
July 145.07 (0.23) a5.10 (0.42) a4.79 (0.46) a4.35 (0.17) a5.06 (0.26) a
August 75.09 (0.22) abc5.91 (0.22) a4.04 (0.31) c4.68 (0.32) c6.02 (0.25) ab

δ34S
Above-ground
June 1515.41 (1.01) ab17.17 (0.34) a13.51 (1.04) bc12.24 (0.74) c15.68 (0.60) ab
July 1415.64 (0.69) a14.07 (0.53) a9.55 (1.17) b9.95 (0.36) b15.15 (0.81) a
August 716.14 (0.54) a14.61 (0.79) ab9.33 (0.40) c9.32 (0.48) c13.01 (0.74) b
Below-ground
June 152.46 (1.57) ab7.68 (0.88) a1.51 (2.87) ab−0.90 (0.47) b5.41 (0.86) ab
July 1410.99 (2.23) a2.36 (1.72) bc−2.48 (1.05) c−2.45 (0.89) c4.30 (1.40) b
August 77.50 (1.47) a3.01 (0.89) ab−5.43 (1.04) d−1.99 (1.01) cd2.64 (0.80) bc
Disclaimer/Publisher’s Note: The statements, opinions and data contained in all publications are solely those of the individual author(s) and contributor(s) and not of MDPI and/or the editor(s). MDPI and/or the editor(s) disclaim responsibility for any injury to people or property resulting from any ideas, methods, instructions or products referred to in the content.

