Abstract
Thinking of present gastronomic trends is inevitable when talking about innovation in Haute Pastry. Despite the rising demand for new creations, launching a successful product that meets the high expectations of consumers is increasingly complex. For this reason, sensory analysis studies are more and more interested in studying the emotions generated by these products to understand and improve user experiences. The main goal of this work was to conduct a study to analyze the emotional arousal of consumers after the visualization of five special cakes. For data collection, an online questionnaire with EsSense Profile® scale and CATA methodology has been used. EsSense Profile® is a predefined and validated scale that measures emotions generated by food that includes 39 terms. When analyzing the emotions expressed by all the participants, 22 were statistically significant, of which 14 were classified as positive, 6 as neutral, and only 2 were negative. The results obtained support the importance of the emotional profile in understanding consumers’ expectations and behavior.
1. Introduction
The current concept of gastronomic innovation is experiencing growing public and professional interest [1]. Although culinary creativity has always existed, today, that creativity focuses mainly on haute cuisine. Inevitably, due to similar intuitive product development, traditional bakeries have also been affected by this ‘modernist cuisine’ phenomenon. Thus, its transformation into what is known as Haute Pastry has turned it into a technical, rigorous, and multidisciplinary area. This high-quality pastry could be considered an “ephemeral art”, which in addition to technique, has an aesthetic and emotional sensitivity in the reconciliation of flavors, colors, textures, and shapes of the different ingredients that are part of each composition [2,3,4]. Therefore, when it comes to perceiving an Haute patisserie cake, visually speaking, the consumer is exposed to a variety of emotional experiences, often unconsciously. It has been proved that food selection depends mainly on sensory attributes that are based on visual perception [5]. This visual sense provides the most references to the client since 80% of the information in commercial spaces is obtained through sight [6]. When evaluating the emotional responses of consumers to food products, distinguished information is obtained that contributes to the understanding of consumer behavior and expectations and the acceptance of new products [7]. These emotional responses that arise from the visual signals caused by the perception of a relevant stimulus [8] play an essential role in adding value to the product and directly controlling the expectations and perception of the consumer [9]. Indeed, consumers are very often carried out by the unconscious emotional evocation of a product to decide to satisfy their desire to purchase [10].
The main goal of this work was to study the emotional response of consumers after visual evaluation of five cakes using an online questionnaire.
2. Materials and Methods
2.1. Stimuli
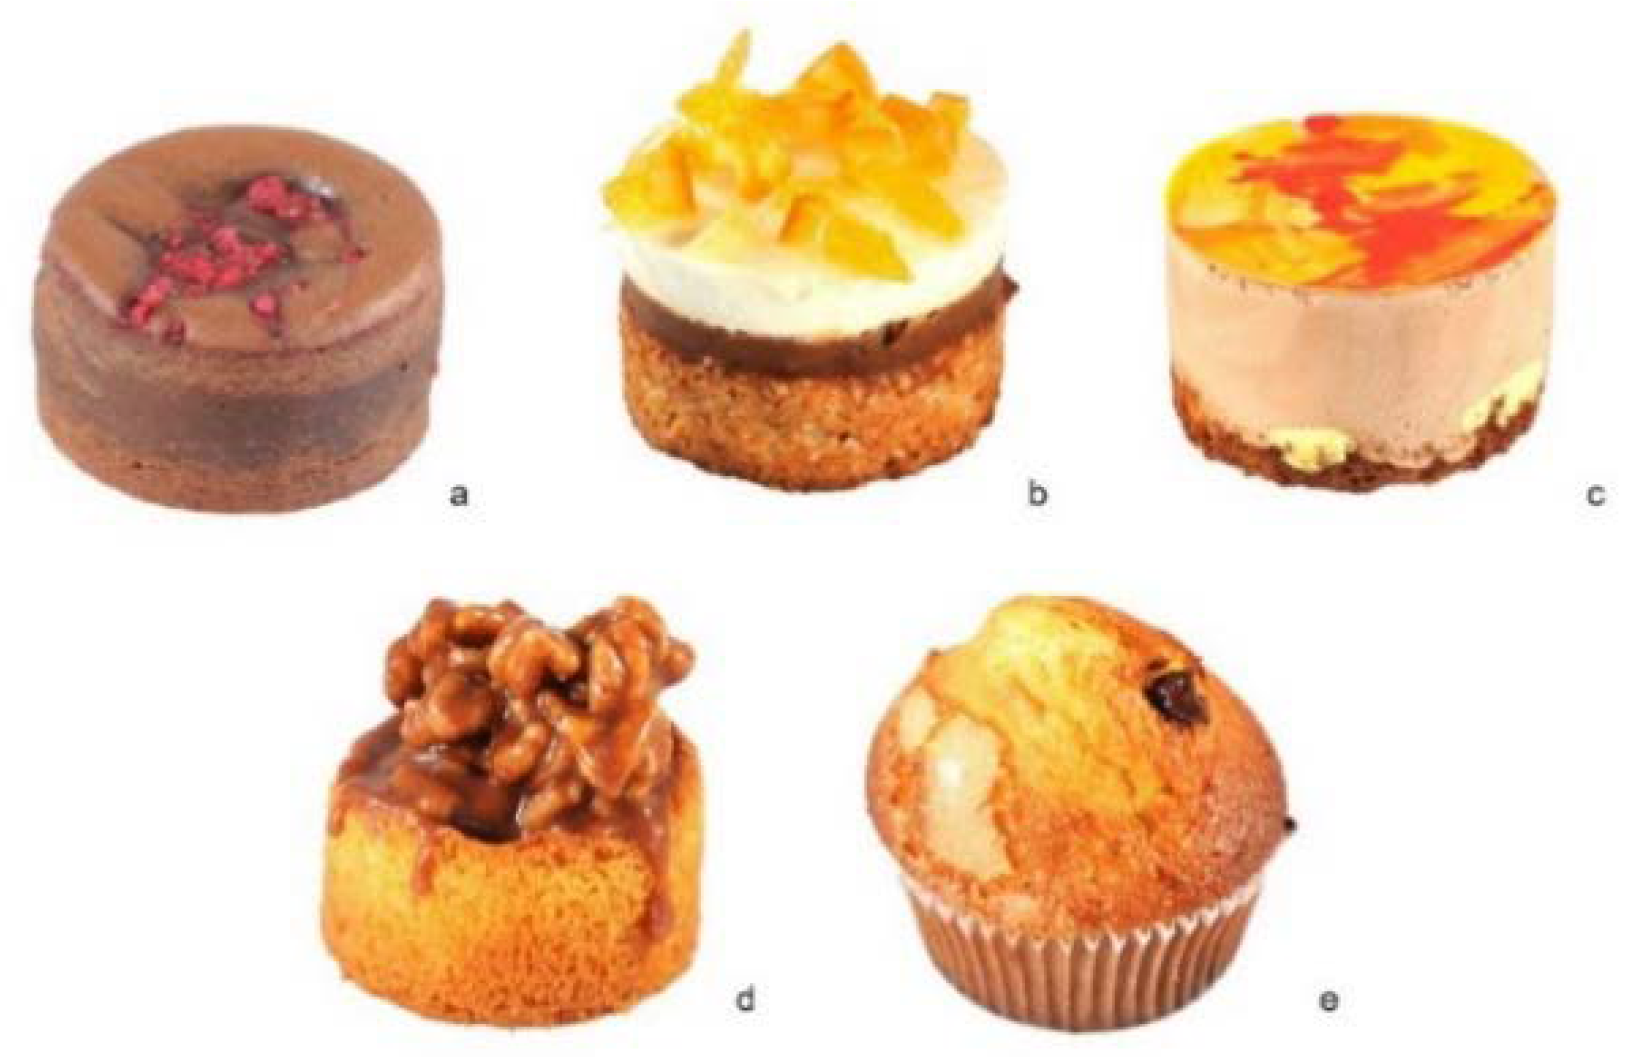
Five cakes with different characteristics designed by “Casa La Curra” (Torrent, Valencia, Spain) were used in this study (Figure 1). A “Coulan cake” (CC) with a molten chocolate heart of Guanaja 70% and raspberries (Figure 1a) was created. The “Leonor cake” (LC) was made of a dacquoise base of coconut and almonds, filled with creamy almond praline and 34% Ivory lemon mousse with white chocolate, and decorated with candied orange pieces (Figure 1b). “Saffron cake” (SC) consisted of a base of butter biscuit filled with a saffron cream with Granny Smith apple, steamed with saffron, rosemary honey, and mousse of Manjari chocolate 64% (Figure 1c). A “Walnut cake” (WC) was made of a sablée breton topped with salted caramel cream, nuts, and creamy milk chocolate (Figure 1d). Finally, the “Chocomuffin” (CM) was a conventional muffin incorporated with a filling of 70% Guanaja chocolate (Figure 1e).
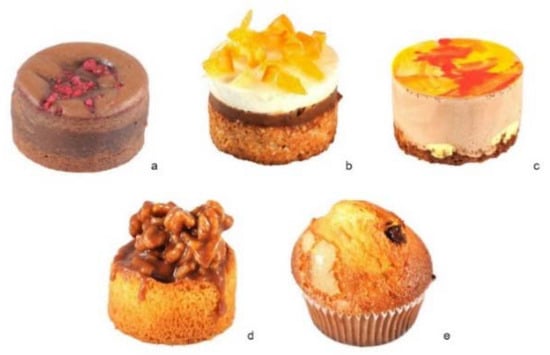
Figure 1.
Stimuli designed by “Casa La Curra”: (a) Coulan (CC), (b) Leonor cake (LC), (c) Saffron cake (SC), (d) Walnut cake (WC), and (e) Chocomuffin (CM).
Pictures were taken with a Nikon D200 camera with Nikkor 24–70 mm f/2.8S objective (Nikon Corporation, Tokyo, Japan). A white uniform background and three led panel light Neewer (Shenzhen Neewer Technology Co., Shenzhen, China) were used to ensure constant lighting conditions in the room.
2.2. Participants
Participants were invited to complete the online survey by email and by social networks. The contact list included students, staff, and lecturers of the Universitat Politècnica de Valencia and other contacts. It is important to notice that, as is usual in qualitative research, this study did not intend to be representative of the entire Spanish population but rather to test the results of questionnaires online to obtain inferences about emotional responses to visual evaluation. A total of 381 answers were obtained and analyzed.
2.3. Questionnaire
The electronic questionnaire implemented for this task was designed with RedJade® Online Survey Tool (Redjade Sensory Solutions, LLC, Martinez, CA, USA). The questionnaire included: (i) food frequency questionnaire of sweet products and subjective hunger, (ii) visual evaluation using EsSense Profile® (39 emotions) [11] in a CATA list, (iii) sociodemographic questions. Each survey lasted approximately 10 min. The online questionnaire was available for 2 weeks.
2.4. Statistical Analysis
A Cochran’s Q test was performed on each of the CATA list emotions to detect differences in consumer perception of cakes (p < 0.05). Correspondence analysis (CA) was used to investigate the association between the cakes and the expected emotions. A principal component analysis (PCA) was performed with the emotions and visual acceptance, and willingness to buy. All analyses were performed using XLSTAT statistical software (version 2021 Addinsoft®, New York, NY, USA).
3. Results and Discussion
3.1. Emotional Profile after Visual Evaluation
The CATA data analysis was done initially with all attributes. Cochran’s Q test allowed choosing only those that showed significant differences between the different cakes (p < 0.05). Consequently, 22 significant emotions were selected from the EsSense Profile® with which the emotional profile of each of the five cakes could be studied (Table 1). Of which 14 were positive, 6 were neutral, and 2 were negative.

Table 1.
Cochran’s Q test for each emotion.
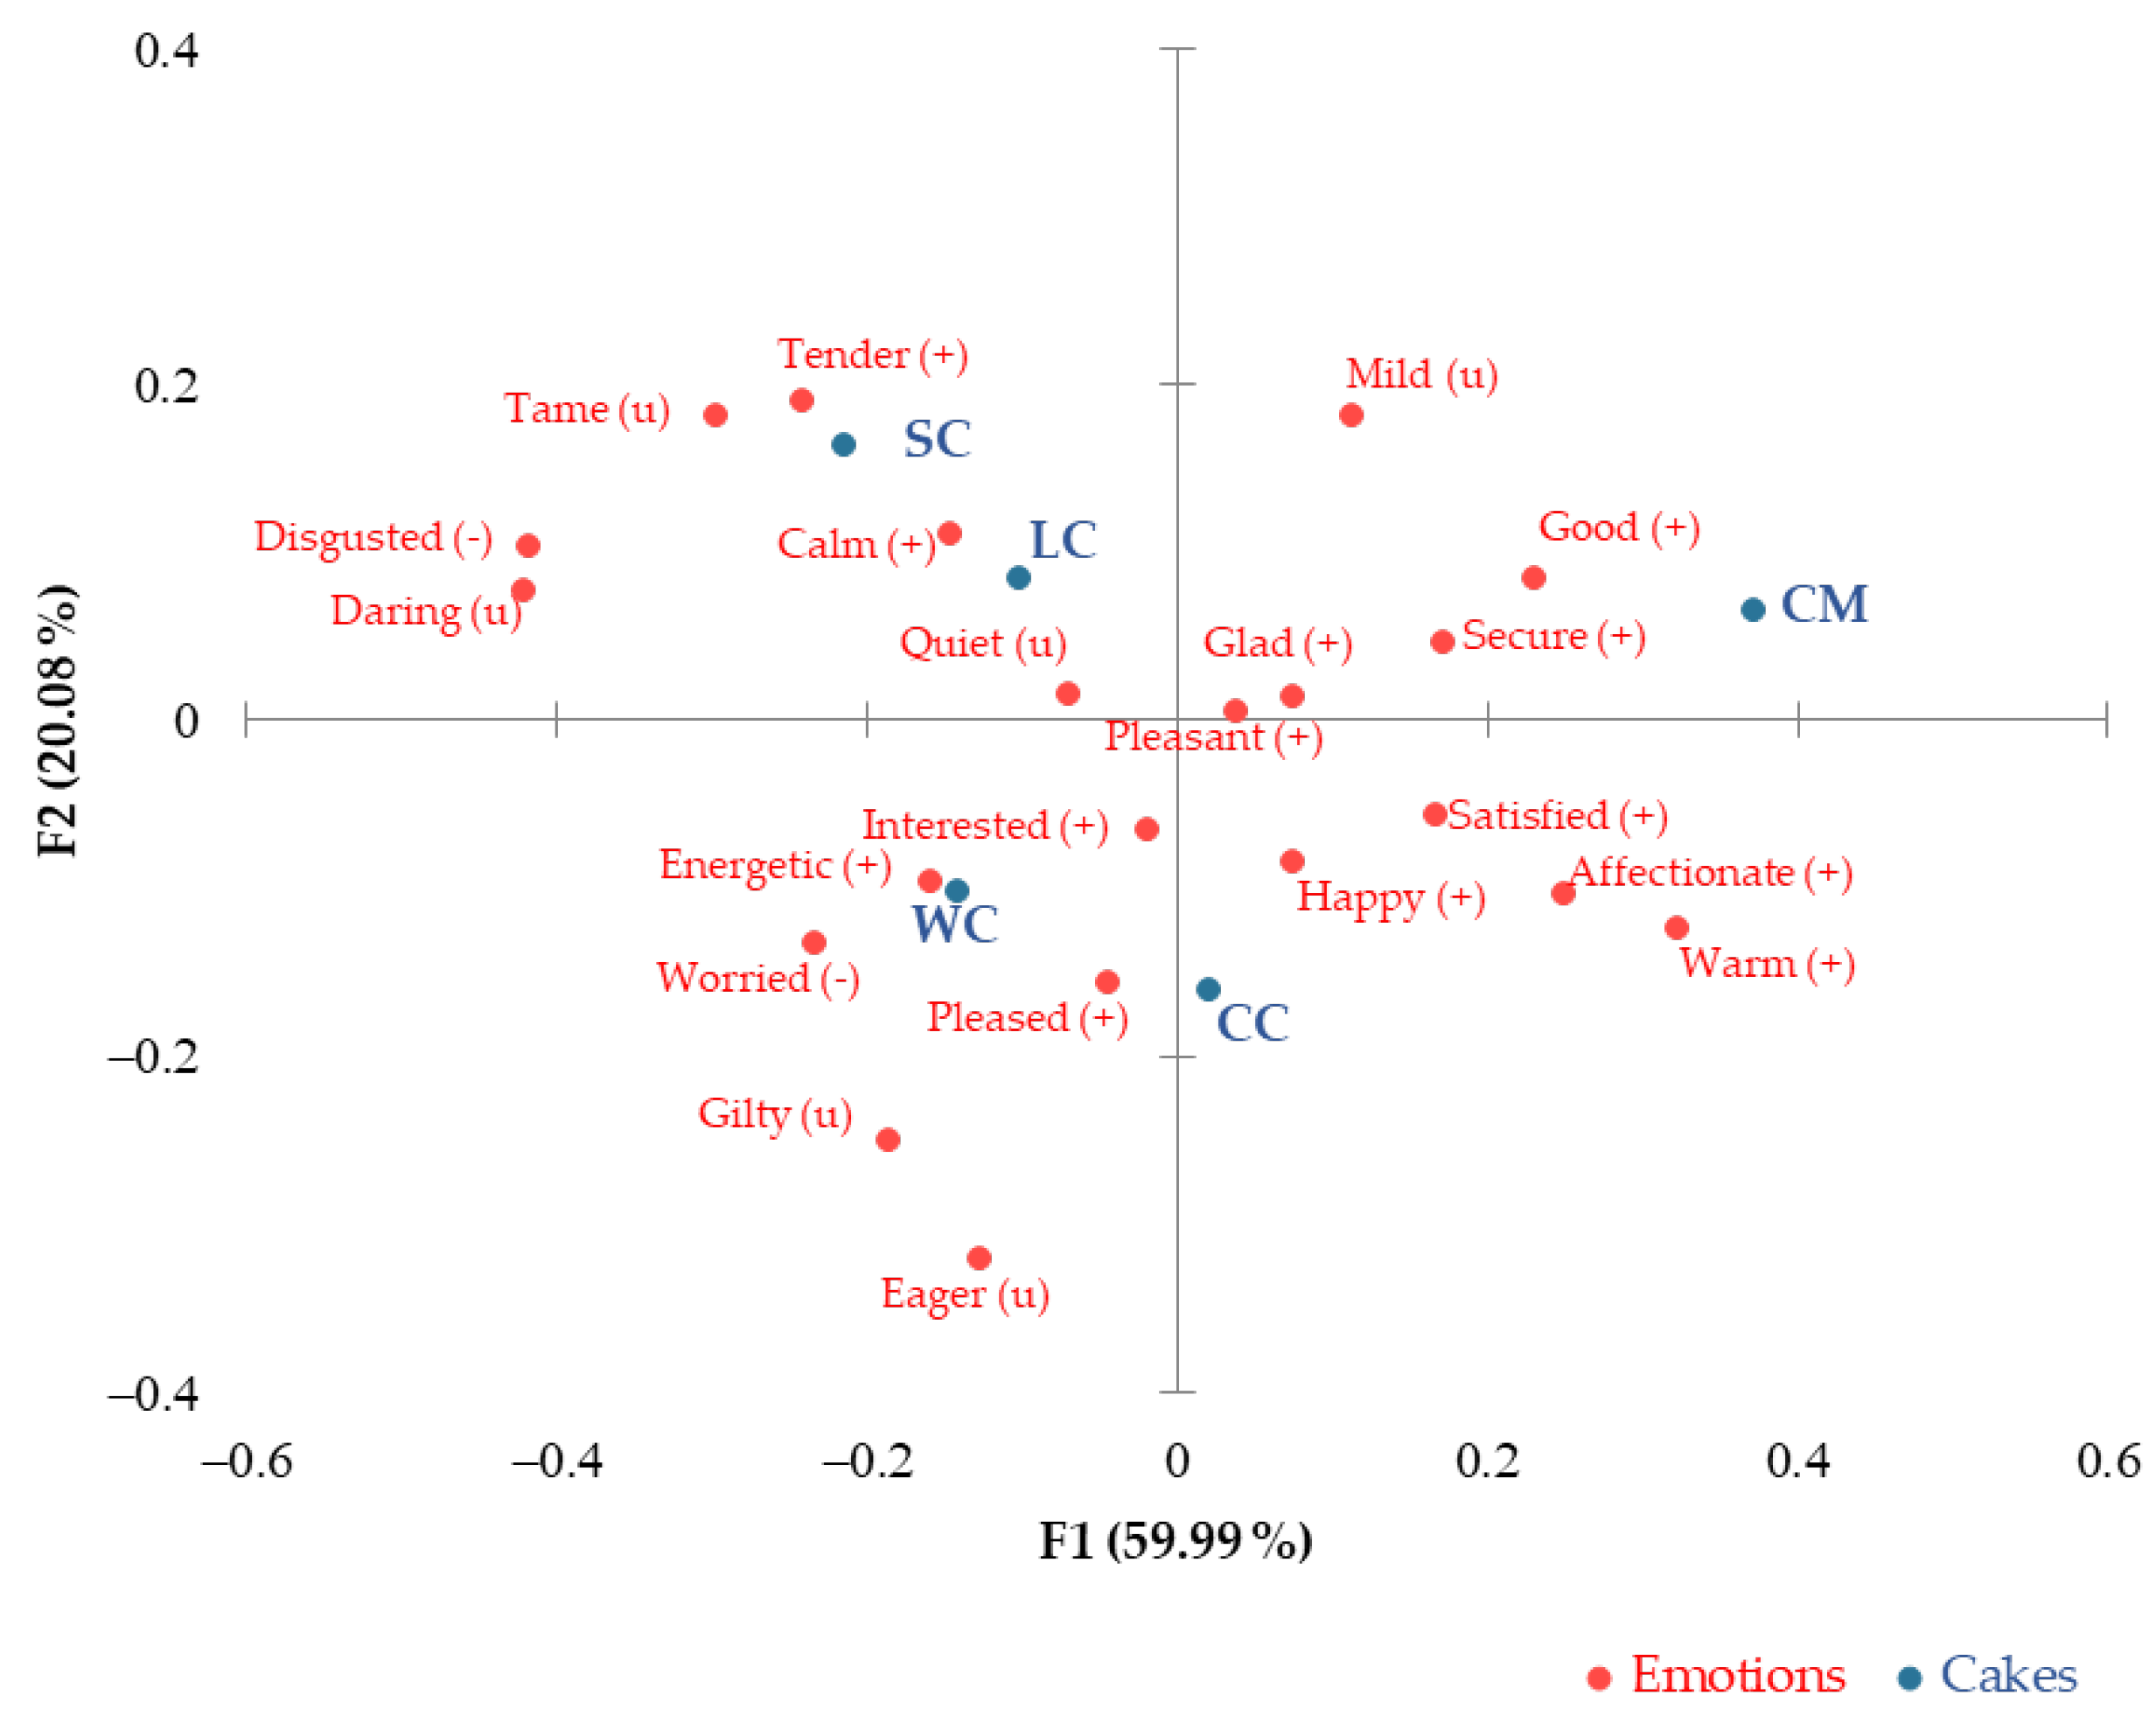
Figure 2 shows the correspondence analysis of the significant emotions. The two cakes, Leonor Cake and Saffron Cake, were associated with calm and delicate emotions due to their careful design. On the other hand, the Chocomuffin was linked to the attributes “secure” and “nostalgic”, because of its widespread and frequent consumption, which was associated with positive emotions that bring back good memories. The Walnut Cake and Coulan Cake were relatively close on the emotional map, although the Coulan Cake was more related to “happy” and “pleased”; perhaps because it was made of chocolate, an appreciated comfort ingredient commonly associated with pleasure [12]. The Walnut Cake made respondents feel “energetic” and “worried” because of its attractive but caloric ingredients that generate a feeling of concern, but it was also perceived as a source of energy.
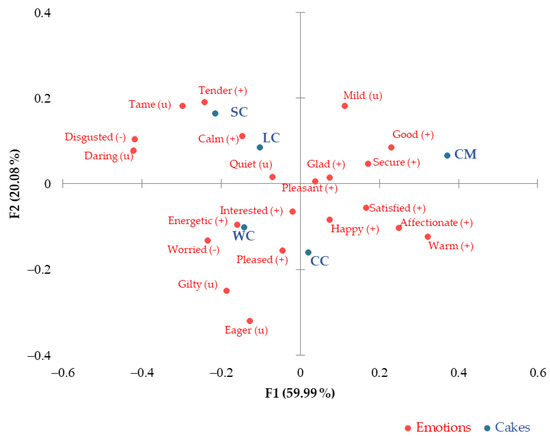
Figure 2.
Correspondence analysis of the significant emotional responses obtained with CATA EsSense Profile®. Note: (+): positive emotion; (−): negative emotion; (u): neutral emotion; WC: Walnut cake; LC: Leonor cake; SC: Saffron cake; CC: Coulan cake; CM: Chocomuffin.
When analyzing the effects that each attribute has on the mean (Figure 3), it is observed that only five had a negative effect. The two emotions that provoked consumers’ rejection were “disgusted” and “tame”. It is suggestive to point out that the adjective “disgusted” was the most common when the respondent evaluated a product that they considered unpleasant [13,14]. The rest of the words had positive effects, highlighting “happy”, “pleased”, and “satisfied” as the ones that had the best impact. This analysis allowed us to consider which emotions must be evoked and which must not if we want a new cake to be successful in the market, based on our consumers’ profiles.
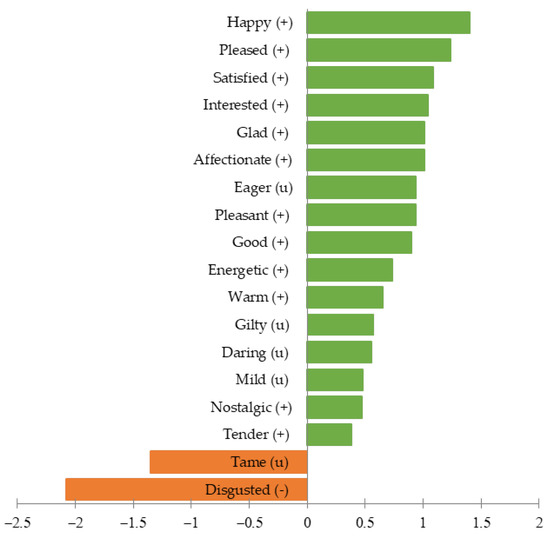
Figure 3.
Effects on the mean for each significant attribute. Note: (+): positive emotion; (−): negative emotion; (u): neutral emotion.
3.2. Visual Acceptance and Willing to Buy
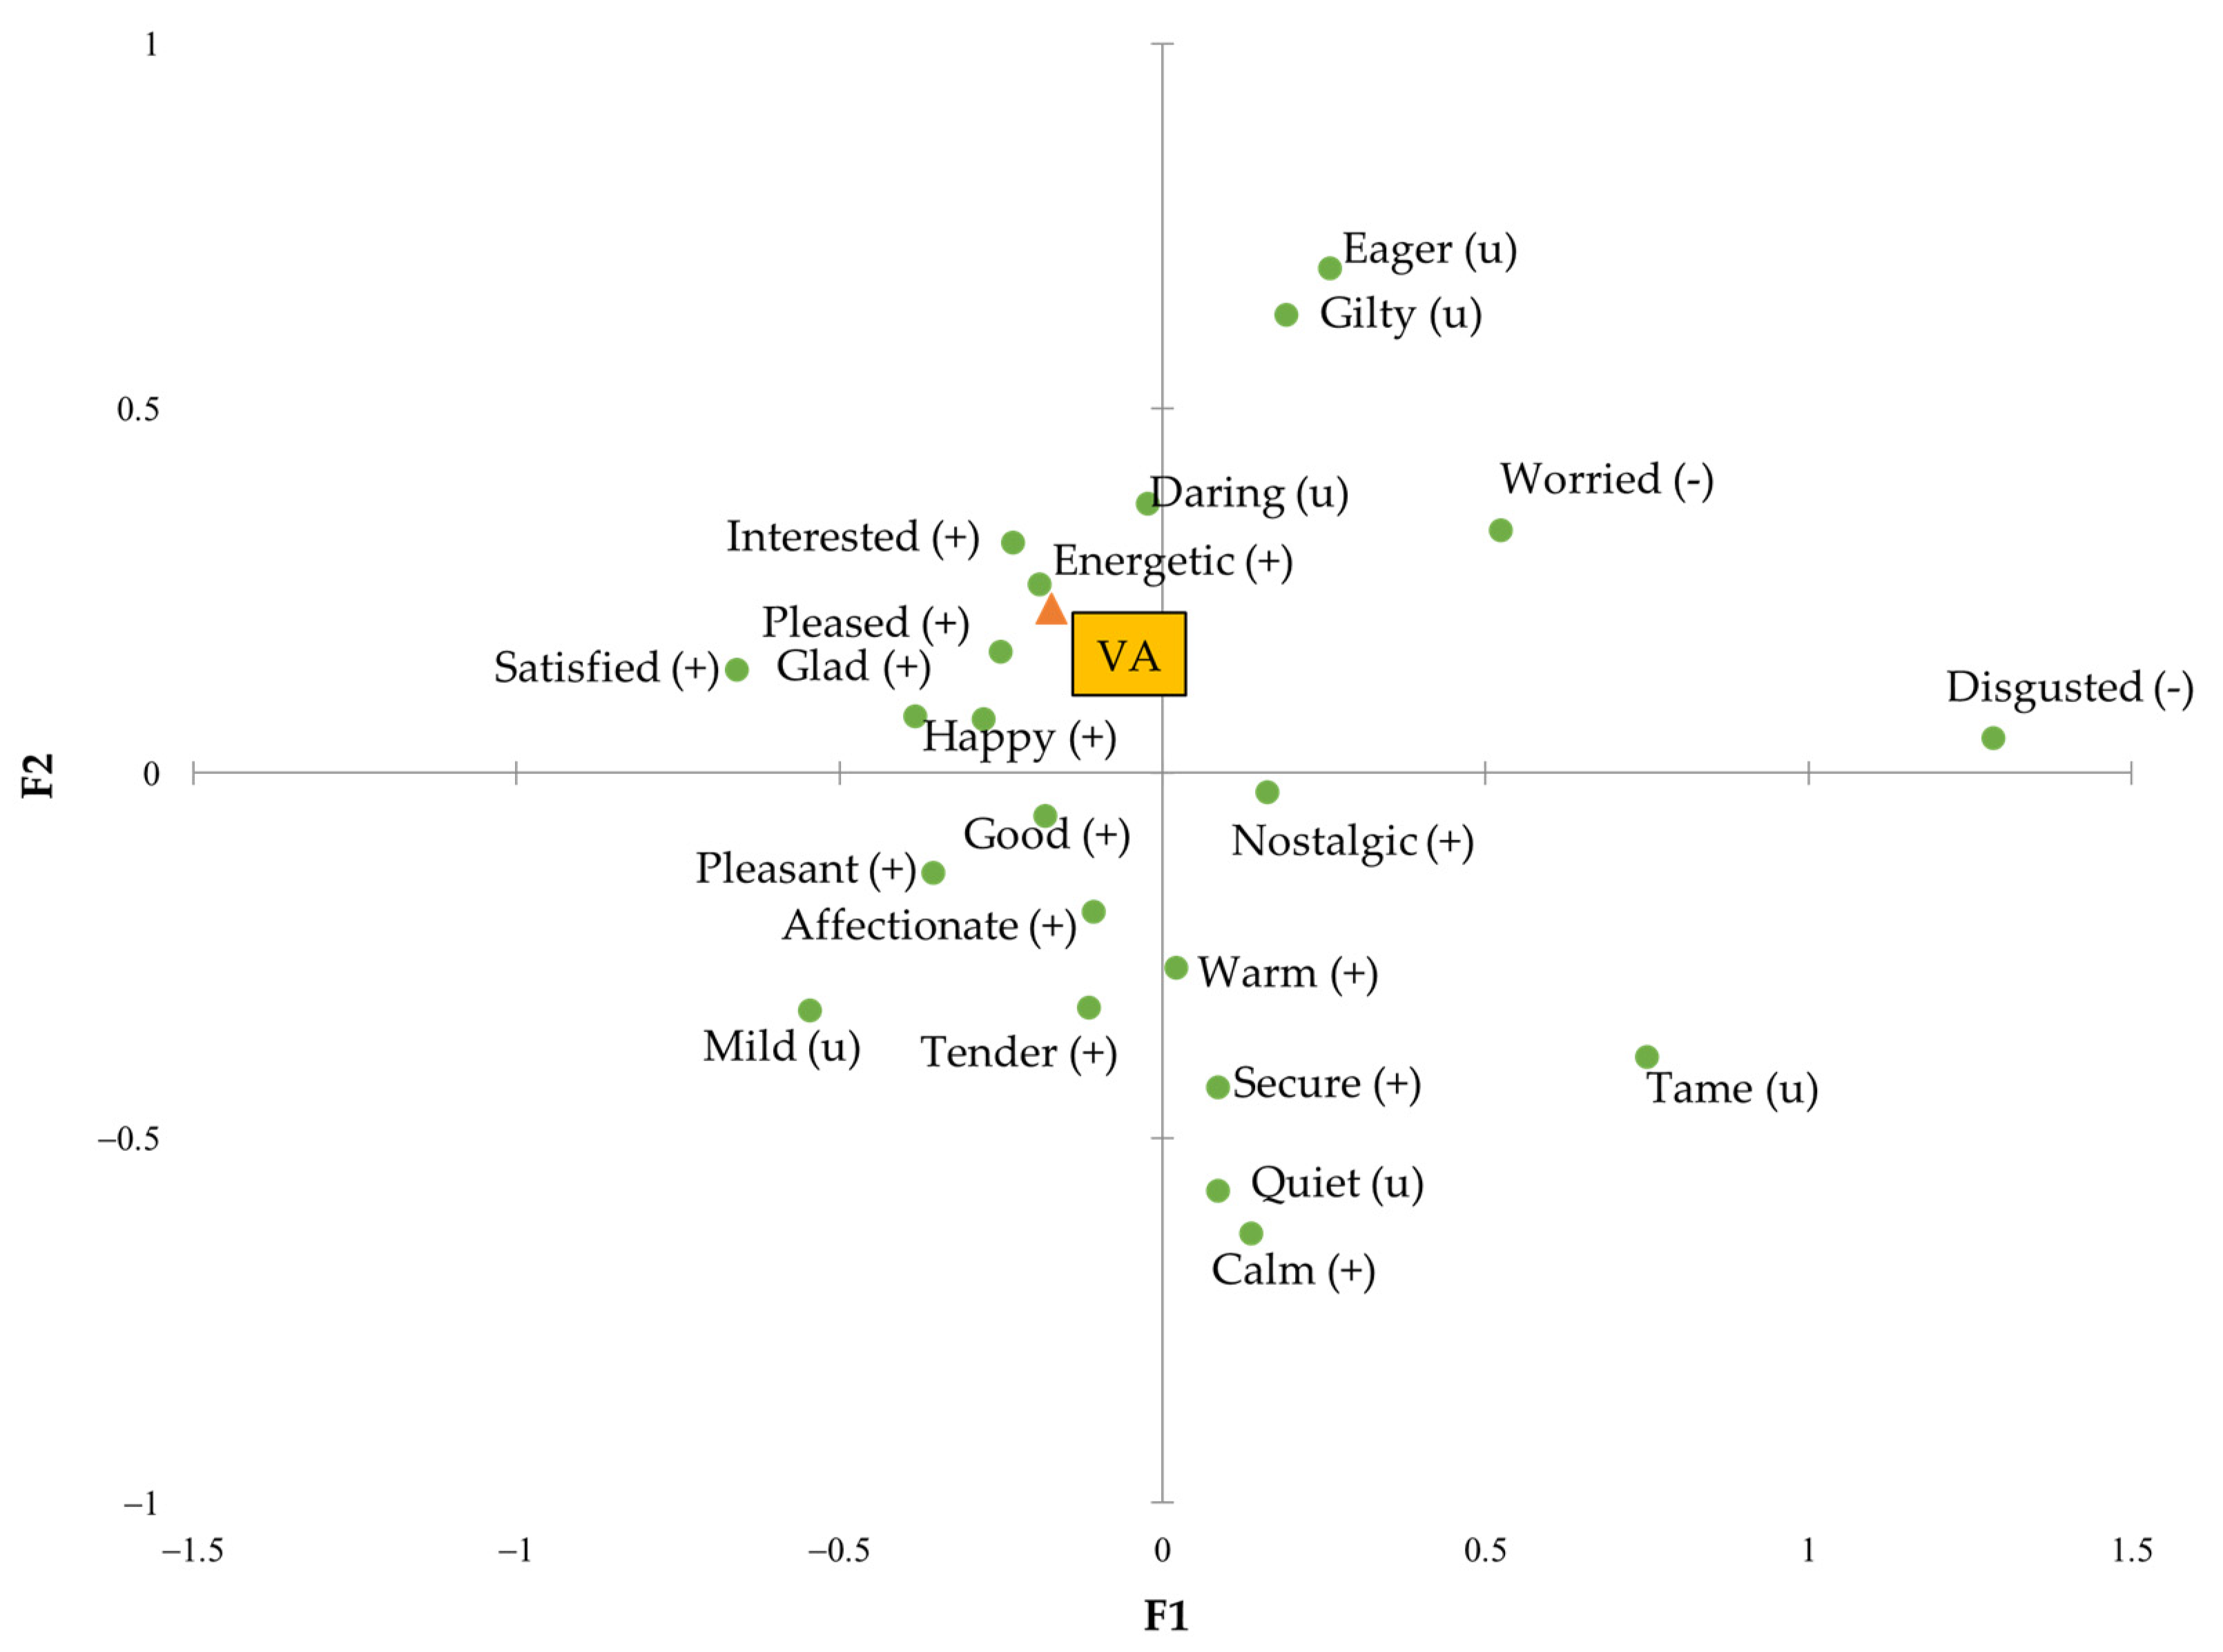
Subsequently, the variables “visual acceptance” (VA) and “willing to buy” (WTB) were analyzed to identify the emotions to which they were related. Figure 4 represents the principal coordinate analysis in the form of an emotional map that places VA among the different significant attributes. It can be said that a cake with greater visual acceptance was mainly associated with the emotions “energetic” and “interested”. On the other hand, one that was mainly related to “disgusted” produced a certain visual rejection. Again, it is striking that when a cake was related to the neutral adjectives “daring” and “guilty”, more visual tolerance was generated than with the adjectives “secure” and “calm”, classified as positive. These types of emotions, related to trust, are common when evaluating a product that is widely accepted [15,16]. Therefore, given the importance of visual acceptance in consumer expectations, this analysis shows important aspects to be considered.
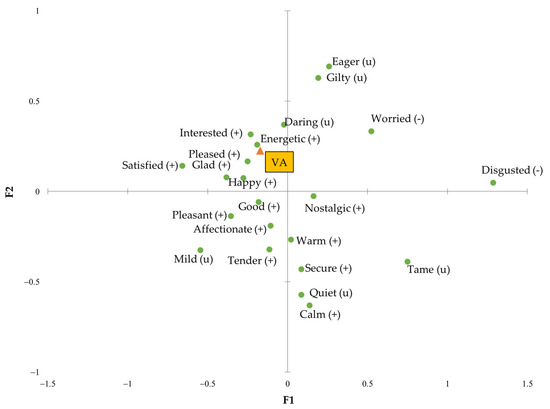
Figure 4.
Principal coordinates analysis with the variable “Visual acceptance” (VA) of the significant emotional responses obtained with CATA EsSense Profile®. Note: (+): positive emotion; (−): negative emotion; (u): neutral emotion.
Tukey’s HSD multiple comparison analysis was performed to compare each group of cakes according to the variables VA and WTB (Table 2). Saffron Cake had a significantly lower value of VA than the rest, which made it the least visually appreciated by the participants. Leonor Cake and Walnut Cake presented significant differences with Saffron Cake and with Chocomuffin and Coulan Cake, and the last group without significant differences were the Chocomuffin and Coulan Cake, the most visually accepted. These last two cakes were the best known and most familiar to the respondents, so the fact of being used to them directly influenced their general acceptance in a positive way [15].
Table 2.
Means of the answers were obtained according to Visual Acceptance (VA) and Willing to Buy (WTB) for each cake.
As to the WTB variable, the results did not follow the exact same distribution. The two cakes that inspired the most desire to buy were the Chocomuffin and Coulan Cake, with a slight non-significant preference over the first one. In this case, no statistically significant differences were found between the WTB of the Leonor Cake or Saffron Cake, which did appear with the Chocomuffin and Coulan Cakem, and only the Leonor Cake presented differences with Walnut Cake. Finally, the Walnut Cake and Saffron Cake formed a homogeneous group with statistical differences from the one formed by the Chocomuffin and Coulan Cake. It should be noted that despite being the worst valued visually, Saffron Cake showed a greater willingness to buy than the Walnut Cake, which had a greater VA.
4. Conclusions
The results obtained support the importance of the emotional profile in understanding consumers’ expectations and behavior. This work opens future areas of study to understand the effects of emotions on eating behavior for Haute Pastry products.
Author Contributions
Conceptualization, J.A.-M., L.M.C., J.M.-M. and P.G.-S.; methodology, A.B.-O. and J.A.-M.; formal analysis, A.B.-O.; investigation, A.B.-O., J.A.-M. and P.G.-S.; resources, J.M.-M. and P.G.-S.; data curation, A.B.-O. and P.G.-S.; writing—original draft preparation and editing, A.B.-O. and J.A.-M.; writing—review, L.M.C., P.G.-S. and J.M.-M.; supervision, L.M.C. and P.G.-S. All authors have read and agreed to the published version of the manuscript.
Funding
This research received no external funding.
Institutional Review Board Statement
Ethical review and approval were waived for this study due to all data are anonymized, and these kinds of studies do not need approval by IRB at UPV.
Informed Consent Statement
Informed consent was obtained from all subjects involved in the study.
Data Availability Statement
Not applicable.
Acknowledgments
The pastry team in “Casa La Curra” designed all cakes for this project. Author Cunha acknowledges support from the strategic programs UIDB/05748/2020 and UIDP/05748/2020 (GreenUPorto) funded by Fundação para a Ciência e a Tecnologia.
Conflicts of Interest
The authors declare no conflict of interest.
References
- Stierand, M. Culinary Creativity, 3rd ed.; Elsevier: Amsterdam, The Netherlands, 2016; Volume 1, ISBN 9780128093245. [Google Scholar]
- Martínez-Monzó, J.; García-Segovia, P.; Albors-Garrigos, J. Trends and innovations in bread, bakery, and pastry. J. Culin. Sci. Technol. 2013, 11, 56–65. [Google Scholar] [CrossRef]
- Albors-Garrigos, J.; Barreto, V.; García-Segovia, P.; Martínez-Monzó, J.; Hervás-Oliver, J.L. Creativity and innovation patterns of haute cuisine chefs. J. Culin. Sci. Technol. 2013, 11, 19–35. [Google Scholar] [CrossRef]
- Albors-Garrigós, J.; Martinez Monzo, J.; Garcia-Segovia, P. Knowledge dynamics as drivers of innovation in Haute Cuisine and culinary services. Ind. Innov. 2017, 25, 84–111. [Google Scholar] [CrossRef]
- Laska, M.; Freist, P.; Krause, S. Which Senses Play a Role in Nonhuman Primate Food Selection? A Comparison between Squirrel Monkeys and Spider Monkeys. Am. J. Primatol. 2007, 69, 282–294. [Google Scholar] [CrossRef] [PubMed]
- Gomes, A.; de Azevedo, M.L.; Gomes, A. El sistema de oferta de restaurantes de alta gastronomía. Estud. Perspect. Tur. Vol. 2013, 22, 336–356. [Google Scholar]
- Gutjar, S.; Dalenberg, J.R.; de Graaf, C.; de Wijk, R.A.; Palascha, A.; Renken, R.J.; Jager, G. What reported food-evoked emotions may add: A model to predict consumer food choice. Food Qual. Prefer. 2015, 45, 140–148. [Google Scholar] [CrossRef]
- Ferrarini, R.; Carbognin, C.; Casarotti, E.M.; Nicolis, E.; Nencini, A.; Meneghini, A.M. The emotional response to wine consumption. Food Qual. Prefer. 2010, 21, 720–725. [Google Scholar] [CrossRef]
- Ngoenchai, P.; Alonso, J.R.; Suwonsichon, T.; Suwonsichon, S.; Prinyawiwatkul, W. Effects of Visual Cues on Consumer Expectation, Emotion and Wellness Responses, and Purchase Intent of Red Chili Powders. J. Food Sci. 2019, 84, 3018–3026. [Google Scholar] [CrossRef]
- Walsh, G.; Shiu, E.; Hassan, L.M.; Michaelidou, N.; Beatty, S.E. Emotions, store-environmental cues, store-choice criteria, and marketing outcomes. J. Bus. Res. 2011, 64, 737–744. [Google Scholar] [CrossRef]
- King, S.C.; Meiselman, H.L. Development of a method to measure consumer emotions associated with foods. Food Qual. Prefer. 2010, 21, 168–177. [Google Scholar] [CrossRef]
- Fona International. Indulgence. 2019; Trend Insight Report; Fona International Inc.: Geneva, IL, USA, 2019; Available online: https://www.fona.com/1219indulgence/ (accessed on 22 April 2022).
- Manzocco, L.; Rumignani, A.; Lagazio, C. Emotional response to fruit salads with different visual quality. Food Qual. Prefer. 2013, 28, 17–22. [Google Scholar] [CrossRef]
- Ng, M.; Chaya, C.; Hort, J. Beyond liking: Comparing the measurement of emotional response using EsSense Profile and consumer defined check-all-that-apply methodologies. Food Qual. Prefer. 2013, 28, 193–205. [Google Scholar] [CrossRef]
- Dorado, R.; Pérez-Hugalde, C.; Picard, A.; Chaya, C. Influence of first position effect on emotional response. Food Qual. Prefer. 2016, 49, 189–196. [Google Scholar] [CrossRef]
- Spinelli, S.; Masi, C.; Dinnella, C.; Zoboli, G.P.; Monteleone, E. How does it make you feel? A new approach to measuring emotions in food product experience. Food Qual. Prefer. 2014, 37, 109–122. [Google Scholar] [CrossRef]

Disclaimer/Publisher’s Note: The statements, opinions and data contained in all publications are solely those of the individual author(s) and contributor(s) and not of MDPI and/or the editor(s). MDPI and/or the editor(s) disclaim responsibility for any injury to people or property resulting from any ideas, methods, instructions or products referred to in the content. |
© 2021 by the authors. Licensee MDPI, Basel, Switzerland. This article is an open access article distributed under the terms and conditions of the Creative Commons Attribution (CC BY) license (https://creativecommons.org/licenses/by/4.0/).