Highlights
What are the main findings?
- The modelling demonstrates the viability of green hydrogen for electricity storage.
- The hydrogen electrolysers would need to be variable in order to create this viability.
What is the implication of the main finding?
- The analysis shows that green hydrogen would contribute to the reliability and stability of the electrical systems in question.
- The analysis shows the benefits of improving electrolyser variability and cost.
Abstract
The energy transition to wind and solar opens up opportunities for green hydrogen as wind and solar generation tend to bring electricity prices down to very low levels. We evaluate whether green hydrogen can integrate well with wind and solar PVs to improve the South Australian electricity grid. Green hydrogen can use membrane electrolysis plants during periods of surplus renewable energy. This hydrogen can then be electrified or used in industry. The green hydrogen system was analysed to understand the financial viability and technical impact of integrating green hydrogen. We also used system engineering techniques to understand the system holistically, including the technical, social, environmental, and economic impacts. The results show opportunities for the system to provide seasonal storage, grid firming, and reliability services. Financially, it would need changes to electricity rules to be viable, so at present, it would not be viable without subsidy.
1. Introduction
This report assesses the financial viability of a green hydrogen plant that integrates more solar and wind energy into the South Australian electricity system. The literature shows that this is technically feasible. This research evaluated the financial viability in the context of the South Australian electricity grid and the role of hydrogen in storing energy and enabling more variable renewable energy in the energy system.
Australia’s transition to renewable energy accelerated in 2001 with new legislation to promote renewable generation infrastructure [1]. Since then, energy policymakers have utilised carbon pricing, renewable energy certificates and targets, and framework initiatives to drive renewable energy investment [2]. The percent of electricity sourced from renewable sources must increase to around 85% by 2050 to achieve the Paris Agreement’s sustainability targets, which Australia formally ratified in 2016 [3].
South Australia leads the nation in implementing renewable technology [4], and rooftop PVs delivered 101.7% of the demand for thirty minutes on 31 December 2023 [5]. The primary issue created by this high reliance on solar and wind energy is the intermittent output due to supply variability. Green hydrogen can deliver electricity during peaks and soak up renewable energy when there are high supply levels, so green hydrogen can act as energy storage and deliver on-demand, dispatchable electricity. This use of green hydrogen can reduce costs for consumers. Green hydrogen would supply a flexible energy source option in the South Australian grid, such as by storing seasonal energy and offering demand response mechanisms.
Therefore, this research aimed to show how to increase the reliability of the energy supply to the South Australian grid through added generation, through seasonal storage, and by creating a dispatchable energy source. This research also aimed to help reduce the variability of energy prices for South Australian consumers and increase the energy grid’s stability by supplying an additional opportunity to remove energy from the grid and store it locally.
The proposed solution aims to support South Australia in achieving these goals. However, clarity of the financial viability is paramount to promoting the implementation of the proposed solution. Thus, this research utilised the Net Present Value (NPV), Internal Rate of Return (IRR), and Levelized Cost of Electricity (LCOE) and was undertaken from the perspective of a private entity rather than that of a government body. Therefore, we have limited our focus to reflect a private investor’s research needs (financial return rather than economic return). However, this research also explores the impacts on the South Australian community, including stimulating the local economy and improving the electricity grid’s reliability.
This research explored the feasibility of green hydrogen projects from a private entity’s perspective, with financial return as the primary focus. Although we consider them important, research resources limited us and do not cover societal and environmental benefits.
Renewable energy is a very current and relevant issue, given the deteriorating nature of the global climate. Green hydrogen supplies an opportunity to support renewable energy development. Its cost is set to fall by up to 64% by 2040 [6]; this highlights that early research and implementation could help steer Australia to a more sustainable future. South Australia’s renewable energy capacity provides an ideal location for evaluating the feasibility of using green hydrogen.
2. Literature Review
This review covers the current understanding of the energy transition and its relationship with the South Australian energy network, energy markets, existing renewable energy production sources, the energy transition, and its effect on energy supply, and innovative solutions using dispatchable technology. The review concludes by examining hydrogen’s storage and energy production uses and presenting existing hydrogen models.
South Australia’s electricity system differs from those of other states due to its higher renewable share of the total electricity supply, and renewable energy supplied 86.9% of the total electricity generation in October 2023 [7]. In South Australia, wind (40%) and solar (10%) are the main contributors, whilst natural gas accounts for the entire fossil fuel energy production [8]. Currently, the demand on the South Australian grid is considered “peaky” due to the significant shifts in loads [9], with the network averaging around 1500 MW but fluctuating between 500 MW and 3000 MW loads [10].
South Australia has shifted from a low renewable capacity to high renewable penetrations over the past 15 years [9]. South Australia is a world-class region for wind and solar due to its location and natural resources [10]. South Australia’s shift to renewable energy production has led to a pipeline of wind, solar, and storage projects equalling 14,551 MW, or an investment of $A21.5 billion [10].
One issue with such a high renewable supply is maintaining inertia to maintain the electrical voltage and frequency within an acceptable range. As wind and solar generation do not provide any measurable amount of inertia, ARENA [11] explored dispatchable renewable electricity options, including various storage forms and hydrogen. ARENA [11] describes dispatchable requirements in terms of flexibility (fast start-up) and guaranteed power output.
Table 1 shows potential dispatchable technologies, and we have explored the literature to examine the suitability of each technology option.

Table 1.
Dispatchable energy technology comparison.
After considering and synthesising the literature, we chose green hydrogen storage. Research on green hydrogen overseas is extensive. One example is wind-driven hydrogen research in Norway, which argues for integrating hydrogen-driven transport [20]. Our research does not include hydrogen-driven transport, but this may improve the viability if this proves to be viable.
2.1. Hydrogen Technology for Energy Storage
Hydrogen systems include hydrogen production, storage, and conversion to electricity (re-electrification). There are five categories of hydrogen production technology [21]:
- Electrochemistry or electrolysis uses electricity to split water into hydrogen and oxygen [21], and alkaline electrolysers (AE) and proton exchange membrane (PEM) electrolysers are the only commercially available technologies;
- Thermochemical steam methane reforms (SMR) with and without carbon capture;
- Coal or biomass gasification or pyrolysis;
- Biological production;
- Emerging technologies.
Hydrogen storage can be achieved in large quantities and for extended periods. Hydrogen can fill the energy storage void currently experienced in the energy market [22,23]. Hydrogen storage can be realized through liquefication, pressurisation, absorption, or chemical form [22].
Energy stored in hydrogen can be converted back to electricity (re-electrification). This re-electrification can be accomplished with a gas turbine [24] or fuel cells. The fuel cell process is a reversed electrolysis [23], boasting high efficiency, emission-free power generation, and fast start-up and shutdown capabilities.
2.2. Hydrogen Implementation in Australia
Australia is one of the leading countries in adopting hydrogen, with up to nine proposed large-scale projects totalling a capacity of 1496 ktpa—more than any other region globally. KPMG has developed the H2 City assessment tool to model hydrogen implementation within communities across Australia [25]. The tool enables potential investors and communities to assess the locale’s suitability and implementation methods, supplying an early screening method. Similarly, Location SA [26] has developed an interactive map displaying infrastructure locations critical to developing hydrogen production systems. This tool enables investors to evaluate the potential locations of hydrogen plants.
The literature review showed a contemporary understanding of the energy transition and its relationship with the South Australian network. The gap that this research fills is whether green hydrogen is viable in South Australia.
3. Method
3.1. Methodology
This research explores the potential integration of hydrogen within the South Australian electricity grid. This research includes many considerations and assessment criteria, limiting the accuracy of any potential modelling given the copious quantities of input parameters needed, meaning that significant adjustments must be made before the model is appropriate for the South Australian context. Many models are available for public use online, although these models are biased toward the developer’s interests. Further, these models were difficult to validate, resulting in difficulty in critically analysing the results.
Therefore, we developed a new model to assess the hypothesis appropriately. Our modelling uses technical and financial assessments from a private entity’s perspective, which would be most beneficial, given the opportunity to capitalise on electricity’s unreliability in the state. Hence, we developed a model to determine key investment factors using industry research.
This report hypothesises that using an electrolyser to generate significant quantities of storable hydrogen will allow re-electrification as the network requires. Therefore, South Australia’s electricity network’s reliability is improved by harnessing the existing renewable infrastructure’s natural variability. The method for the hypothesis testing is outlined in Section 3.2.
Many methodologies are available for investigating the hydrogen hypothesis, but they require significant alterations to assess the proposed solution and are challenging to validate. We hypothesise that we can reduce electricity prices and stabilise the South Australian grid using a hydrogen electrolyser producing storable hydrogen, which is then burnt in a gas turbine for dispatchable electricity.
A significant limitation of this methodology is that we sought optimisation using published research and not first-hand data. We determined an optimal capacity factor as a trade-off between capital and electricity procurement costs. The chosen method assessed this trade-off by altering the assumed trigger price for purchasing electricity. The model was then manually optimised and given time and cost restrictions on the project, meaning that the fidelity of the results was limited. Operating strategy optimisation is key for the system to be financially viable for the system operator, and this validation and optimisation process would require more time and financial investment than was available to us in this research.
3.2. Method Details
Before implementing a hydrogen system, the owner would need significant research and validation. Hydrogen plants of this type are new to Australia, so a model to predict the expected learning rate, which will help determine the investment case, is needed.
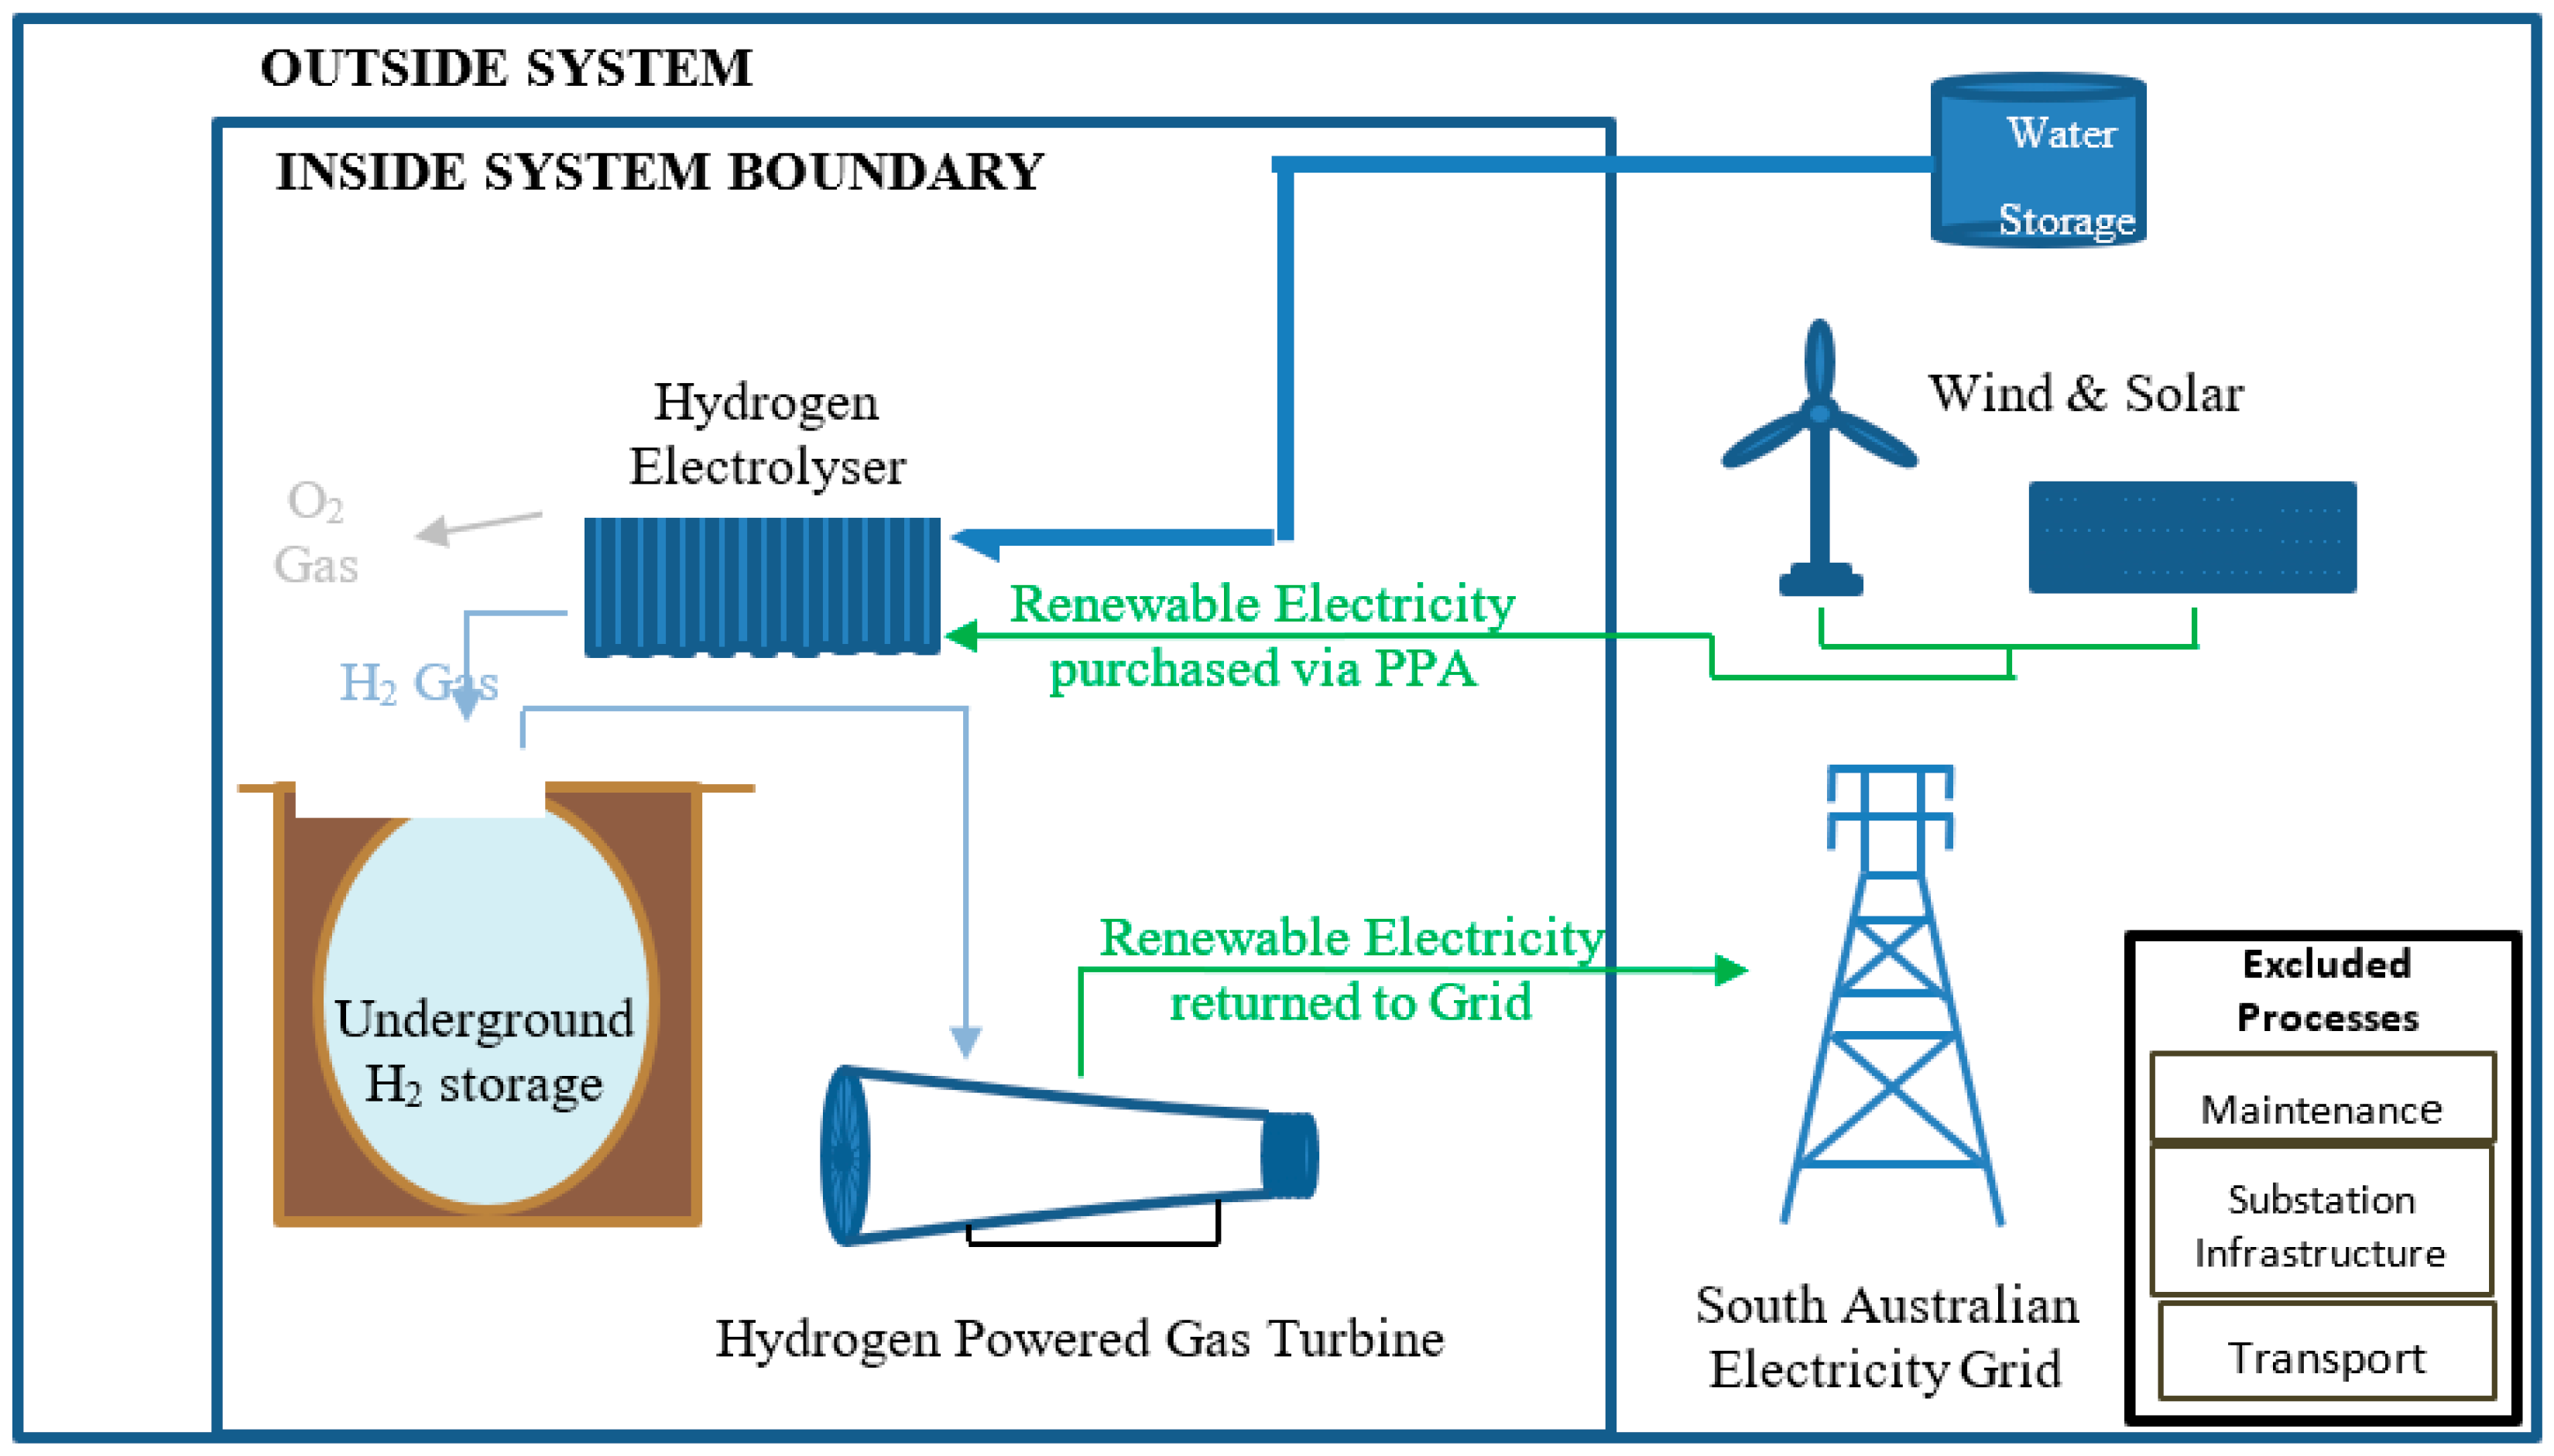
Figure 1 shows the proposed hydrogen system to help improve the reliability of South Australia’s electricity network. The significant capital investment includes the hydrogen electrolyser and a gas turbine that runs on 100% hydrogen gas.
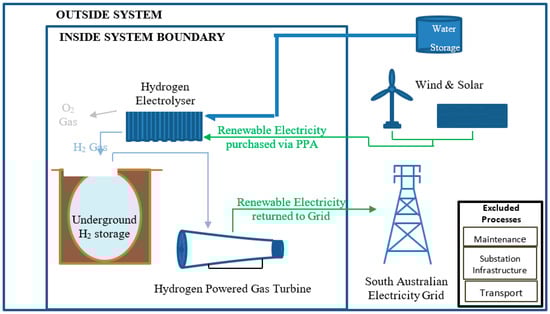
Figure 1.
Proposed system of green hydrogen in South Australia.
Figure 1 defines the system boundary of the hydrogen hypothesis. At the beginning of the system, renewable electricity is sourced from South Australia’s existing renewable infrastructure, including wind and solar farms. This electricity is then purchased through a renewable power purchase agreement (PPA) when the spot price drops below $A50/MWh and it is used to power a PEM Electrolyser, which produces hydrogen in conjunction with water at an efficiency of 51%. This equipment is modelled with a lifetime of 20 years [23]. This hydrogen is stored in underground storage. It will remain stored until the spot price for electricity reaches $A240/MWh. The re-electrification process occurs through a gas turbine with an assumed lifetime of 25 years [23], thus creating green electricity. This electricity is then distributed back into the South Australian grid, representing the end boundary of the system in this research.
Further, the electrolyser’s fast ramp rate for hydrogen generation allows the system to take electricity out of the grid when its frequency exceeds the regional standard. Conversely, when the grid frequency is below the regional standard, the re-electrification peaking system’s fast ramp rate can distribute electricity back into the grid, bolstering the supply’s overall stability.
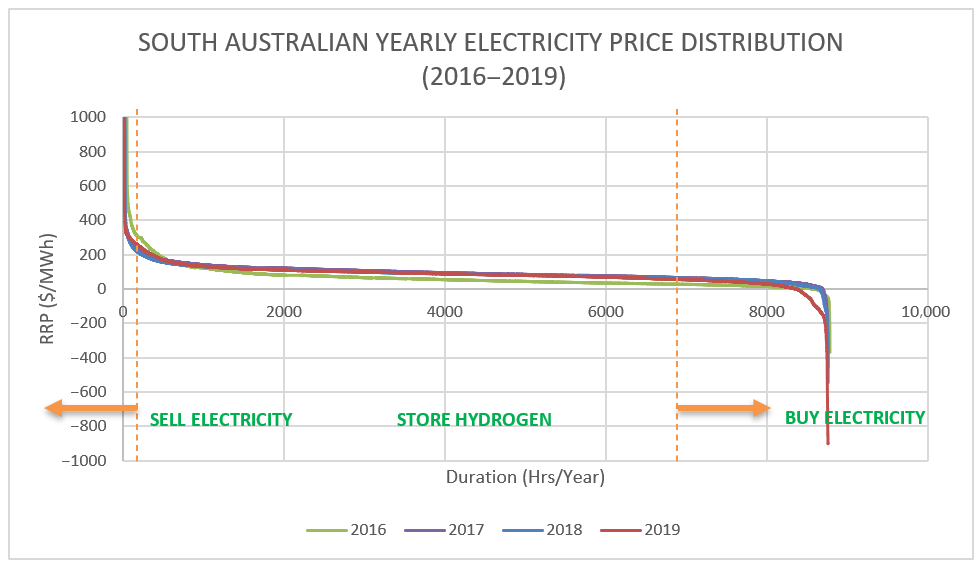
Statistical supply and demand modelling was used to predict the state’s energy requirements and assessed the hydrogen system’s effect on the energy deficit while verifying the financial viability. The modelling used South Australian 30 min aggregated historical price and demand data for the calendar years 2016–2019 to forecast the levels of hydrogen that the system could generate, store, and re-electrify [27]. The modelling found the intense volatility of the cost of electricity, which, when coupled with storage mechanisms, highlighted an opportunity to use arbitrage methods to generate revenue. Figure 2 emphasises the operating technique to realise this strategy, indicating when electricity is purchased, stored, and sold. Figure 2 highlights that the system purchases electricity for 1900 h per year and sells only 200 h yearly, complemented by long storage periods.
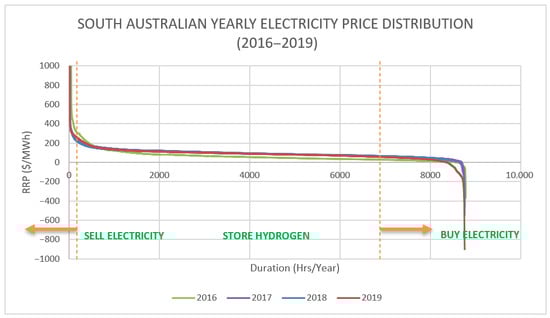
Figure 2.
South Australian electricity price distribution (2016–2019).
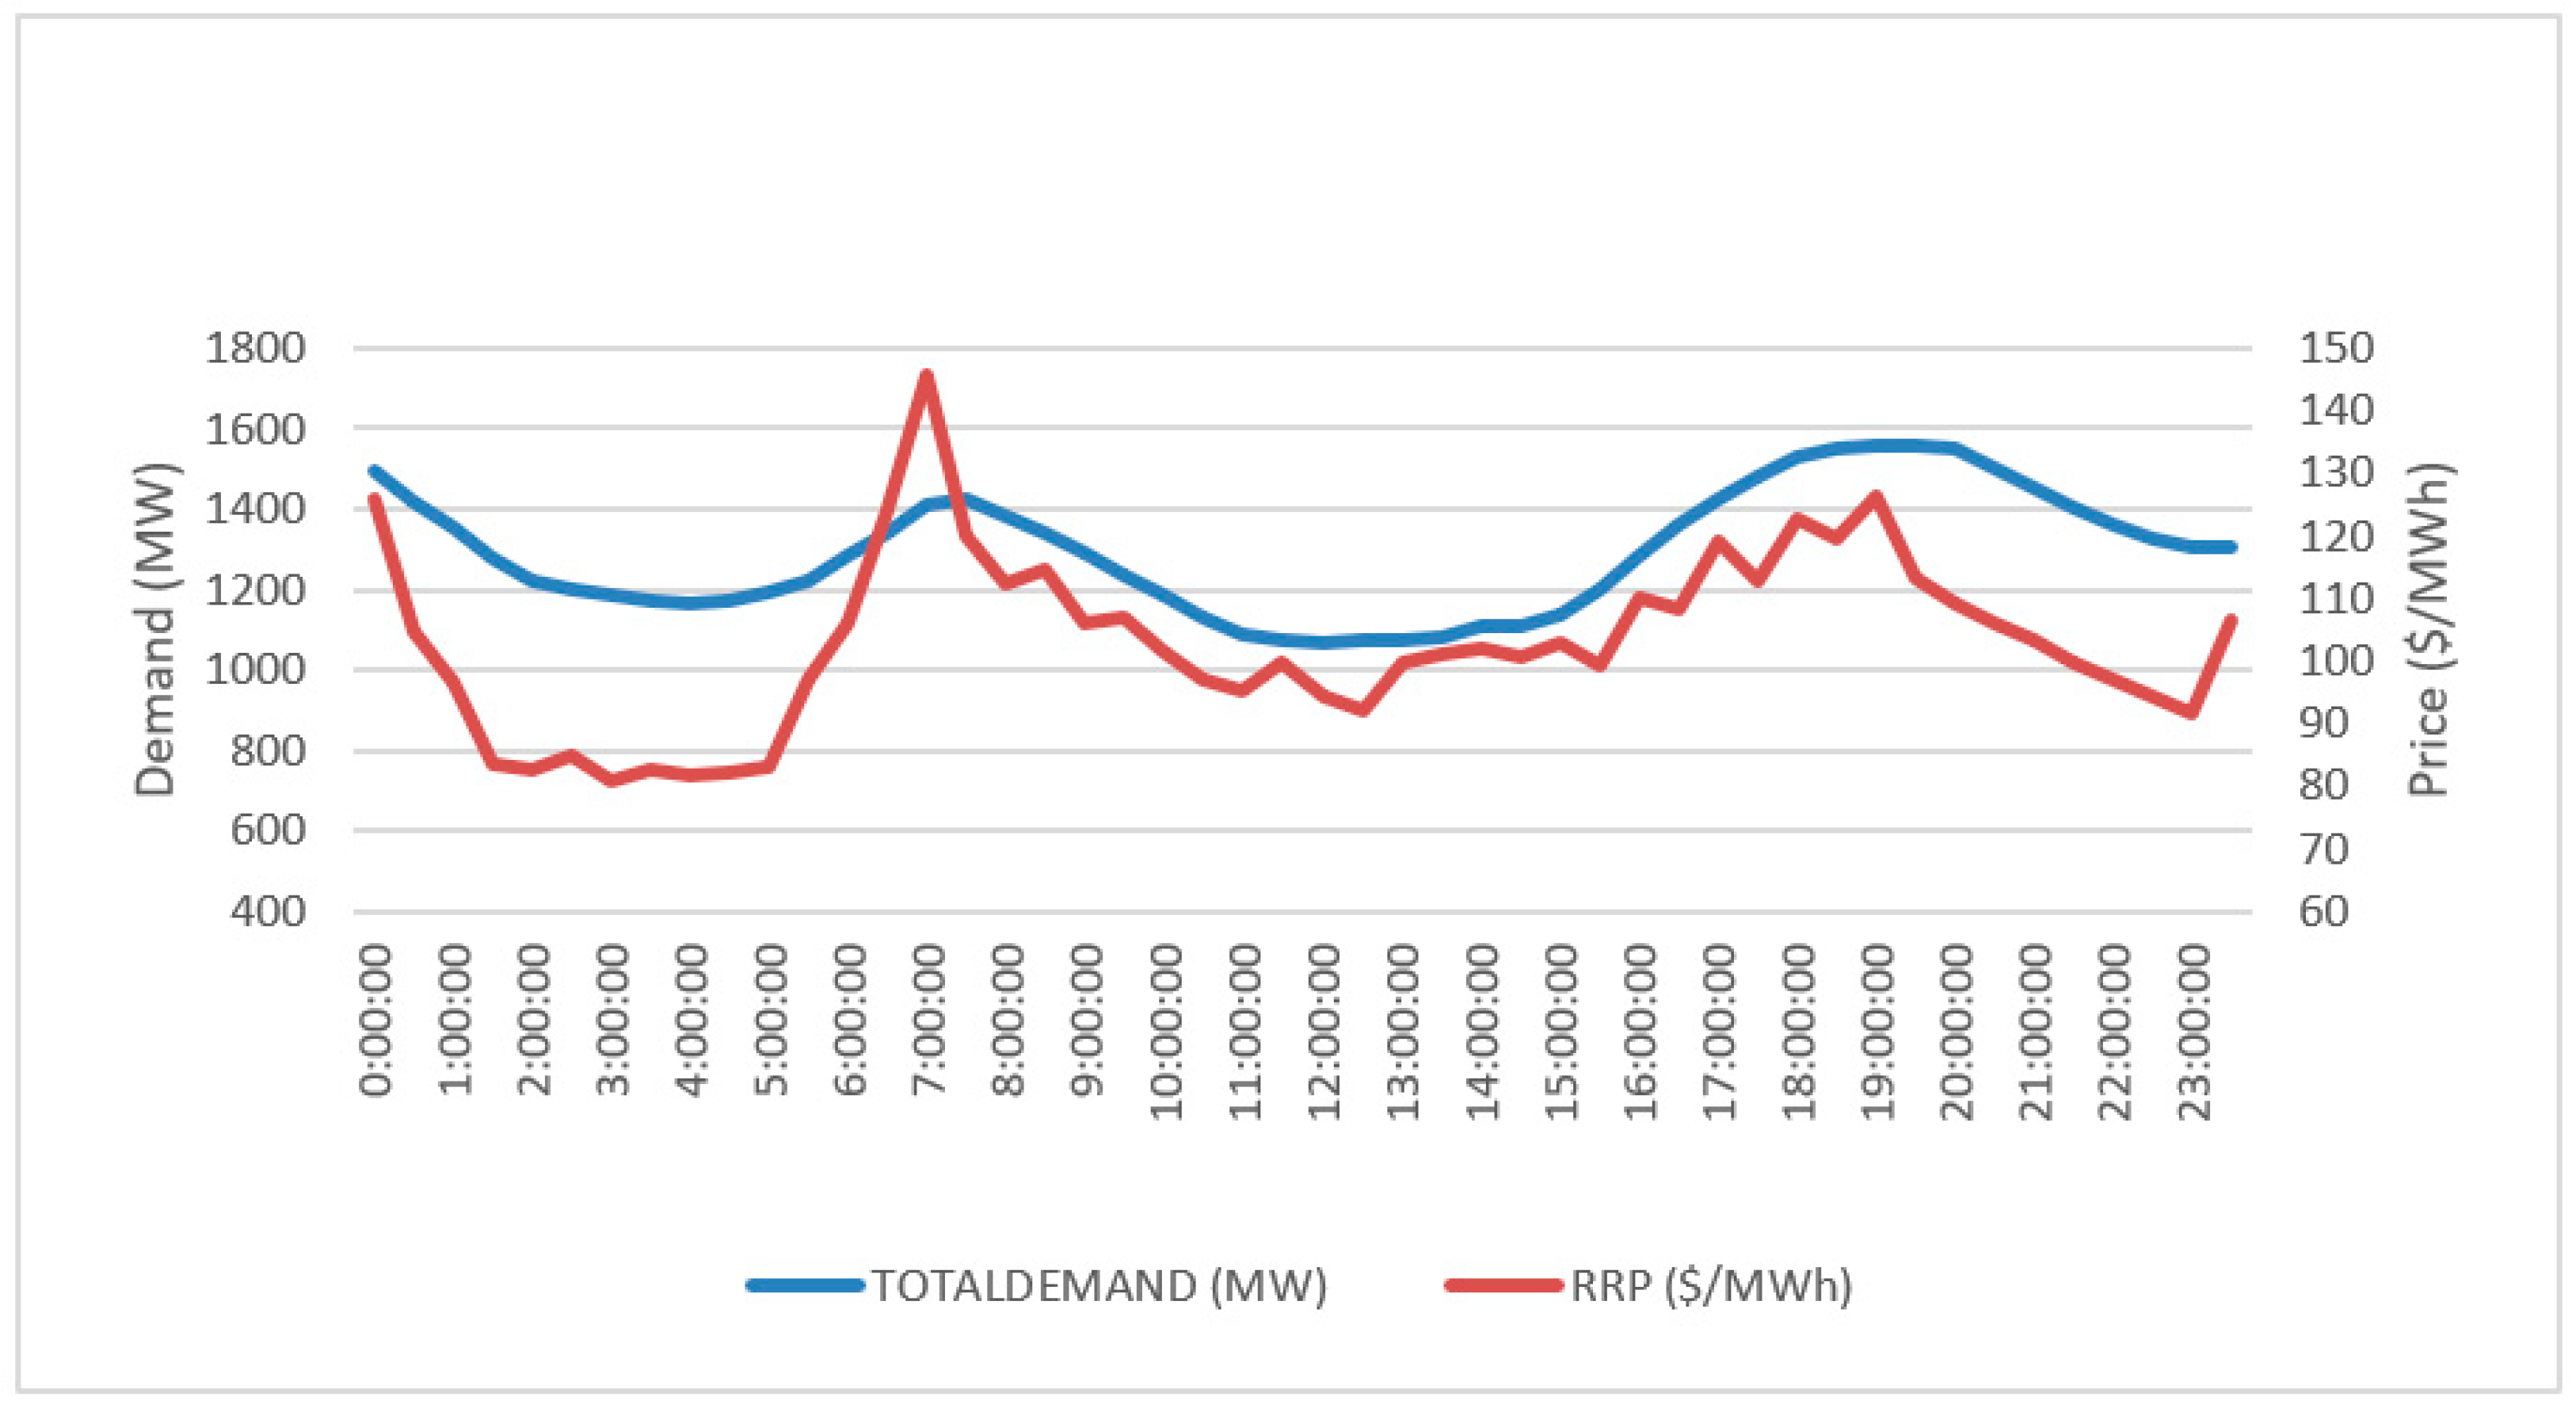
Electricity would be bought during the day when the electricity demand is low (and the electricity spot price is low), as shown in Figure 3. The phenomenon shown in Figure 3 is due to surplus PV electricity during the day, leading to low electricity prices. We assume that this hydrogen plant has a minimal effect on electricity prices, and this minimal effect was not included in our method.
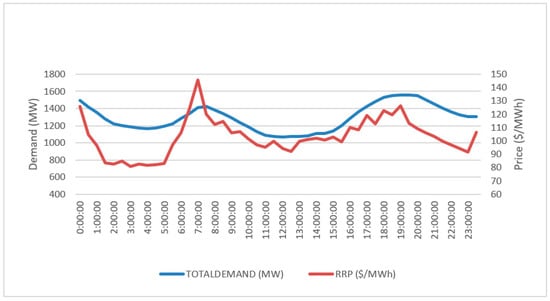
Figure 3.
Average intraday electricity price and demand fluctuations (Duck Curve).
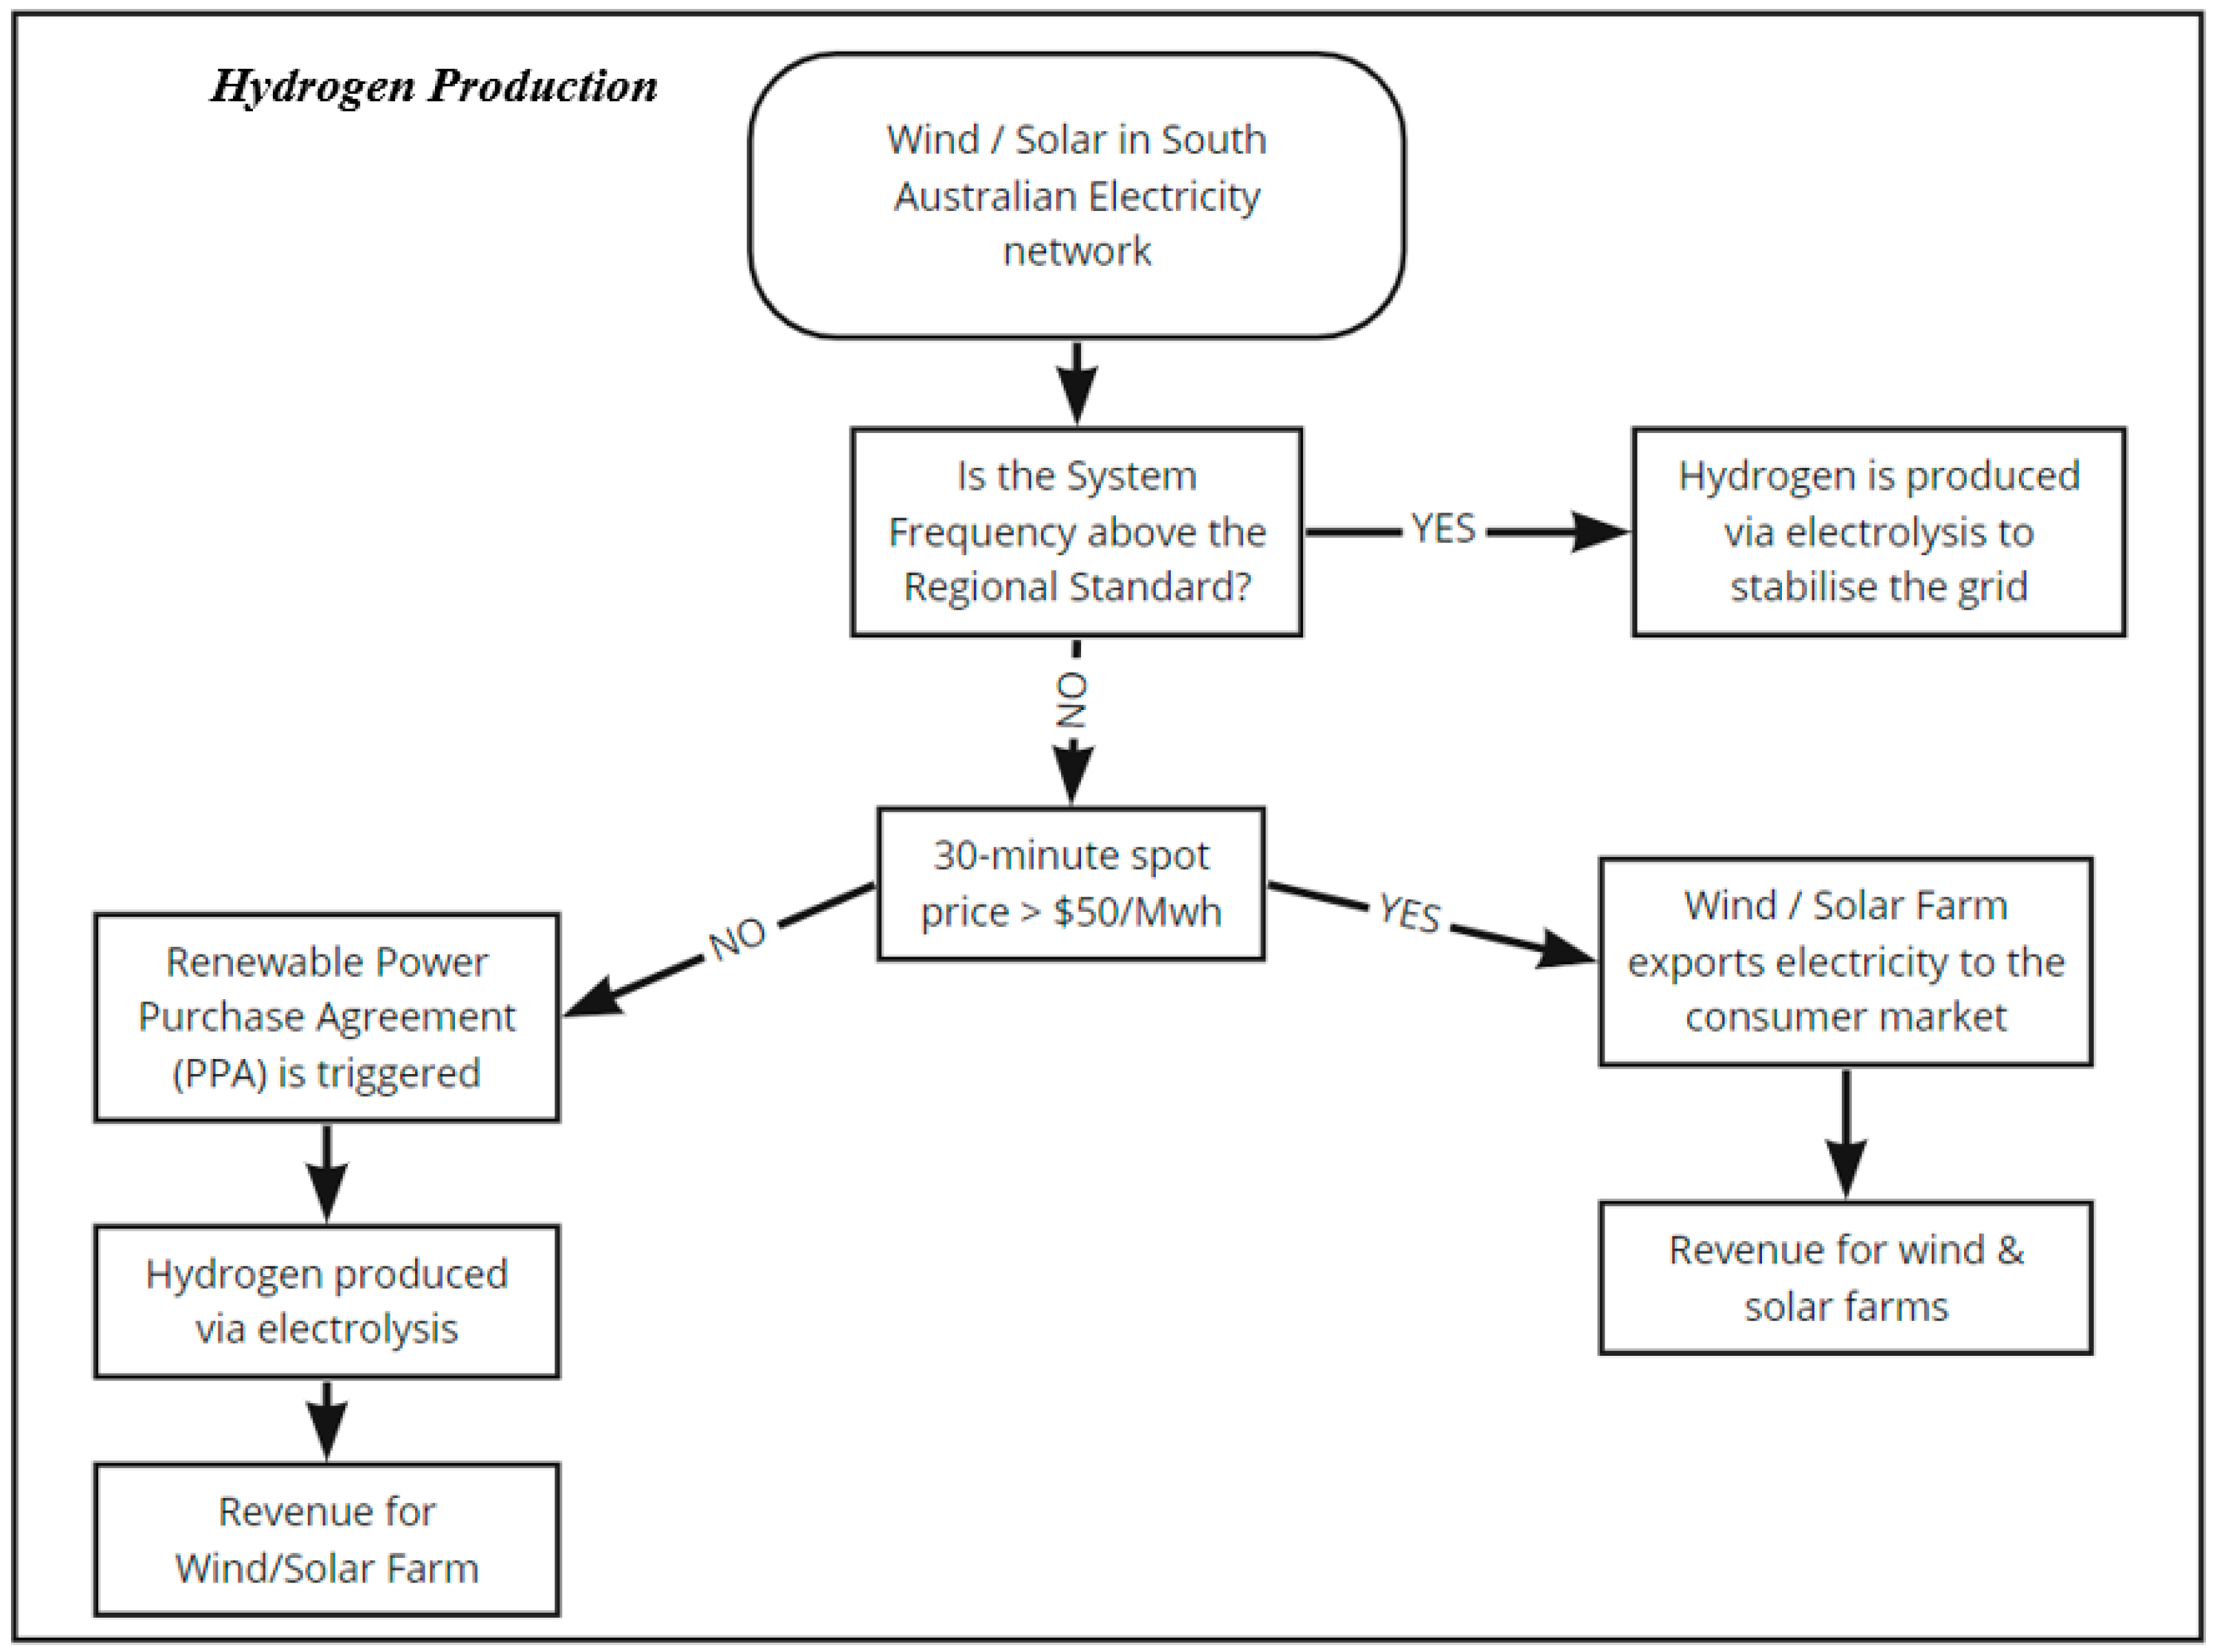
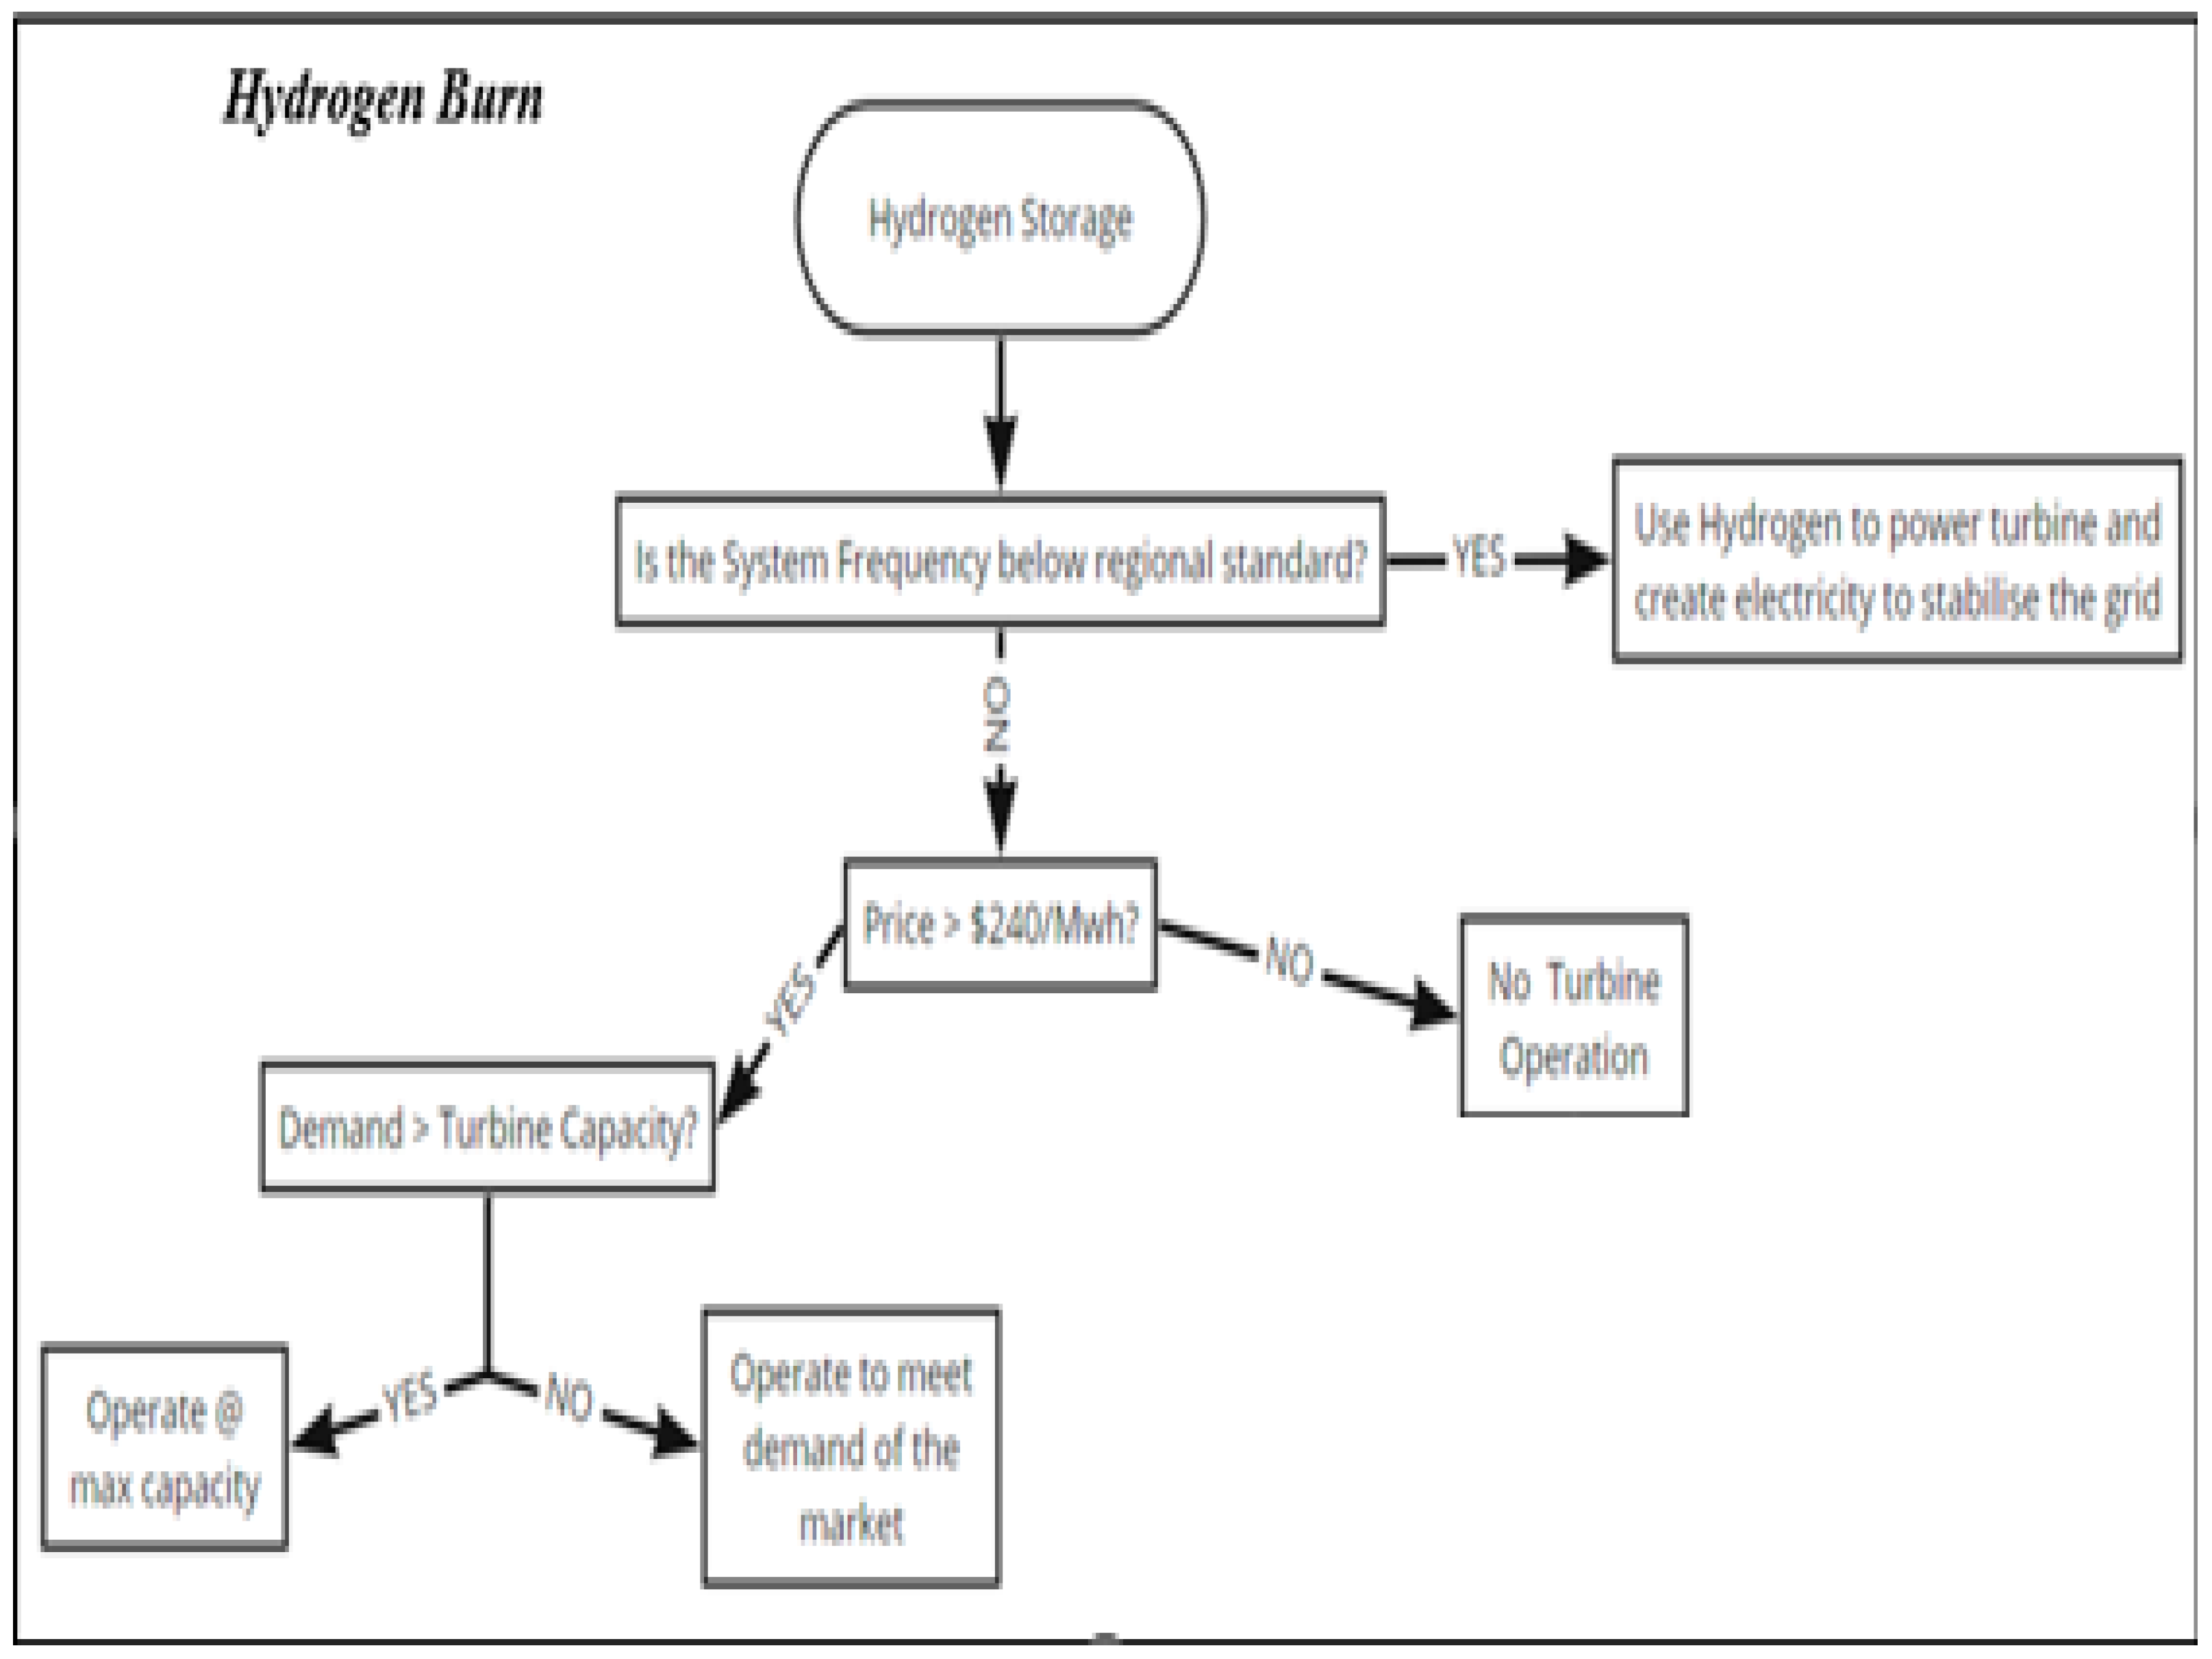
Figure 4 and Figure 5 show the system’s operating strategy. Figure 4 shows when hydrogen is produced, and Figure 5 shows when hydrogen will be burnt to power the gas turbine and generate dispatchable electricity for the South Australian grid.
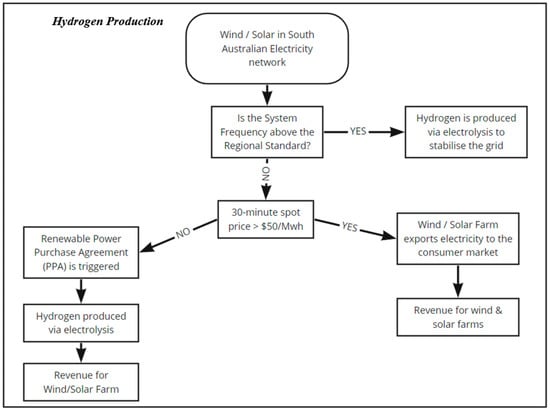
Figure 4.
Hydrogen production flow chart.
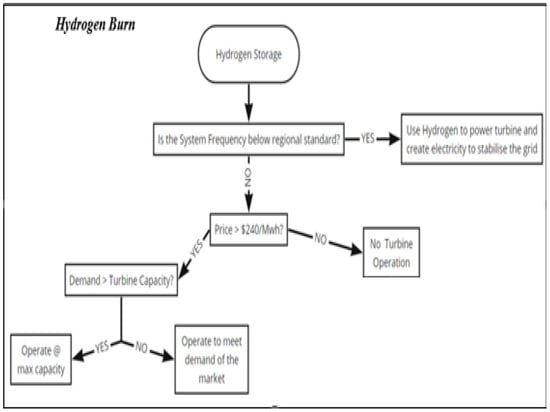
Figure 5.
Hydrogen burning flow chart.
The developed model allows a threshold electricity spot-price input at $A50/MWh. The electrolyser will run and produce storable hydrogen when the spot price lies below this point. Prices below this are during low demands for and surpluses of renewable energy; conversely, prices above this are typical when there is high demand and the supply of renewable energy meets the demand [28]. A renewable PPA provides favourable benefits to renewable energy developers who require a PPA to reduce their risk of losing revenue opportunities due to excess supply compared to the demand. A renewable PPA is also beneficial for producing hydrogen, as electricity costs can be low and sometimes negative [29].
Likewise, the spot price to sell electricity can be input into the model, and the impact can be analysed. When electricity prices rise above the $A240/MWh on the market, the hydrogen-powered gas turbine will run at the market-required capacity.
The purpose-built model provides insight into the system’s financial viability and is coupled with finding enhancements to electricity supply reliability and price stability. A hydrogen gas turbine’s technical characteristics are utilised alongside the existing AEMO 30 min data to dynamically determine the required electrolyser size. Hydrogen flows in and out of the storage vessel (kgH2 vs. time) were modelled as though the system had been used throughout the previous four calendar years, aiming to demonstrate the feasibility of green hydrogen.
The model was created to analyse energy price fluctuations and their correspondence with the available energy supply from a financial perspective. It shows a hydrogen electrolyser’s optimal operating capacity and functioning time for maximum profit. The model also uses a series of expenditures and income assumptions to calculate the system’s Net Present Value (NPV) and derive a Levelized Cost of Electricity (LCOE), thus allowing the payback duration and system reliability to be found.
The proposed system boundary highlights the factors requiring procurement and the areas that a potential investor will control. The proposed model allows price to be input to buy electricity through a PPA and sell electricity produced through the hydrogen system. The operating strategy is key to the project’s success. This operating strategy includes several factors controlling the system’s work, including when it will produce and store hydrogen, burn hydrogen, and sell electricity. Tests of the model’s effectiveness and implications for the South Australian grid are discussed in Section 4.
The steps of this research were as follows:
- Determine a location to match the water, renewable energy supply, and connection to the electricity system.
- Evaluate costs.
- Define the operational structure and strategy.
- Conduct financial modelling for optimal system design.
- Conduct sensitivity analysis.
- Evaluate the financial implications of green hydrogen.
The results regarding the local electricity system, the market, and the regulation are discussed in the following. The system risks and opportunities, as well as model limitations, are also discussed.
4. Results
4.1. Location Assessment
Location assessment involves selecting an area supporting a hydrogen system’s needs while helping the local community. Location choice requires several key considerations—proximity to water and power infrastructure, logistical considerations relating to storage and transport, and impact on local communities.
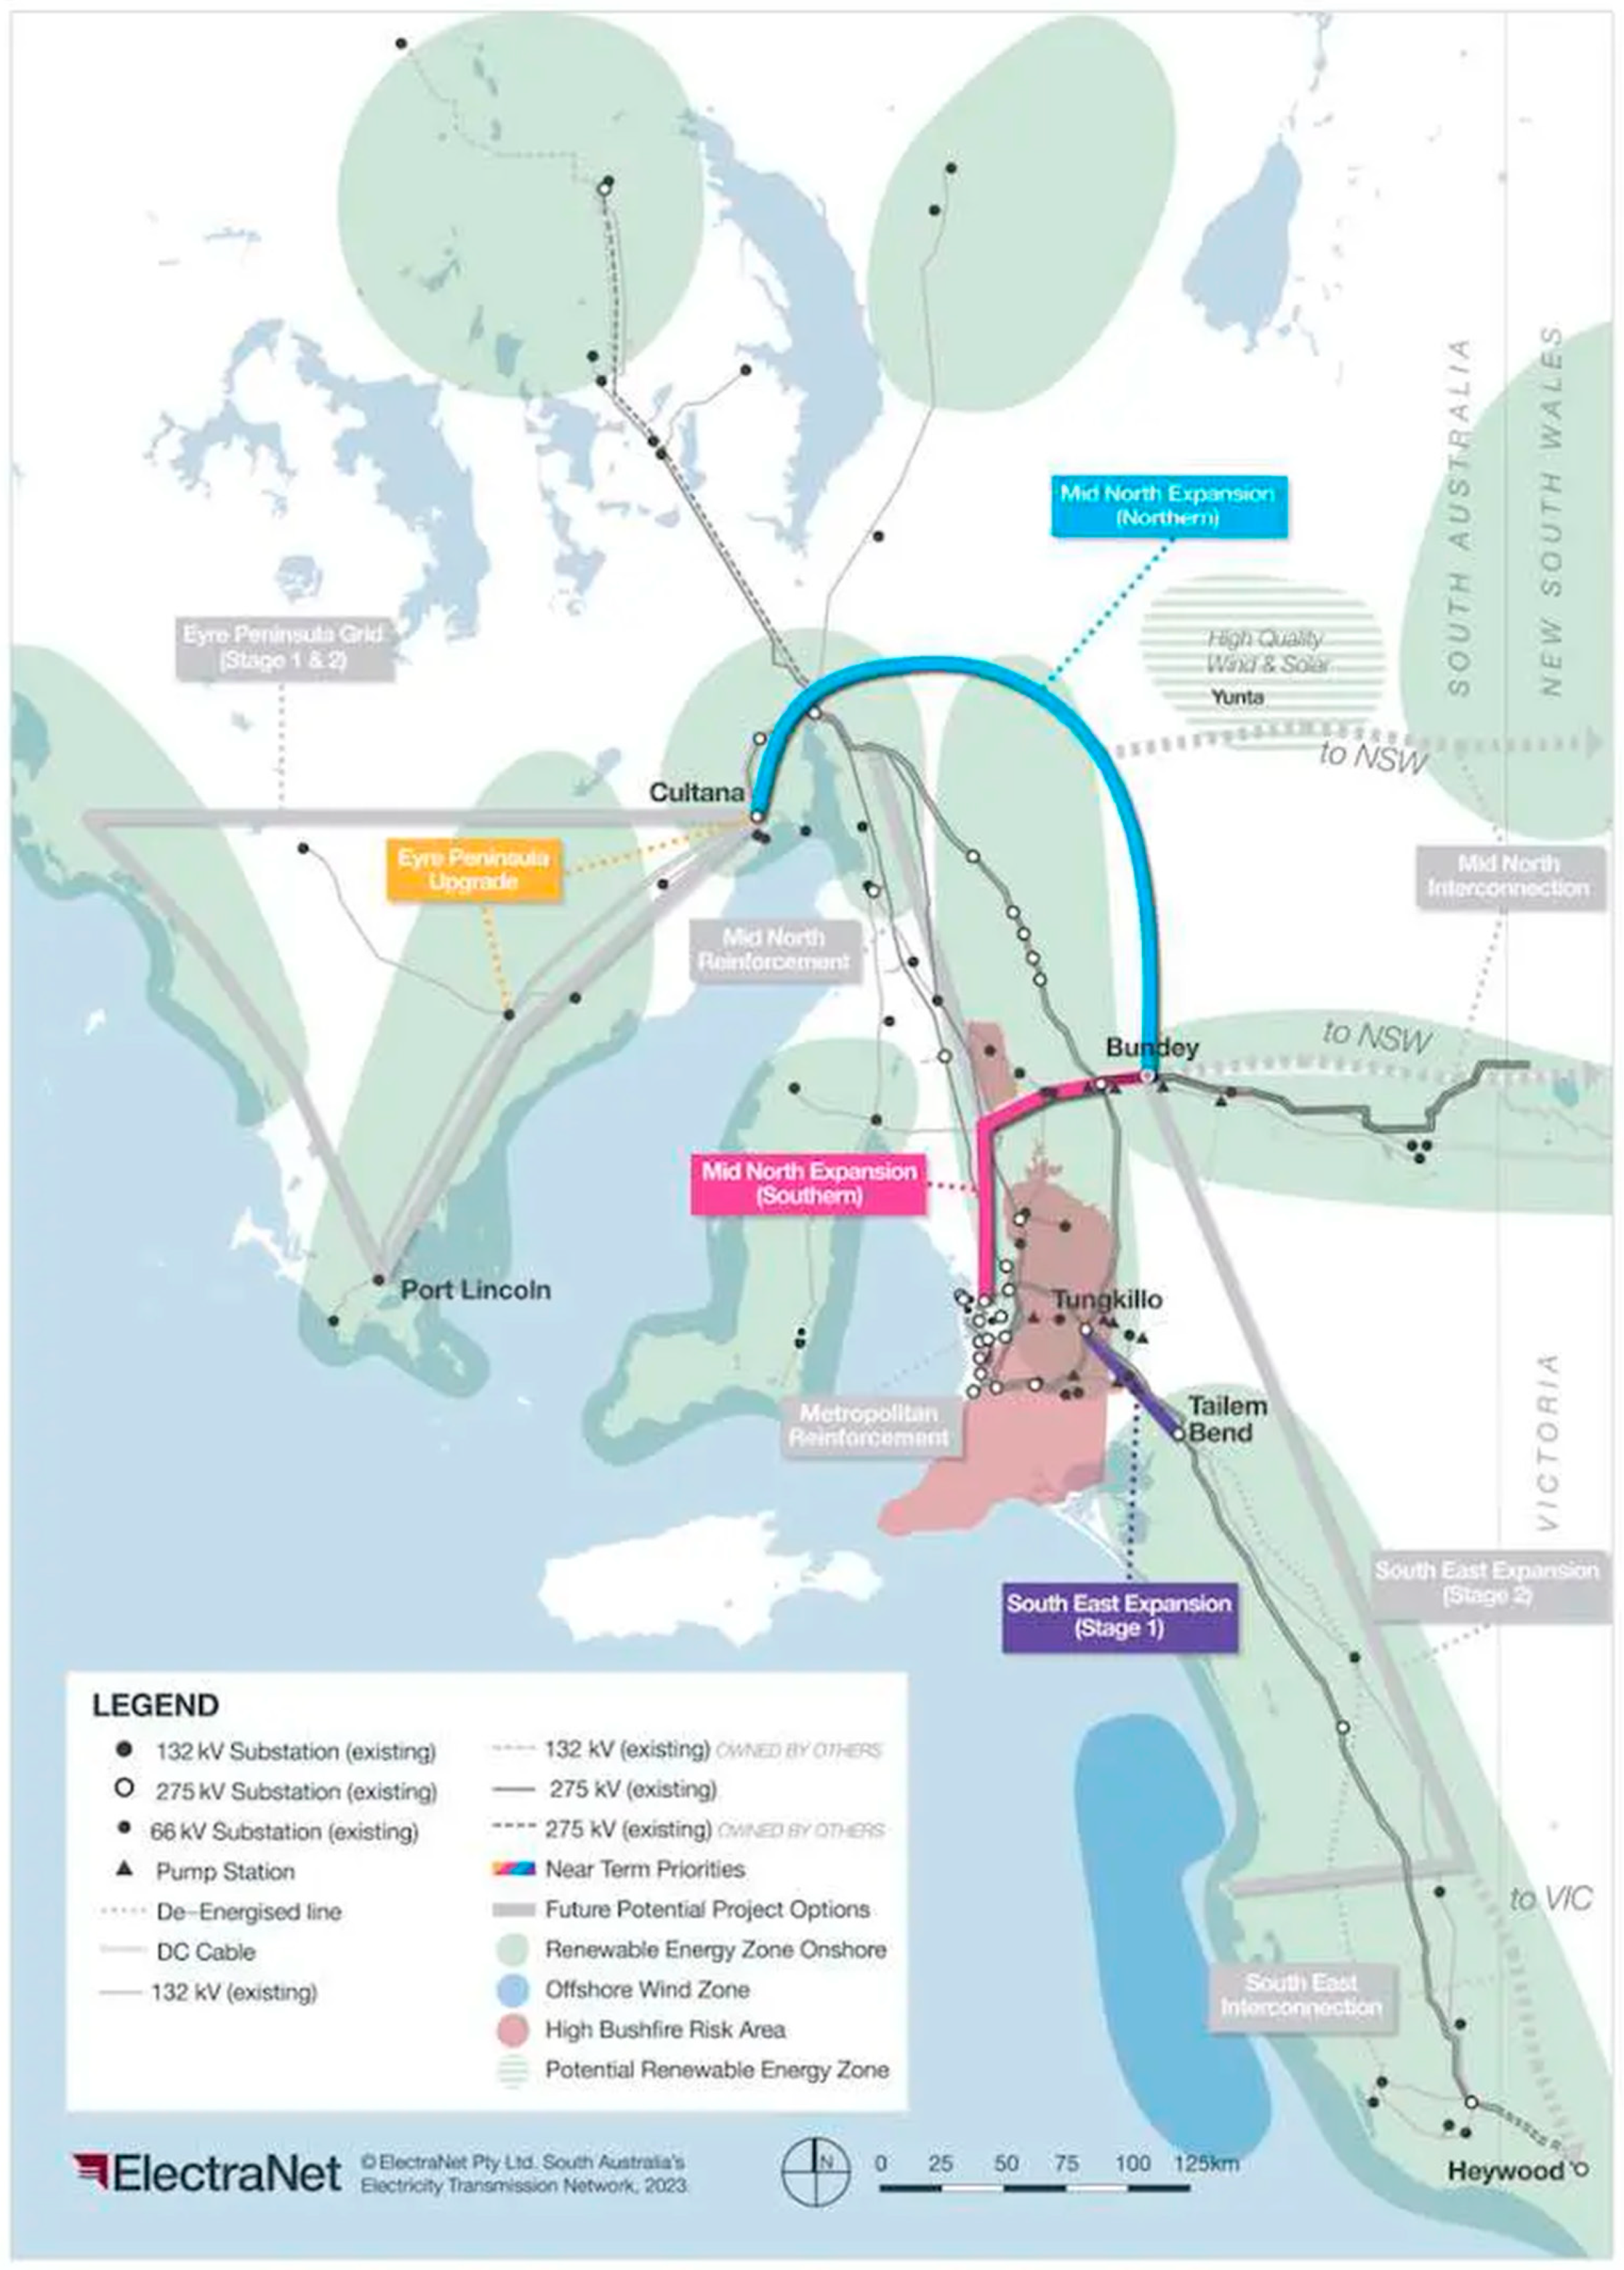
The creation of hydrogen via electrolysis requires two principal inputs—electricity and water. Figure 6 shows South Australia’s existing energy infrastructure. Our goal was to find a location with connectivity to existing infrastructure and resources to reduce capital costs; this involved assessing transmission line routes, water accessibility and connectivity with other South Australian regions. Our model used freshwater to produce hydrogen; however, technological improvements may mean hydrogen production from seawater becomes feasible. There are issues with seawater electrolysis, both practical and technical challenges, including electrode corrosion and problems with the higher conductivity of seawater [30].
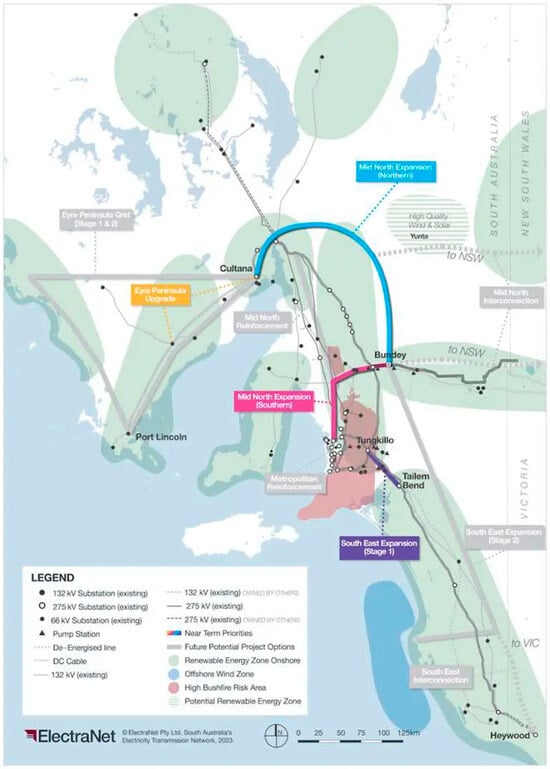
Figure 6.
South Australian network map [31].
The Port Augusta region is within a defined Renewable Energy Zone (REZ) with over 1100 MW of new-generation infrastructure proposed [32]. Port Augusta is an ideal location for large-scale hydrogen generation due to its location in a REZ, its water-main access from the Murray River, local existing energy infrastructure with several substations, and transmission lines feeding through the city (Figure 6), which would allow the hydrogen system direct access to the energy grid with connectivity between South Australia’s Eyre, upper north, and mid-north regions an opportunity to source renewable energy from local energy generation such as the planned 252 MW Lincoln Gap Wind Farm Stage 2 [33] and 375 MW Port Augusta Renewable Energy Park DP Energy [34], and the existing 126 MW Lincoln Gap Stage 1 Wind Farm. Local aquifers have been nominated as the preferred option for green hydrogen storage due to fewer cost implications than a manufactured storage vessel and decreased risk of contamination compared with depleted hydrocarbon fields [35]. The South Australian Gulf, including Port Augusta, houses local aquifers of varying sizes [36]. Port Augusta has available skilled local labour due to an unemployment rate of 11.2%, partly due to the Northern Power Station closing [37].
Port Augusta on the Spencer Gulf in South Australia was chosen for its ideal characteristics to house a green hydrogen project. These include its proximity to several renewable energy sources and access to fresh water. Furthermore, the site is proximate to the distribution network, which adds to the project’s viability. Additionally, several hundred workers lost employment when the Northern Power Station closed mid-2016. By supplying an opportunity to upskill these workers, the Port Augusta region could see significant economic rejuvenation by housing a green hydrogen plant, potentially reducing unemployment.
4.2. Capital and Operating Expenses of the Hydrogen System
Factors that affect the financial viability of hydrogen technologies can be separated into the following categories: capital costs (CAPEX), operation and maintenance costs (OPEX), plant size, capacity factor, efficiency, asset life, replacement costs, technology learning curve (based on technology maturity), electricity procurement strategies, and financial parameters including risk, Weighted Average Cost of Capital (WACC), and real discount rates [21].
Hydrogen production through PEM electrolysis is the first process within the plant system boundary. PEM electrolysis inputs are water and electricity, with electricity having the highest fiscal impact. Therefore, the level of contribution depends heavily on electricity procurement methods.
Four methods of obtaining electricity for PEM electrolysis were considered: grid electricity, dedicated renewables, a renewable power purchase agreement (PPA), and curtailed renewables. Table 2 supplies a comparison of the different electricity procurement options. Table 2 also shows the Frequency Control and Ancillary Services (FCASs), which are part of the Australian electricity market [26,27].
Table 2.
Electricity procurement option comparison.
The model assumes that a PPA with a renewable energy developer will be adopted to procure electricity; this ensures that the process is green. Therefore, the modelling does not consider capital and operating costs associated with renewable energy development; we consider electricity purchase costs [38]. The renewable PPA costs fluctuate with South Australia’s 30 min aggregated historical price and demand data [27].
PEM electrolysis is well understood, and its economics and overall viability at a large scale are straightforward [39]. Residual uncertainty is reflected by the variance in the CAPEX and OPEX’s cost estimates for PEM electrolysis, as shown in Table 3.
Table 3.
Electrolyser CAPEX and OPEX are based on different plant capacities.
We assumed a relationship between the Electrolyser CAPEX and Electrolyser Size as follows:
The required electrolyser size depends on the system’s capacity and load requirements, which have been interpolated from Figure 2 in [41,42]. Thus, the required electrolyser size was calculated as follows:
The capacity factor () in energy systems is the percentage of actual output compared to an asset’s total possible output. The characteristics that impact the of an electrolyser vary significantly. However, they are primarily based on the electricity procurement strategy. Our research assumed that electricity procurement would be sourced through a renewable PPA, where electricity is bought when the spot price is below $A50/MWh. The assumption that we would use a renewable PPA at a spot price below $A50/MWh formed the basis of the electrolyser capacity factor using the following formula:
Table 4 shows the CAPEX and OPEX of the various storage technologies and indicates, from a financial perspective, that underground natural storage mechanisms are the most feasible option. However, underground storage may not be applicable for each case based on geological requirements. We modelled this article using an underground aquifer to store the hydrogen. There are aquifers in the Port Augusta area, though this would require further research (42).
Table 4.
Hydrogen storage technology CAPEX (for equipment only, not system).
Finally, hydrogen re-electrification is considered. Hydrogen-fuelled gas turbines represent an opportunity because traditional gas turbines can be moderately re-designed to run on 100% hydrogen [43]. The CAPEX and OPEX of the technology are shown in Table 5 and drawn from Table 5 in Gerwen et al.’s analysis [23].
Table 5.
Hydrogen re-electrification technology CAPEX and OPEX.
Learning curves relate production costs to accumulating experience with each new technology. Therefore, mature technologies usually have lower learning rates, while emerging technologies are subject to more considerable cost reductions. Hydrogen is the most abundant chemical globally, but hydrogen production via PEM electrolysis is novel [39]. Furthermore, associated infrastructure, including storage technologies and hydrogen-fuelled gas turbines, will likely reduce costs due to learning rates. Table 6 summarises 30-year learning rates for hydrogen technologies.
Table 6.
Expected annualised learning rates for hydrogen technology [44].
4.3. Operational Strategy and System Size
Revenue provides the only mechanism that positively impacts the NPV, so revenue is a critical input to the model. Table 2 indicates various revenue streams for the renewable PPA option, including an opportunity to participate in Frequency Control and Ancillary Services (FCASs). Therefore, the modelling includes FCASs as a secondary revenue stream and arbitrage. Arbitrage exploits the spot price difference between the cost of producing hydrogen at low electricity prices and re-electrifying at high electricity prices (Figure 2). When the system produces electricity, the arbitrage revenue in $A/MWh is calculated using Equation (4).
The Australian National Electricity Market (NEM) operates eight ancillary service markets (FCAS Revenue) and six for contingency circumstances. However, forecasting revenues from these markets is complex and highly dependent on varying circumstances. Therefore, the modelling simplifies the estimate for the FCAS Revenue by setting it as 15% of the arbitrage revenue [45] (Equation (5)).
Multiple operating strategies were tested involving trialling various price indicators for purchasing and selling electricity, and the optimal results are shown in Table 7.
Table 7.
Modelled operational strategy and system size parameters.
4.4. Financial Modelling Results
Figure 6 shows the financial modelling of the NPV over the project life, IRR, expected payback period, and LCOE.
Table 8 indicates that the system’s capital costs will decrease significantly between 2020 and 2050, with an estimated reduction of 53%. This price decrease enables the system to be financially viable. Table 8 also indicates the importance of achieving the learning rate, as shown by the NPV remaining negative for investment between 2020 and 2024. Furthermore, these estimations include degrees of uncertainty that impose risk on the modelling. A sensitivity analysis of the modelled parameters assessed the level of risk, and the results are shown in Figure 7.
Table 8.
Financial modelling results (at a confidence interval of 90%).
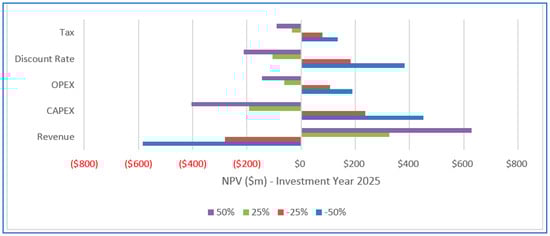
Figure 7.
Sensitivity analysis of financial parameters.
Figure 7 shows the senstivity for 50%, 25%, −25% and −50%.
4.5. Sensitivity Analysis
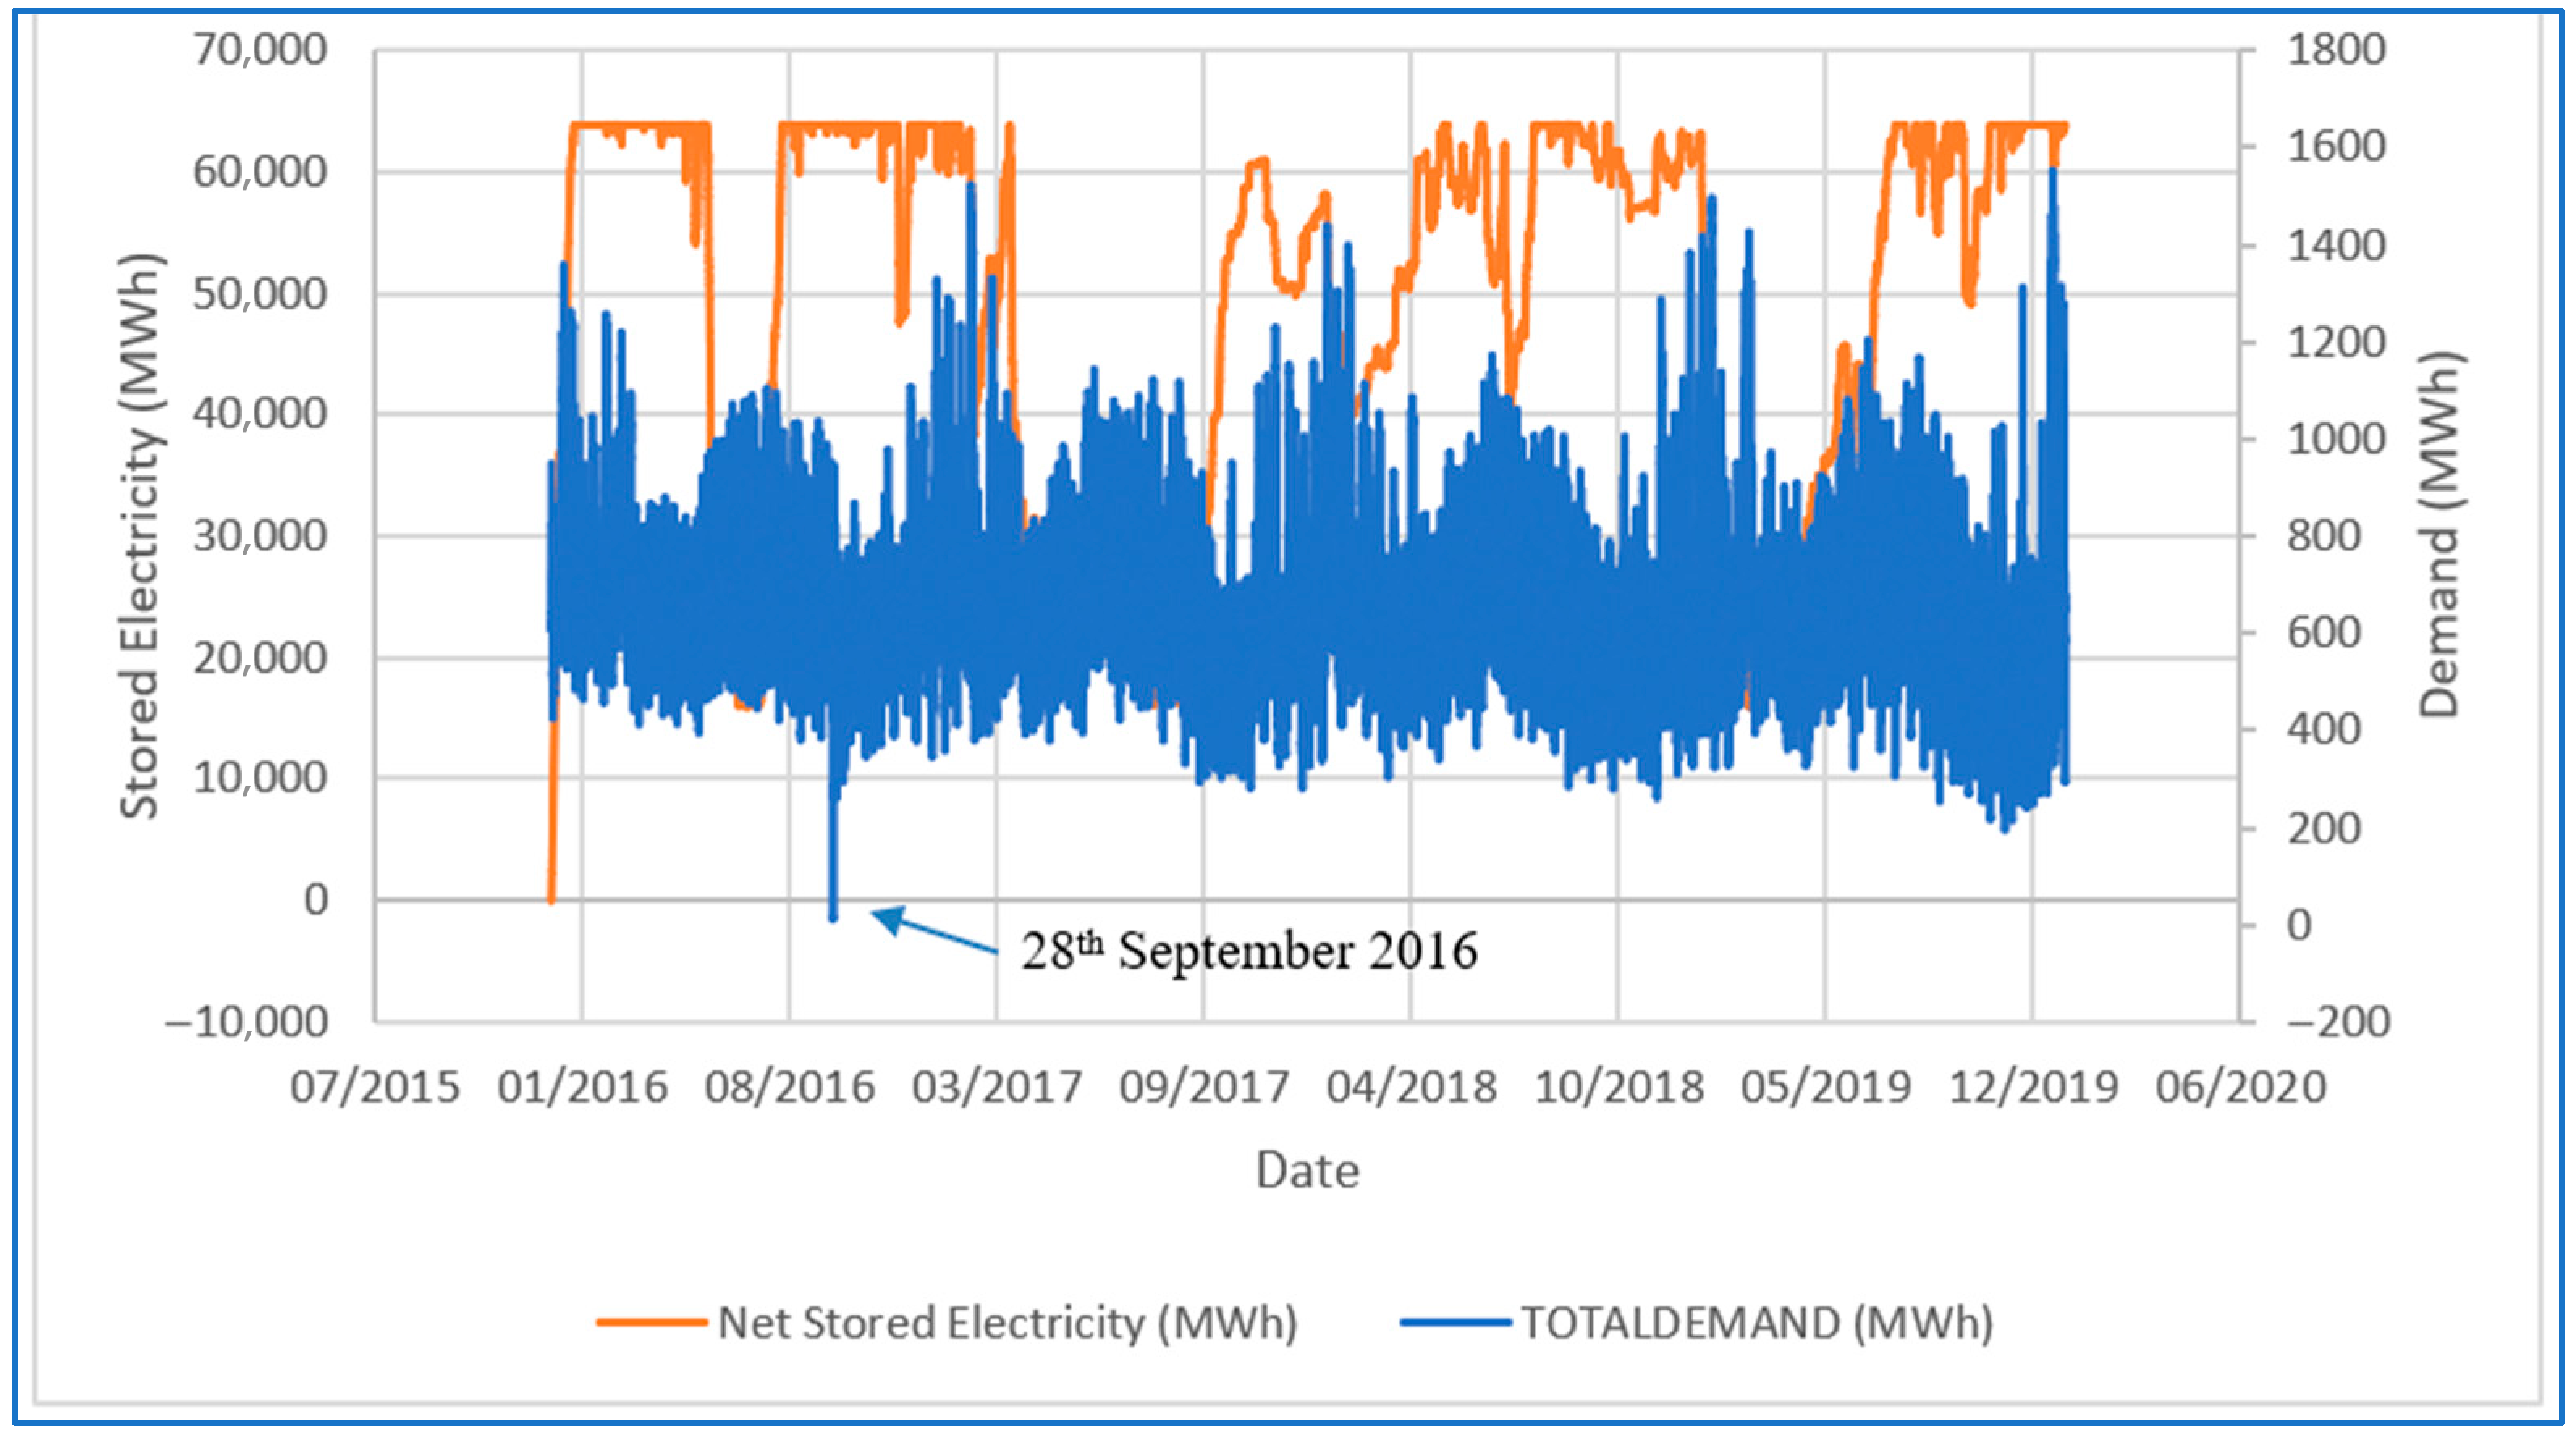
A sensitivity analysis provides insight into how financial parameters impact the system’s viability. Further research would be needed on the electrical efficiency of the electrolyser. The sensitivity analysis results, shown in Figure 8, show that alterations in revenue have the most significant impact on the NPV, followed by CAPEX. The forecast revenue is a crucial risk, and there are opportunities from other revenue streams, as discussed in Section 5.5.
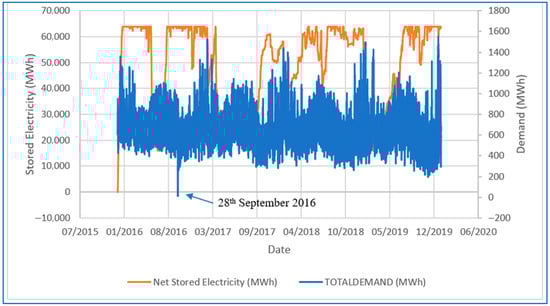
Figure 8.
Hydrogen plant electricity storage vs. South Australian demand.
The sensitivity analysis identified risks and opportunities from a financial perspective; however, private investors’ risk appetite must also be determined.
4.6. Green Hydrogen Contribution to System Quality
The modelling provided insight into how the proposed system can support the South Australian grid’s reliability during its 100% renewable energy transition [11,13,46]. The modelling focussed on meeting the objectives outlined in Section 1: stability, reliability, and price stability (leading to lower retail prices).
Grid stability refers to the resilience of the grid during unexpected events. The results show that the hydrogen system can support grid stability in multiple ways. Firstly, during periods of high renewable energy supply and low demand, the fast-start characteristic of electrolysers means that the system can rapidly use surplus renewable energy. It can then generate electricity when demand outstrips supply. Therefore, the system provides grid firming services from both supply and demand perspectives. Table 9 shows the modelled quantity of grid firming electricity that the plant uses and supplies.
Table 9.
Grid firming services provided by the hydrogen system.
The ability to harness surplus VRE is essential for energy supply stability. Green hydrogen can also be stored between seasons, leading to reliable, on-demand, green electricity.
Grid reliability means providing quality electricity to consumers on demand, which is tricky as the energy supply transitions to renewable energy. The results show that the hydrogen system can supply a seasonal storage of VRE, meaning that the electricity supply is less reliant on intermittent and uncontrollable weather sources. Figure 8 highlights the modelled usage of stored electricity compared with the demand from the South Australian grid and exemplifies the system’s ability to provide seasonal storage, as indicated by the peaks in storage occurring during Autumn and Spring. In contrast, the troughs in storage occur during Summer and Winter. The cause of this can be attributed to demand surges during Summer and Winter for cooling and heating as opposed to the milder months [47]. Furthermore, the storage capacity is 5000 tonnes of H2, equal to 63,840 MWh, enough to power South Australia for three days.
The results show that the proposed hydrogen system can potentially increase South Australia’s grid stability and reliability; however, large-scale adoption requires a decreased energy price variance.
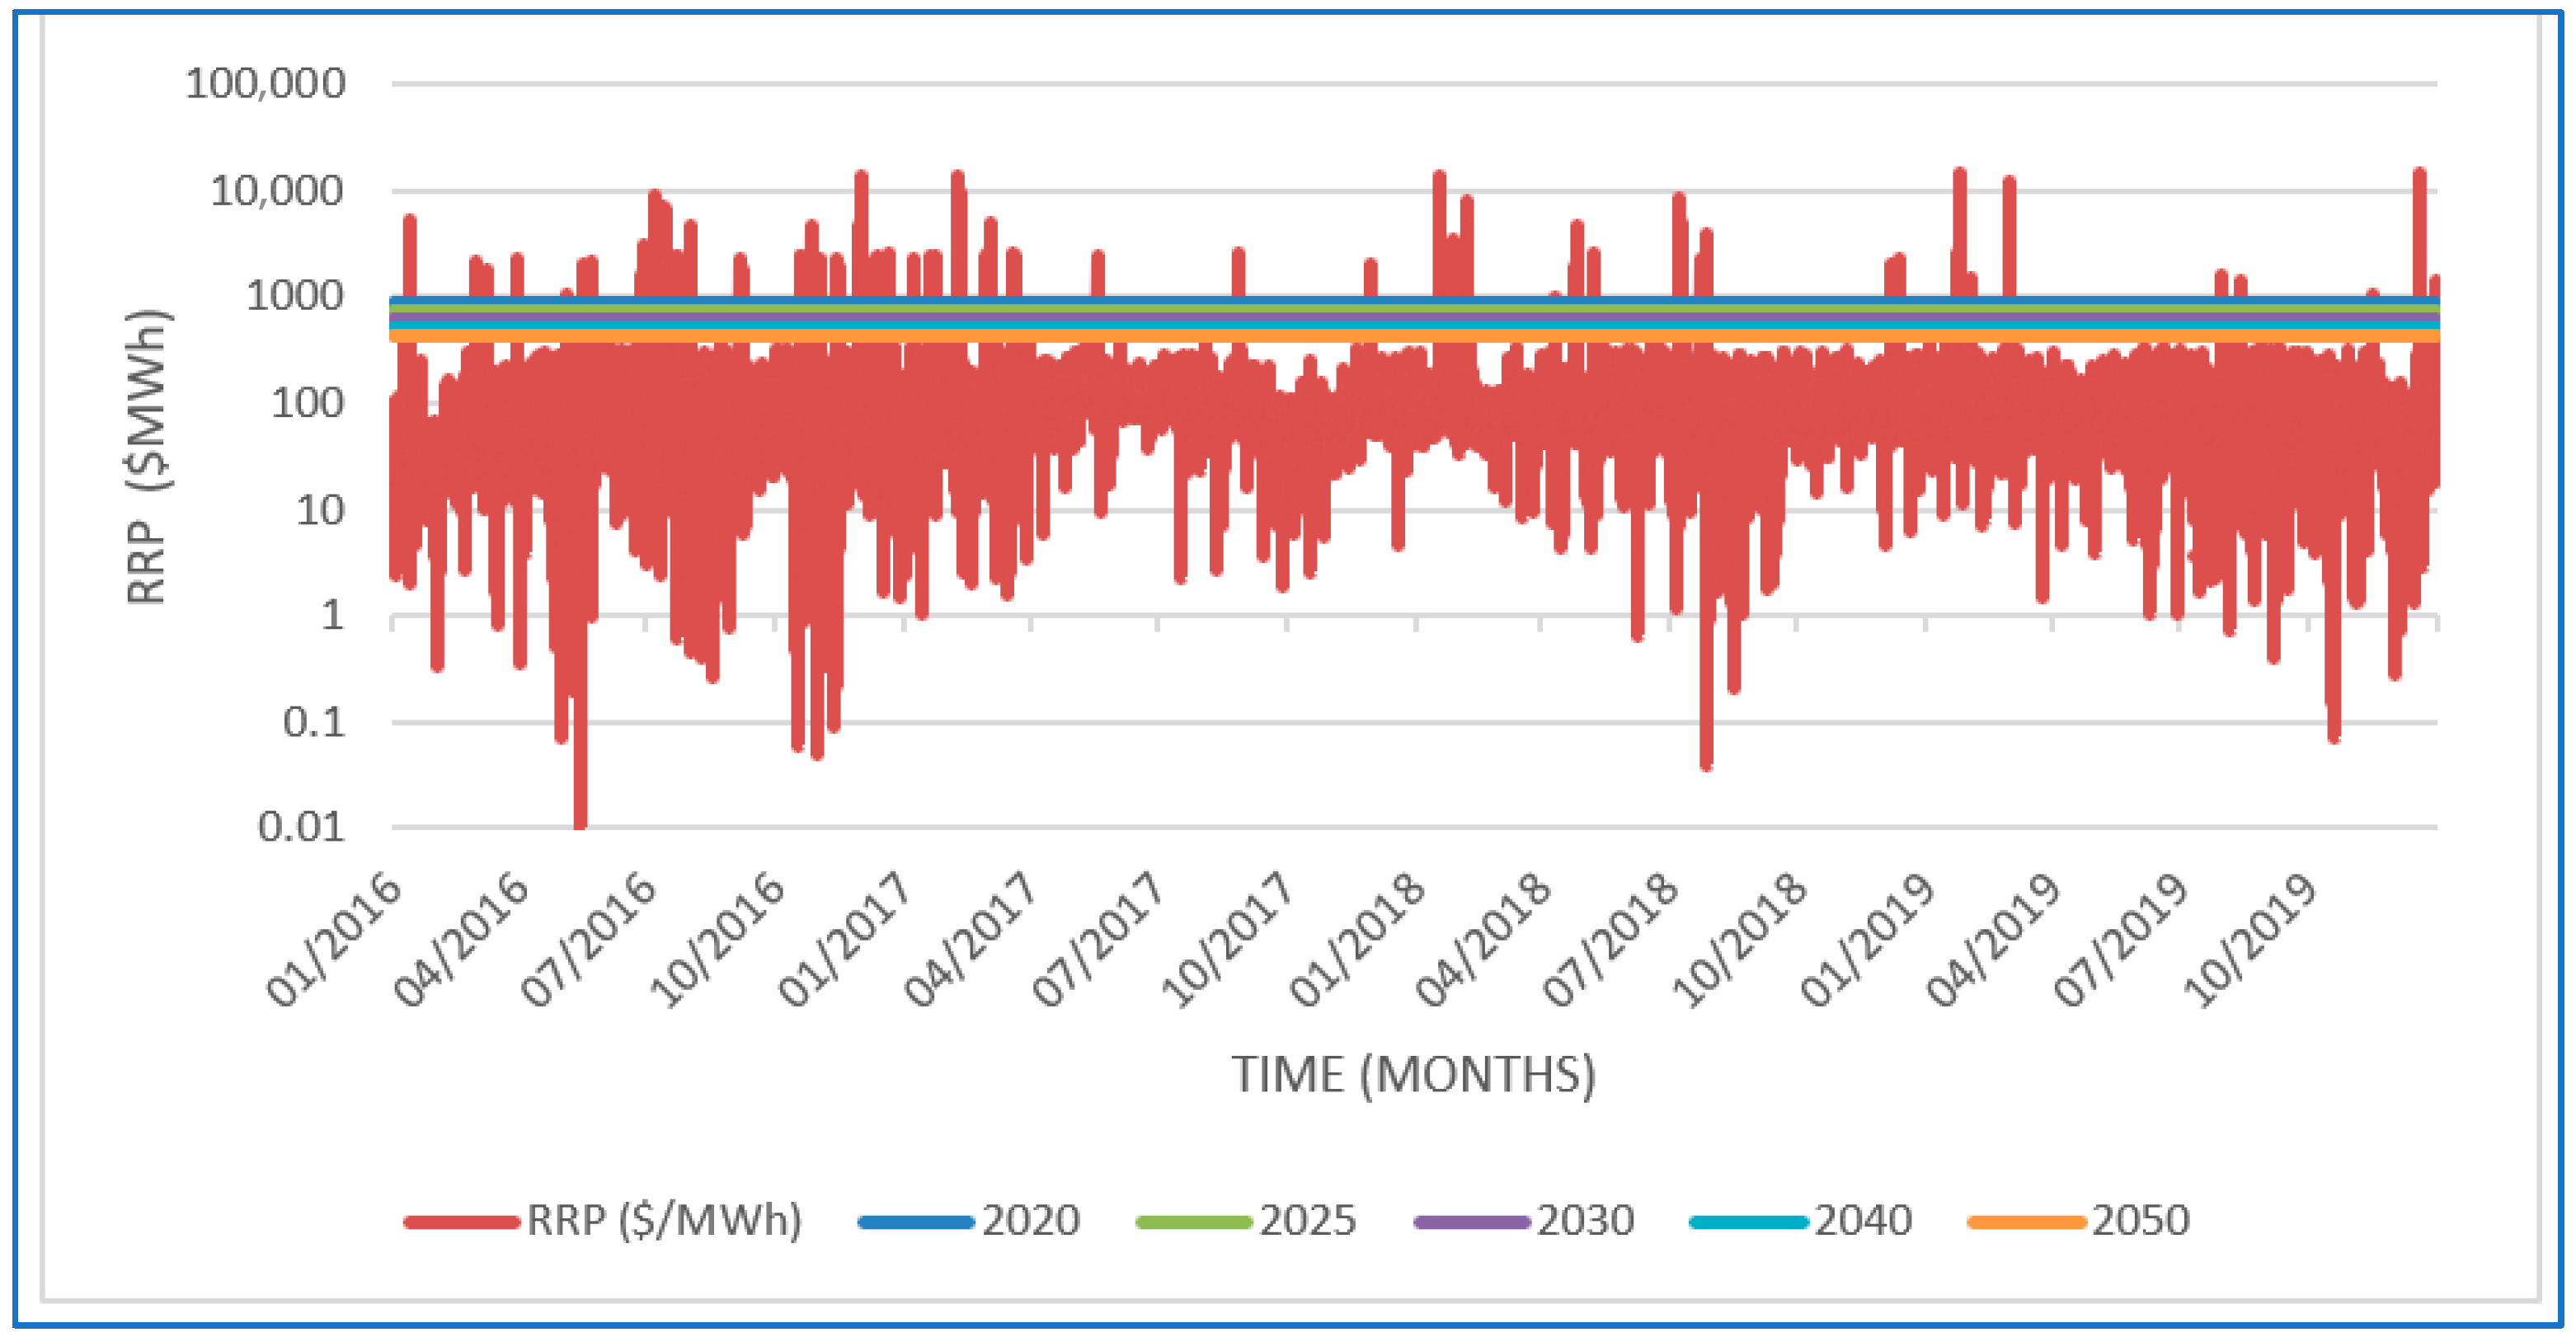
Electricity spot price stability has an impact on retail electricity prices. Energy retailers pay the spot price to procure electricity. The price dynamically reflects supply vs. demand and is highly volatile, which presents a major risk for retailers, large-scale consumers, and market participants [48]. Furthermore, the increased penetration of VRE is causing concern over price security and affordability. The modelling indicates that the hydrogen system would offer price cap guarantees to retailers and consumers who seek to mitigate spot price volatility risk. However, the average cap prices must be as per the LCOEs shown in Table 8 to be financially viable. Figure 9 shows a price cap that the hydrogen system could offer for each investment year relative to the spot price, which indicates that an investment in 2050 could viably facilitate a cap price guarantee of $A442.35/MWh, highlighting the ability to reduce variability.

Figure 9.
South Australian spot price vs. potential price cap guarantee (2016–2019).
From a technical and financial perspective, our model of the hydrogen system provides a starting point for a complete analysis needed for private investors and market operators to decide on the viability of integrating the system into the South Australian energy grid.
The system’s vital technical characteristics include the dynamic and fast-start nature of the electrolyser and open-cycle hydrogen-powered turbine. These provide market benefits to supply and demand stability and ensure that the grid can remain secure during unforeseen events, including severe weather. Further, the results indicate that hydrogen’s properties enable the seasonal storage of green electricity, thus mitigating the reliance on intermittent VRE, making the energy supply more reliable, and decreasing the likelihood of unserved energy. The results show that the hydrogen system can minimise long-term spot price volatility through grid stability and reliability, providing greater security for retailers, large-scale consumers, and market participants.
The results show financial viability for investment. The key influence on the viable investment year is when capital costs decrease for hydrogen technologies, specifically electrolysers, storage mechanisms, and hydrogen-fuelled turbines. Furthermore, opportunities include other revenue streams for energy storage technologies, as revenue greatly impacts financial viability.
5. Discussion
We now discuss the requirements for the hydrogen system to become a commercial reality, the technology and regulatory requirements, a comparison against the cost, and the scales of other hydrogen projects and evaluate other options to solve the research problem, model validation, and further research recommendations.
The results reveal that the hydrogen system provides technical benefits to grid stability and reliability. However, further analysis of the technologies is needed, including a deeper understanding of hydrogen production, storage, and re-electrification technologies.
Electrochemical and thermochemical technologies are viable options for producing hydrogen, as demonstrated by each technology’s commercial availability. However, the maturity level of PEM compared with other options indicates some uncertainty about the success of large-scale implementation [49]. Furthermore, PEM electrolysers’ commercial availability remains on the Megawatt scale, which will need to increase to the Gigawatt scale for large-scale purposes to be practical [50]. This scale-up is expected to occur within five years [50], and storage mechanisms that facilitate enormous hydrogen quantities will be developed.
The results indicate that the hydrogen system can provide seasonal renewable electricity storage, enhancing the energy supply’s reliability. This ability is enabled because hydrogen has characteristics that allow it to be stored at large scales for lengthy periods and with few energy losses. Therefore, it provides an opportunity to fill the market’s energy storage void [22]. However, hydrogen storage is challenging, and the available technologies vary significantly. Four categories of hydrogen storage options—based on the elements’ physical form—are liquefied, pressurised, absorbed, and chemical. Due to PEM electrolysis producing hydrogen in gaseous form, pressurised storage is the preferred option; however, liquefied alternatives are also viable [23]. Absorbed and chemical storage technologies were not considered in this study due to their nacent technical feasibility.
Pressurised underground natural storage mechanisms such as salt caverns, depleted gas fields, and aquifers are the most suitable storage options for large-scale hydrogen storage. Furthermore, they benefit from low construction costs, low leakage rates, fast withdrawal and injection rates, low cushion gas requirements, and a low risk of hydrogen contamination [51]. However, these technologies are constrained, requiring favourable geological conditions [51].
Our modelling assumed that an underground aquifer will be used for hydrogen storage. Although underground aquifers exist in the Port Augusta region, their viability for hydrogen storage was not determined as this would require geological exploration. Therefore, private investors and developers must investigate local storage conditions before commercialisation to ensure that the system is technically feasible.
Hydrogen re-electrification provides dispatchable green energy to the market. This process will generate the most revenue for the system. This electricity can be sold back into the retail market using arbitrage methods during periods of low supply, high demand, and high prices [52]. Like hydrogen-producing technologies, electricity-generation technologies are commercially available but require upscaling to support the hydrogen system.
Traditional gas turbines can be moderately re-designed to allow electricity generation from hydrogen [24]. Open-cycle turbines can ramp faster than closed-cycle systems. Fast ramping is desirable for peaking systems, so the modelling assumed an open-cycle turbine to re-electrify the stored hydrogen.
Hydrogen production requires careful consideration beyond just the CAPEX and OPEX of the technology used to create it. Key considerations in individual project viability include location selection for the CCS and hydrogen storage, transportation methodology, and re-electrified hydrogen distribution. In principle, brown, grey, and blue hydrogen plants operate most effectively near depleted oil and gas fields, where CO2 can be captured and stored, ensuring that production aligns with global emission targets. In using these underground storage vessels for CCS, the opportunity for hydrogen storage is lost, and alternative methods, including fabricated storage vessels, become a requirement for mass production. Similarly, green hydrogen production via electrolysis requires a location with access to aquifers for a more financially viable option. The plant would also be positioned near freshwater reserves and fed energy through a dedicated wind or solar plant. Hydrogen re-electrification should also happen near the energy grid for optimal energy efficiency, particularly if hydrogen is created for domestic end use.
With an increasing focus on hydrogen as a long-term energy alternative, Australia is ‘resource-rich’. It appears wise to adopt hydrogen production as a long-term energy source. Green hydrogen technology is the best option in transitioning from fossil fuels to renewable energy because it provides a stable, reliable alternative to the weather-reliant wind and solar farms currently adopted throughout South Australia.
5.1. Improving South Australia’s Grid Reliability
The model aimed to research and evaluate methods for enabling a safe, reliable, and affordable transition to 100% renewable energy in South Australia. The variability of wind and solar generation and their inability to efficiently store this form of electricity results in lost generated electricity. If we use a hydrogen electrolyser to convert this surplus renewable electrical energy into a storable gaseous form, this loss will not occur. Therefore, all three points of the trilemma are addressed.
While the system’s LCOE is too high in the immediate future, the CAPEX of adolescent hydrogen technology will reduce significantly in the coming decades. As discussed in Section 4, this decrease in capital cost will ultimately result in a positive system NPV, meaning that the LCOE will continue to fall as research and technology development progresses. Policy reform and government expenditure can carry hydrogen into the mainstream energy market and reduce this LCOE to the point where it is financially viable. In the short term, the system can allow private entities to invest and generate revenue through consumer and FCAS markets. A guaranteed maximum price of $A442.35/MWh is workable if the investment is made in 2050.
Energy system security defines a power system that can operate within defined technical limits, such as voltage and frequency, and withstand faults, even if an incident such as the loss of a major transmission line or large generator occurs [53,54]. As shown in Figure 8, the hydrogen system could have mitigated the blackout event on 28 September 2016. This blackout event was caused by issues with the interconnector during a storm and shut down after a frequency fluctuation outside the system limits [55]. Had the hydrogen system been available, it would have absorbed frequency, increasing the grid’s stability.
Another element within the security envelope is energy system reliability, which defines the system’s ability to ensure the network’s capacity to supply customers with the energy they demand with high confidence [54]. As shown in Figure 8, the proposed hydrogen system improves this market aspect with a storage capacity of 64 GWh, enough to power all homes in South Australia for three days. This storage capacity supplies a substantial dispatchable resource for the energy grid, which has no reliance on uncontrollable weather conditions to generate VRE and increases grid reliability without fossil fuel support.
5.2. Market Operators and Regulators
Market operators and regulators such as the Australian Energy Market Operator (AEMO) implement strategies and standards to ensure that the grid is reliable and secure. This requirement is significant for enabling the transition to 100% renewable energy. However, this transition is causing uncertainty and risk for market operators trying to provide a secure energy supply, leading to the energy trilemma, as discussed above. Our proposed hydrogen system can supply services that mitigate these risks and attract interest and favourable regulation. Such a hydrogen system would be enabled by technical characteristics that allow frequency control and energy storage systems into the grid. Our proposed hydrogen system can support South Australian market operators and regulators in pursuing reliable and green electricity.
The results highlight that the hydrogen system addresses the energy trilemma and aids market operators and regulators in the transition to 100% renewable energy.
5.3. Further Model Validation
Our modelling used South Australian data from 2016 to 2019, a period of significant change in its electricity grid. This period included the closure of all coal generation and gas additions and a transition to rooftop solar and battery storage [56]. Wind generation remained steady during this period, contributing 39.5% of energy generation [56]. Although coal is no longer present in the South Australian energy mix, the state still relies heavily on gas to support the network. This reliance is forecasted to reduce by 75–80% over the next ten years, attributed to the retirement of Torrens Island A and Osborne power stations [57]. We gathered forecasted supply and demand data for a grid dependent on VRE to improve the modelling. Initial estimates indicate that the grid demand will steadily decrease in South Australia, dependent on a balance between the adoption of rooftop PVs and the uptake of electric vehicles [58]. Wholesale electricity prices are forecasted to decrease; however, it is unclear to what degree retail consumers will benefit from these reductions due to the unpredictability of the supply [59].
Five min settlement (5MS) periods were introduced in October 2021 in Australia. 5MS period data differ from the data used in the modelling for 30 min settlement periods. This change provides greater accuracy for price signals, benefiting fast response technologies such as electrolysers and peaking plants. 5MS data can potentially increase revenues for these technologies by a factor of five due to their increased ability to harness spot price volatility [60]. Thus, factoring the shift to 5MSs would improve the accuracy of our model, though that is beyond the scope of this research.
5.4. System Interaction
The black system event in South Australia in September 2016 could have been avoided if a hydrogen peaking plant had been available. However, as shown in Figure 1, the system boundary used in this research is discrete, focussing on hydrogen production, storage, and re-electrification. Therefore, we have not considered each component’s intrinsic interactions within the electricity grid, including the interaction of government policy development, consumer choices, distribution networks, generators, substations, interconnectors, distribution lines, and associated infrastructure. These elements stay outside the scope of the research; however, further analyses or inclusions would help understand the system’s viability. The model does not consider future markets’ variable capacity but uses historical data to confirm the hypothesis. Holistic modelling would further understand how electricity generation instruments interact in the open market and the system operators’ requirements to deliver reliable, secure, affordable, and environmentally friendly electricity to the consumer. Given South Australia’s goal of being 100% renewable by 2030 [4] and the ongoing reduced reliance upon natural gas, further modelling needs to be undertaken to predict the likely supply and demand requirements for the coming decades, as well as the consideration of how the energy transformation is expected to impact the state’s electricity system.
Our results cannot conclude that the hydrogen peaking plant would have evaded the black system entirely. Furthermore, an accurate calculation of a hydrogen plant’s impact on overall system reliability would need complete grid data, which is beyond the scope of this report.
5.5. Risk and Opportunity
Key risks and opportunities for the plant’s financial viability revolve around revenue, highlighted in Figure 8, showing that this input significantly affects NPV. Conversely, this provides an opportunity as arbitrage was the sole revenue stream considered; however, the plant’s technical characteristics indicate that other sources of income exist [61]. These stem from the transmission system operators’ requirement to maintain system frequency within regional standards by altering the generation or demand to maintain balance (AEMO, 2015). The hydrogen system’s flexible characteristics enable quick-start and fast-load change services, positioning it as a strong candidate for participation in fast response stability markets. Efficiency in this process can be achieved through Monte Carlo simulation software such as Oracle’s Crystal-Ball [62].
Forecasting demands and potential competition (batteries, flexible demands, grid extensions, etc.) on the investigated markets are uncertain, creating a risk that our assumptions will prove less valid. What this could mean for our results is that the core assumptions should be revisited for future consideration, but the analysis structure should remain valid.
5.6. Model Limitations
One significant limitation of the research, which requires further investigation, is the storage part of the system. As shown in Section 4.2, underground salt caverns were chosen to store gaseous hydrogen in our theoretical model at a pressure of 250 bar. This assumption is based purely on cost implications (Table 4); however, further research could decide the vessel’s implications on hydrogen purity and the hydrogen’s impact on the local environment. Our investigation of this location shows it has easy access to renewable energy sources, access to water, and a distribution capacity. As discussed above, the ongoing development of hydrogen technology worldwide will decrease capital cost outlays for storage vessels. An opportunity lies within the market to develop a cost-effective storage mechanism for gaseous hydrogen.
This report faces limitations due to data availability constraints. As such, there are areas of research that require further investigation. Additionally, as hydrogen is new in the Australian electricity system, the assumptions and data used in this study will vary with increasing time; thus, these should be monitored to ensure the model’s validity and our established outcomes.
6. Conclusions
South Australia’s strong reliance on weather conditions to generate a sizable part of its energy and its lack of significant storage capacity has exposed its energy system. This paper’s techno-economic analysis suggests that PEM electrolysis technology can address these issues, enabling added generation and energy storage in low wind and solar PV availability. The energy for this would be during low-wholesale-price events. As of March 2023, the electricity prices are negative $A50 per MWhr in South Australia for 5–6 h daily. The results, influenced by aggregated historical prices and the demand and industry estimates for system capital and operational costs, show that PEM electrolysis technology in a large-scale re-electrification peaking system in South Australia will reach financial viability soon. Further research that we propose to be conducted includes the following:
- Government policy;
- Hydrogen storage at the proposed location;
- How fuel cells could further validate the re-electrification peaking system.
The South Australian government’s Hydrogen Action Plan [62] shows interest in hydrogen development. It aims to help investments, set up a world-class regulatory framework, deepen trade relationships, foster innovation, develop the workforce’s skill capabilities, and integrate hydrogen into its energy system.
Further investigation is needed to understand the relationship between the proposed system and the government. Funding or tax cuts can substantially affect the LCOE of hydrogen and the overall systems’ CAPEX and OPEX.
A key assumption is the existence and availability of underground aquifers within reasonable proximity to the proposed Port Augusta location. These aquifers are assumed to be of suitable size and without the need for significant refurbishment. Though there are existing studies on aquifers in this region, time constraints prohibited an in-depth analysis of their viability. We recommended that further research be undertaken if this proposal is adopted.
Hydrogen Fuel Cells can produce electricity from hydrogen via reverse electrolysis. The technology boasts high efficiency, emission-free power generation, and fast start-up and shutdown, especially compared to turbines [23]. We believe that fuel cells will have a significant role in the future viability and competitiveness of electricity production from hydrogen. We propose further research to be conducted to prove the exact potential of the technology in terms of capital and operating costs and provide extra power to the grid.
As hydrogen technology develops and matures, there will be reductions in capital and operating costs and an expansion in usability and capability. Section 4.2 shows the learning curve that we expect to see for hydrogen. A solid global uptake of the developing PEM electrolysis technology will drive the technology’s large-scale utilisation and consequent financial viability.
Author Contributions
Material preparation, data curation, writing, formal analysis, and investigation were performed by E.B., S.B., M.C. and T.W. in equal amounts. G.C. drafted the final manuscript and was involved in the conceptualisation and methodology and resource acquisition, and all authors commented on previous versions. All authors have read and agreed to the published version of the manuscript.
Funding
This research received no external funding.
Data Availability Statement
The data used in this study are available by contacting the corresponding author at glen.currie@climateworkscentre.org.
Acknowledgments
The authors thank the support of the Faculty of Engineering and Information Technology at the University of Melbourne in this research.
Conflicts of Interest
The authors declare that no funds, grants, or other support were received during the preparation of this manuscript. The authors have no relevant financial or non-financial interests to disclose.
Abbreviations
| AE | Alkaline Electrolysers |
| AEMC | Australian Energy Market Commission |
| AEMO | Australian Energy Market Operator |
| ARENA | The Australian Renewable Energy Agency |
| BCG | Brown Coal Gasification |
| CAPEX | Capital Expenditure |
| CCS | Carbon Capture and Storage |
| CSIRO | Commonwealth Scientific and Industrial Research Organisation |
| CF | Capacity Factor |
| GHG | Greenhouse Gas |
| GW | 1,000,000,000 watts—a unit of power |
| FCASs | Frequency Control Ancillary Services |
| IEA | International Energy Agency |
| IEEFA | Institute for Energy Economics and Financial Analysis |
| IRR | Internal Rate of Return |
| ktpa | kilo (1000) tonnes per annum |
| kW | 1000 watts—a unit of power |
| LCOE | Levelized Cost of Electricity |
| Mtpa | Mega (1,000,000) tonnes per annum |
| MW | 1,000,000 watts—a unit of power |
| MWh | 1,000,000 watts per hour—a unit of energy |
| NPV | Net Present Value |
| OPEX | Operational Expenditure |
| PAREP | Port Augusta Renewable Energy Park |
| PEM | Proton Exchange Membrane |
| PHS | Pumped Hydro Storage |
| PPA | Power Purchase Agreement |
| REZ | Renewable Energy Zone |
| RRP | Recommended Retail Price |
| SMR | Steam Methane Reforming |
| VRE | Variable Renewable Energy |
| WACC | Weighted Average Cost of Capital |
References
- Nelson, T.; Nelson, J.; Ariyaratnam, J.; Camroux, S. An analysis of Australia’s large scale renewable energy target: Restoring market confidence. Energy Policy 2013, 62, 386–400. [Google Scholar] [CrossRef]
- Byrnes, L.; Brown, C.; Foster, J.; Wagner, L.D. Australian renewable energy policy: Barriers and challenges. Renew. Energy 2013, 60, 711–721. [Google Scholar] [CrossRef]
- Gielen, D.; Boshell, F.; Saygin, D.; Bazilian, M.D.; Wagner, N.; Gorini, R. The role of renewable energy in the global energy transformation. Energy Strategy Rev. 2019, 24, 38–50. [Google Scholar] [CrossRef]
- Parkinson, G. South Australias Stunning Aim to be Net 100 Percent Renewables by 2030. Renew Economy. 2019. Available online: https://reneweconomy.com.au/south-australias-stunning-aim-to-be-net-100-per-cent-renewables-by-2030 (accessed on 26 January 2024).
- AEMO. Quarterly Energy Dynamics Q4 2023. Available online: https://aemo.com.au/-/media/files/major-publications/qed/2023/quarterly-energy-dynamics-q4-2023.pdf?la=en (accessed on 26 January 2024).
- Wood Mackenzie. Green Hydrogen Costs to Fall by Up to 64% by 2040. Available online: https://www.woodmac.com/press-releases/green-hydrogen-costs-to-fall-by-up-to-64-by-2040/ (accessed on 26 January 2024).
- Parkinson, G. Wind and Solar Average Stunning 87 Pct of South Australia’s Demand over Month of October. Available online: https://reneweconomy.com.au/wind-and-solar-meet-stunning-87-pct-of-south-australias-demand-over-month-of-october/ (accessed on 26 January 2024).
- Environment and Energy. Australian Energy Update 2019. Available online: https://www.energy.gov.au/sites/default/files/australian_energy_statistics_2019_energy_update_report_september.pdf (accessed on 26 January 2024).
- Parkinson, G. South Australia’s Stunning Renewable Energy Transition, and What Comes Next. Renew Economy. 2019. Available online: https://reneweconomy.com.au/south-australias-stunning-renewable-energy-transition-and-what-comes-next-79597/ (accessed on 26 January 2024).
- Government of South Australia, Hydrogen in South Australia. Available online: https://www.energymining.sa.gov.au/industry/modern-energy/hydrogen-in-south-australia (accessed on 26 January 2024).
- ARENA. Comparison of Dispatchable Renewable Electricity Options. 2018. Available online: https://arena.gov.au/assets/2018/10/Comparison-Of-Dispatchable-Renewable-Electricity-Options-ITP-et-al-for-ARENA-2018.pdf (accessed on 26 January 2024).
- Toscano, N. Huge Tesla Battery in South Australia Primed for Big Upgrade. Sydney Morning Herald. 2019. Available online: https://www.smh.com.au/business/companies/huge-tesla-battery-in-south-australia-primed-for-big-upgrade-20191119-p53byo.html (accessed on 26 January 2024).
- Kharel, S.; Shabani, B. Hydrogen as a long-term large-scale energy storage solution to support renewables. Energies 2018, 11, 2825. [Google Scholar] [CrossRef]
- Agency, N.E. Nuclear Energy and Renewables. 2012. Available online: https://www.oecd-nea.org/jcms/pl_14772#:~:text=While%20nuclear%20power%20has%20some,which%20is%20in%20limited%20supply (accessed on 26 January 2024).
- Agency, N.E. Nuclear Legislation in OECD and NEA Countries. Available online: https://www.oecd-nea.org/law/legislation/australia.pdf (accessed on 26 January 2024).
- Australian Gas Networks. About Natural Gas. 2020. Available online: https://www.australiangasnetworks.com.au/gas-explained/about-natural-gas (accessed on 26 January 2024).
- Scopelianos, S. Interconnector Proposal between SA and NSW to ‘Reduce Bills’. ABC. 2019. Available online: https://www.abc.net.au/news/2019-02-13/sa-nsw-electricity-interconnector-proposal-to-reduce-bills/10806376 (accessed on 26 January 2024).
- Warren, M. South Australian Blackouts: It’s not Black or White. Australian Energy Council. 2017. Available online: https://www.energycouncil.com.au/analysis/south-australias-blackouts-not-as-simple-as-it-looks/ (accessed on 26 January 2024).
- ARENA. Bioenergy. 2020. Available online: https://arena.gov.au/renewable-energy/bioenergy/ (accessed on 26 January 2024).
- Damman, S.; Sandberg, E.; Rosenberg, E.; Pisciella, P.; Graabak, I. A hybrid perspective on energy transition pathways: Is hydrogen the key for Norway? Energy Res. Soc. Sci. 2021, 78, 102116. [Google Scholar] [CrossRef]
- CSIRO. National Hydrogen Roadmap. Available online: https://www.csiro.au/en/Do-business/Futures/Reports/Energy-and-Resources/Hydrogen-Roadmap (accessed on 26 January 2024).
- Andersson, J.; Grönkvist, S. Large-scale storage of hydrogen. Int. J. Hydrog. Energy 2019, 44, 11901–11919. [Google Scholar] [CrossRef]
- Gerwen, R.V.; Eijgelaar, M.; Bosma, T. Hydrogen in the Electricity Value Chain. Available online: https://www.dnv.com/publications/hydrogen-in-the-electricity-value-chain-225850/ (accessed on 26 January 2024).
- GE-Power. What is a Gas Turbine and How Does It Work? Available online: https://www.ge.com/power/resources/knowledge-base/what-is-a-gas-turbine (accessed on 26 January 2024).
- KPMG. Hydrogen Communities and the H2 City Tool. In ARENA; 2019. Available online: https://arena.gov.au/knowledge-bank/hydrogen-communities/ (accessed on 26 January 2024).
- Locations, S.A. Hydrogen Potential. 2020. Available online: http://location.sa.gov.au/HydrogenPotential/ (accessed on 26 January 2024).
- AEMO. Aggregated Price and Demand Data. Available online: https://aemo.com.au/energy-systems/electricity/national-electricity-market-nem/data-nem/aggregated-data (accessed on 26 January 2024).
- Wagner, F.J.T.E.P.J.P. Surplus from and storage of electricity generated by intermittent sources. Eur. Physibal J. Plus 2016, 131, 445. [Google Scholar] [CrossRef]
- Rai, A.; Nunn, O. On the impact of increasing penetration of variable renewables on electricity spot price extremes in Australia. Econ. Anal. Policy 2020, 67, 67–86. [Google Scholar] [CrossRef]
- Becker, H.; Murawski, J.; Shinde, D.V.; Stephens, I.E.; Hinds, G.; Smith, G. Impact of impurities on water electrolysis: A review. Sustain. Energy Fuels 2023, 7, 1565–1603. [Google Scholar] [CrossRef]
- Vorrath, S. South Australia Sees “Doubling in Demand” for Its Low Cost Green Electricity. Available online: https://reneweconomy.com.au/south-australia-sees-doubling-in-demand-for-its-low-cost-green-electricity/ (accessed on 26 January 2024).
- AEMO. Appendix 3. Renewable Energy Zones. Available online: https://aemo.com.au/-/media/files/major-publications/isp/2022/2022-documents/a3-renewable-energy-zones.pdf?la=en (accessed on 26 January 2024).
- NEXIF. NEXIF Energy’s Lincoln Gap Project Remains on Track. NEXIF Energy: NEXIF Energy—Lincoln Gap Wind Farm. 2019. Available online: http://lincolngapwindfarm.com.au/news/nexif-energys-lincoln-gap-project-remains-on-track/ (accessed on 26 January 2024).
- Energy, D. DP Energy Receives Development Approval for the Port Augusta Renewable Energy Park. DP Energy. 2020. Available online: https://www.dpenergy.com/news/dp-energy-receives-development-approval-port-augusta-renewable-energy-park/ (accessed on 26 January 2024).
- Letcher, T.M. Storing Energy—With Special Reference to Renewable Energy Sources, 1st ed.; Letcher, T.M., Ed.; Elsevier: Amsterdam, The Netherlands, 2016; p. 590. [Google Scholar] [CrossRef]
- BOM. Australian Water Resources Assessment 2012. Available online: http://www.bom.gov.au/water/awra/2012/documents/southaustraliangulf-lr.pdf (accessed on 26 January 2024).
- Macdonald-Smith, A.A.E.S. Alinta Energy to shut Port Augusta Power Plants Amid Lossess on Supply Glut. Available online: https://www.smh.com.au/business/alinta-energy-to-shut-port-augusta-power-plants-amid-losses-on-supply-glut-20150611-ghlap3.html (accessed on 26 January 2024).
- Gorre, J.; Ortloff, F.; van Leeuwen, C. Production costs for synthetic methane in 2030 and 2050 of an optimized Power-to-Gas plant with intermediate hydrogen storage. Appl. Energy 2019, 253, 113594. [Google Scholar] [CrossRef]
- Shiva Kumar, S.; Himabindu, V. Hydrogen production by PEM water electrolysis—A review. Mater. Sci. Energy Technol. 2019, 2, 442–454. [Google Scholar] [CrossRef]
- Parra, D.; Patel, M.K. Techno-economic implications of the electrolyser technology and size for power-to-gas systems. Int. J. Hydrog. Energy 2016, 41, 3748–3761. [Google Scholar] [CrossRef]
- Nguyen, T.; Abdin, Z.; Holm, T.; Mérida, W. Grid-connected hydrogen production via large-scale water electrolysis. Energy Convers. Manag. 2019, 200, 112108. Available online: https://www.sciencedirect.com/science/article/pii/S0196890419311148 (accessed on 26 January 2024).
- Wanjiku, J.; Khan, M.; Barendse, P.; Sebitosi, A. Analytical Sizing of an Electrolyser for a Small Scale Wind Electrolysis Plant. In Proceedings of the IEEE International Energy Conference, Manama, Bahrain, 18–21 December 2010; pp. 10–15. [Google Scholar] [CrossRef]
- Chiesa, P.; Lozza, G.; Mazzocchi, L. Using Hydrogen as Gas Turbine Fuel. J. Eng. Gas Turbines Power 2005, 127, 73–80. [Google Scholar] [CrossRef]
- Advisian. South Australian Green Hydrogen Study. 2017. Available online: http://www.renewablessa.sa.gov.au/topic/hydrogen (accessed on 26 January 2024).
- Anderson, D.; Leach, M. Harvesting and redistributing renewable energy: On the role of gas and electricity grids to overcome intermittency through the generation and storage of hydrogen. Energy Policy 2004, 32, 1603–1614. [Google Scholar] [CrossRef]
- Finkel, A.; Moses, K.; Munro, C.; Effeney, T.; O’Kane, M. Independent Review into the Future Security of the National Electricity Market; Department of the Environment and Energy, Government of Australia, 2017. Available online: https://www.dcceew.gov.au/energy/markets/independent-review-future-security-nem (accessed on 26 January 2024).
- Cutler, N.J.; Boerema, N.D.; MacGill, I.F.; Outhred, H.R. High penetration wind generation impacts on spot prices in the Australian national electricity market. Energy Policy 2011, 39, 5939–5949. [Google Scholar] [CrossRef]
- Kirschen, D.S. Demand-side view of electricity markets. IEEE Trans. Power Syst. 2003, 18, 520–527. [Google Scholar] [CrossRef]
- Holladay, J.D.; Hu, J.; King, D.L.; Wang, Y.J.C.t. An overview of hydrogen production technologies. Catalysis Today 2009, 139, 244–260. [Google Scholar] [CrossRef]
- Thomas, D. Large Scale PEM Electrolysis: Technology Status and Upscaling Strategies. 2019. Available online: http://hybalance.eu/wp-content/uploads/2019/10/Large-scale-PEM-electrolysis.pdf (accessed on 26 January 2024).
- Kruck, O.; Crotogino, F.; Prelicz, R.; Rudolph, T. Overview on All Known Underground Storage Technologies for Hydrogen. 2016. Available online: https://hyunder.eu/wp-content/uploads/2016/01/D3.1_Overview-of-all-known-underground-storage-technologies.pdf (accessed on 26 January 2024).
- Mayyas, A.; Wei, M.; Levis, G. Hydrogen as a long-term, large-scale energy storage solution when coupled with renewable energy sources or grids with dynamic electricity pricing schemes. Int. J. Hydrog. Energy 2020, 45, 16311–16325. [Google Scholar] [CrossRef]
- Clean Energy Council. Energy Security in Australia. 2024. Available online: https://www.cleanenergycouncil.org.au/advocacy-initiatives/energy-transformation/energy-security (accessed on 26 January 2024).
- AEMC. Priority Area: Power System Security. 2020. Available online: https://www.aemc.gov.au/our-work/our-forward-looking-work-program/power-system-security#:~:text=System%20security%20relates%20to%20the,frequency%20can%20cause%20widespread%20blackouts (accessed on 26 January 2024).
- AEMO. Black System South Australia 28 September 2016 Final Report. 2017. Available online: https://www.aemo.com.au/-/media/Files/Electricity/NEM/Market_Notices_and_Events/Power_System_Incident_Reports/2017/Integrated-Final-Report-SA-Black-System-28-September-2016.pdf (accessed on 26 January 2024).
- AEMO. South Australian Generation Forecasts. 2020. Available online: https://aemo.com.au/energy-systems/electricity/national-electricity-market-nem/nem-forecasting-and-planning/south-australian-advisory-functions (accessed on 26 January 2024).
- AEMO. 2020 Electricity Statement of Opportunities. 2020. Available online: https://aemo.com.au/en/energy-systems/electricity/national-electricity-market-nem/nem-forecasting-and-planning/forecasting-and-reliability/nem-electricity-statement-of-opportunities-esoo (accessed on 26 January 2024).
- Cludius, J.; Forrest, S.; MacGill, I. Distributional effects of the Australian Renewable Energy Target (RET) through wholesale and retail electricity price impacts. Energy Policy 2014, 71, 40–51. [Google Scholar] [CrossRef]
- McConnell, D. Value of aligning dispatch and settlement. The University of Melbourne. Journal contribution. 2016. Available online: https://melbourne.figshare.com/articles/journal_contribution/Value_of_aligning_dispatch_and_settlement/4264970 (accessed on 26 January 2024). [CrossRef]
- Genoese, F.; Genoese, M. Assessing the value of storage in a future energy system with a high share of renewable electricity generation. Energy Syst. 2014, 5, 19–44. [Google Scholar] [CrossRef]
- Gonzalez, A.G.; Herrador, M.A.; Asuero, A.G. Uncertainty evaluation from Monte-Carlo simulations by using Crystal-Ball software. Accredit. Qual. Assur. 2005, 10, 149–154. [Google Scholar] [CrossRef]
- Government of South Australia. South Australia’s Hydrogen Action Plan. 2019. Available online: http://www.renewablessa.sa.gov.au/topic/hydrogen/hydrogen-action-plan (accessed on 26 January 2024).

Disclaimer/Publisher’s Note: The statements, opinions and data contained in all publications are solely those of the individual author(s) and contributor(s) and not of MDPI and/or the editor(s). MDPI and/or the editor(s) disclaim responsibility for any injury to people or property resulting from any ideas, methods, instructions or products referred to in the content. |
© 2024 by the authors. Licensee MDPI, Basel, Switzerland. This article is an open access article distributed under the terms and conditions of the Creative Commons Attribution (CC BY) license (https://creativecommons.org/licenses/by/4.0/).